Article

Development of a Fuel Model for Cistus spp. and Testing Its Fire Behavior Prediction Performance

by
Miltiadis Athanasiou
1,*,
Aristotelis Martinis
2,
Evangelia Korakaki
3 and
Evangelia V. Avramidou
4
1
Wildfire Management Consulting and Training, 8 Thoma Paleologou St., 13673 Athens, Greece
2
Department of Environment, Ionian University, M. Minotou-Giannopoulou St., 29100 Zakynthos, Greece
3
Laboratory of Tree Physiology, Institute of Mediterranean Forest Ecosystems, ELGO-DIMITRA, Terma Alkmanos, Ilisia, 11528 Athens, Greece
4
Laboratory of Forest Genetics and Biotechnology, Institute of Mediterranean Forest Ecosystems, ELGO-DIMITRA, Terma Alkmanos, Ilisia, 11528 Athens, Greece
*
Author to whom correspondence should be addressed.
Fire 2023, 6(7), 247; https://doi.org/10.3390/fire6070247
Submission received: 29 April 2023 / Revised: 15 June 2023 / Accepted: 21 June 2023 / Published: 25 June 2023

Abstract

:
This paper presents the development of a fuel model that can describe fuel situations in areas dominated by Cistus spp. (rockrose) in Greece. In order to obtain the necessary fuel data, thirty (30) 1 m2 plots were destructively sampled in phryganic areas dominated by Cistus creticus, Cistus parviflorus, and Cistus salvifolius in western Greece. To develop the fuel model for Cistus spp., field measurements were supplemented with published parameter values for Cistus salvifolius. The resulting fuel model (with a height of 9.44 cm) is suitable for describing Cistus spp.-dominated phryganic areas of relatively low vegetation height in southeastern Europe. Once developed, the fuel model was inputted into the BehavePlus system to produce surface fire rate of spread predictions (ROSpred, m·min−1), which were then compared to 21 surface fire ROS field observations (ROSobs) obtained from wildfires or prescribed burns in areas covered by Cistus spp. It was found that the ROS for the Cistus spp. fuel model significantly underpredicted the actual ROS. A statistically significant linear regression equation was developed to mathematically describe the relationship between the predicted and observed ROS. This equation can be used to adjust BehavePlus predictions to more accurately reflect the real-world fire behavior for this fuel type.

1. Introduction

Reliable forest fire behavior prediction and relatively accurate quantitative estimates of potential wildland fire rate of spread (ROS, m·min−1) and flame length (L, m), which is the main visual manifestation [1] of fire line intensity (I, kW·m−1) [2], support effective wildfire management. Predictions and estimates of ROS and L can either be based on the experience of fire practitioners and managers or on models included in software systems. Fire behavior models, the core of fire behavior prediction software systems, can be adopted in forest management, fire prevention, and suppression only if their degree of reliability, strengths, and weaknesses are well known [3].
The most popular and robust fire behavior model for predicting ROS in surface fuels globally is Rothermel’s [4] mathematical model, mainly due to its good documentation, practicality, and significant number of studies that tested its prediction performance for various fuel types. Its strengths and weaknesses are quite well known [5,6] due to the extensive testing that has taken place (i) in the laboratory, (ii) in experimental field burns, and (iii) in actual wildfires of low to medium intensity [7,8,9] or of high intensity [10,11]. Rothermel’s model is the core component of the BehavePlus fire behavior modeling system [12,13] and of various wildfire spread simulation systems [14] such as the two-dimensional deterministic fire growth model FARSITE [15,16,17], which is now included in the FlamMap system [17].
In the years that passed since the first publication of Rothermel’s model, which has a semi-empirical basis, there have been numerous efforts to improve it [13,18]. It has received significant scrutiny and a number of improvements have been adopted in practice, as listed by Andrews [6]. While Rothermel’s model maintained a prominent position in fire behavior modeling around the world, many other empirical modeling efforts have tried to improve simplicity [19,20,21] or achieve a better representation of local conditions [22,23,24]. Obviously, during this time, there have also been many efforts to develop more advanced physically based models [25,26,27,28,29], including models that take into consideration the interaction of fire with the atmosphere [30].
Examples of coupled atmosphere–fire models include CAWFE (Coupled Atmosphere–Wildland Fire Environment, [31]), two related models based on the WRF (Weather Research and Forecasting) atmospheric model, WRF-Fire [32] and WRF-SFire [33], and Meso-NH/ForeFire [34], which is a coupling of the non-hydrostatic mesoscale atmospheric model Meso-NH with a one-dimensional fire spread model ForeFire [35].
BehavePlus, although first launched as BEHAVE in 1984, is still widely used around the world, not only because it is well documented, tested, and free to use, but also because Rothermel’s model requires fuel as an external input in the form of a fuel model. Thus, it can be applied anywhere in the world provided that an appropriate fuel description, a fuel model, is available. This makes BehavePlus a flexible, non-spatial system that provides a quick and easy way to assess potential fire behavior through its ‘point-based’ fire modeling approach.
From its first edition, the BEHAVE system facilitated the development of custom fuel models [36] that can be site specific. A fuel model is described as a set of average values of specific parameters that describe a particular type of vegetation in the form that is required to be used with Rothermel’s model and, accordingly, with the BehavePlus system. Each such stylized fuel model consists of 11 average values [36,37].
The calculation of the surface fire rate of spread requires (i) a fuel model, (ii) midflame wind speed [38], (iii) slope (%), and (iv) fuel moisture content (FMC, %) [13]. In BehavePlus, midflame wind speed is the average wind speed from 1.5 to 3 ft above the ground [39]. It is the wind that affects surface fire spread and it is customary to describe it as the eye level wind speed. A user may specify values for midflame wind speed by either adjusting 6.1 m (20 ft) wind to midflame height or by skipping that step using a handheld anemometer. The wind speed at a 6.1 m (20 ft) height is either measured or estimated by reducing the 10 m height wind speed accordingly [39,40,41,42].
Dimitrakopoulos [43,44] developed several fuel models to describe Mediterranean fuel types in Greece. Later testing with fire behavior observations in real fires demonstrated that BehavePlus can be a useful tool for predictions of surface wildfire ROS in tall and short maquis, phryganic areas where the dominant species is Sarcopoterium spinosum, and grass [45].
Phryganic areas in Greece are covered by “phrygana”, a vegetation quite similar to “coastal sage” in California, “tomilares” in Spain, and “batha” in Israel. Phrygana are low xeric and mostly spiny shrubs. They occupy areas towards the dry end of the precipitation gradient of the Mediterranean climate [46] and correspond to relatively heterogeneous fuel situations, usually including a variable percentage of phryganic species such as Sarcopoterium spinosum, Phlomis fruticosa, and Cistus spp. (Cistus creticus, Cistus parviflorus, Cistus salvifolius, and Coridothymus capitatus). They are pyrophytes, obligate seeders, and among the first shrubs to emerge after fire [47].
The current work had two main objectives. The first was to develop a fuel model for the most common species of Cistus in Greece (Cistus creticus, Cistus parviflorus, and Cistus salvifolius), also known by the common name of “rockroses”, since they form a widespread vegetation type. They usually cover burned areas in the years immediately after a wildfire or occupy openings in low-altitude pine forests (e.g., Aleppo pine (Pinus halepensis) or Calabrian pine (Pinus brutia)).
A fuel model representing such a fuel type can be utilized to describe phryganic areas of relatively low height in Greece and probably other countries of southeastern Europe where Cistus spp. phryganic lands are abundant.
The second objective of the paper was to examine whether the developed model can be used reliably to predict fire behavior in Cistus spp. phryganic lands. Surface fire ROS field observations, obtained in wildfires or prescribed burns (ROSobs), in areas covered by Cistus spp. in Greece, were utilized to evaluate the degree of agreement of BehavePlus predictions (ROSpred) with observed fire behavior for the developed Cistus spp. fuel model, to introduce adjustments if needed, and ultimately to contribute towards better fire behavior prediction in the phryganic lands of Greece.

2. Materials and Methods

The methods described in [48,49] were utilized to develop the Cistus spp. fuel model. The work was based on destructive fuel sampling and took place on Zakynthos island, western Greece, in the month of July (Figure 1).
The sampling sites were selected based on discussions with local forest service officers followed by obtaining a record of the significant wildfires that had taken place on the island in the last five years. Such sites are covered by Cistus spp. immediately after the fires, which acts as a soil stabilizer and shade provider, helping the establishment and survival of other species such as pines. Thus, for the first post-fire years, the sites are occupied by Cistus spp. [50] with a coverage that often exceeds 80%. It is later reduced when other resprouting shrubs and pine seedlings grow and occupy the site. Following the leads and data from the forest service, extensive on-site visits to these recently burned areas across all of the western part of the island (Figure 1) offered a good overview of Cistus spp.-covered sites in terms of vegetation height, structure, and density. By visually assessing the relatively small existing differences, it was possible to select a series of representative Cistus spp. sites to cover all of this variation.
At each sampling site, visually assessed as homogeneously covered by Cistus spp., an initial representative point was selected. Aiming to avoid any bias due to the selection of this specific point, the exact location for destructive sampling was determined by carrying out a draw to define an azimuth. The next step was to walk in the azimuth direction and place a 2 m pole 30 m from the initial point (at the end of the randomly positioned transect, traced by a measuring tape). A camera was then placed on a tripod 1.6 m tall, at the 24 m mark of the tape, looking towards the pole, and the sampling site was documented before the start of the destructive sampling (Figure 2a,b,d).
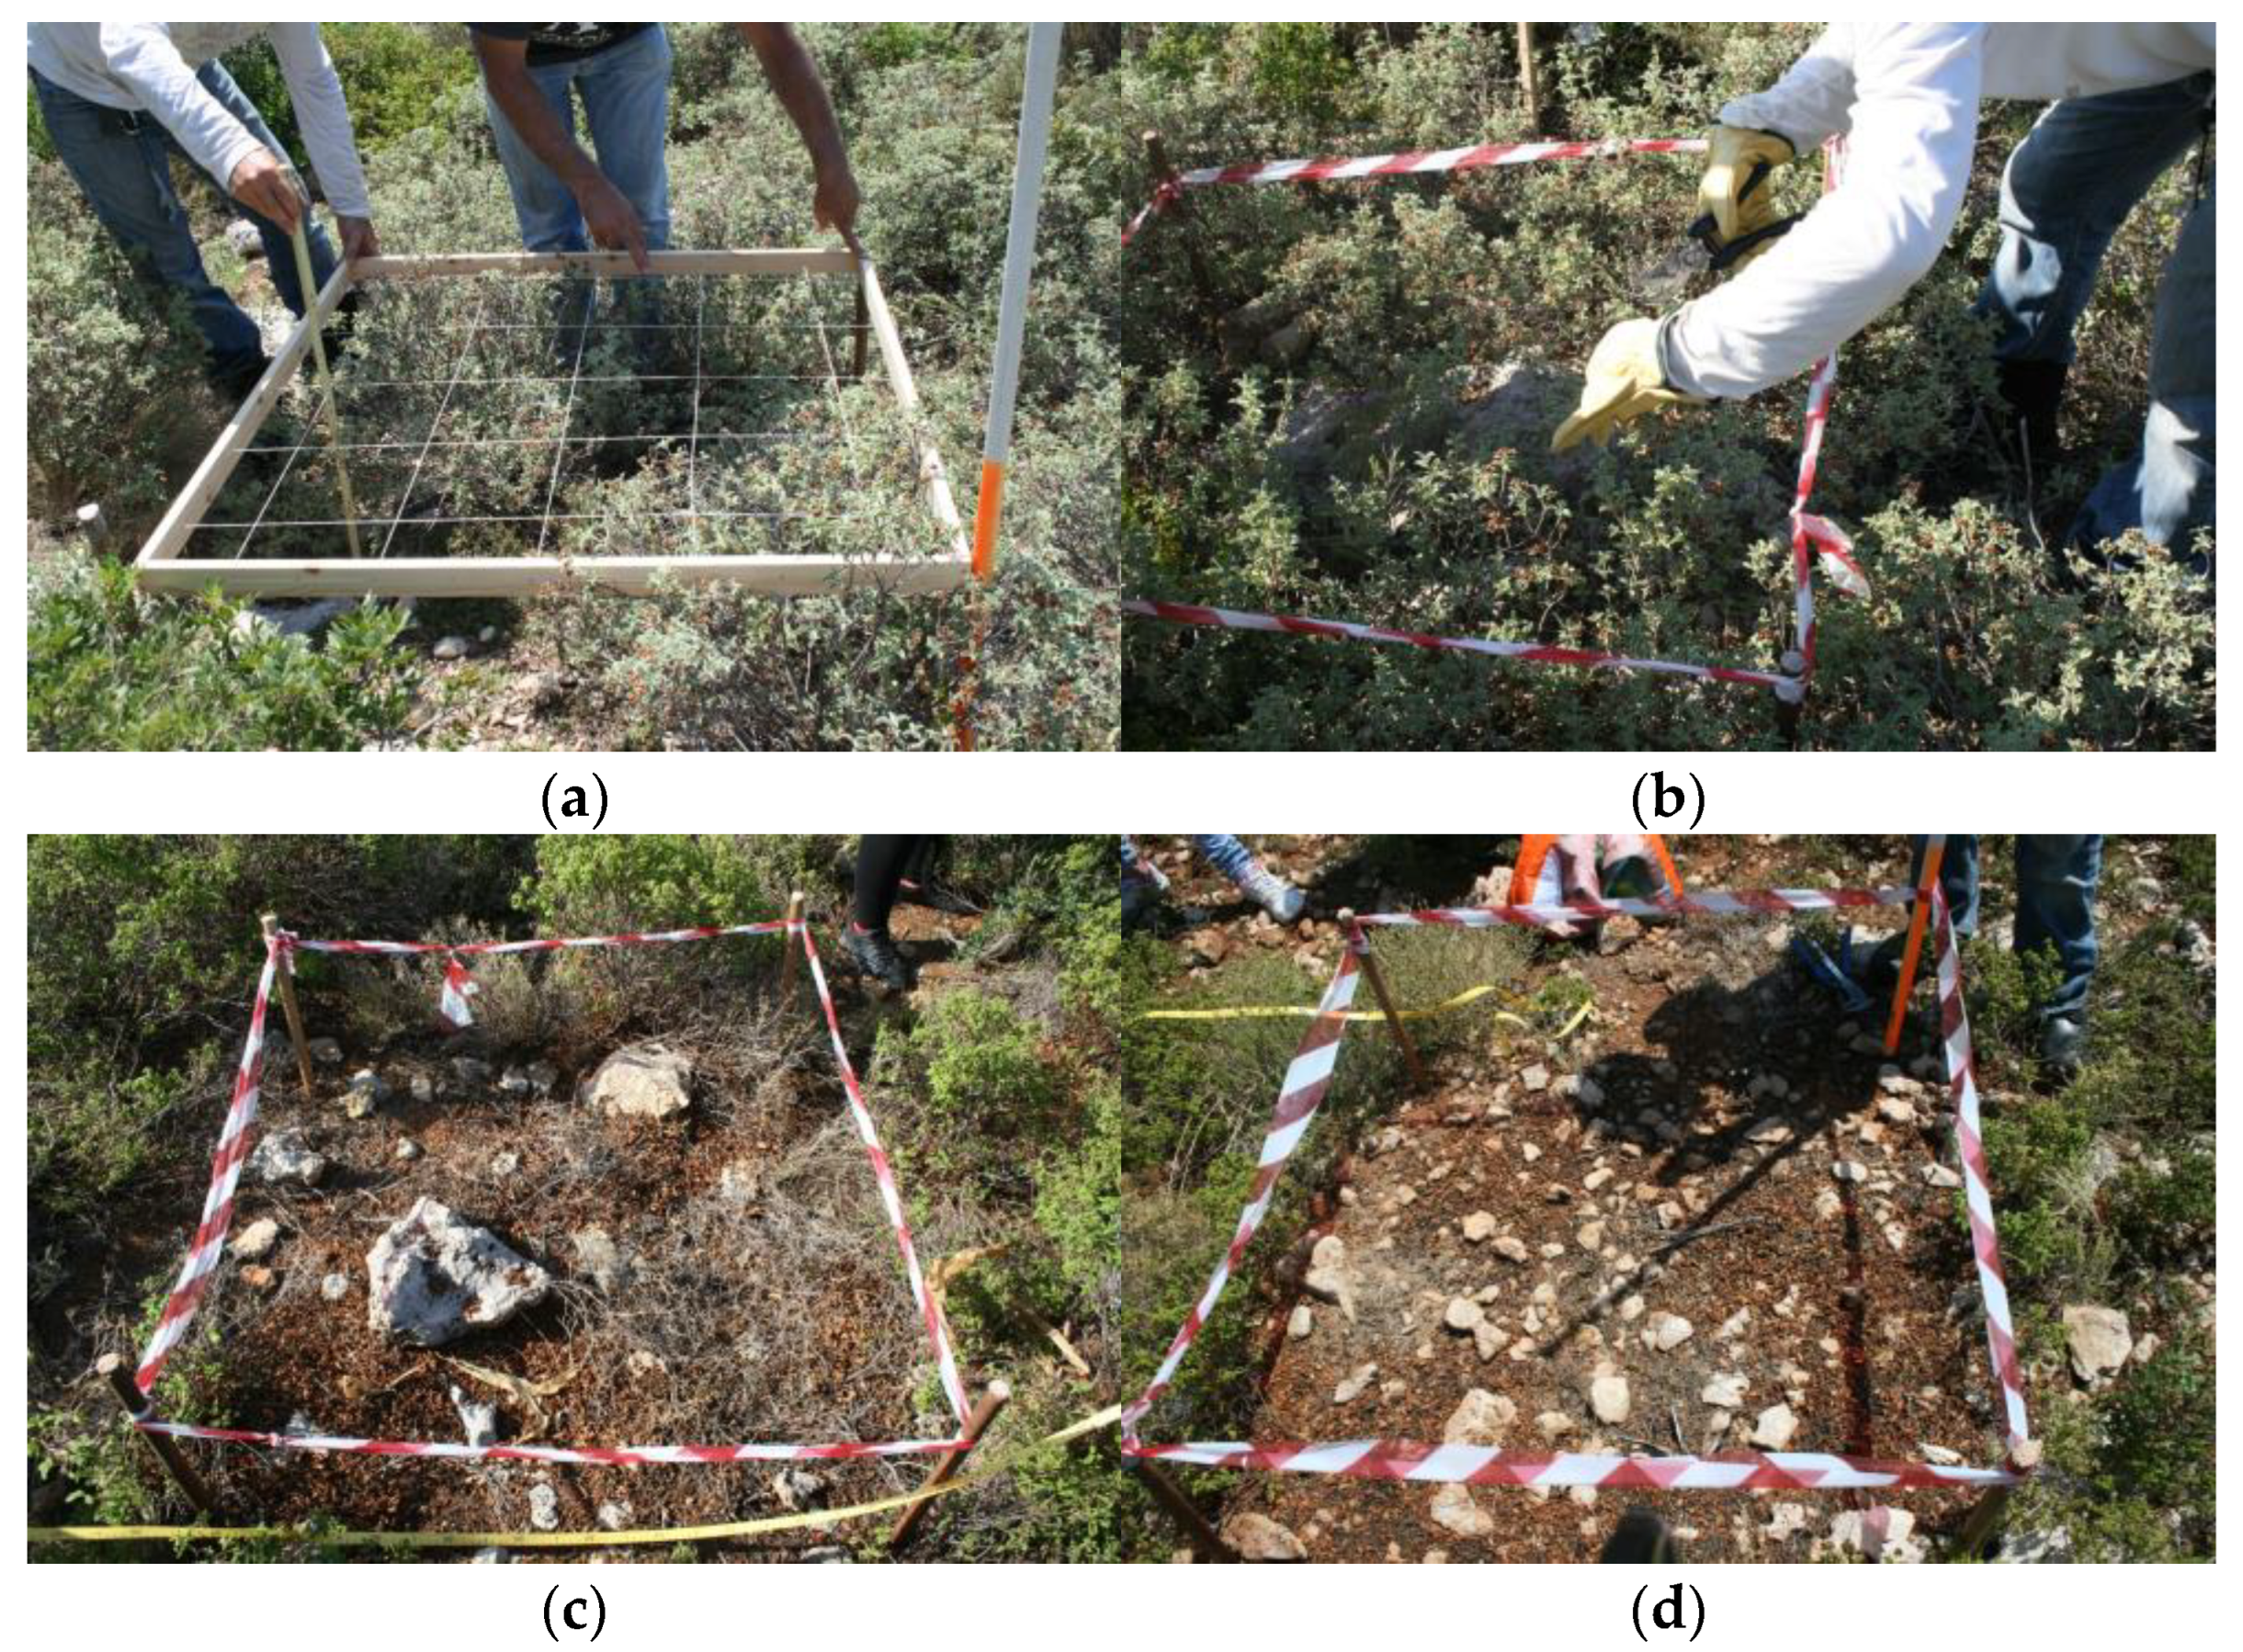
Next, three plots, defined by 1 × 1 m wooden frames, were placed at 1 m intervals along the right side of the transect, starting at the 25 m mark (i.e., at 25–26, 27–28, and 29–30 m points). Within the 1 m2 frames, there were five strings every 20 cm crossed by five perpendicular strings every 20 cm also, specifying 25 cross-points inside the frame. The vegetation height was measured at those 25 predetermined points within the plot (Figure 2c and Figure 3a). A value of zero was noted when there was no vegetation under each of these 25 points. The average of the 25 measurements allowed the calculation of a mean height value for the plot (SHRHGT, cm).
The vegetation cover (SHRCOV, %) was calculated by dividing the number of non-zero values by 25 and multiplying by 100. For example, if there were five points where there was no shrub vegetation (i.e., with height values equal to zero), the SHRCOV of the plot was calculated as 80%. All live and dead fuels within the plots were cut, collected, and weighed to calculate fuel loading (kg·m−2) and to obtain information on the distribution of the live and dead fuels’ size classes (Table 1) that is needed for fuel modeling (Table 2).
By using a go/no-go gauge [48], the live and dead fuels were separated according to size (diameter) classes and their wet weight was weighed in situ with a portable electronic scale with a precision of 0.1 g. Regarding live fuels, the first class with a diameter up to 0.64 cm included foliage and twigs. A second class included twigs with a diameter from 0.64 to 2.54 cm. Due to the type of vegetation (Cistus spp.-dominated phryganic fields), there was no thicker live vegetation.
After the live fuel classes were removed from the plot, the dead fuels were also collected and weighed in size classes. The first class included the 1-hr time lag fuels (dead twigs with a diameter up to 0.64 cm, litter, and, in a few cases, dead grass). The second class included the 10-hr dead woody fuels with a diameter from 0.64 to 2.54 cm, and the third class included the 100-hr fuels with a diameter from 2.54 to 7.62 cm. This dead fuel class was only found in one plot and was a branch of Phillyrea latifolia.
The dead fuel size classes are used as moisture time lag standards in the US National Fire-Danger Rating System [51]. A moisture time lag is the length of time for a substance to lose or gain approximately two-thirds of the moisture above or below its equilibrium moisture [48].
Finally, the total oven-dry fuel loading (TFL, kg·m−2) was calculated by summing up the oven-dry fuel loadings of all fuel size classes. Twenty-one measurements of ROSobs made in the field (Table 3) during the evolution of wildfires [45] and prescribed burns [52], in areas covered by Cistus spp. in Greece, were utilized to evaluate the degree of agreement of BehavePlus predictions for the developed Cistus spp. fuel model with observed fire behavior.
Predictions of ROS for the Cistus spp. fuel model (ROSpred) were compared with ROS observations (ROSobs) in Cistus spp. dominated phryganic areas in Greece. These 21 fire behavior observations (ROSobs) were matched with the related meteorological, topography, and forest fuel information following specific procedures [3,10,52]. The ROSobs (m·min−1) were calculated by tracking wildfire perimeters and knowing the exact time for fire head, flank, or heel location and by using GIS software, using the following steps: The observer’s positions were identified using a GPS device and the geographic coordinates were recorded. Regarding ground photography shooting, photographs of the sequential locations of the fire perimeter were taken using a Canon EOS 70D DSLR camera. For all shots, the horizontal azimuths were recorded using a compass.
Later, in the office, the fire perimeter (head, flank, or heel) locations were pinpointed on the map using the ArcGIS 9.3 Geographic Information System (GIS) software by ESRI. The time each photo was captured was identified from the data recorded automatically by the camera on the digital photo file that was in JPG format. By knowing the exact time for every fire perimeter location [1], the ROSobs values were calculated. Regarding prescribed burning ROSobs data, the recording of fire behavior additionally included aerial photographs that were taken from unmanned aerial vehicles (UAVs) [52]. We used a DJI Phantom 4 Pro, since it provides wind resistance up to 10 m/sec, more than 20 min of autonomous flight per battery, and carries an 1’’ CMOS, 20 Mp sensor, with FOV 84° 8.8 mm/24 mm (35 mm format equivalent) f/2.8–f/11 auto focus at 1 m-∞ lens and a mechanical/electronic shutter speed of 8–1/2000 sec. Images were created in JPEG format of 5472 × 3648 pixels.

3. Results

The number of sampling locations reached 10, so, with 3 plots per location, there were 30 sampling plots in total. According to the visual assessments in those 30 sampling plots, the phryganic areas were composed of 35% Cistus creticus, 29% Cistus parviflorus, 9% Cistus salvifolius, and 7% Coridothymus capitatus. The descriptive statistics of the dataset of 30 sampling plots regarding (a) total oven-dry fuel loading (TFL, kg·m−2) and oven-dry fuel loadings of the live and dead fuel classes, (b) vegetation height (SHRHGT, cm) and (c) vegetation cover (SHRCOV, %) are presented in Table 1.
As shown in Table 1, the sampling plots were in phryganic areas of relatively low vegetation height and varying cover. The mean and median values of SHRHGT were equal to 21 cm, while those of SHRCOV were equal to 80%. The variance of TFL was 0.155 and its mean value 0.74 kg m−2, so for a maximum acceptable deviation equal to 20% of the mean value (0.148 kg m−2) and a confidence level of 95%, the required sample size is N = 27, which is smaller than the actual number of sampling plots (N = 30).
The development of the Cistus spp. fuel model started by utilizing some important observations regarding the attributes of the fuel type. The fuel loading of the live fuels with a diameter from 0.64 to 2.54 cm was less than 15% of the total live fuel loading. As nearly all of this loading was quite fine, closer to 0.64 than to 2.54, as observed by using a go/no-go gauge during destructive sampling, it was added to the class of the live fuels with a diameter up to 0.64 cm. This class of live fuels is the “Live Woody” (LW) parameter of the fuel model. According to the field observations of the first author, in actual fires spreading through phryganic areas, the stems of Cistus spp. that are a little thicker than 0.64, as a rule, are completely consumed by the flames, contributing to the overall fire behavior, thus fully justifying the decision to include them in the LW category together with the finer live fuels. Omitting live fuel thicker than 0.64 cm, while it is clear that it is burned during the passage of the fire front, would result in an obvious underestimation of the true fuel loading.
Regarding the development of the fuel model, in addition to the measured parameters, it is necessary to determine a number of additional ones, namely, the surface area-to-volume ratio (SA/V, cm2·cm−3) of 1-hr fuels, the SA/V of ‘Live Herbaceous’ vegetation and the SA/V of the LW, the fuel heat content (kJ·kg−1), the fuel bed depth (cm), and the moisture of extinction (%) which is the moisture content value of the dead fuels at which the fire stops spreading [36].
For LW fuels SA/V, the value of 30 cm2·cm−3 was adopted as an approximate weighted average of the value of 44.49 cm2·cm−3 measured by Dimitrakopoulos [43] for Cistus salvifolius leaves, 23.01 cm2·cm−3 for live twigs with a diameter less than 0.64 cm diameter, and 8.09 cm2·cm−3 for live twigs with a diameter from 0.64 to 2.54 cm.
Live fine herbaceous vegetation was not found during the destructive sampling; therefore, an SA/V value was not specified for that parameter. For fine dead (1-hr) fuels, the value of 23.46 cm2·cm−3 measured by [43] for thin dead twigs of Cistus salvifolius was adopted. For the fuel heat content, the value of 19.046 kJ/kg reported by [43] for Cistus salvifolius was adopted.
The above-mentioned data were processed through the NEWMDL subsystem of BEHAVE [36] to develop the Cistus spp. fuel model. Moreover, a weighted value for the fuel bed depth and a value for the moisture of extinction, which is very difficult to measure in practice, were then calculated. Typical photos of Cistus spp.-dominated phryganic fields of various height and cover are shown in Figure 2 and the values of the Cistus spp. fuel model’s parameters are presented in Table 2. They include values of SA/V for the 10-hr and 100-hr fuels adopted by default by BEHAVE [36].
Twenty-one measurements of ROSobs made in the field (Table 3) during the evolution of wildfires and prescribed burns, in areas covered by Cistus spp. in Greece, were utilized to evaluate the degree of agreement of BehavePlus predictions for the Cistus spp. fuel model with the observed fire behavior. The Cistus spp. fuel model (Table 2) and measurements of the dead and live woody fuels’ moisture content (FMC), slope, and midflame windspeed (Table 3) were used as input for predicting the surface fire rate of spread (ROSpred, m·min−1) values with BehavePlus.
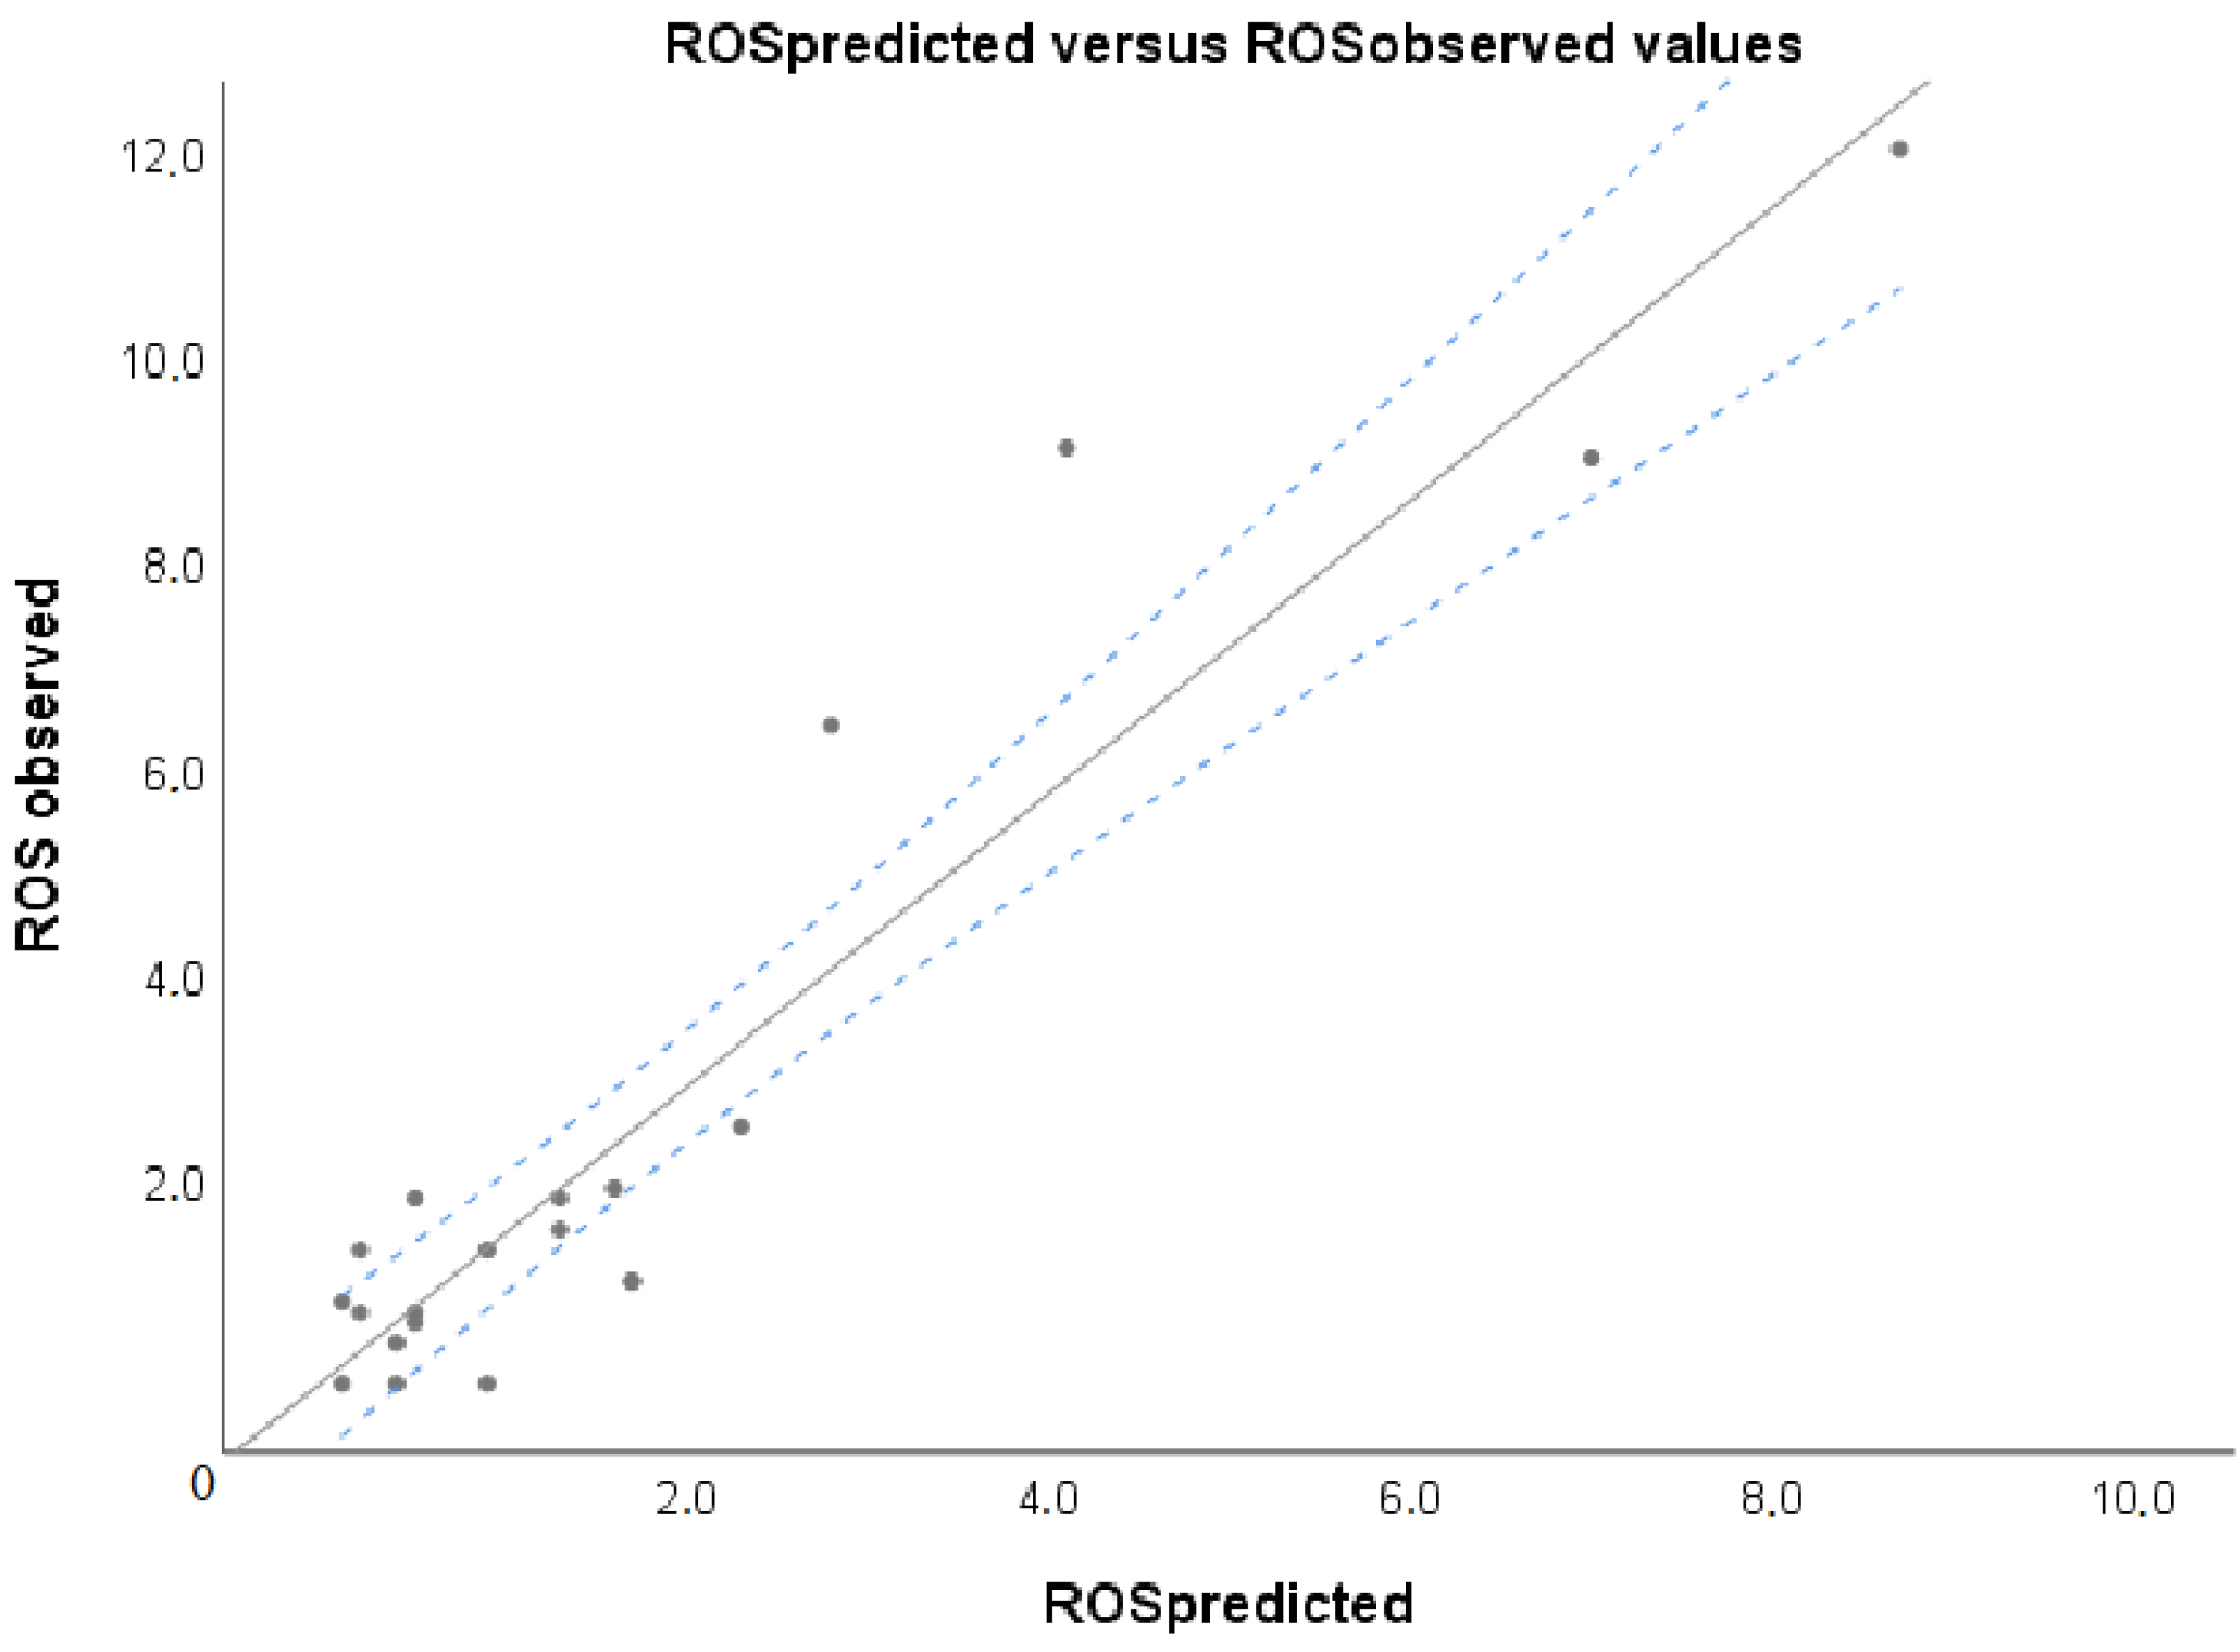
The pairs of ROSobs and ROSpred values were correlated via linear regression, resulting in Equation (1), with an adjusted R2 = 0.879. The plot of Equation (1), including the 95% confidence interval (blue dotted lines), is shown in Figure 4.
ROSobs = 0.037 + 1.425 · ROSpred ,
Equation (1) is statistically significant (p < 0.001). The 95% confidence interval for the regression is [1.12, 4.00]. The p-value of the slope coefficient is also statistically significant (p < 0.001) and its 95% confidence interval is [1.179, 1.672]. The p-value of the constant of Equation (1) is not statistically significant (p-value = 0.914). The adjusted R2 value of the regression of Equation (1) indicates that its unexplained error is relatively low.

4. Discussion

The regression equation for the prediction of ROSobs values from BehavePlus ROSpred values is statistically significant and has a good adjusted R2 value. The value of the slope coefficient is equal to 1.425. The fact that the 95% confidence interval is 1.179 to 1.672, and does not include the value of 1, means that the BehavePlus ROSpred under-predicts the actual rate of spread. This under-prediction should be taken into consideration when using BehavePlus with the Cistus spp. fuel model for ROS prediction in phryganic areas.
On the other hand, the constant of the equation is not statistically significant (p = 0.914). This means that the intercept can be considered equal to zero. However, in the statistical interpretation, the value of the intercept of 0.037 m min−1 is almost equal to 0, and Equation (1) can be used for all practical purposes. This is also evident in Figure 4.
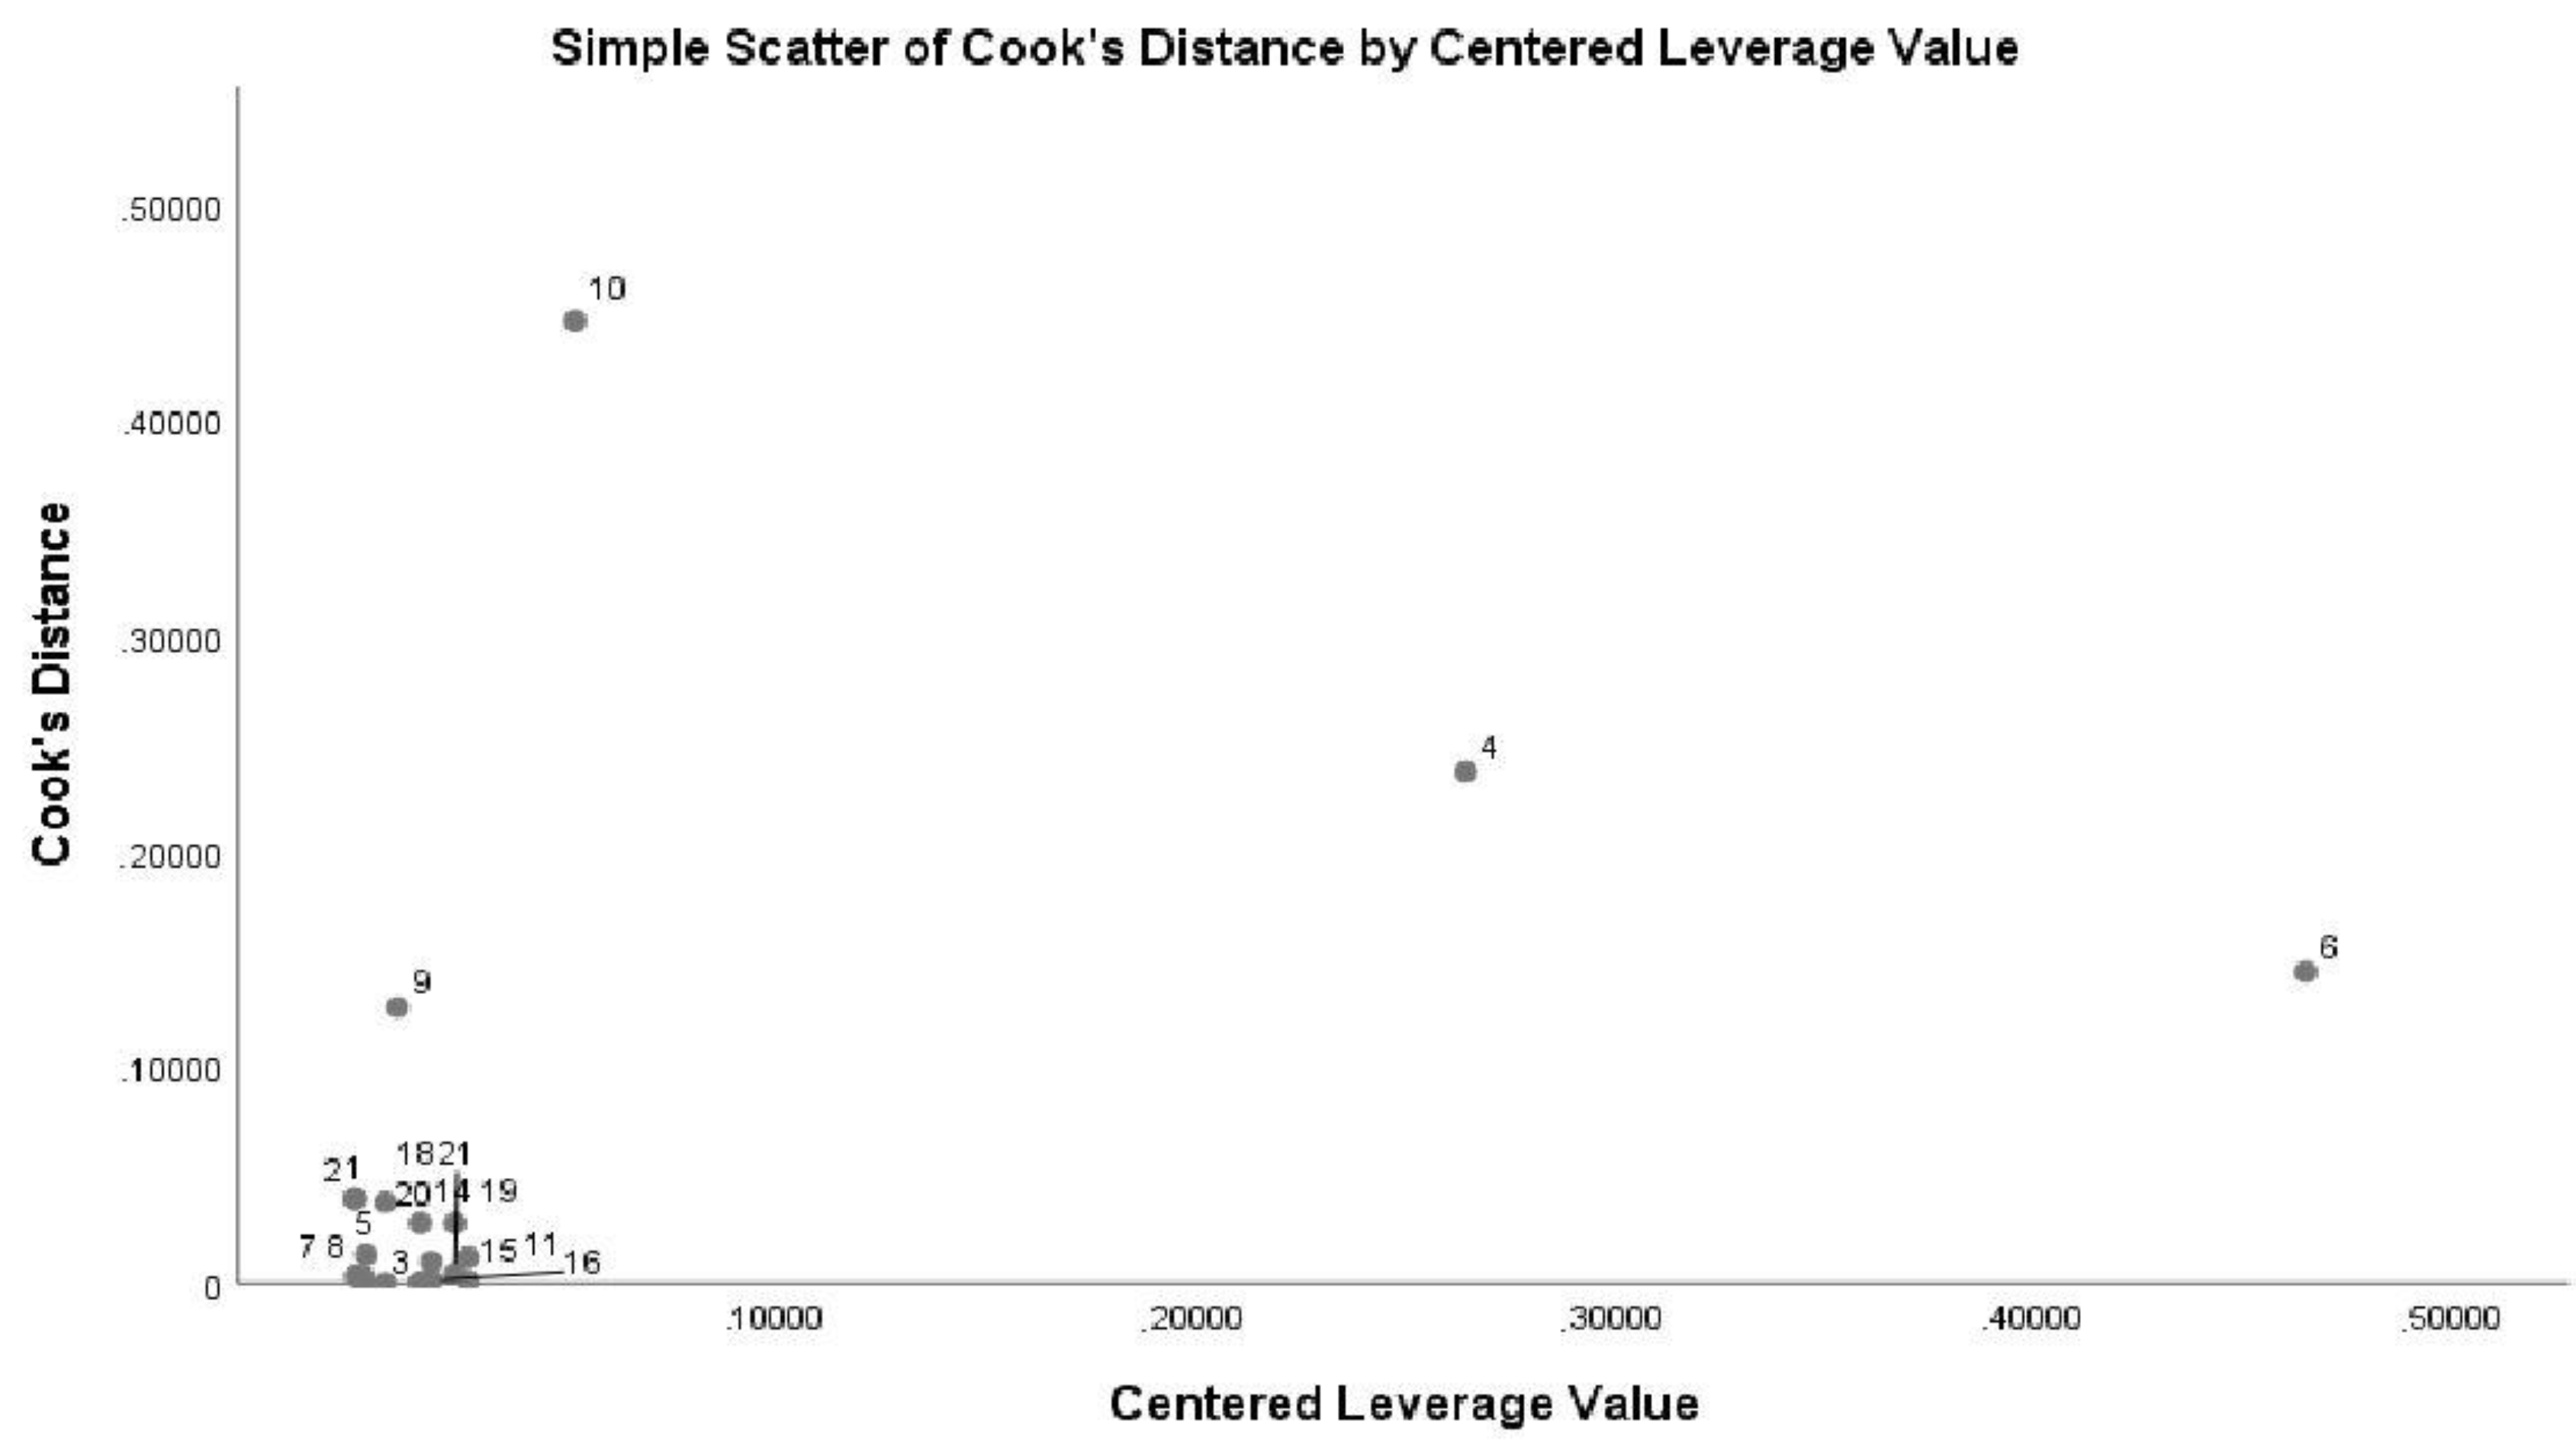
Four observations at the upper end of the ROS values in Figure 4 seem to influence the slope of the regression equation. Regarding their influence and leverage, we could mention that point 6 (ROSpred = 8.7, ROSobs = 12.0) seems to be of high leverage, but of relatively low influence, as does point 4 (7.0, 9.0) (see Figure 5 and Figure 6). As for point 10 (4.1, 9.1), it seems to be of low leverage and of relatively high influence, which does not seem to be the case for point 9 (2.8, 6.4). By removing point 10, which is the point with the maximum Cook’s distance (0.446) [53], the regression does not change substantially and the adjusted R2 is improved (from 0.879 to 0.913). The point can be marginally considered a potential outlier since the Cook’s distance does not exceed 0.5.
Table 4 shows the calculated ROSpred (m·min−1) values with BehavePlus using the Cistus spp. fuel model, setting the 1-hr and 10-hr fuel moisture content (FMC) at 5%, 100-hr fuel FMC at 7%, and LW FMC at 80%, and examining the influence of midflame wind (km hr−1) and slope (%) on the predictions. It also shows, in parenthesis, the corresponding expected ROSobs values obtained through Equation (1).
The ROS underprediction when using BehavePlus with the Cistus spp. fuel model was given further thought in an effort to explain the discrepancy. The careful observation of photos of the fuel conditions during the fires in which the ROS observations were made revealed that there was a varying presence and mix of grass, mainly Brachypodium ramosum, in various growth stages. In the summer fires, there was no presence of this grass, while in winter-prescribed burns, there was a significant contribution of Brachypodium ramosum loading with a moisture content exceeding 40% (Table 3). The occurrence of this grass affected the fire behavior in winter, accelerating the fire spread, and is partially responsible for the fire spread observations that are higher than those obtained using BehavePlus with the Cistus spp. fuel model. The fuel model was based on summer measurements without the presence of Brachypodium ramosum.
The maximum and mean vegetation height (SHRHGT) in the sampling plots were 37 and 21 cm, respectively (Table 1), but the fuel bed depth of the Cistus spp. fuel model was 9.44 cm (Table 2). This can be explained by the fact that the vegetation across those phryganic areas is sparse with many gaps where SHRHGT is equal to 0. Thus, the mean weighted fuel depth is quite low, even though the height of Cistus spp. shrublands visually appears taller than 10 cm (Figure 2c,d, Figure 3a,b, and Figure 4a). SHRCOV varied from 44 to 100%, while its mean and median values were equal to 80% (Table 1).
Regarding fire behavior observations, in calm and wet conditions such as those encountered in the prescribed burns, the fire spread slowly with low intensity and eventually stopped when it reached less dense vegetation. In three cases, it was observed that in calm conditions (Vmidflame = 0) and slopes varying from 60 to 84%, the fire stopped spreading (Robs = 0 m·min−1) through the Cistus spp.-dominated phryganic areas with 1-hr FMC equal to 20 or 42% and LW FMC equal to 128%. For those cases, the ROS predictions (Rpred), which refer to the fire spread through a homogeneous and continuous fuel bed, were different than zero, varying from to 0.1 to 0.9 m·min−1. This is an indication that the moisture of extinction of 46% calculated through BEHAVE and reported in Table 2 is probably higher than the observed one.
By examining Table 1 and Table 2, it becomes evident that the fuel model for Cistus spp. can be utilized to describe phryganic areas of relatively low height (9 to 21 cm) and vegetation cover around 70%. The fuel situations in phryganic areas dominated by Cistus creticus, Cistus parviflorus, and Cistus salvifolius are found in southeastern Europe where grazing is also a factor that shapes the landscapes. The areas where destructive sampling took place (Figure 1) have burned more than two times in the last four decades. Over the last 38 years, several fires occurred at the same places of the island of Zakynthos, a pattern that is usually observed in areas with livestock grazing [54,55]. Figure 2a,b represent grazed, sparse, and low Cistus spp.-dominated phryganic lands.
The total oven-dry fuel loading of the Cistus spp. fuel model is 7.44 tn·ha−1, of which 58% is dead fuel. This value lies between the corresponding total fuel loading values of two published fuel models of Dimitrakopoulos [43,44,56] for phryganic vegetation in Greece, namely, the models for Sarcopoterium spinosum and for Phlomis fruticosa. The total oven-dry fuel loading of the former is 5.65 tn·ha−1, of which 85% is dead fuel. The total oven-dry fuel loading of the latter is 9.9 tn·ha−1, of which 74% is dead fuel. These differences are large enough and affect fire behavior substantially, justifying the development of the Cistus spp. model that lies, in terms of total fuel loading, between the two.
Finally, it should also be pointed out that the Cistus spp. fuel model for Greece is quite likely not appropriate for other areas of the Mediterranean such as the Iberian Peninsula. The Cistus species there, according to the published literature, are generally taller and the corresponding fuel loading should be expected to be much higher. Examples are Cistus ladanifer (height = 115 ± 32.4 cm) [57], Cistus laurifolius L. (average height = 98.2 ± 3 cm) [58], and Cistus albidus L. (height up to 150 cm) [47].

5. Conclusions

The finding that BehavePlus underpredicts the actual rate of fire spread should be taken into consideration when using the system with the Cistus spp. fuel model for ROS prediction in phryganic areas. Adjusting the rate of fire spread predictions by utilizing Equation (1) and its 1.4 adjustment factor is one way to apply this information in the field, especially during the fire season. More fire behavior observations in the future, during prescribed fires and wildfires of higher intensity, will help to identify possible overpredictions or underpredictions, especially for environmental parameter values outside the range already tested, and to evaluate the overall reliability of the proposed equation.

Author Contributions

Conceptualization, M.A.; methodology, M.A. and A.M.; formal analysis, M.A. and E.K.; resources, M.A. and E.V.A.; writing—original draft preparation, M.A.; writing—review and editing, M.A., A.M., E.K. and E.V.A.; visualization, M.A.; supervision, M.A. All authors have read and agreed to the published version of the manuscript.

Funding

This research received no external funding.

Institutional Review Board Statement

Not applicable.

Informed Consent Statement

Not applicable.

Data Availability Statement

Data are available upon request.

Acknowledgments

We would like to thank the students of the Department of Environment of Ionian University, who helped us during destructive samplings in the field and in the laboratory.

Conflicts of Interest

The authors declare no conflict of interest.

References

  1. Alexander, M.E.; Cruz, M. Fireline Intensity. In Encyclopedia of Wildfires and Wildland-Urban Interface (WUI) Fires; Springer: Berlin/Heidelberg, Germany, 2019; pp. 1–8. [Google Scholar]
  2. Davis, K.P. Forest Fire, Control and Use; McGraw-Hill Book Co., Inc.: New York, NY, USA, 1959; p. 584. [Google Scholar]
  3. Athanasiou, M.; Xanthopoulos, G. Fire Behaviour of the Large Fires of 2007 in Greece. In Proceedings of the 6th International Conference on Forest Fire Research, Coimbra, Portugal, 15–18 November 2010. [Google Scholar]
  4. Rothermel, R.C. A Mathematical Model for Predicting Fire Spread in Wildland Fuels, R.P. INT-115 ed.; Department of Agriculture, Intermountain Forest and Range Experiment Station: Ogden, UT, USA, 1972; p. 40. [Google Scholar]
  5. Salis, M.; Arca, B.; Alcasena, F.; Arianoutsou, M.; Bacciu, V.; Duce, P.; Duguy, B.; Koutsias, N.; Mallinis, G.; Mitsopoulos, I. Predicting wildfire spread and behaviour in Mediterranean landscapes. Int. J. Wildland Fire 2016, 25, 1015–1032. [Google Scholar] [CrossRef]
  6. Andrews, P.L. The Rothermel Surface Fire Spread Model and Associated Developments: A Comprehensive Explanation; General Technical Report RMRS-GTR-371; Department of Agriculture, Forest Service, Rocky Mountain Research Station: Fort Collins, CO, USA, 2018; p. 121. [Google Scholar]
  7. McAlpine, R.; Xanthopoulos, G. Predicted vs. Observed fire spread rates in ponderosa pine fuel beds: A test of American and Canadian systems. In Proceedings of the 10th Conference on Fire and Forest Whitewood Compte rendu du 10ieme Congress sur les incendies et la meterologie forestiere, Ottawa, ON, Canada, 17–21 April 1989; Maiver, D., Auld, H., Whitewoo, R., Eds.; Ottawa, Ont. Forestry Canada: Ottawa, ON, Canada, 1989; pp. 287–294. [Google Scholar]
  8. Van Wilgen, B.W.; Le Maitre, D.C.; Kruger, F.J. Fire Behaviour in South African Fynbos (Macchia) Vegetation and Predictions from Rothermel’s Fire Model. J. Appl. Ecol. 1985, 22, 207. [Google Scholar] [CrossRef]
  9. Xanthopoulos, G. A Fuel Model for Fire Behavior Prediction in Spotted Knapweed (Centaurea maculosa L.) Grasslands in Western Montana; The University of Montana: Missoula, MT, USA, 1986. [Google Scholar]
  10. Athanasiou, M.; Xanthopoulos, G. Wildfires in Mediterranean shrubs and grasslands. In Greece: In situ fire behaviour observations versus predictions. In Proceedings of the 7th International Conference on Forest Fire Research on Advances in Forest Fire Research, Coimbra, Portugal, 17–20 November 2014. [Google Scholar]
  11. Drury, S.A. Observed versus predicted fire behavior in an Alaskan black spruce forest ecosystem: An experimental fire case study. Fire Ecol. 2019, 15, 35. [Google Scholar] [CrossRef] [Green Version]
  12. Andrews, P.L.; Bevins, C.; Seli, R. BehavePlus Fire Modeling System, Version 4.0: User’s Guide; General Technical Report RMRS-GTR-106 Revised; Department of Agriculture, Forest Service, Rocky Mountain Research Station: Ogden, UT, USA, 2005; Volume 106, p. 132. [Google Scholar]
  13. Andrews, P.L. Current status and future needs of the BehavePlus Fire Modeling System. Int. J. Wildland Fire 2014, 23, 21–33. [Google Scholar] [CrossRef] [Green Version]
  14. Papadopoulos, G.D.; FPavlidou, N. A comparative review on wildfire simulators. IEEE Syst. J. 2011, 5, 233–243. [Google Scholar] [CrossRef]
  15. Finney, M.A. Modeling the spread and behavior of prescribed natural fires. In Proceedings of the 12th Conference Fire and Forest Meteorology, Jekyll Island, GA, USA, 26–28 October 1994. [Google Scholar]
  16. Finney, M.A. FARSITE, Fire Area Simulator—Model Development and Evaluation; US Department of Agriculture, Forest Service, Rocky Mountain Research Station: Fort Collins, CO, USA, 1998. [Google Scholar]
  17. Finney, M.A. An Overview of FlamMap Fire Modeling Capabilities. In Fuels Management—How to Measure Success: Conference Proceedings; USDA Forest Service, Rocky Mountain Research Station: Fort Collins, CO, USA, 2006. [Google Scholar]
  18. Andrews, P.L.; Cruz, M.; Rothermel, R. Examination of the wind speed limit function in the Rothermel surface fire spread model. Int. J. Wildland Fire 2013, 22, 959–969. [Google Scholar] [CrossRef]
  19. Sullivan, A.L. Wildland surface fire spread modelling, 1990–2007, 2: Empirical and quasi-empirical models. Int. J. Wildland Fire 2009, 18, 369–386. [Google Scholar] [CrossRef] [Green Version]
  20. Cruz, M.G.; Alexander, M.E. The 10% wind speed rule of thumb for estimating a wildfire’s forward rate of spread in forests and shrublands. Ann. For. Sci. 2019, 76, 44. [Google Scholar] [CrossRef] [Green Version]
  21. Cruz, M.G.; Alexander, M.E.; Fernandes, P.M.; Kilinc, M.; Sil, Â. Evaluating the 10% wind speed rule of thumb for estimating a wildfire’s forward rate of spread against an extensive independent set of observations. Environ. Model. Softw. 2020, 133, 104818. [Google Scholar] [CrossRef]
  22. Fernandes, P.A.M. Fire spread prediction in shrub fuels in Portugal. For. Ecol. Manag. 2001, 144, 67–74. [Google Scholar] [CrossRef]
  23. Bilgili, E.; Saglam, B. Fire behavior in maquis fuels in Turkey. For. Ecol. Manag. 2003, 184, 201–207. [Google Scholar] [CrossRef]
  24. Saglam, B.; Bilgili, E.; Küçük, Ö.; Durmaz, B.D. Fire behavior in Mediterranean shrub species (Maquis). Afr. J. Biotechnol. 2008, 7, 4122–4129. [Google Scholar]
  25. Sullivan, A.L. Wildland surface fire spread modelling, 1990–2007. 1: Physical and quasi-physical models. Int. J. Wildland Fire 2009, 18, 349–368. [Google Scholar] [CrossRef] [Green Version]
  26. Sullivan, A.L. Wildland surface fire spread modelling, 1990–2007. 3: Simulation and mathematical analogue models. Int. J. Wildland Fire 2009, 18, 387–403. [Google Scholar] [CrossRef] [Green Version]
  27. Koo, E.; Pagni, P.; Stephens, S.; Huff, J.; Woycheese, J.; Weise, D. A Simple Physical Model For Forest Fire Spread Rate. Fire Saf. Sci. 2005, 8, 851–862. [Google Scholar] [CrossRef] [Green Version]
  28. Zhou, X.; Mahalingam, S.; Weise, D. Modeling of marginal burning state of fire spread in live chaparral shrub fuel bed. Combust. Flame 2005, 143, 183–198. [Google Scholar] [CrossRef]
  29. Balbi, J.-H.; Morandini, F.; Silvani, X.; Filippi, J.-B.; Rinieri, F. A physical model for wildland fires. Combust. Flame 2009, 156, 2217–2230. [Google Scholar] [CrossRef] [Green Version]
  30. Linn, R.; Reisner, J.; Colman, J.J.; Winterkamp, J. Studying wildfire behavior using FIRETEC. Int. J. Wildland Fire 2002, 11, 233–246. [Google Scholar] [CrossRef]
  31. Coen, J.L. Modeling Wildland Fires: A Description of the Coupled Atmosphere Wildland Fire Environment Model (CAWFE); NCAR Technical Notes; NCAR: Boulder, CO, USA, 2013. [Google Scholar]
  32. Coen, J.L.; Cameron, M.; Michalakes, J.; Patton, E.; Riggan, P.J.; Yedinak, K.M. WRF-Fire: Coupled Weather–Wildland Fire Modeling with the Weather Research and Forecasting Model. J. Appl. Meteorol. Clim. 2013, 52, 16–38. [Google Scholar] [CrossRef]
  33. Mandel, J.; Beezley, J.D.; Kochanski, A.K. Coupled atmosphere-wildland fire modeling with WRF 3.3 and SFIRE 2011. Geosci. Model Dev. 2011, 4, 591–610. [Google Scholar] [CrossRef] [Green Version]
  34. Baptiste Filippi, J.; Bosseur, F.; Mari, C.; Lac, C.; Le Moigne, P.; Cuenot, B.; Veynante, D.; Cariolle, D.; Balbi, J.H. Coupled atmosphere-wildland fire modelling. J. Adv. Model. Earth Syst. 2009, 1, 11. [Google Scholar] [CrossRef]
  35. Thomas, C.M.; Sharples, J.J.; Evans, J.P. Modelling the dynamic behaviour of junction fires with a coupled atmosphere–fire model. Int. J. Wildland Fire 2017, 26, 331. [Google Scholar] [CrossRef]
  36. Burgan, R.E.; Rothermel, R.C. BEHAVE: Fire Behavior Prediction and Fuel Modeling System—FUEL Subsystem; General Technical Report INT-167; US Department of Agriculture, Forest Service, Intermountain Forest and Range Experiment Station: Ogden, UT, USA, 1984; Volume 167, p. 126. [Google Scholar]
  37. Anderson, H.E. Aids to Determining Fuel Models for Estimating Fire Behavior; General Technical Report INT-GTR-122; U.S. Department of Agriculture, Forest Service, Intermountain Forest and Range Experiment Station: Rocky Mountain Research Station: Ogden, UT, USA, 1982. [Google Scholar]
  38. Baughman, R.G.; Albini, F. Estimating midflame windspeeds. In Proceedings of the Sixth Conference on Fire and Forest Meteorology, Seattle, WA, USA, 22–24 April 1980. [Google Scholar]
  39. Andrews, P.L. Modeling Wind Adjustment Factor and Midflame Wind Speed for Rothermel’s Surface Fire Spread Model; General Technical Report RMRS-GTR-266; US Department of Agriculture, Forest Service, Rocky Mountain Research StationGen: Fort Collins, CO, USA, 2012; Volume 266, p. 39. [Google Scholar]
  40. Fischer, W.C. Wilderness Fire Management Planning Guide; General Technical Report INT-GTR-171; U.S. Department of Agriculture, Forest Service, Intermountain Forest and Range Experiment Station: Ogden, UT, USA, 1984; Volume 56. [Google Scholar]
  41. Turner, J.A.; Lawson, B. Weather in the Canadian Forest Fire Danger Rating System: A User Guide to National Standards and Practices; Information Report BC-X-1771978; Canadian Forest Service, Pacific Forestry Centre: Victoria, BC, Canada, 1984; p. 40. [Google Scholar]
  42. Lawson, B.; Armitage, O. Weather Guide for the Canadian Forest Fire Danger Rating System. A User Guide to National Standards and Practices; Information Report BC-X-177; Fisheries and Environment Canada, Canadian Forest Service, Pacific Forest Research Centre: Victoria, BC, Canada, 2008; p. 40. [Google Scholar]
  43. Dimitrakopoulos, A.; Panov, P. Pyric properties of some dominant Mediterranean vegetation species. Int. J. Wildland Fire 2001, 10, 23–27. [Google Scholar] [CrossRef]
  44. Dimitrakopoulos, A. Mediterranean fuel models and potential fire behaviour in Greece. Int. J. Wildland Fire 2002, 11, 127–130. [Google Scholar] [CrossRef]
  45. Athanasiou, M. Development of an Optimal Methodology for Forecasting Forest Fire Behaviour in Greece. In Department of Geology and Geoenvironment; National and Kapodistrian University of Athens: Athens, Greece, 2015; p. 408. [Google Scholar]
  46. Sgardelis, S.; Pantis, J.; Argyropoulou; Stamou, G. Effects of fire on soil macroinvertebrates in a Mediterranean phryganic ecosystem. Int. J. Wildland Fire 1995, 5, 113–121. [Google Scholar] [CrossRef]
  47. Palá-Paúl, J.; Velasco-Negueruela, A.; Pérez-Alonso, M.J.; Sanz, J. Seasonal variation in chemical composition of Cistus albidus L. from Spain. J. Essent. Oil Res. 2005, 17, 19–22. [Google Scholar] [CrossRef]
  48. Brown, J. Handbook for Inventorying Downed Woody Material; General Technical Report INT-16; Department of Agriculture, Forest Service, Intermountain Forest and Range Experiment Station: Ogden, UT, USA, 1974. [Google Scholar]
  49. Xanthopoulos, G.; Manasi, M. A Practical Methodology for the Development of Shrub Fuel Models for Fire Behavior Prediction. In Proceedings of the IV International Conference on Forest Fire Research 2002, Wildland Fire Safety Summit, Luso, Coimbra, Portugal, 18–23 November 2002. [Google Scholar]
  50. Arianoutsou, M. Aspects of demography in post-fire Mediterranean plant communities of Greece. In Landscape Disturbance and Biodiversity in Mediterranean-Type Ecosystems; Rundel, P., Montenegro, G., Jaksic, F.M., Eds.; Springer: New York, NY, USA, 1998; pp. 273–295. [Google Scholar]
  51. Deeming, J.E.; Burgan, R.; Cohen, J. The National Fire-Danger Rating System—1978, 1977, United States Department of Agriculture, Forest Service, General Technical Report INT-39; Intermountain Forest and Range Experiment Station: Ogden, UT, USA, 1977; p. 66. [Google Scholar]
  52. Athanasiou, M.; Bouchounas, T.; Korakaki, E.; Tziritis, E.; Xanthopoulos, G.; Sitara, S. Introducing the use of fire for wildfire prevention in Greece: Pilot application of prescribed burning in Chios island. In Proceedings of the 9th International Conference on Forest Fire Research: Advances in Forest Fire Research & 17th International Wildland Fire Safety Summit, Coimbra, Portugal, 11–18 November 2022. [Google Scholar]
  53. Cook, R.D. Detection of influential observation in linear regression. Technometrics 1977, 19, 15–18. [Google Scholar]
  54. Blondel, J.; Aronson, J.; Bodiou, J.Y.; Boeuf, G. The Mediterranean Region: Biological Diversity in Space and Time; Oxford University Press: Oxford, UK, 2010. [Google Scholar]
  55. Kefalas, G.; Poirazidis, K.; Xofis, P.; Kalogirou, S. Mapping and Understanding the Dynamics of Landscape Changes on Heterogeneous Mediterranean Islands with the Use of OBIA: The Case of Ionian Region, Greece. Sustainability 2018, 10, 2986. [Google Scholar] [CrossRef] [Green Version]
  56. Dimitrakopoulos, A.; Mateeva, V.; Xanthopoulos, G. Fuel models for Mediterranean vegetation types in Greece. Geotech. Sci. Issues 2001, 12, 192–206. [Google Scholar]
  57. Carrión-Prieto, P.; Martín-Ramos, P.; Hernández-Navarro, S.; Sánchez-Sastre, L.F.; Marcos-Robles, J.L.; Martín-Gil, J. Valorization of Cistus ladanifer and Erica arborea shrubs for fuel: Wood and bark thermal characterization. Maderas. Cienc. Y Tecnol. 2017, 19, 443–454. [Google Scholar] [CrossRef]
  58. Bados, R.; Esteban, L.S.; Esteban, J.; Fernández-Landa, A.; Sánchez, T.; Tolosana, E. Biomass equations for rockrose (Cistus laurifolius L.) shrublands in North-central Spain. For. Syst. 2021, 30, e015. [Google Scholar] [CrossRef]
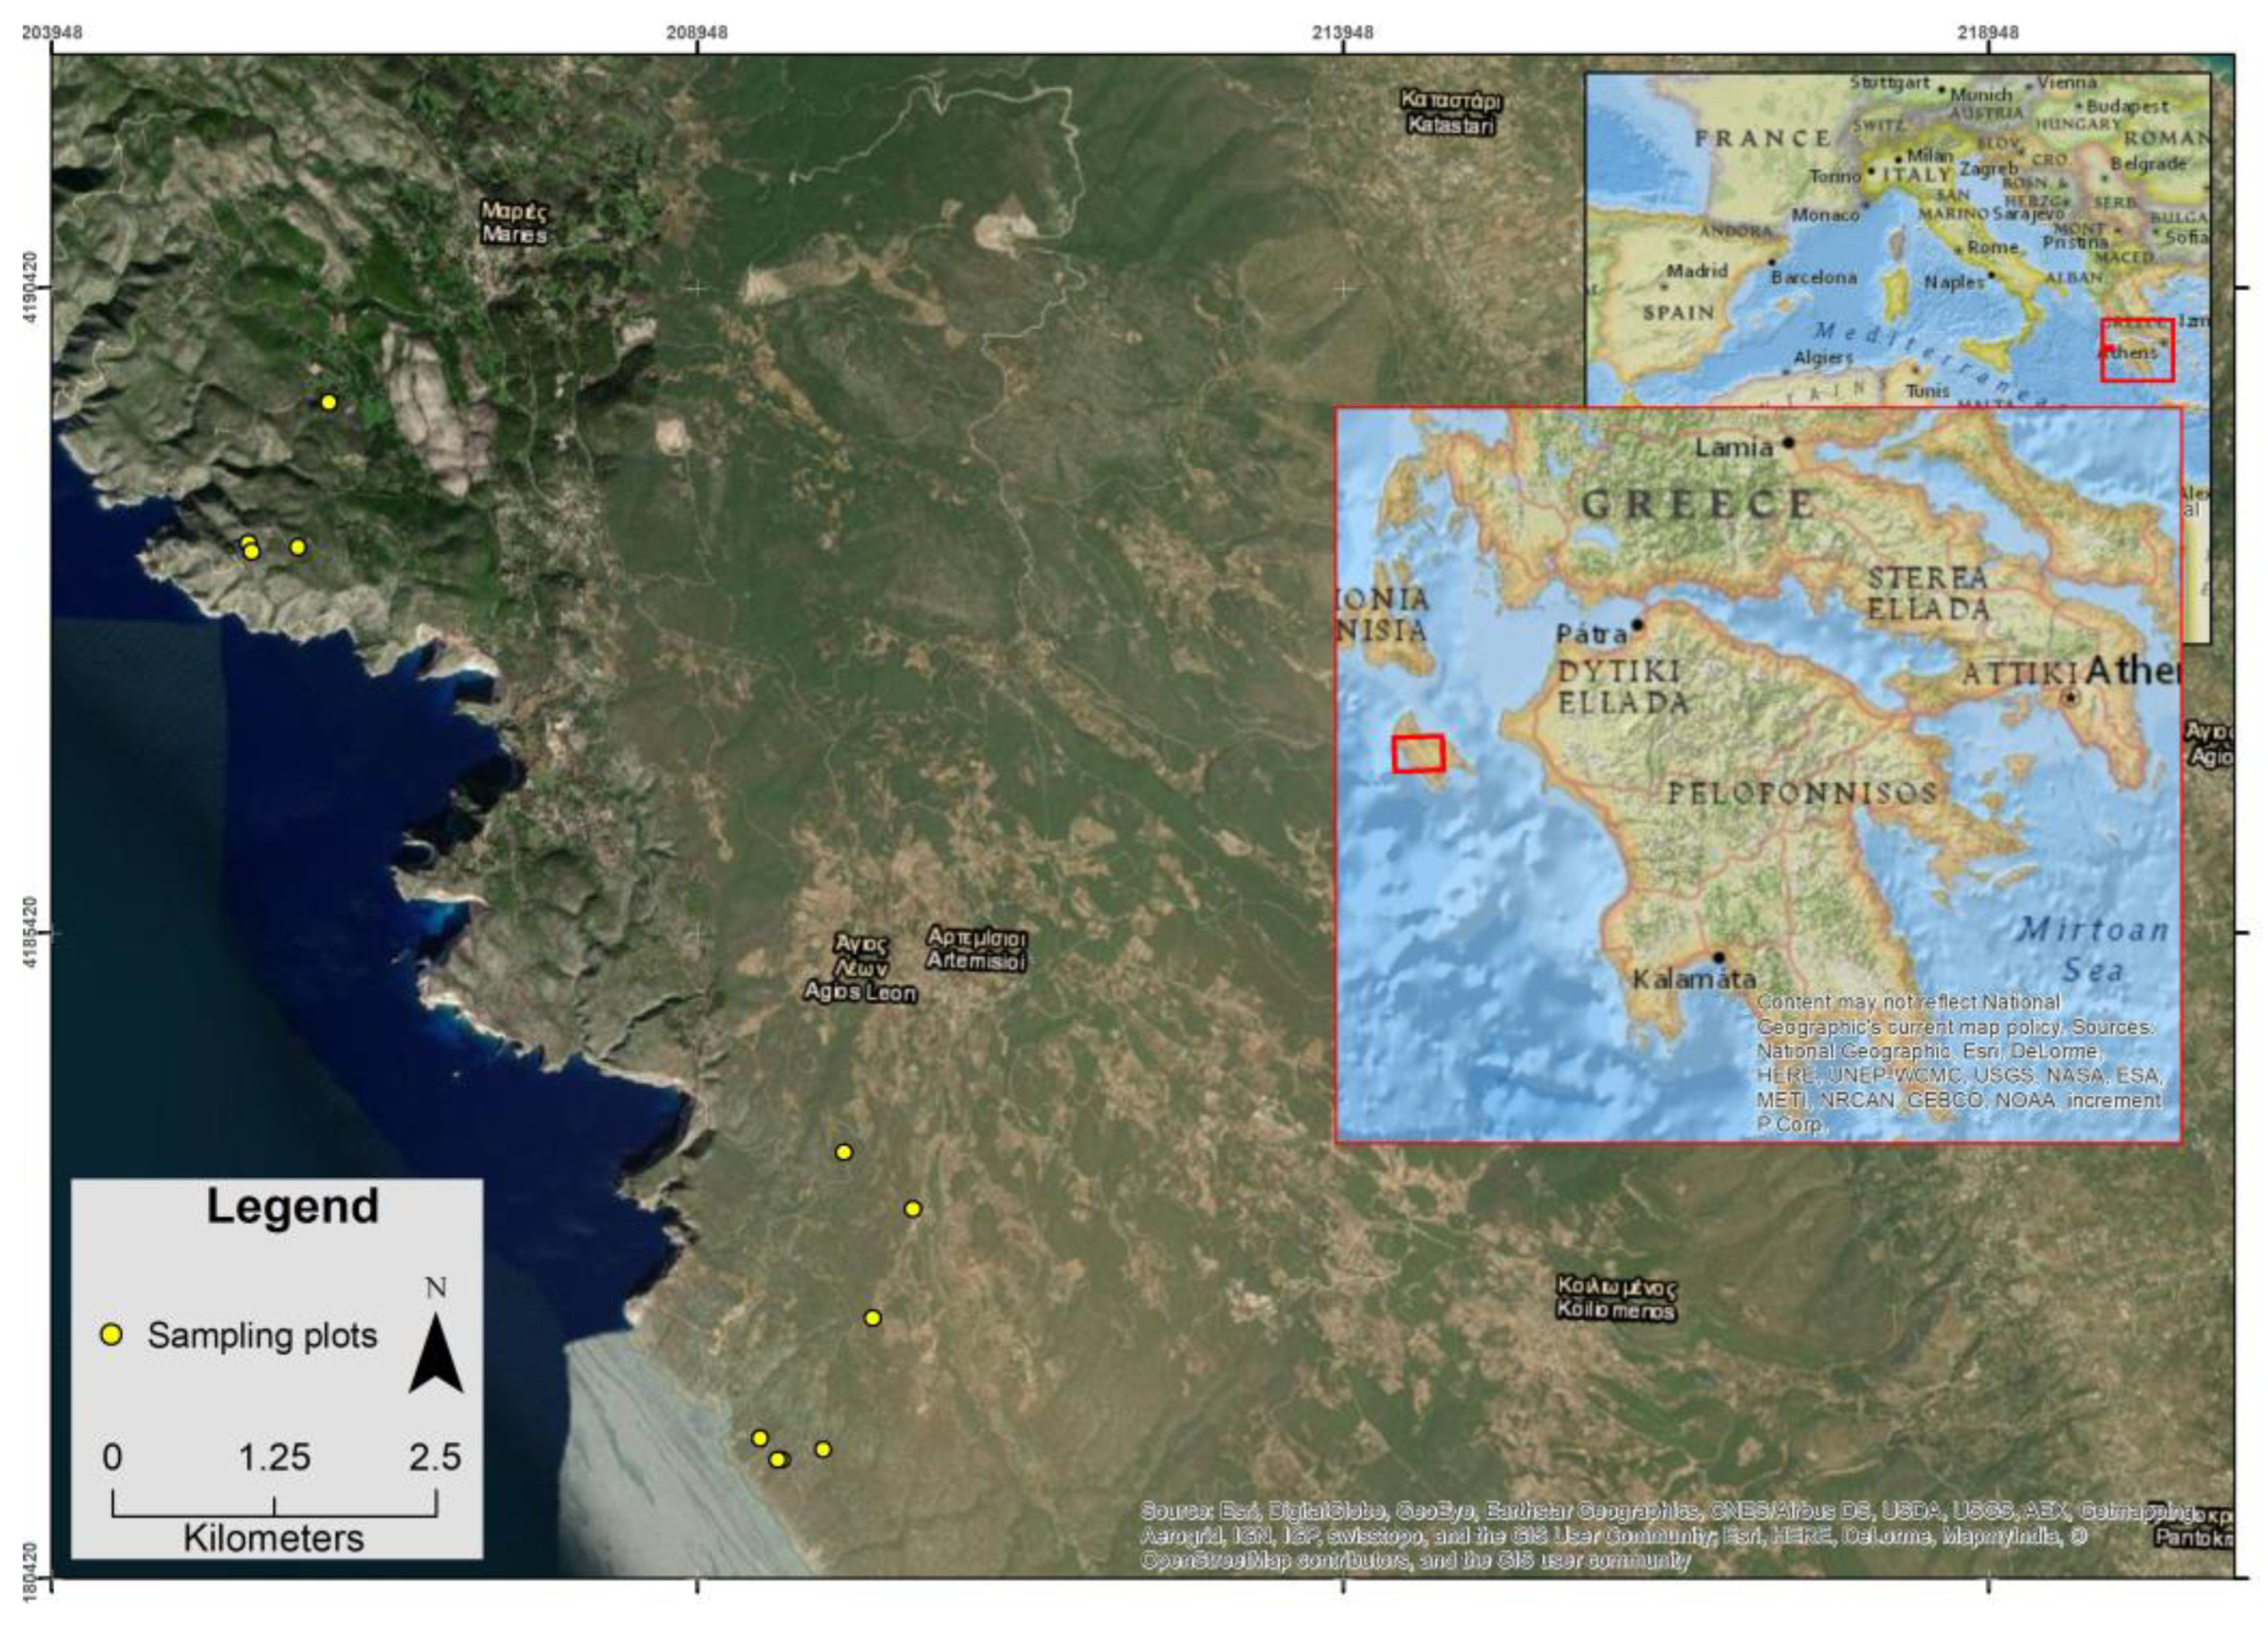
Figure 1. General area of the sampling plots in western Greece (Zakynthos island).
Fire 06 00247 g001
Figure 2. Sampling locations in phryganic sites covered by Cistus spp., where TFL: the average oven-dry total fuel loading (kg·m−2), SHRHGT: the average vegetation (shrub) height (cm), and SHRCOV: the vegetation cover (dimensionless) of the sampling location. The photographs are sorted by their SHRHGT value (lowest to highest). (a) TFL = 0.37, SHRHGT = 10, SHRCOV = 0.69, (b) TFL = 0.77, SHRHGT = 17, SHRCOV = 0.83, (c) TFL = 0.78, SHRHGT = 18, SHRCOV = 0.73, (d) TFL = 0.92, SHRHGT = 28, SHRCOV = 0.96.
Fire 06 00247 g002
Figure 3. Stages of the destructive sampling process in sampling plots. (a) measuring vegetation height, (b) cutting and collecting live fuels, (c) dead fuels are to be collected, and weighed, (d) all live and dead fuels have been collected.
Fire 06 00247 g003
Figure 4. Linear regression between ROSobs and ROSpred values (m·min−1) for the Cistus spp. fuel model, including the 95% confidence interval.
Fire 06 00247 g004
Figure 5. Cook’s distance values for the 21 data points of Figure 4.
Fire 06 00247 g005
Figure 6. Centered leverage versus Cook’s distance values for the 21 data points of Figure 4.
Fire 06 00247 g006
Table 1. Descriptive statistics for (a) total oven-dry fuel loading (TFL, kg·m−2) and oven-dry fuel loadings of the live and dead fuel classes (kg·m−2), (b) vegetation height (SHRHGT, cm), and (c) vegetation cover (SHRCOV, %) for N = 30 sampling plots.
VariableUnitsMeanMedianStandard DeviationMinMaxN
TFLkg·m−20.740.680.390.171.5630
Live
(up to 0.64 cm)
kg·m−20.270.250.160.050.7930
Live
(0.64 to 2.54 cm)
kg·m−20.040.020.0500.1830
Dead (1-hr)kg·m−20.390.340.260.091.0030
Dead (10-hr)kg·m−20.040.020.0500.2029
SHRHGTcm2121863730
SHRCOV%8080124410030
Table 2. Values of the parameters of the fuel model for Cistus spp.
Fuel ClassFuel Load
(tn·ha−1)
SA/V
(cm2·cm−3)
Other ParametersValue
1-hr3.9523.46Fuel bed depth (cm)9.44
10-hr0.383.57 (BEHAVE)Fuel heat content (kJ·kg−1)19.046
100-hr0.010.98 (BEHAVE)Moisture of extinction (%)46
Live Herbaceous0.00-
Live Woody3.1030.00
Table 3. Descriptive statistics summary for measurements conducted in the field during wildfires and prescribed burns, namely, (a) ROSobs, (b) midflame wind speed (Vmidflame), (c) fine dead (1-hr) and LW FMC, (d) and slope.
VariableUnitsMeanMedianStandard DeviationStandard ErrorMinMaxN
ROSobsm·min−12.61.33.40.801221
Vmidflamekm·h−16.158.51.803021
1-hr FMC%14.7108.71.9742.121
LW FMC%75.23147.710.43112821
Slope%36.43632.57.1010021
Table 4. ROS predictions (ROSpred, m·min−1) for a range of midflame wind speed and slope conditions in Cistus spp. phryganic fields. The corresponding solutions of Equation (1) in parentheses stand for the corresponding expected ROSobs values.
Midflame Wind Speed, km·h−1Slope Steepness (%)
0 (Horizontal)103060100
00.1 (0.2)0.1 (0.2)0.3 (0.5)0.8 (1.2)2.0 (2.9)
1.10.3 (0.5)0.3 (0.5)0.4 (0.6)1.0 (1.5)2.2 (3.2)
2.80.5 (0.7)0.5 (0.7)0.7 (1.0)1.2 (1.7)2.4 (3.5)
50.8 (1.2)0.8 (1.2)1.0 (1.5)1.5 (2.2)2.7 (3.9)
7.71.2 (1.7)1.2 (1.7)1.3 (1.9)1.8 (2.6)3.0 (4.3)
Disclaimer/Publisher’s Note: The statements, opinions and data contained in all publications are solely those of the individual author(s) and contributor(s) and not of MDPI and/or the editor(s). MDPI and/or the editor(s) disclaim responsibility for any injury to people or property resulting from any ideas, methods, instructions or products referred to in the content.