Article

Spatial Modeling of Forest and Land Fire Susceptibility Using the Information Value Method in Kotawaringin Barat Regency, Indonesia

by
Arman Nur Ikhsan
1,
Danang Sri Hadmoko
2,* and
Prima Widayani
3
1
Department of Environmental Science, The Graduate School, Universitas Gadjah Mada, Yogyakarta 55284, Indonesia
2
Department of Environmental Geography, Faculty of Geography, Universitas Gadjah Mada, Yogyakarta 55281, Indonesia
3
Department of Geographic Information Sciences, Faculty of Geography, Universitas Gadjah Mada, Yogyakarta 55281, Indonesia
*
Author to whom correspondence should be addressed.
Fire 2023, 6(4), 170; https://doi.org/10.3390/fire6040170
Submission received: 13 March 2023 / Revised: 16 April 2023 / Accepted: 18 April 2023 / Published: 20 April 2023
(This article belongs to the Section Fire Science Models, Remote Sensing, and Data)

Abstract

:
Kotawaringin Barat is a high-risk area for forest and land fires; a total of 564.13 km2 of forest land was burned from 2015 to 2022, the majority of which spread to peatlands. The goal of this contribution is to use the information value method (IVM) to construct forest and land fire spatial susceptibility maps for the Kotawaringin Barat regency. MODIS hotspots from 2016 to 2020 were used as the dependent variable, with six independent variables included in the modeling. According to the data, there were 925 hotspots detected in Kotawaringin Barat between 2016 and 2020. The areas closest to rivers and roads are more susceptible to forest and land fires, while the areas closest to settlements are safer. Flat slopes have an IVM of 0.697, while peatlands have an IVM of 0.667, making them the most susceptible to forest and land fires. Furthermore, the most susceptive land covers are swamps (IVM = 1.071) and shrublands (IVM = 0.024). According to the IVM model of susceptibility mapping, Kotawaringin Barat is categorized as very high (18.32%) and high (27.97%) risk. About 33.57% of the study area is classified as moderately susceptible, while the remaining 20.14% is classified as low risk. The accuracy of the IVM for forest and land fires is 66.87% (AUC), indicating that the model can be used for susceptibility assessments particularly for very high to high susceptibility areas.

1. Introduction

Forest and land fires (non-forest wildfires) are a global problem that occur in many countries, including Spain, Turkey, Brazil, the United States, Australia, and Indonesia [1,2]. Numerous large-scale forest and land fires have wracked Indonesia, causing the loss of thousands of lives. In 1997 and 1998, several large-scale forest and land fires obliterated 250,000 square kilometers of forested land and contributed 13–40% to global carbon emissions [3,4]. Forest and land fires occur on a regular basis in Indonesia. Significant forest and land fires occurred in 2006, 2010, 2015, and 2019 after the devastating forest and land fire of 1997 [5]. The majority of forest and land fires in Indonesia occurred in seven provinces, including Jambi, Sumatera Selatan, Riau, Kalimantan Barat, Kalimantan Tengah, Kalimantan Selatan, and Papua, with the majority of them starting in peatland areas [6]. During the period from 2012 to 2022, 442,822.51 km2 of land was burned in these provinces, which is an area larger than India (http://sipongi.menlhk.go.id accessed on 9 November 2021). Indonesia is under pressure from a lot of different groups to reduce the forest and land fires that keep occurring [7].
Peatlands, which are the main areas prone to forest and land fires, contain extremely flammable soils. Peatland is a naturally saturated water ecosystem. As a result of its high porosity and permeability, peat land is easily drained and dried, making the area highly flammable [8]. This is exacerbated by land degradation caused by plantations, agriculture, and industry [9]. Naturally occurring and human-made factors are the main causes of forest and land fires. The El Nino Period, which makes the dry season worse, can increase the intensity of fires [10,11]. Forest and land fires can also be caused by socioeconomic and environmental factors. The socioeconomic activities that play an important role in triggering forest and land fires are population density, accessibility to forest areas, agricultural activity, and timber plantations. Elevation, the presence of peatland, precipitation, and days without rain are all environmental factors that influence forest and land fires [10].
Forest and land fires have a significant environmental impact. Peatland absorbs a large amount of CO2 which is emitted into the atmosphere when it burns. These processes contribute to global warming and increase surface temperatures in the long term [12]. Land sinking is also caused by forest and land fires, especially in peatland areas. Fires can spread quickly under the surface of peatland and burn all the way through it. This has contributed to the reduction in peatland thickness and has annihilated their biodiversity [13]. Forest and land fires have numerous negative consequences, including respiratory problems caused by poor air quality and restrictions on people’s activities [14]. Furthermore, they impact biodiversity and lead to the deterioration of important habitats for flora and fauna species, putting them under additional stress and threatening their long-term sustainability [9,15].
Forest and land fires have had a significant impact on Kotawaringin Barat Regency. Between 2015 and 2022, over 564.13 km2 of land was burned [16]. This region is comparable to Singapore in size. Locals have identified acute respiratory infections as one of the major health issues brought on by the smoke. This affected 2233 people in Kotawaringin Barat Regency in 2015, making it one of the most prevalent diseases [17]. These facts suggest that national and regional mitigation strategies for forest and land fires are needed. Forest and land fire susceptibility maps are essential in fire prevention measures.
Several methods have been applied for assessing forest and land fire susceptibility, such as AHP, Multi-Criteria Decision Analysis (MCDA), TOPSIS, and VIKOR. These methods are reliable for creating forest and land fire susceptibility maps, but they rely on the weighting of the variables. Extra care must be taken when allocating weights because expert subjectivity and consistency could skew the results [18]. This adds to the qualitative data based on expert opinion and reduces the subjectivity of the researcher, since the same value is typically used for all parameters, applications, and areas [19].
Each research area has different variables and weights and these need adjusting to perform other research. The information value method (IVM) is an alternative method that can be implemented in the forest and land fire context, which has been frequently used to map landslide risks. The advantage of this method is contingent on the objectivity of forest and land fire conditions, which are tailored to data-driven and hotspot approaches [18,20,21,22]. The objective of this study is to create and employ a forest and land fire susceptibility map based on the information value method (IVM).

2. Materials and Methods

2.1. Study Area

The study was conducted in the Kalimantan Tengah Province, Kotawaringin Barat Regency, which has a total area of about 9554.72 km2. Flat, gentle slopes associated with peatland distribution dominate the research area. Approximately 46.53% of the research area in the southern portion of the regency consists primarily of gentle, undulating slopes, which represent the peatland region.
In the northern part of the research area, hilly slopes make up about 40% of the entire regency, which represents non-peatland areas (Figure 1). The topography is associated with the distribution of peatlands in lowland areas [23]. Based on Figure 1C,D, the fire scars of the peatland area in the images demonstrate that Kotawaringin Barat is prone to forest and land fires.

2.2. Data Sources

2.2.1. Hotspot Datasets

A spatio-temporal hotspot dataset for Kotawaringin Barat Regency was produced using the MODIS from 1 January 2016 to 31 December 2020 as the primary source of data for the susceptibility assessment for forest and land fires. MODIS hotspot data were downloaded in shapefile (.shp) format from the online Fire Information for Resource Management System (FIRMS) of the National Aeronautics and Space Administration (NASA) (https://firms.modaps.eosdis.nasa.gov/active_fire accessed on 16 September 2021). We used a MODIS confidence level of >50%, which is categorized as moderate to high class [24], to reduce the bias of hotspot data. The dataset from 1 January 2015 to 31 December 2015 was introduced to assess the accuracy of the susceptibility map. To produce a susceptibility map, all hotspot datasets were extracted, geo-corrected, and further processed.

2.2.2. Independent Data

ArcGIS 10.8 was used to manage spatial datasets (Figure 2). These thematic maps were used in this study’s forest and land fire risk modeling because they were observed in the field as determinant factors influencing forest and land fires. The detail information of determinant factors in Table 1.
An update to the landcover data was made available by the Ministry of Environment and Forestry. Using visual interpretation in ArcGIS 10.8, updates were made using Sentinel-2 satellite imagery that was captured in 2020. The accuracy of the map was evaluated using a confusion matrix during the validation of landcover maps. The most prevalent landcover in the study area, making up 80.84% of it, is the combination of forests, swamps, and plantations. The spatial resolution of Sentinel-2 (10 m by 10 m) was adjusted to the standard deviation used in this validation process, which was 15%. The samples were calculated using the Slovin method. Forty-two locations made up the entire sample for validation, which were validated using Google Earth Pro and distributed at random. As a result, the accuracy of the 2020 landcover map was 76.19%, and since there is a small error margin of about 15%, this result can be trusted.
Forest, mangrove, plantation, agriculture, shrubland, mining, swamp, settlements, structures, and water bodies are the different types of land cover in Indonesia. In this study, the term “swamp” refers to a forest that was once a peat swamp and is now seasonally saturated with scattered remnant trees and shrubby regrowth. Grassland, in contrast to shrubland, is a dry area with mineral soil that is dominated by grasses. We categorized the entire area of Kotawaringin Barat which is covered by dense vegetation—more than 30%—as forest.
Soil was classified into two types: peatland soil and non-peatland soil. As a result of its physical properties, peatland is more prone to fire than other types of soil. Peatland is defined as organic soil formed by the decomposition of organic materials primarily from vegetation. Peatland is highly flammable, particularly during the dry season [25]. The majority of forest and land fires in Indonesia have occurred in peatland regions. In addition, nearly half of Kotawaringin Barat is peatland, which prompted the division of the soil type into two categories.
Table 1. Data required for the forest and land fire susceptibility assessment.
FactorsClassesSource of DataYearExamples of Studies
Distance to river<1 km
1–2 km
2–3 km
3–4 km
4–5 km
>5 km
Geospatial Information Agency of Indonesia2012[26,27,28,29]
Distance to road<1 km
1–2 km
2–3 km
3–4 km
4–5 km
>5 km
Geospatial Information Agency of Indonesia2012[26,27,29,30]
Distance to settlements<1 km
1–2 km
2–3 km
3–4 km
4–5 km
>5 km
Geospatial Information Agency of Indonesia2012[26,27,28,29,30]
Type of SoilPeat
Non-Peat
Ministry of Environment and Forestry2019[28]
LandcoverForest
Plantation
Swamp
Agriculture
Shrubland
Settlements and Buildings
Mining
Water Body
Mangrove
Ministry of Environment and Forestry2019[27,29,31]
Slope0–2% (flat)
3–8% (undulating)
9–15% (moderate sloping)
16–25% (hilly)
26–40 (moderate steep)
>40% (steep)
Land Use Planning of Kalimantan Tengah Province2003[26,27,28,30,31]
Peatland, an organosol, is created when organic material, such as logs or vegetation, decomposes (organic soil). Peatland is ideal for combustion, especially during the dry season, due to its material and characteristics such as waterlogging and high wetness [25]. In peatland regions of Indonesia, particularly in Kotawaringin Barat, where peatlands predominate, forest and land fires have been started.
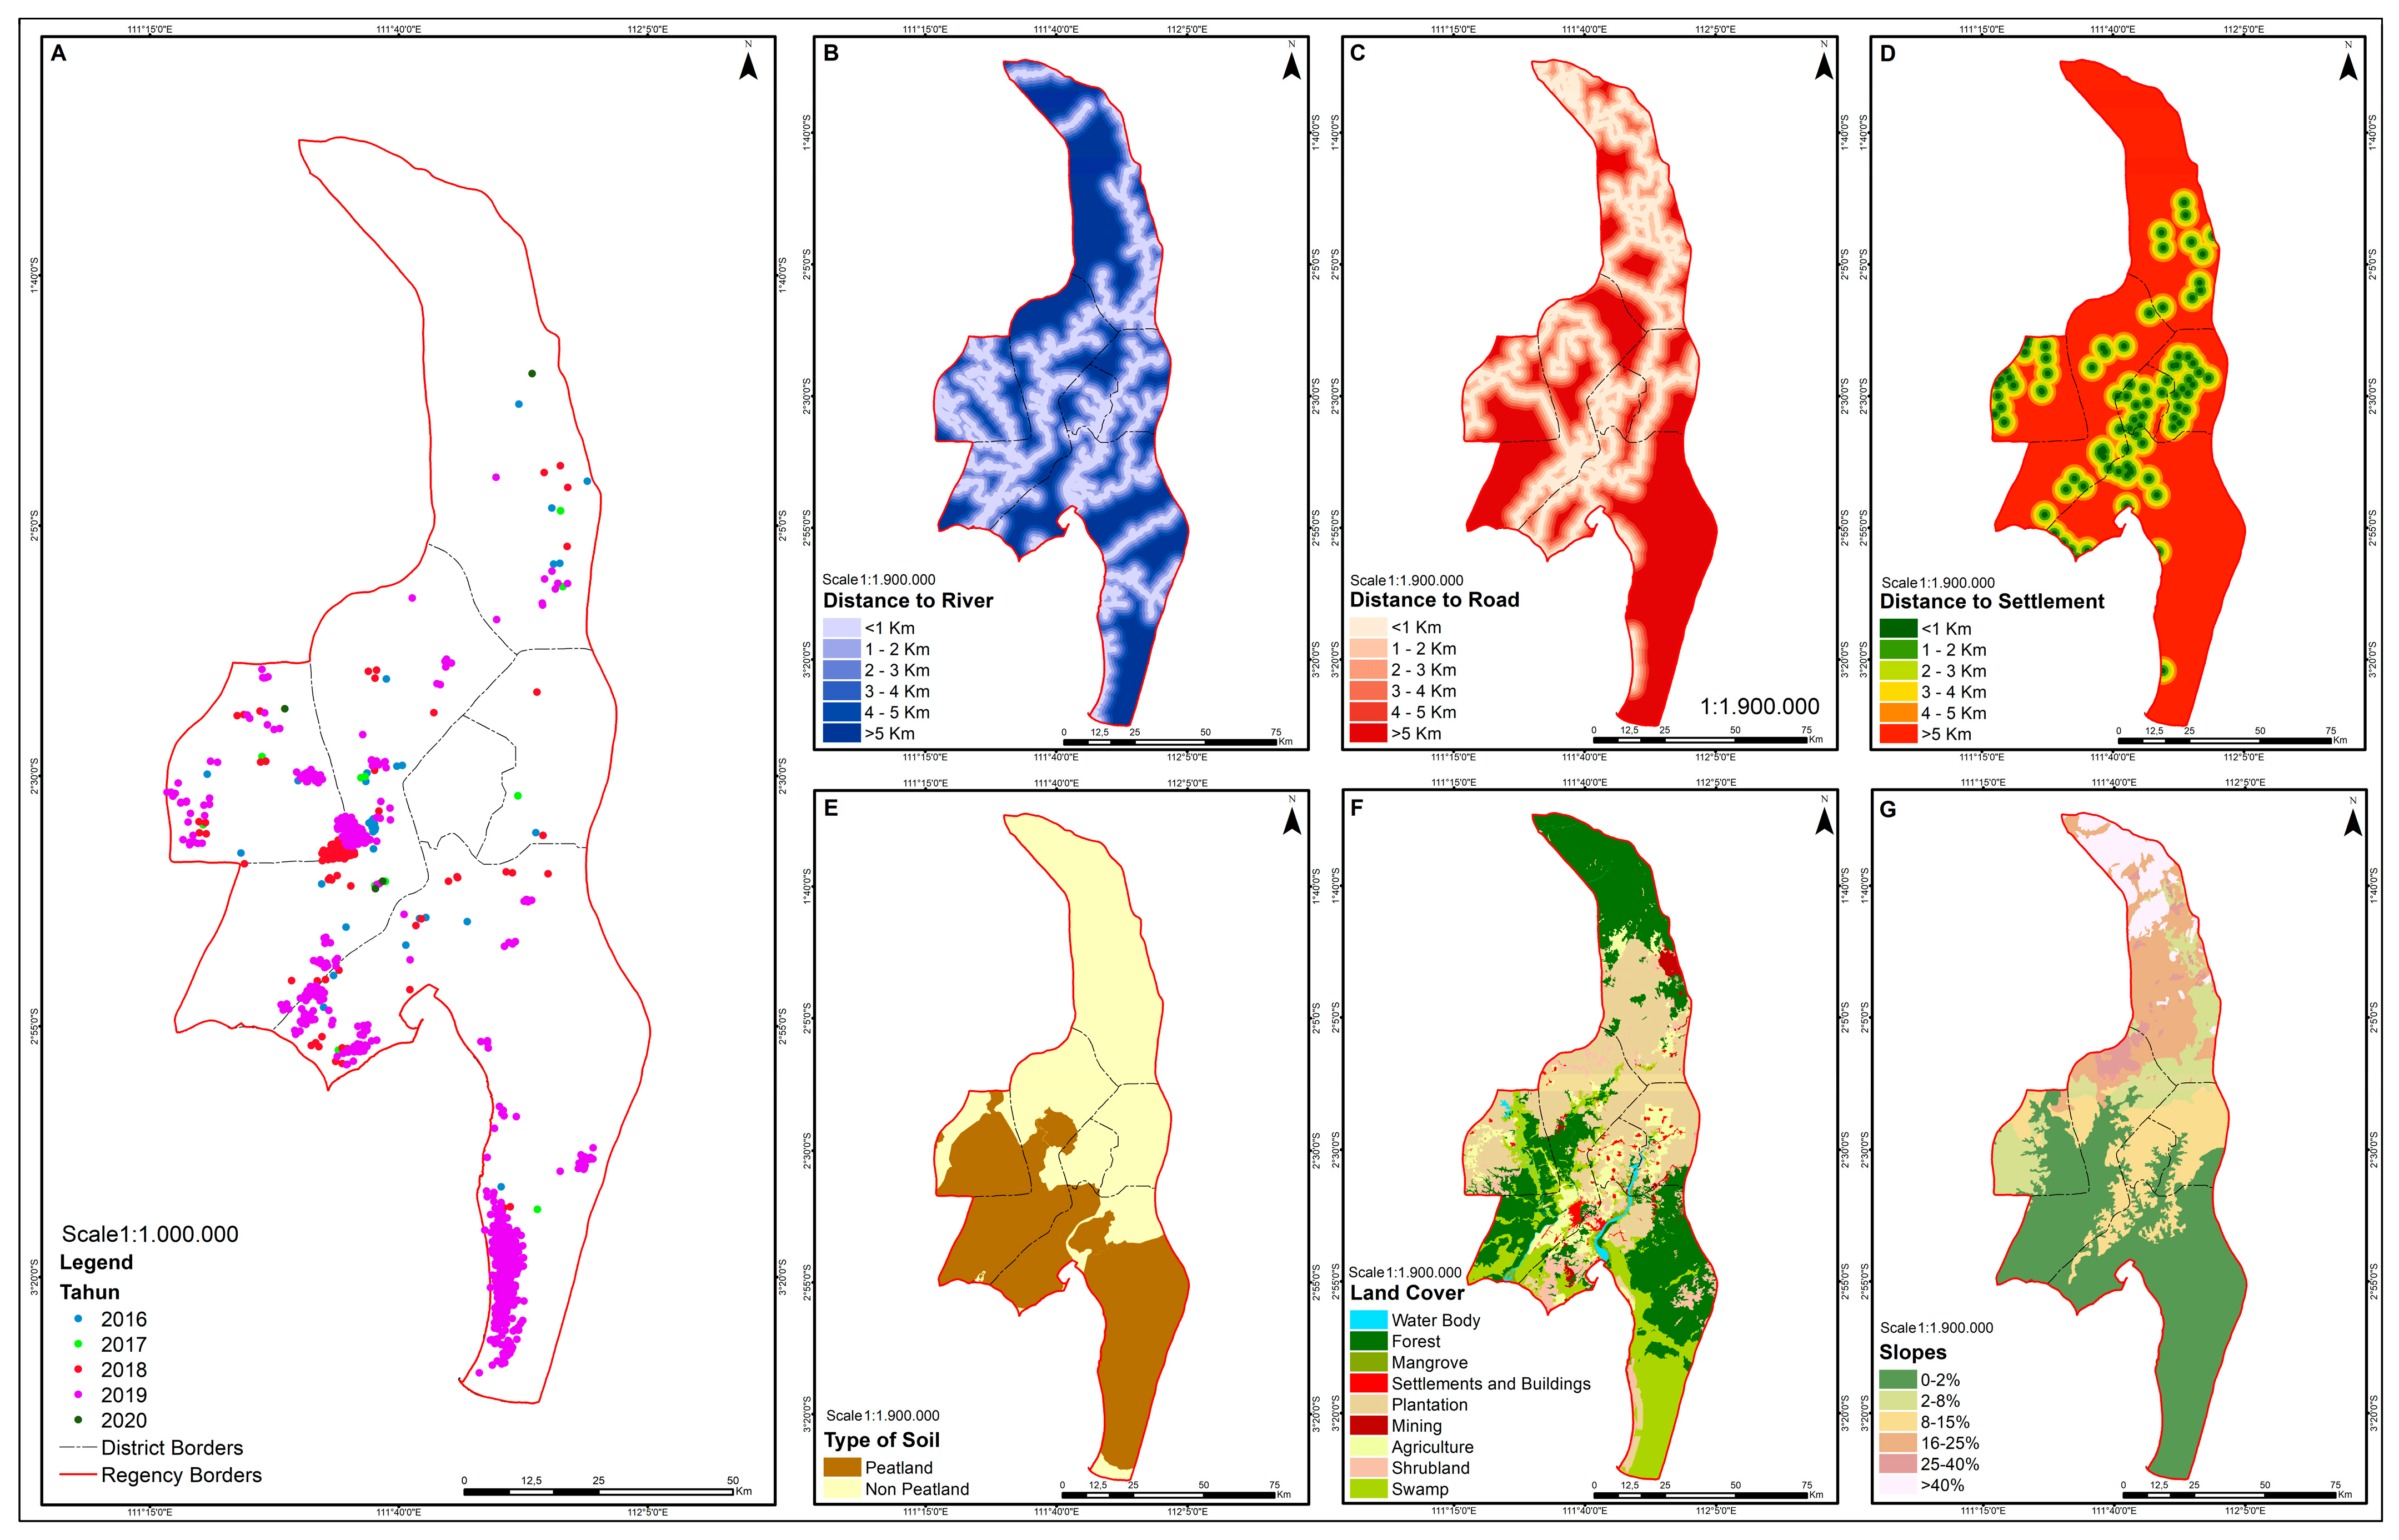
The majority of peatlands are distributed on flatter slopes; thus, a slope map was used to locate distribution in the peatland region, as the slope is one of the major factors influencing fire susceptibility (Figure 3E,G). In general, peatland is found in Indonesia’s lowlands between two major rivers [32]. Unbalanced hydro-topographical conditions, where the total evapotranspiration and outflow is greater than the amount of water present in the peatland, affect peat decomposition [33]. Furthermore, the distances between rivers, roads, and settlements (Figure 3B–D) were obtained from their original data, which included line and point shapefiles. These data represent the accessibility of forested land to human activities [10,34].

2.3. IVM

The information value method is frequently used to forecast and map landslides. This method utilizes a bivariate statistical approach to predict the causes of landslides [35,36]. The IVM method can be used to analyze forest and land fires due to the similarities in spatial analysis of the dependent factors. Hotspot ignition was similar to landslide incidents in both point and area data. Additionally, both landslides and forest and land fires utilize the area to determine the level of susceptibility using a spatial approach. This approach can be used to put out both forest and land fires based on the similarities. The research in [18,37,38] led to changes to the IVM formula, which were as follows:
IVM = ln Hsi / Hs Ai / A
where IVM is the information value method, Hsi is the number of a hotspots in a class of a factor during 2016–2020, Hs is the total hotspots during 2016–2020, Ai is the area of a class of a factor (km2), and A is the area of Kotawaringin Barat (km2). The result can be positive, negative, or zero. The IVM can be interpreted by:
  • If IVM < 0, the possibility of ignition is lower than average;
  • If IVM = 0, the possibility of ignition is equal to the average;
  • If IVM > 0, the possibility of ignition is higher than average.
As a result, the higher the IVM, the greater the possibility of fire. Otherwise, the lower the IVM, the lower the likelihood of fire [18,37,38]. This method was carried out in Microsoft Excel to generate tabular data and in ArcGIS 10.8 to generate a spatial distribution.

2.4. Map Validation

Validation is an important step in forest fire susceptibility mapping because it determines the predictive capability of various modeling methods [28,39]. Researchers have employed a variety of techniques for validating maps, from qualitative or visual techniques, to straightforward quantitative techniques that involve calculating the possible area of forest and land fire for each susceptibility level, and to more sophisticated techniques utilizing success rate curves [40]. Map validation was conducted via a comparison between the resultant map of forest and land fire susceptibility and the independent data of hotspots with a confidence level of >80% from 1 January to 31 December 2015.
The validation of the forest and land fire susceptibility map in the current study was implemented with the AUC-ROC (area under curve receiver operating characteristic). AUC is better than other methods of accuracy tests [41]. To validate the model, the success rate and prediction rate curves were used and the area under the curve was computed using the hotspot dataset with a confidence level of greater than 50% in terms of forest and land fire susceptibility.

3. Results

3.1. Spatial Distribution of Hotspot

Between 2016 and 2020, Kotawaringin Barat had approximately 925 hotspots (see Table 2). Kumai district had the highest risk of forest and land fires, covering 60.32% of the area, followed by Arut Selatan (17.94%) and Kotawaringin Lama (19.02%). These three areas were the most affected, while Pangkalan Lada remained untouched during the same period.
The peatland had the highest value of determinant factors for forest and land fires in Kotawaringin Barat. Peatland is most prevalent in the Kumai, Arut Selatan, and Kotawaringin Lama districts on the southern side of Kotawaringin Barat. This contrasts with Arut Utara, Pangkalan Banteng, and Pangkalan Lada, which have the low hotspot detection rates (Figure 3E). Additionally, the peatland areas were responsible for 90.20% of all forest and land fire incidents in Kotawaringin Barat. The combination of peatland and dry season conditions created ideal conditions for forest and land fires [42,43].

3.2. IVM Result

Six factors were incorporated into the IVM-based fire susceptibility assessment to determine the risk of forest and land fires in Kotawaringin Barat (Table 3). Weight values for each class obtained during the analysis ranged from −4.212 to 1.071. The analysis revealed that fires were most common within 1 to 5 km of rivers and roads, with proximity to these features increasing the likelihood of combustion. Conversely, the distance to settlements had the opposite effect, with fires igniting over 6 km away.
Peatland areas were found to be particularly susceptible to forest and land fires (IVM = 0.662), while wetlands, open fields, swamp shrubs, savannas, dryland farms, and plantations had a positive IVM, indicating a high incidence of forest and land fires in these land cover types. Moreover, due to the significant distribution of peatland and settlements, the flat areas of Kotawaringin Barat (0–2%) were found to be particularly prone to fires (IVM = 0.697).

3.3. The Correlation of Hotspot to the Climate Aspect

Given the strong correlation between forest fires and climate, we used the Ocean Nino Index to analyze the relationship between hotspot ignition and El Niño events (Figure 4A). Our analysis revealed that El Niño events led to a lower total precipitation and fewer rainy days. From 2016 to 2020, the climate was primarily classified as normal (−0.5–0.5), with two weak La Niña events occurring in 2016 and from late 2017 to early 2018. While there was a period of extreme El Niño after 2015, no significant hotspots were detected during this time. Notably, only one large forest and land fire occurred in 2019, despite the absence of an El Niño event.
The El Nino phenomenon had a direct impact on the reduction in precipitation and the number of days without rain. This impact is visually demonstrated in Figure 4B,C, where hotspots are observed in regions experiencing precipitation levels below 100 mm per month and less than 10 rainy days. This finding is consistent with [44], which reported that forest and land fires mainly occurred during periods of 10–11 days without rain. Notably, the precipitation and days without rain are important indicators of the water table conditions in peatlands. High precipitation and rainy days help maintain the wetness of peatlands and keep them water-logged. Maintaining a suitable water table level is a nature-based solution that can prevent forest fires, especially in Kotawaringin Barat.

3.4. Forest and Land Fire Susceptibility

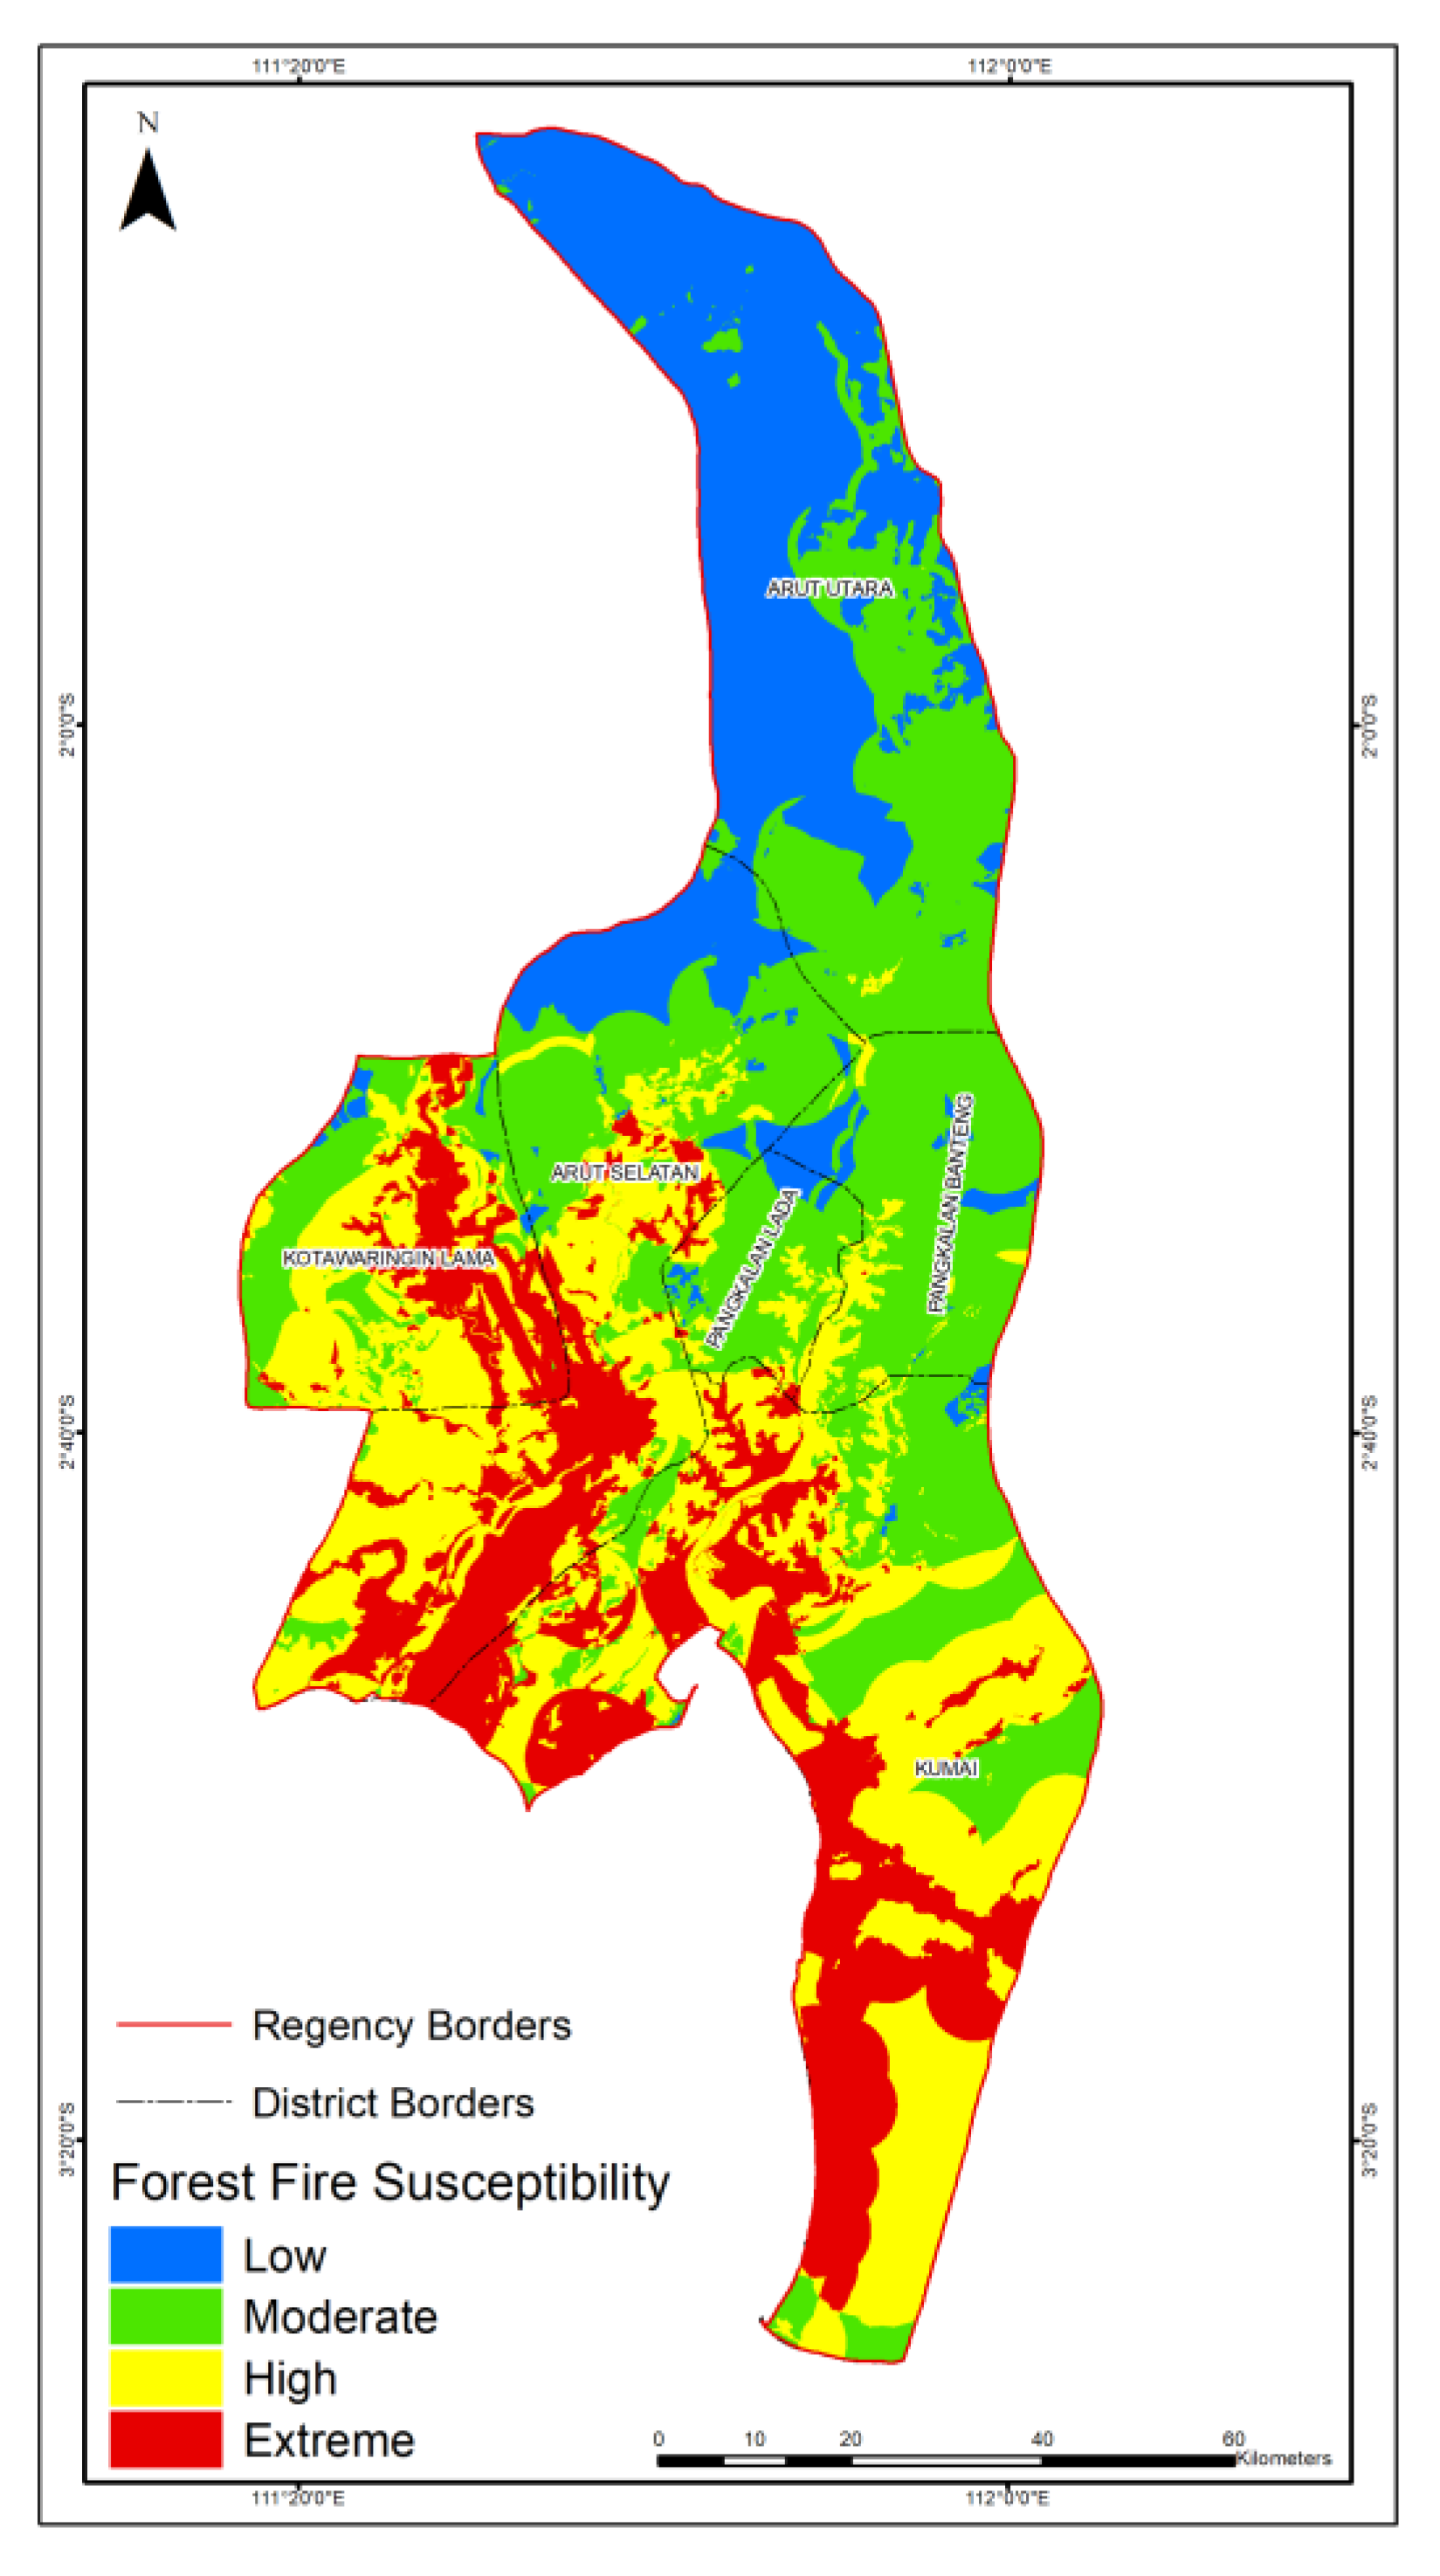
The IVM calculation results were generated from a combination of tabular and spatial data to determine the spatial distribution of forest and land fire susceptibility. The results revealed that 27.97% of the area in Kotawaringin Barat is classified as high risk, while 18.32% is classified as very high risk (Table 4).
The spatial distribution of forest and land fire susceptibility zones is depicted in Figure 5. The majority of highly vulnerable areas are located in the west and south of the study area. These regions reflect the distribution of peatlands, plantations, and settlements. In contrast, the northern portion of the study area is dominated by areas with a low to moderate risk of wildfire. As a result of the distribution of low and moderate risk in the northern region, dense vegetation covers that region. These classes were located in a region with a slope greater than 16%, indicating a high altitude. There are also primary and secondary dryland forest regions present in this region.

3.5. Validation Result

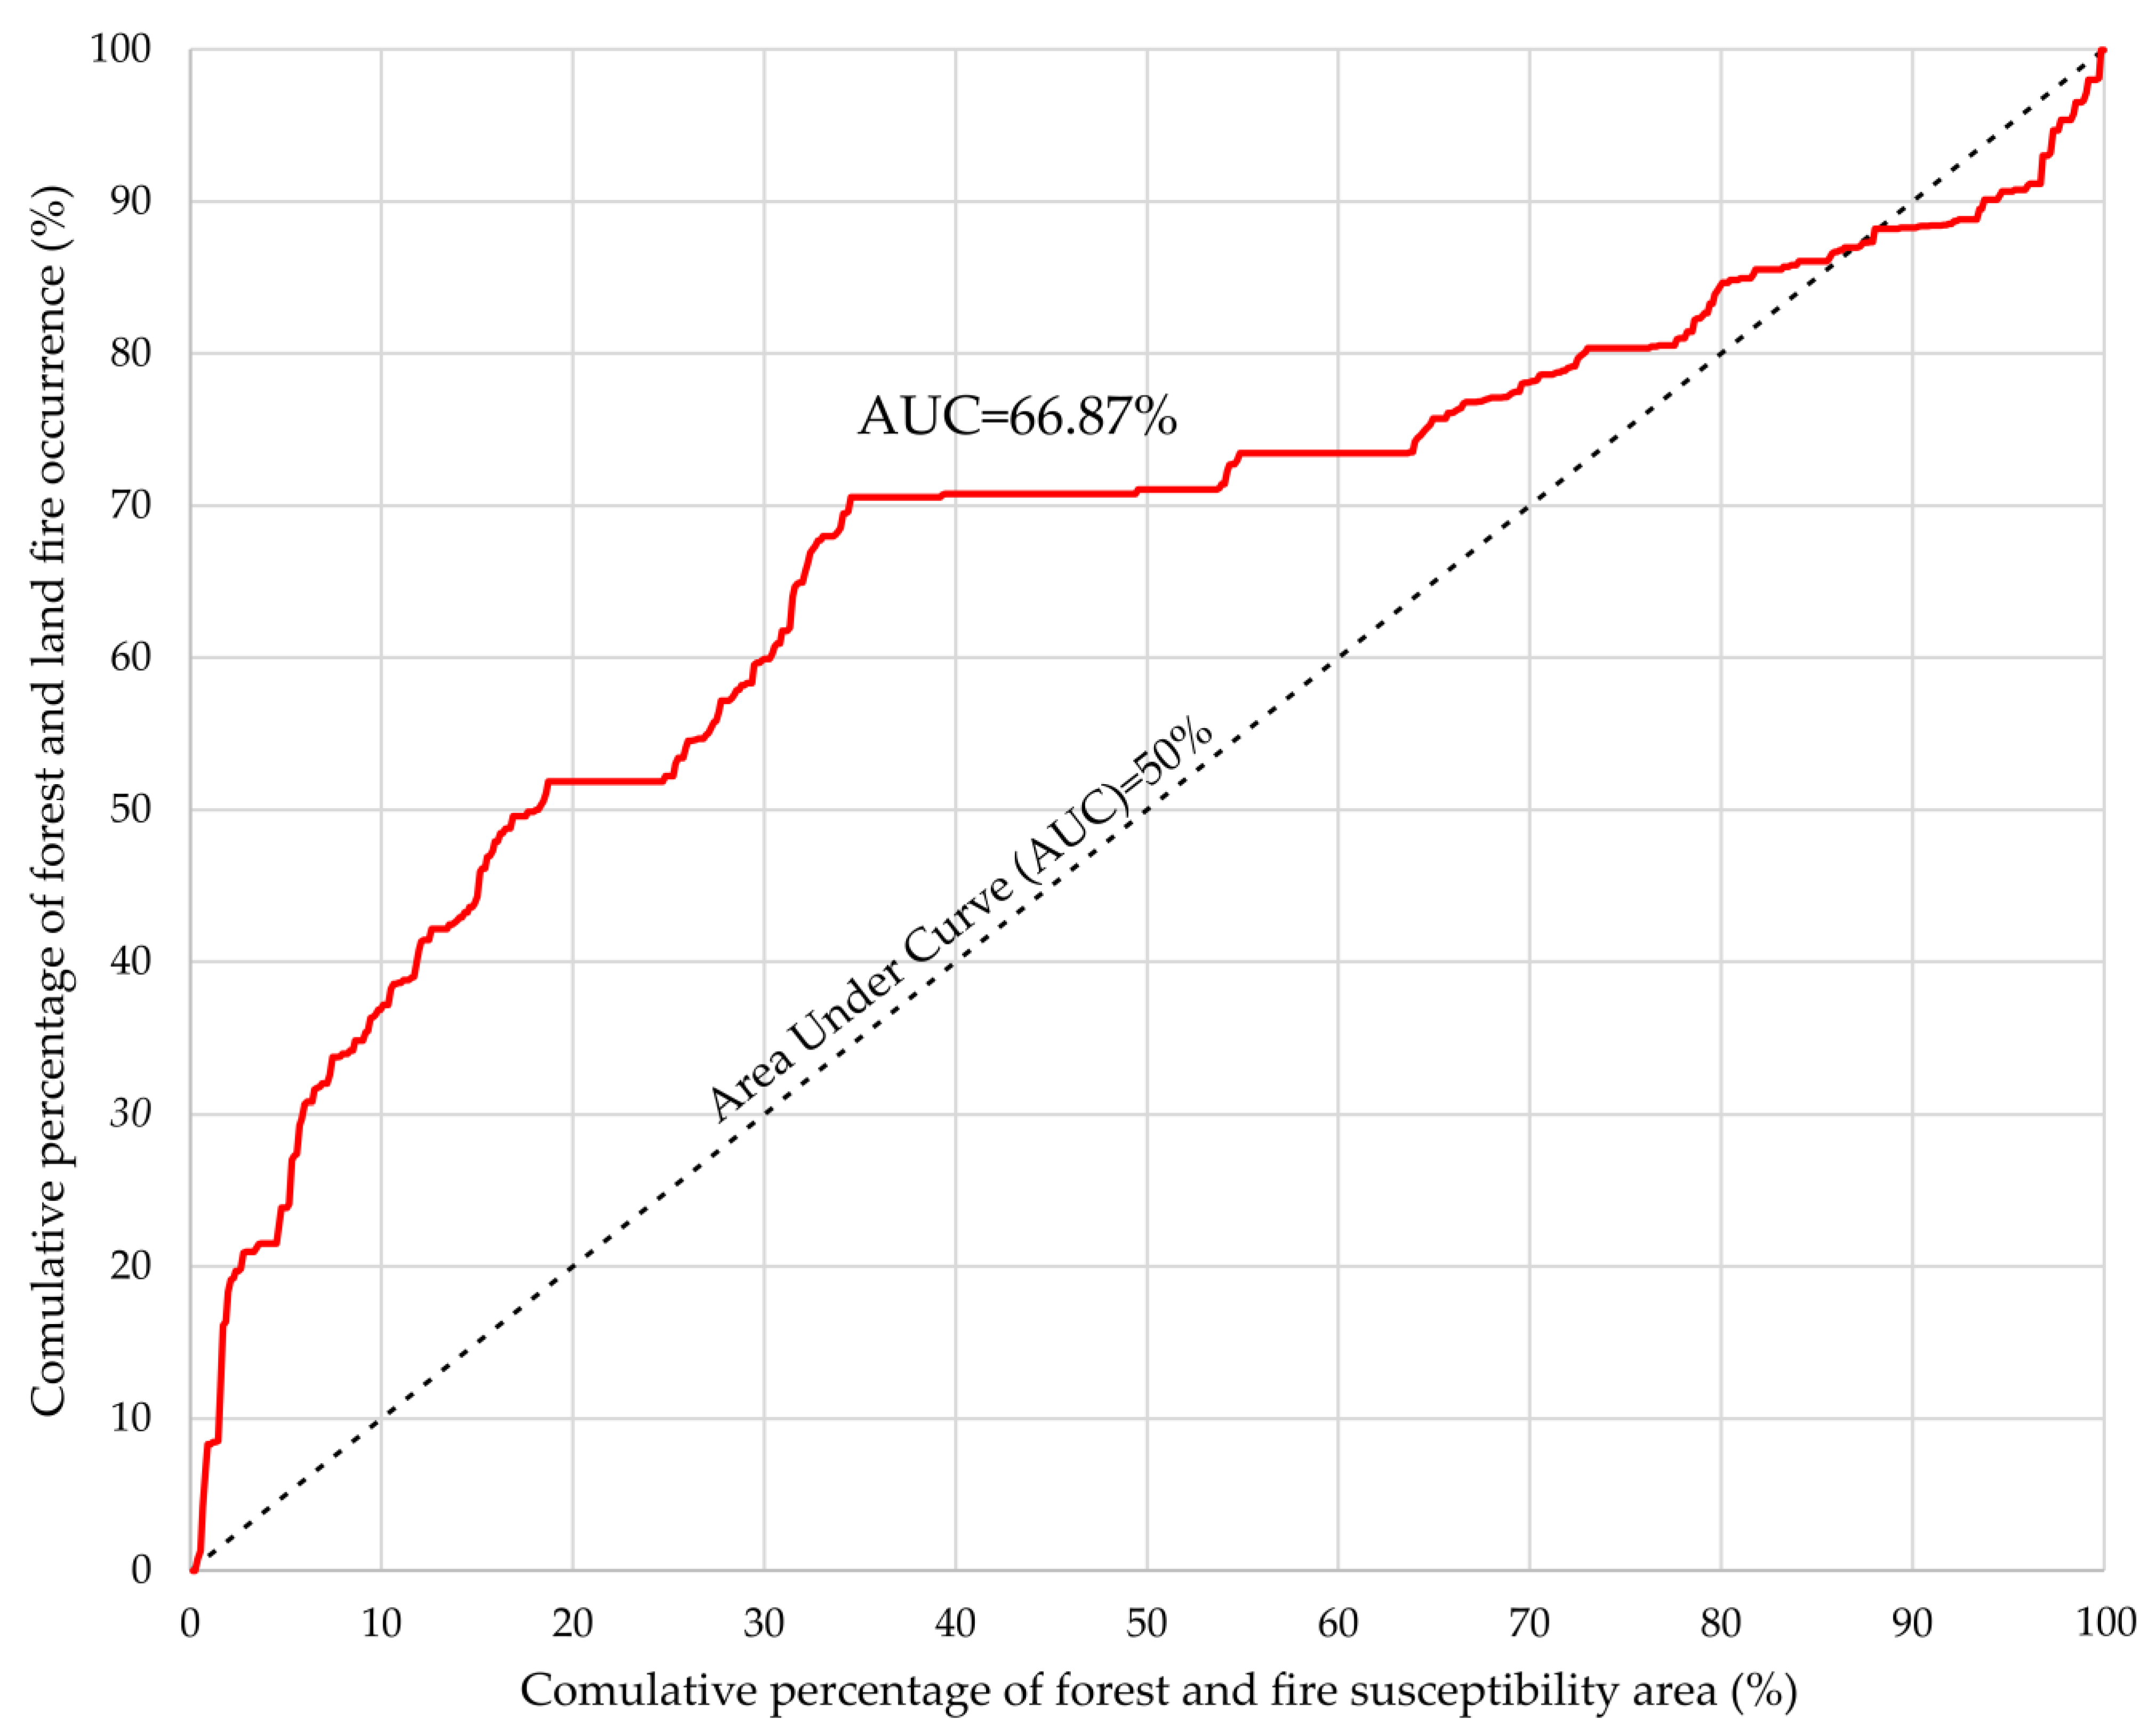
Validation of the IVM was undertaken to assess the accuracy of the prediction. As shown in Figure 6, an evaluation revealed that the AUC of the model of forest and land fire susceptibility map was 66.87%. Figure 6 indicates that approximately 70% of forest and land fires occurred in the top 33% of susceptible areas. This indicates that the map can serve as a reliable resource for the spatial prediction of vulnerable areas. Nevertheless, according to Figure 6, we still observe fire occurrences at susceptibility levels below 60%. This indicates that the model predictions are more accurate in areas with a high-to-extremely high susceptibility level but less accurate in safer areas.

4. Discussion

Forest and land fires are a major cause of environmental damage, leading to the degradation of natural ecosystems, increases in biodiversity loss, respiratory health problems for residents, and exacerbation of global warming through the release of excessive greenhouse gases [45,46]. To mitigate these negative impacts, identifying susceptibility zones is critical. In this study, the information value method (IVM) was utilized to identify vulnerable areas for forest and land fires in Kotawaringin Barat regency. This approach involves analyzing forest and land fire densities for each causal factor to determine the spatial relationships between them. The study focused on one of the region’s most vulnerable areas and examined six causal factors. The model utilized a total of 1194 hotspot locations recorded between 1 January 2016 and 31 December 2020, and the accuracy of the results was evaluated using hotspot data recorded between 1 January 2015 and 31 December 2015. Effective risk mitigation measures can be implemented to reduce the incidence and severity of forest and land fires in susceptible areas by identifying susceptibility zones through the IVM.
It is evident that the natural causes of forest and land fires were exacerbated by human influences in the study area. Due to the presence of organic matter, peatlands are widely recognized as the most flammable (IVM = 0.667) soil type (due to their high organic matter content). Due to the seasonal variation in groundwater, the high permeability of peatlands results in a fluctuating water table. The ground water level (GWL) can indicate the wetness and moisture of peatland, which are essential data for determining the ease of fire ignition. Moreover, the GWL can influence the transition of a surface fire to an underground fire, a characteristic of peatland forest and land fires [47]. Underground fires are harder to detect and extinguish than surface fires.
The ground water level (GWL) is an important factor in determining the moisture content of peatland and its susceptibility to forest and land fires. In this research, the GWL data were substituted by rainfall and the number of days without rain due to limitations in the GWL data. During periods of high rainfall and frequent rainy days, the GWL tends to be maintained, and this has been demonstrated to be an effective means of reducing the incidence of hotspots in vulnerable areas [14]. However, while the GWL is a comprehensive measure that can describe peatland conditions, it may not be as effective in non-peatland areas. Therefore, future research should explore other measures, such as the land surface temperature or the normalized difference moisture index (NDMI), which could provide more accurate and reliable information on moisture levels in both peatland and non-peatland areas. By using a variety of indicators to assess fire risk, it will be possible to develop more effective management strategies that can mitigate the negative impacts of forest and land fires.
The study showed that swamp areas were the most vulnerable to forest and land fires, with an IVM value of 1.071, followed by shrubland, which had an IVM value of 0.024. Both land covers are strongly associated with land conversion from forest to agricultural land and plantations. A characteristic of their cover is a low vegetation density, which is a potential fuel to ignite a forest and land fire, and they have poor ability to maintain the soil’s wetness or GWL [48]. In contrast, forested areas provided a negative IVM value (−1.239), indicating that they play a vital role in preventing hotspots. The presence of a forest canopy helps to maintain humidity and stabilize the soil moisture, which makes it less susceptible to fire. Therefore, preserving forests is crucial to prevent forest and land fires, and degraded forests should be restored as a part of the fire risk management in Kotawaringin Barat Regency. It was observed that forest and land fires were more common in areas that were previously forested but were converted for different land uses [25]. Therefore, it is necessary to identify areas with a high risk of forest and land fires and implement appropriate measures to prevent and control them.
Agricultural activities also influence forest and land fires (IVM= 0.007). Risk prevention measures such as socialization, training, and coaching on appropriate land clearing without burning the land must be implemented. Special attention must be addressed to peatland areas. Peatland humidity must be balanced with the preservation of its water level in agricultural areas. These efforts have been carried out by the Peatland and Mangrove Restoration Agency through three major programs known as the 3Rs (rewetting, revegetation, and revitalization). Rewetting is the process of keeping the peatland wet by blocking canals, revegetation refers to the restoration of a degraded area, and revitalization refers to the improvement in community welfare. These efforts must be increased in intensity because restoration of peatland not only restores its function but also restores the land cover and consequently affects the local people’s economy through various programs. As a result, it can minimize peat degradation, prevent forest and land fires, and be beneficial to biodiversity [49].
Land use, land status, distance to roads, and settlements were influencing factors from an anthropogenic aspect. The location of hotspots indicates that approximately 67% of forest and land fire incidents were caused by human activities. The main anthropogenic factor influencing fire occurrences is land cover. Significant forest harvesting and conversion of abandoned land to palm oil plantations were the primary human causes of forest and land fires. These activities necessitate access to transportation networks, such as roads, rivers, or canal networks [34,48,50].
Rivers and manufactured canals are associated with concentrated human activity. These areas are widely used as the main transportation for harvesting palm oil or teak resulting from the plantation, and people use rivers and roads to access their agricultural sites. As a result of more rivers and canals, forest and land fires are induced.
Some hotspot incidents occurred in remote areas, but these areas are easily accessible by river networks. Therefore, rivers and roads contributed to the ignition of forest and land fires [10,34]. This contradicts the required settlement distance. The majority of forest and land fires occurred far from human habitation and were unmonitored by authorities. The remotest regions are also highly amenable to agriculture and plantations. This statement corresponds to the states where the majority of agricultural land is located far from populated areas [50].
The temporal variation in hotspots was primarily influenced by climatic factors. El Nino exacerbated a series of massive forest and land fire incidents in Indonesia in 2002, 2005, 2006, 2009, 2013, and 2015, as a result of very low precipitation and very low air humidity [51]. The El Nino period increased the number of days without rain and increased the land surface temperature, resulting in an increase in hotspots [52]. Due to the decrease in wetness of the land surface, the lack of rainfall created the potential for combustion [44,52].
With an IVM = 0.697, flat slopes (0–2%) were the most vulnerable to fire ignition and accounted for 96.43% of fires in Kotawaringin Barat. Flat slopes are correlated with peatland distribution, with 90.70% of forest and land fires spreading in peatland areas. This differs from the results of forest and land fires in other countries, such as Switzerland, where fires start in steep and high elevation areas [53]. The topography is responsible for the formation of the soil and the climatic conditions that affect vegetation. Fires are less likely as the slope and elevation increase. This could be due to differences in forest coverage and population distribution [54]. Kotawaringin Barat is characterized by these conditions, and is covered by forest at high elevations and on steep slopes and contains mostly rural areas. This reflects the susceptibility of the northern areas to forest and land fires. This pattern is in contrast to the research in [30], where slope was found to influence the fire severity. However, generally in Borneo Island, this condition is different than other regions.
The likelihood of forest and land fires in Kotawaringin Barat is influenced by topographical factors. They also shaped the landform that is dominated by peatland and influenced the type of vegetation. Furthermore, this has an impact on population distribution, with people tending to live in the lower areas [54]. Population distribution can have an impact on mass transportation, including transportation via roads and rivers. All these factors are linked to the ignition of forest and land fires, particularly in Kotawaringin Barat.
The implementation of the IVM for landslide susceptibility had good accuracy; some studies on the IVM demonstrated an accuracy rate of 81.8% [38], while others demonstrated rates of 83% [18] and 82% [37]. In contrast, the implementation of the IVM for forest and land fire susceptibility was the opposite, with an accuracy rate of 66.87%. Furthermore, other recent studies on forest and land fire susceptibility have found that the VIKOR method was 89.54% accurate, the TOPSIS method was 86.94% accurate, and the AHP method was 88.99% accurate [55,56]. The accuracy assessment shows an overall accuracy level of 66.87% using the curve (Figure 6). This indicates that the model can still be used as a reference for mitigation measures with some precaution. Additional variables for future research would be important for improving the result, e.g., spatial distribution, the temporal variation in GWL, and rainfall data extracted from well-distributed rainfall stations. Figure 6 shows that most fire incidents are concentrated in the top 33% of the susceptible area, which means that the very-high and high susceptibility classes have the most fire occurrences. However, special attention must be paid to low level susceptibility areas where fires occurred. The model’s predictions can be improved by using longer records of fire incident data.
In addition, the use of the IVM might be limited to the region of Kotawaringin Barat, which is a limitation of this study. As a result, the variables included in the modeling were limited. The next study should improve the variables, such as rainfall, the GWL, and people’s fire behavior, to provide a more comprehensive perspective on the forest and land fire susceptibility map. Furthermore, the results from other hotspot data sources, such as VIIRS, AVHRR, and NOAA, must be compared. The updated process of creating a landcover map was prompted by the research area’s inadequate free cloud. Based on this situation, using multispectral classification, it was impossible to create a landcover map. As a result, other triggering factors for forest and land fires should be included in future research to comprehensively assess the forest and land fire proclivity and provide a “real” susceptibility map.
The benefits of the statistical model used in this study are that it is relatively simple and east to implement for operational uses. The IVM can be used to model forest and land fires in any area or region using proportional data between the size of the study area and the number of hotspots. However, certain conditions and adjustments have to be made.

5. Conclusions

Forest and land fire susceptibility mapping is one of the most important tools for forest and land fire risk reduction. It can further provide a scientific foundation for authorities to conduct contingency plans for areas prone to forest and land fires. The findings indicate that the Kotawaringin Barat regency is extremely susceptible to forest and land fires, which is demonstrated by approximately 4422.71 km2 (46.30%) of the area being classified as high or very high susceptibility to forest and land fires. Peatlands are highly susceptible to burning, particularly due to their high organic content, making them the most sensitive areas among the high and very high risk area for forest and land fires. Thus, the humidity and the ground water level (GWL) of peatlands are pivotal factors in preventing fires. In this research, due to the lack of GWL data, we attempted to use rainfall data and the number of days without rainfall as a substitute. El Nino data were also helpful in confirming the exacerbation of forest and land fires due to low humidity levels. In addition, by using more climatic stations to better understand the spatial variation in rainfall, the accuracy could be raised further by adding detailed information about rainfall. Additionally, the validation process would benefit greatly from the use of GWL data and connecting it to rainfall data.
Six natural and human factors were combined with actual data on forest and land fire incidents in this study using the IVM method, yielding an accuracy (AUC) of 66.87%. Most fire occurrences were concentrated in the top 33% of susceptible areas. IVM calculations (Table 3 revealed that the pattern of hotspot variability is useful for assisting decision makers in implementing disaster mitigation measures. The data, for example, can be used to regulate human activities that increase the risk of fire or to identify areas with high levels of smoke pollution that endanger respiratory health.

Author Contributions

Conceptualization, all authors; methodology D.S.H. and P.W.; software, A.N.I.; formal analysis, all authors; writing—original draft preparation, A.N.I.; writing—review and editing, D.S.H. and P.W.; supervision, D.S.H. and P.W.; visualization, A.N.I.; funding acquisition, D.S.H. All authors have read and agreed to the published version of the manuscript.

Funding

The Indonesian Endowment Funds for Education (LPDP) provided a scholarship to A.N.I. (Shcolarship ID 20200611551919) and funding for data acquisition, and Universitas Gadjah Mada provided financial support for the publication charge (APC Program) and the proof reading charge through the “Rekognisi Tugas Akhir” program (contract number 2920/UNI/DITLIT/Dit-Lit/PT.0105/2022). This manuscript is a part of a master’s thesis of the first author. Extensive work was performed on additional data, modification of variables, the choice of methodology, the spatial data analysis, the accuracy assessment, and re-interpretation of the results.

Data Availability Statement

The hotspot datasets 2015–2020 can be found at (https://firms.modaps.eosdis.nasa.gov/active_fire accessed on 16 September 2021. This dataset is available upon request from the author. The number of burned area obtained from http://sipongi.menlhk.go.id accessed on 9 November 2021. The data such as Rivers, Roads, and Settlements obtained from https://tanahair.indonesia.go.id/portal-web accessed on 11 October 2020. Type of soil and landcover map obtained from http://webgis.menlhk.go.id/login accessed on 3 March 2021. Slope data obtained from the Land Use Planning of Kotawaringin Barat Regency as a representative of Land Use Planning of Kalimantan Tengah Province on 15 July 2017. Ocean Nino Indeks can be found at https://origin.cpc.ncep.noaa.gov/products/analysis_monitoring/ensostuff/ONI_v5.php accessed on 17 February 2021. Rainy days and rainfall data information can be found at the https://kobarkab.bps.go.id/ accessed on 8 May 2021. Fo futher information about the access data, specific method, or code used to support the findings of this research, please do not hesitate to contact the corresponding author. They will provide the materials available to you upon a reasonable request.

Acknowledgments

This current contribution is part of the first author’s master’s thesis. The authors would also like to thank the Indonesian Endowment Funds for Education (LPDP) for providing the first author with a master scholarship.

Conflicts of Interest

The authors declare there are no conflict of interest. The funders had no role in the design of the study; in collecting data; analyses, or interpretation of data; in the manuscript or in the decision to publish the result.

References

  1. Hirschberger, P. Forests Ablaze Cause and Effects of Global Forest Fires; WWF: Berlin, Germany, 2016. [Google Scholar]
  2. Robinne, F.N. Impacts of Disasters on Forests, in Particular Forest Fires; UNFFS: Trabizond, Turkey, 2021. [Google Scholar]
  3. Tacconi, L. Kebakaran Hutan Di Indonesia: Penyebab, Biaya Dan Implikasi Kebijakan; Center for International Forestry Research (CIFOR): Bogor, Indonesia, 2003; Volume 38. [Google Scholar]
  4. Thoha, A.S.; Sofyan, M.; Ahmad, A.G. Spatio-Temporal Distribution of Forest and Land Fires in Labuhanbatu Utara District, North Sumatera Province, Indonesia. IOP Conf. Ser. Earth Environ. Sci. 2020, 454, 012081. [Google Scholar] [CrossRef]
  5. Albar, I.; Jaya, I.N.S.; Saharjo, B.H.; Kuncahyo, B.; Vadrevu, K.P. Spatio-Temporal Analysis of Land and Forest Fires in Indonesia Using MODIS Active Fire Dataset; Springer International Publishing: Berlin/Heidelberg, Germany, 2018; pp. 105–127. ISBN 9783319674742. [Google Scholar]
  6. Ardiansyah, M.; Boer, R.; Situmorang, A.P. Preface: International Conference on Recent Trends in Physics (ICRTP 2016). J. Phys. Conf. Ser. 2016, 755, 1–8. [Google Scholar]
  7. Hartmann, F.; Merten, J.; Fink, M.; Faust, H. Indonesia’s Fire Crisis 2015 A Twofold Perturbation on the Ground. Pac. Geogr. 2018, 49, 1–8. [Google Scholar] [CrossRef]
  8. Dohong, A.; Aziz, A.A.; Dargusch, P. A Review of the Drivers of Tropical Peatland Degradation in South-East Asia. Land Use Policy 2017, 69, 349–360. [Google Scholar] [CrossRef]
  9. Ibrahim; Harlen; Sukendi; Siregar, Y.I. Impact of Forest Fire in Peat Land on Land Properties in Pelalawan District Region. IOP Conf. Ser. Earth Environ. Sci. 2019, 383, 012024. [Google Scholar] [CrossRef]
  10. Herawati, H.; Santoso, H. Tropical Forest Susceptibility to and Risk of Fire under Changing Climate: A Review of Fire Nature, Policy and Institutions in Indonesia. For. Policy Econ. 2011, 13, 227–233. [Google Scholar] [CrossRef]
  11. Ayuningrum, R.; Nurhayati, A.D. Analysis of the Distribution of Hotspot and Burn Area in Muaro Jambi District, Jambi Province. IOP Conf. Ser. Earth Environ. Sci. 2022, 959, 012057. [Google Scholar] [CrossRef]
  12. Purnomo, E.P.; Zahra, A.A.; Malawani, A.D.; Anand, P. The Kalimantan Forest Fires: An Actor Analysis Based on Supreme Court Documents in Indonesia. Sustainability 2021, 13, 2342. [Google Scholar] [CrossRef]
  13. Agus, C.; Azmi, F.F.; Widiyatno; Ilfana, Z.R.; Wulandari, D.; Rachmanadi, D.; Harun, M.K.; Yuwati, T.W. The Impact of Forest Fire on the Biodiversity and the Soil Characteristics of Tropical Peatland. In Climate Change Management; Springer International Publishing: Berlin/Heidelberg, Germany, 2019; pp. 287–303. ISBN 9783319986814. [Google Scholar]
  14. Salsabila, H.N.; Sahitya, A.F.; Mahyatar, P. Spatio-Temporal Pattern Analysis of Forest Fire Event in South Kalimantan Using Integration Remote Sensing Data and GIS for Forest Fire Disaster Mitigation. IOP Conf. Ser. Earth Environ. Sci. 2020, 540, 012011. [Google Scholar] [CrossRef]
  15. Shiodera, S.; Atikah, T.D.; Apandi, I.; Seino, T.; Haraguchi, A.; Rahajoe, J.S.; Kohyama, T.S. Tropical Peatland Ecosystems. In Tropical Peatland Ecosystems; Springer: Berlin/Heidelberg, Germany, 2015; pp. 1–651. ISBN 9784431556817. [Google Scholar]
  16. Sipongi Luas Kebakaran Hutan Dan Lahan Kabupaten/Kota Provinsi Kalimantan Tengah. Available online: http://sipongi.menlhk.go.id/ (accessed on 9 November 2021).
  17. BPS-Kotawaringin Barat. Kotawaringin Barat Regency in Figures; BPS-Kotawaringin Barat: Pangkalan Bun, Indonesia, 2016. [Google Scholar]
  18. Hadmoko, D.S.; Lavigne, F.; Samodra, G. Application of a Semiquantitative and GIS-Based Statistical Model to Landslide Susceptibility Zonation in Kayangan Catchment, Java, Indonesia. Nat. Hazards 2017, 87, 437–468. [Google Scholar] [CrossRef]
  19. Gizatullin, A.T.; Alekseenko, N.A. Prediction of Wildfires Based on the Spatio-Temporal Variability of Fire Danger Factors. Geogr. Environ. Sustain. 2022, 15, 31–37. [Google Scholar] [CrossRef]
  20. Xu, W.; Yu, W.; Jing, S.; Zhang, G.; Huang, J. Debris Flow Susceptibility Assessment by GIS and Information Value Model in a Large-Scale Region, Sichuan Province (China). Nat. Hazards 2013, 65, 1379–1392. [Google Scholar] [CrossRef]
  21. Chen, W.; Li, W.; Hou, E.; Zhao, Z.; Deng, N.; Bai, H.; Wang, D. Landslide Susceptibility Mapping Based on GIS and Information Value Model for the Chencang District of Baoji, China. Arab. J. Geosci. 2014, 7, 4499–4511. [Google Scholar] [CrossRef]
  22. Corominas, J.; van Westen, C.; Frattini, P.; Cascini, L.; Malet, J.P.; Fotopoulou, S.; Catani, F.; Van Den Eeckhaut, M.; Mavrouli, O.; Agliardi, F.; et al. Recommendations for the Quantitative Analysis of Landslide Risk. Bull. Eng. Geol. Environ. 2014, 73, 209–263. [Google Scholar] [CrossRef]
  23. Verwer, C.; Van Der Meer, P.J. Carbon Pools in Tropical Peat Forest; Alterra: Wageningen, The Netherlands, 2010. [Google Scholar]
  24. Giglio, L.; Schroeder, W.; Hall, J.V.; Justice, C.O. MODIS Collection 4 Active Fire Product User’s Guide Table of Contents. Revisión B; Department of Geographical Sciences, University of Maryland: College Park, MD, USA, 2018; Volume 1. [Google Scholar]
  25. Adinugroho, W.C.; Suryadiputra, I.N.N.; Saharjo, B.H.; Siboro, L. Manual for the Control of Fire in Peatlands and Peatland Forest; Wetland International-Indonesia Programme: Bogor, Indonesia, 2005; ISBN 979993737X. [Google Scholar]
  26. Boonyanuphap, J.; Suratmo, F.G.; Jaya, I.N.S. GIS-Based Method In Developing Wildfire Risk Model (Case Study in Sasamba, East Kalimantan, Indonesia). J. Manaj. Hutan Trop. 2001, VII, 33–45. [Google Scholar]
  27. Ghorbanzadeh, O.; Blaschke, T.; Gholamnia, K.; Aryal, J. Forest Fire Susceptibility and Risk Mapping Using Social/Infrastructural Vulnerability and Environmental Variables. Fire 2019, 2, 50. [Google Scholar] [CrossRef]
  28. Ljubomir, G.; Pamučar, D.; Drobnjak, S.; Pourghasemi, H.R. Modeling the Spatial Variability of Forest Fire Susceptibility Using Geographical Information Systems and the Analytical Hierarchy Process. In Spatial Modeling in GIS and R for Earth and Environmental Sciences; Elsevier: Amsterdam, The Netherlands, 2019; pp. 337–369. ISBN 9780128152263. [Google Scholar]
  29. Thoha, A.S.; Triani, H. A Spatial Model of Forest and Land Fire Vulnerability Level in the Dairi District, North Sumatra, Indonesia. Biodiversitas 2021, 22, 3319–3326. [Google Scholar] [CrossRef]
  30. Mukti, A.; Prasetyo, L.B.; Rushayati, S.B. Mapping of Fire Vulnerability in Alas Purwo National Park. Procedia Environ. Sci. 2016, 33, 290–304. [Google Scholar] [CrossRef]
  31. Lamat, R.; Kumar, M.; Kundu, A.; Lal, D. Forest Fire Risk Mapping Using Analytical Hierarchy Process (AHP) and Earth Observation Datasets: A Case Study in the Mountainous Terrain of Northeast India. SN Appl. Sci. 2021, 3, 1–15. [Google Scholar] [CrossRef]
  32. Julzarika, A.; Aditya, T.; Subaryono, S.; Harintaka, H. Dynamics Topography Monitoring in Peatland Using the Latest Digital Terrain Model. J. Appl. Eng. Sci. 2022, 20, 246–253. [Google Scholar] [CrossRef]
  33. Nasrul, B.; Maas, A.; Utami, S.N.H.; Nurudin, M. The Relationship between Surface Topography and Peat Thickness on Tebing Tinggi Island, Indonesia. Mires Peat 2020, 26, 1–21. [Google Scholar] [CrossRef]
  34. Prayoto; Ishihara, M.I.; Firdaus, R.; Nakagoshi, N. Peatland Fires in Riau, Indonesia, in Relation to Land Cover Type, Land Management, Landholder, and Spatial Management. J. Environ. Prot. 2017, 8, 1312–1332. [Google Scholar] [CrossRef]
  35. Yin, K.L.; Yan, T.Z. Statistical Prediction Models For Slope Instability of Metamorphosed Rocks. In Proceedings of the 5th International Symposium on Landslide, Lausanne, Switzerland, 10–15 July 1988; Volume 2, pp. 1269–1272. [Google Scholar]
  36. Jade, S.; Sarkar, S. Statistical Models for Slope Instability Classification. Eng. Geol. 1993, 36, 91–98. [Google Scholar] [CrossRef]
  37. Ba, Q.; Chen, Y.; Deng, S.; Wu, Q.; Yang, J.; Zhang, J. An Improved Information Value Model Based on Gray Clustering for Landslide Susceptibility Mapping. ISPRS Int. J. Geo-Inform. 2017, 6, 18. [Google Scholar] [CrossRef]
  38. Wubalem, A.; Meten, M. Landslide Susceptibility Mapping Using Information Value and Logistic Regression Models in Goncha Siso Eneses Area, Northwestern Ethiopia. SN Appl. Sci. 2020, 2, 1–19. [Google Scholar] [CrossRef]
  39. Pourghasemi, H.R.; Beheshtirad, M.; Pradhan, B. A Comparative Assessment of Prediction Capabilities of Modified Analytical Hierarchy Process (M-AHP) and Mamdani Fuzzy Logic Models Using Netcad-GIS for Forest Fire Susceptibility Mapping. Geomatics Nat. Hazards Risk 2016, 7, 861–885. [Google Scholar] [CrossRef]
  40. Hadmoko, D.S.; Lavigne, F.; Sartohadi, J.; Hadi, P. Winaryo Landslide Hazard and Risk Assessment and Their Application in Risk Management and Landuse Planning in Eastern Flank of Menoreh Mountains, Yogyakarta Province, Indonesia. Nat. Hazards 2010, 54, 623–642. [Google Scholar] [CrossRef]
  41. Huang, J.; Ling, C.X. Using AUC and Accuracy in Evaluating Learning Algorithms. IEEE Trans. Knowl. Data Eng. 2005, 17, 299–310. [Google Scholar] [CrossRef]
  42. Thoha, A.S.; Sajarho, B.H.; Boer, R.; Ardiansyah, M. Forest and Land Fires Hazard Level Modeling: Case Study of Kapuas, Central Kalimantan. In Disaster Risk Reduction in Indonesia; Springer International Publishing: Berlin/Heidelberg, Germany, 2017; pp. 539–560. ISBN 9783319544663. [Google Scholar]
  43. Syaufina, L.; Sitanggang, I.S. Peatland Fire Detection Using Spatio-Temporal Data Mining Analysis in Kalimantan, Indonesia. J. Trop. For. Sci. 2018, 30, 154–162. [Google Scholar] [CrossRef]
  44. Putra, E.I.; Hayasaka, H.; Takahashi, H.; Usup, A. Recent Peat Fire Activity in the Mega Rice Project Area, Central Kalimantan, Indonesia. J. Disaster Res. 2008, 3, 334–341. [Google Scholar] [CrossRef]
  45. Tiwari, A.; Shoab, M.; Dixit, A. GIS-Based Forest Fire Susceptibility Modeling in Pauri Garhwal, India: A Comparative Assessment of Frequency Ratio, Analytic Hierarchy Process and Fuzzy Modeling Techniques; Springer: Enschede, The Netherlands, 2021; Volume 105, ISBN 0123456789. [Google Scholar]
  46. Wen, H.; Guo, Q.; Zeng, Y.; Wu, Z.; Sun, Z. Study on Forest Fire Risk in Conghua District of Guangzhou City Based on Multi-Source Data. Nat. Hazards 2022, 114, 3163–3183. [Google Scholar] [CrossRef]
  47. Silviana, S.H.; Sahardjo, B.H.; Sutikno, S.; Putra, E.I.; Basuki, I. Basic Information About Tropical Peatland Ecosystems. In Tropical Peatland Eco-Management; Osaki, M., Tsuji, N., Foaed, N., Rieley, J., Eds.; Springer: Singapore, 2021; pp. 3–62. ISBN 9789813346536. [Google Scholar]
  48. Sumarga, E. Spatial Indicators for Human Activities May Explain the 2015 Fire Hotspot Distribution in Central Kalimantan Indonesia. Trop. Conserv. Sci. 2017, 10, 1–9. [Google Scholar] [CrossRef]
  49. Syahza, A.; Suswondo; Bakce, D.; Nasrul, B.; Wawan; Irianti, M. Peatland Policy and Management Strategy to Support Sustainable Development in Indonesia. J. Phys. Conf. Ser. 2020, 1655, 1–11. [Google Scholar] [CrossRef]
  50. Cattau, M.E.; Harrison, M.E.; Shinyo, I.; Tungau, S.; Uriarte, M.; DeFries, R. Sources of Anthropogenic Fire Ignitions on the Peat-Swamp Landscape in Kalimantan, Indonesia. Glob. Environ. Chang. 2016, 39, 205–219. [Google Scholar] [CrossRef]
  51. Alisjahbana, A.S.; Busch, J.M. Forestry, Forest Fires, and Climate Change in Indonesia. Bull. Indones. Econ. Stud. 2017, 53, 111–136. [Google Scholar] [CrossRef]
  52. Holden, Z.A.; Swanson, A.; Luce, C.H.; Jolly, W.M.; Maneta, M.; Oyler, J.W.; Warren, D.A.; Parsons, R.; Affleck, D. Decreasing Fire Season Precipitation Increased Recent Western US Forest Wildfire Activity. Proc. Natl. Acad. Sci. USA 2018, 115, E8349–E8357. [Google Scholar] [CrossRef]
  53. Ganteaume, A.; Camia, A.; Jappiot, M.; San-Miguel-Ayanz, J.; Long-Fournel, M.; Lampin, C. A Review of the Main Driving Factors of Forest Fire Ignition over Europe. Environ. Manag. 2013, 51, 651–662. [Google Scholar] [CrossRef]
  54. Ciesielski, M.; Bałazy, R.; Borkowski, B.; Szczęsny, W.; Zasada, M.; Kaczmarowski, J.; Kwiatkowski, M.; Szczygieł, R.; Milanović, S. Contribution of Anthropogenic, Vegetation, and Topographic Features to Forest Fire Occurrence in Poland. IForest 2022, 15, 307–314. [Google Scholar] [CrossRef]
  55. Sari, F. Forest Fire Susceptibility Mapping via Multi-Criteria Decision Analysis Techniques for Mugla, Turkey: A Comparative Analysis of VIKOR and TOPSIS. For. Ecol. Manag. 2021, 480, 118644. [Google Scholar] [CrossRef]
  56. Ikhsan, A.N. Study of Environmental Susceptibility to Forest Fires in Kotawarin Barat, Kalimantan Tengah Province. Universitas Gadjah Mada: Yogyakarta, Indonesia, 2022; Unpublished Master Thesis. [Google Scholar]
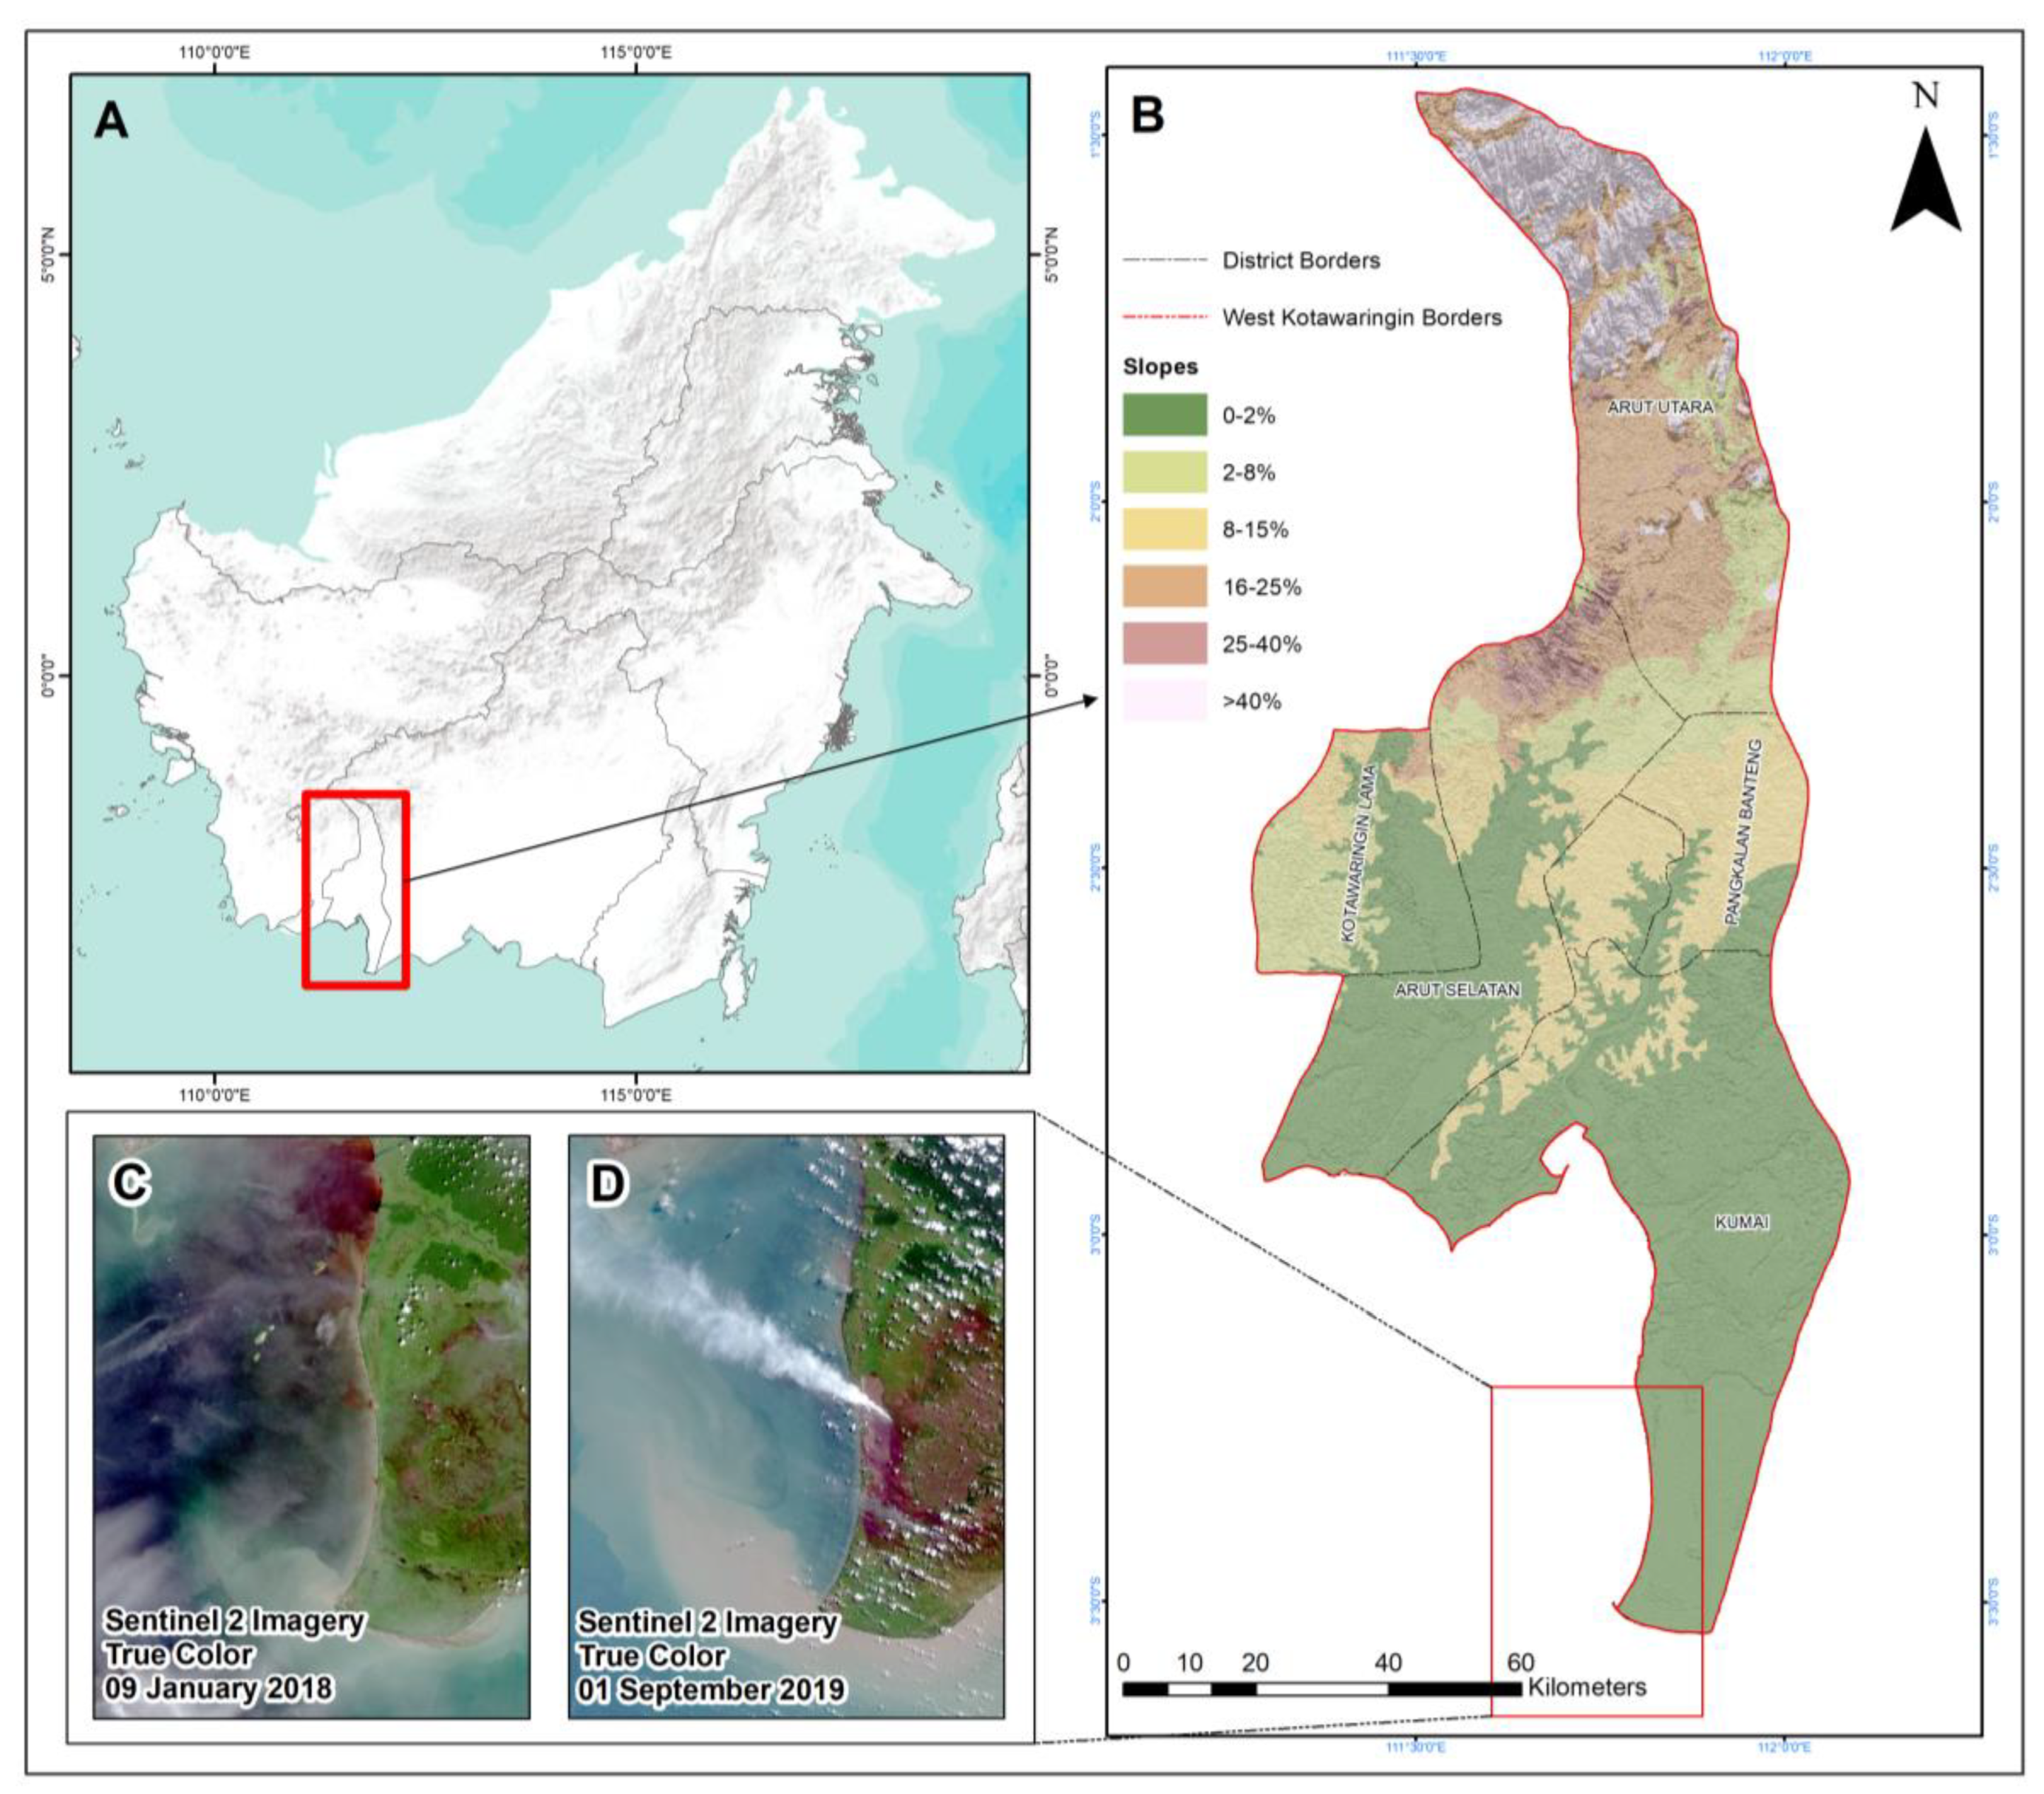
Figure 1. (A) Overview map, (B) topographical characteristics of the research area, (C) pre-fire event, (D) post-fire event.
Fire 06 00170 g001
Figure 2. Flowchart of research methodology.
Fire 06 00170 g002
Figure 3. Datasets for modeling (A) hotspots in 2016–2020 (B) buffer of distance to river (C) buffer of distance to road (D) buffer of distance to settlement (E) type of soil (F) land covers (G) slopes.
Fire 06 00170 g003
Figure 4. Inter−annual hotspot variability (A) correlation of hotspots with ocean nino index, (B) correlation of hotspots with rainy days, (C) correlation of hotspots with monthly rainfall (mm).
Fire 06 00170 g004
Figure 5. Forest and land fire susceptibility map.
Fire 06 00170 g005
Figure 6. Accuracy of forest and land fire susceptibility using IVM.
Fire 06 00170 g006
Table 2. Number of hotspots per district.
DistrictNumber of HotspotsTotal
20162017201820192020
Arut Selatan184301122166
Arut Utara5249121
Kotawaringin Lama4281881176
Kumai82305180558
Pangkalan Banteng112004
Pangkalan Lada000000
Total36111477274925
Table 3. Information value method results.
FactorsClassA (km2)Ai (km2)∑HS∑HSiIVM
Distance to river<1 km9554.722420.759252720.149
1–2 km1669.822500.436
2–3 km1353.851570.181
3–4 km1078.211180.123
4–5 km822.17960.187
>5 km2209.9232−1.9000
Distance to road<1 km9554.722220.019253340.441
1–2 km1520.272260.429
2–3 km1109.822000.621
3–4 km839.631240.422
4–5 km674.59740.125
>5 km3190.4069−1.499
Distance to settlement<1 km9554.72266.2192516−0.477
1–2 km670.8153−0.203
2–3 km795.9276−0.014
3–4 km766.9163−0.164
4–5 km737.6754−0.280
>5 km6317.216630.081
Type of soilNon-peat9554.725108.3892586−1.749
Peat4446.348390.667
LandcoverAgriculture9554.72789.84925770.007
Plantation3005.86242−0.184
Mining109.114−0.971
Mangrove58.9400.000
Forest3231.0792−1.224
Shrubland544.60540.024
Swamp1582.484471.071
Settlements and buildings133.699−0.363
Water body99.1400.000
Slopes0–2% (flat)9554.724588.419258920.697
2–8% (undulating) 1201.9256−0.731
8–15% (moderate sloping)1504.5130−1.580
16–25% (hilly)1325.167−2.908
25–40% (moderately steep)237.312−2.441
>40% (steep)697.411−4.212
Table 4. Susceptibility area.
ClassesArea (km2)Percentage
Low1924.4120.14
Moderate3207.5933.57
High2672.6827.97
Very High1750.0318.32
Total9554.72100
Disclaimer/Publisher’s Note: The statements, opinions and data contained in all publications are solely those of the individual author(s) and contributor(s) and not of MDPI and/or the editor(s). MDPI and/or the editor(s) disclaim responsibility for any injury to people or property resulting from any ideas, methods, instructions or products referred to in the content.