Article

A POIs Based Method for Location Optimization of Urban Fire Station: A Case Study in Zhengzhou City

1
China Fire and Rescue Institute, Beijing 102202, China
2
School of Emergency Management and Safety Engineering, China University of Mining and Technology (Beijing), Beijing 100083, China
3
Fire Corps of Henan Province, Zhengzhou 450008, China
4
Zhejiang Academy of Surveying and Mapping, Hangzhou 310000, China
*
Author to whom correspondence should be addressed.
Submission received: 18 December 2022 / Revised: 19 January 2023 / Accepted: 30 January 2023 / Published: 8 February 2023

Abstract

:
In order to strengthen urban rescue capabilities, a new method is proposed to optimize the spatial distribution of fire stations in urban areas. Potential fire risk places are simplified into points of interest (POIs). Based on the Minimize Facilities Method and Maximize Coverage Algorithm, the number and location of fire stations are determined. In addition, the POIs assigned to the stations are also determined. Moreover, the service area of the fire station is identified according to topological convex hull theory. After that, the coverage rate of the POIs and the sensitivity of the accessible area to the driving time are discussed. At last, Zhongyuan District of Zhengzhou City is taken as an example to verify the effectiveness of the proposed method. The results reveal that current fire stations are insufficient for protecting fire safety. It is necessary to construct three new stations, which will significantly enhance firefighting capabilities. Thus, the areas capable of being timely reached by fire forces in 4.3 min reach 108.8 km2, covering more than 50% of the target district. About 94 percent of the area composed of the target district can be reached in 10 min. Good accessibility indicates the proposed method is capable of optimizing the location of the urban fire station.

1. Introduction

Urban fire has become an important factor in causing casualties, economic losses, and environmental damage. From 2008 to 2017, the total number of fire accidents in China was 2.41 million. The number of fire accidents reached its maximum in 2014 (395,052). Compared with 2008 (136,835), it increased by nearly 1.9 times [1]. Whether the fire can be rescued in time directly affects the severity of the accident’s consequences [2]. Fire stations serve as the leading force for rescuing people from fire accidents. In the last 10 years, the construction of fire stations in China has strengthened year by year. However, compared with the increasingly severe fire situation, there is still an obvious gap between firefighting capability and fire rescue demands. Thus, delayed rescue incidents often occurred. For example, on 25 August 2018, a fire broke out in a hotel in Harbin. The time span between arriving at the accident scene and receiving the earliest dispatch instruction was more than 20 min [3]. On 16 February 2018, a fire occurred at the garbage collection point in a residential area of Qingyuan City. The accident scene was about 21 km from the fire station. It took about 35 min for firefighters to receive emergency calls and arrive at the accident scene [4]. In late May 2015, a fire took place in an elderly apartment in Pingdingshan City, Henan Province. It took more than 10 min to arrive at the accident scene. The accessibility between the fire station and the accident scene was affected by many factors. Among them, a very important factor was that the location of the fire station was far from the accident scene [5]. The spatial location of the fire station plays a decisive role in shortening the arrival time of fire rescue strength.
To identify the best location for fire stations, Shahparvari et al. [6] combined the location-allocation (LA) models and Geographic Information System (GIS) technology to identify the optimal locations of newly constructed fire stations in Melbourne. In his work, spatial locations of the residential fire incidents were regarded as fire demand points to conduct the coverage analysis of fire stations. Nyimbili and Erden [7] proposed an optimal site selection method for fire stations based on fuzzy AHP and GIS methods. The fuzzy AHP method was used to determine the weight of the factors influencing site selection for fire stations. These factors were categorized into six aspects, including high population density, proximity to main roads, distance from existing fire stations, density of hazardous material facilities, wooden building density, and distance from areas subjected to earthquake risk. Rodriguez et al. [8] introduced an optimal location model that considered multiple regions, demand types, vehicle types, and region-dependent dispatching rules. The real driving time was considered by Liu and Xu [9,10,11] in analyzing the coverage areas of fire stations. Furthermore, with the goal of minimizing the undergoing distance and arrival time as well as maximizing the coverage of the fire forces, Bolouri [12] used a simulated annealing algorithm and a genetic algorithm to identify the locations of fire stations. Chaudhary et al. [13] used the Group Decision-Making Process in the GIS to analyze the area suitable for arranging fire stations in the capital city of Nepal. Four different influencing factors, such as road distance, land cover, river distance, and population density, were discussed in their work. Murray [14] took a city in California as an example to analyze the number and location of fire stations. The relocation of existing fire stations was discussed from an economic perspective.
In China, traditional methods for determining the number and location of fire stations are based mainly on the protection area and driving time. The restrictions made on the protection area and driving time are no more than 7 km2 and 5 min, respectively. The number and location of fire stations should be approximately determined according to the circle drawing method or grid assigning method [15,16]. Afterwards, the location of the fire stations is adjusted according to the experts’ experiences. Traditional methods for fire station design commonly fail to realize maximum covering rate and minimum repeating coverage in the service area. In addition, achieving maximum coverage under the condition of a certain number of fire stations seems difficult, which leads to the occurrence of a high ratio of the repeated coverage. Therefore, in order to improve the capability of urban fire rescue, the layout optimization method for fire stations is analyzed in this study.

2. Introduction of Layout Optimization Models

The existing fire station optimization models mainly include the P-median model and coverage models. With a certain number of fire stations, the P-median model can select the location with the shortest total weighted distance or the shortest total travel time between fire stations and fire demand places, so as to improve the accessibility of fire rescue. The coverage model is designed to solve the coverage problem. The coverage problem is divided into the Set Covering Location Problem (SCLP) [8,17] and the Maximum Covering Location Problem (MCLP) [18,19,20]. The SCLP problem can find the least number and best position of the fire station, under the condition that any fire demand point is responded by at least one fire station. The MCLP problem considers the situation that fire stations cannot cover all demands of the region. This can solve the problem of how to improve the coverage rate when the quantity of fire stations is determined. According to the characteristics of commonly used models, one or several models are usually selected when optimizing the layout of fire stations. Some frequently used models are described below.

2.1. P-Median Model

The P-median model can minimize the maximum distance or time between the fire station and the demand points within the service area. The model can be described as Equations (1)–(6) [21]. Equation (1) can minimize the maximum distance or time. Equation (2) limits the total number of fire stations. Equation (3) restricts each demand point that is only assigned to one fire station. Equation (4) indicates that the fire station can only serve the fire demand points in its coverage area. The maximum distance or time d is selected by Equation (5).
min D
j N i y j = p
j N i x i j = 1 , i = 1 , 2 , , m ; j = 1 , 2 , , n
x i j y i
j N i d i j x i j D
x i j 0 , 1 , y j 0 , 1
where d is the maximum distance or time between all demand points and their nearest fire station. Ni represents the collection of alternate points for all fire stations. At least one alternative point in the Ni corresponding to one demand point should be selected to guarantee the coverage of this demand point. Parameter p is the total number of fire stations to be set. Parameter m is the fire demand points, and n is the location where the fire station can be set. The dij indicates the distance or travel time from demand point i to fire station location j.

2.2. SCLP Model

The SCLP model can find the least number of fire stations covering all of the demand points. The model can be described by Equations (7)–(9). Equation (7) can obtain the minimum number of fire stations. Constraint (8) indicates that each demand point needs at least one fire station. Equation (9) indicates whether the alternative location is selected. If selected, it is 1; otherwise, it is 0. The model can guarantee that the fire stations cover all demand points. However, repeated coverage of the demand points is seldom considered. If the repeated coverage rate is high, it will result in a waste of firefighting resources. At the same time, due to the restrictions on the economy and construction land in practical application, it seems challenging to guarantee that the demand points are covered completely. Therefore, it is necessary to find the minimum number of fire stations required to maximize the coverage of demand points.
min j = 1 n x j
j = N i x j 1 , i = 1 , 2 , , m
x j 0 , 1 , j = 1 , 2 , , n
where xj is the chosen location of the fire stations. Parameter m is the demand points, and n is the alternative location for the fire station.

2.3. MCLP Model

The MCLP model focuses on the maximization of fire station coverage. This model aims to maximize the service demands protected by the fire stations. It is not necessary to cover all of the demand points [15,22]. The description equations of the model are (10) to (12). Equation (10) indicates that the number of covered demand points is maximized when the number of fire stations is constant. Constraints (11) can ensure that the fire station covers the demand points. Equation (12) is the number of selected fire stations.
max i = 1 m Z i
j = N i x j Z i 0 , i = 1 , 2 , , m ; j = 1 , 2 , , n
j = 1 n x j = p
Z i = 1 ,     Demand   point   i   is   covered 0 ,     Demand   point   i   is   covered X j = 1 ,     Candidate   point   j   is   covered 0 ,     Candidate   point   j   is   covered
where Ni represents the set of alternative fire station points that can provide services for the demand points. Parameter m is the demand points, and n is the alternative locations of fire stations.

2.4. Location-Allocation (LA) Model

The LA model in ArcGIS can provide a simulation calculation for the location selection of public service facilities [23]. It involves two objects, namely facilities and demand points. The LA model can also solve the problem of allocating demand points to facilities. LA is often used for the location selection of public service facilities such as fire stations, hospitals, and logistics. In this study, the facilities refer to fire stations. The demand points are the objects that need fire stations to provide services, including all kinds of collected buildings. The model selects the fire stations from two levels, which are the location level and the allocation level. It consists of the Minimize Facilities Model (MFM) and the Maximize Coverage Model (MCM). Firstly, the MFM model is used to find out the minimum number and approximate location of fire stations in uncovered areas. Then, the MCM model is used to find the best fire station location to realize maximum coverage. LA combines the advantages of the two models, which combine with each other to solve the coverage-setting problem and the coverage-maximizing problem. Thus, the LA model can be described by Equations (7)–(12).

3. Calculation Principle and Evaluation Indexes

3.1. Impedance Interruption

Impedance interruption is an important issue involved in the site selection of fire stations. Impedance interruption refers to the maximum impedance that a demand point can allocate to a fire station. Note that the POIs are used as demand points in this study. The maximum impedance is obtained by taking the least-cost path along the road network. For example, the requirement that the fire station should reach the demand point within 5 min can be set as a time impedance. The purpose of setting time interruption is to obtain the POIs that can be reached by fire vehicles within a certain time or the range of areas that can be reached. The following three principles are followed in the simulation calculation process.
  • The POI point outside of the impedance interruption of all fire stations will not be allocated;
  • If a POI point is within the impedance interruption of a fire station, the POI will be assigned to the fire station;
  • If a POI point is located within the impedance interruption of two or more fire stations, the point is only assigned to the nearest fire station.

3.2. Calculation Principle

The calculation of the path, service area, and nearest facility is carried out by the Dijkstra algorithm. This algorithm adopts the breadth-first search idea. It is commonly used in solving the path calculation problem. In the calculation, it gradually expands to the outside from the start-up point. The path’s nearest point is extended one at a time, and the distance between adjacent points is updated. This work continues until all the points are traversed. The distance can be length, time, cost, etc. The algorithm assumes that the shortest path from v1 to vn is {v1,v2,…,vn}; then, {v1,v2,…,vi} is also the shortest path from v1 to vi, where i has a value from 1 to n. This method needs to specify the starting point and add two data sets, named P and Q, when calculating the shortest path. Initially, P contains only the starting point. Q includes other vertices by excluding the start-up point (including the distance from the vertex to the starting point). The distance of a vertex in Q indicates the distance from the starting point to this vertex. The distance between vertices adjacent to the starting point is taken as an actual value. The distance between vertices that cannot be directly related to the starting point is recorded as ∞. Then, the vertex with the shortest distance from the starting point in set Q is found and moved into set P. At the same time, the identified vertex is removed from Q. The distance from each vertex in Q to the starting point needs to be updated. Repeating this step until the vertexes are traversed completely means set Q becomes empty [24].

3.3. Constraint Condition

The response time of the fire stations should not exceed 5 min. It is determined by the development state of the fire accident over time. The time includes the 1 min required to complete the dispatch after receiving the emergency rescue call and the 4 min required for driving on the road. The shorter the response time, the faster the rescue force reaches the fire scene. Ensuring the arrival time within 5 min after receiving the dispatching instruction is the basic condition for efficiently carrying out firefighting and controlling fire development. Therefore, it is necessary to consider response time as the most essential constraint.

3.4. Evaluation Indexes of Optimization Effect

  • (1) Coverage rate of fire demand points
The coverage rate of fire demand points refers to the proportion of POIs protected by all fire stations to the total number of POIs. The larger proportion means the greater coverage rate of the accessible area, indicating that the layout of the fire stations is more reasonable. In addition, in order to understand the coverage of different types of POIs, the corresponding coverage rate needs to be calculated separately;
  • (2) Full coverage and overlapping coverage of service areas of fire stations
The service area refers to the area that the fire station can reach within the allowed time. It is necessary to identify the service areas after the number and location of fire stations are determined. The service area should be divided to meet the maximum coverage of the target area. In addition, the overlap in coverage between the service areas of different fire stations should be minimized. This can not only maximize the ability to deal with fire risks under certain conditions but also minimize the idle rate of firefighting resources;
  • (3) Accessibility of fire station within the target area
It is difficult for fire stations to achieve full coverage of the target area within 5 min. Grasping the time sensitivity of the reachable area to the driving time seems necessary. Accordingly, the areas that cannot be reached within a specific time can be identified. Then, the optimization effect of fire stations can be evaluated on the basis of the accessibility index.

4. Practical Example

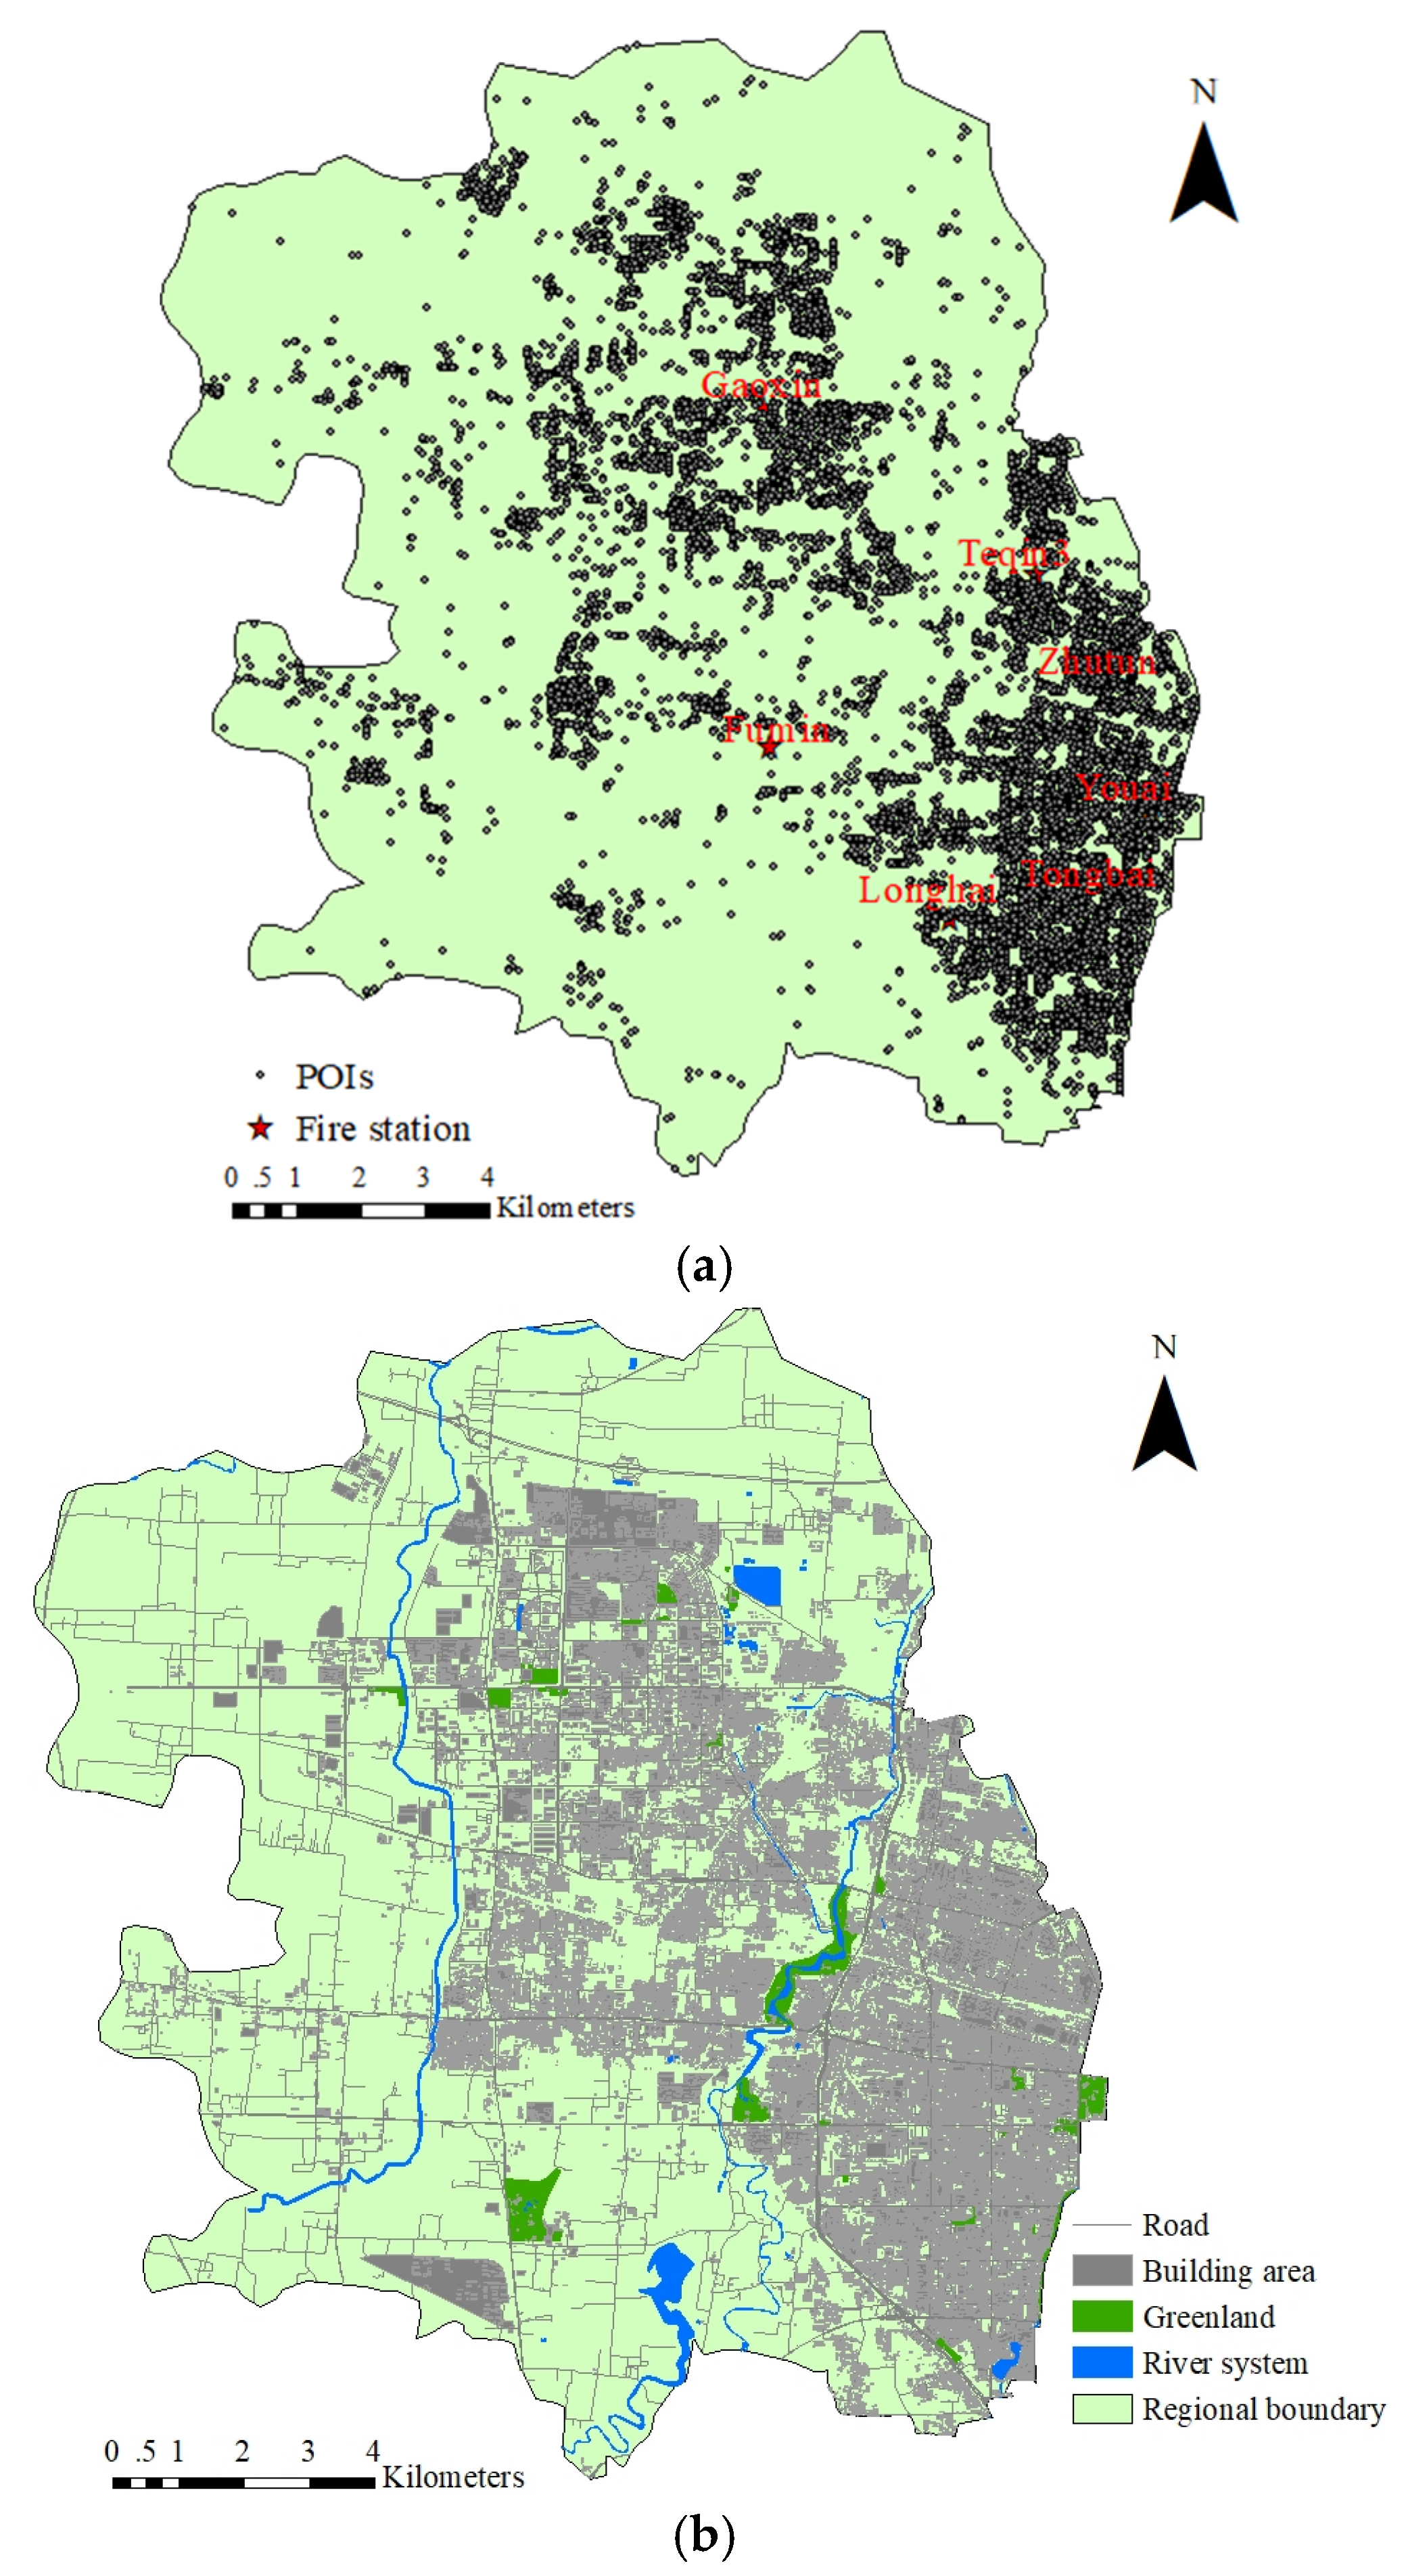
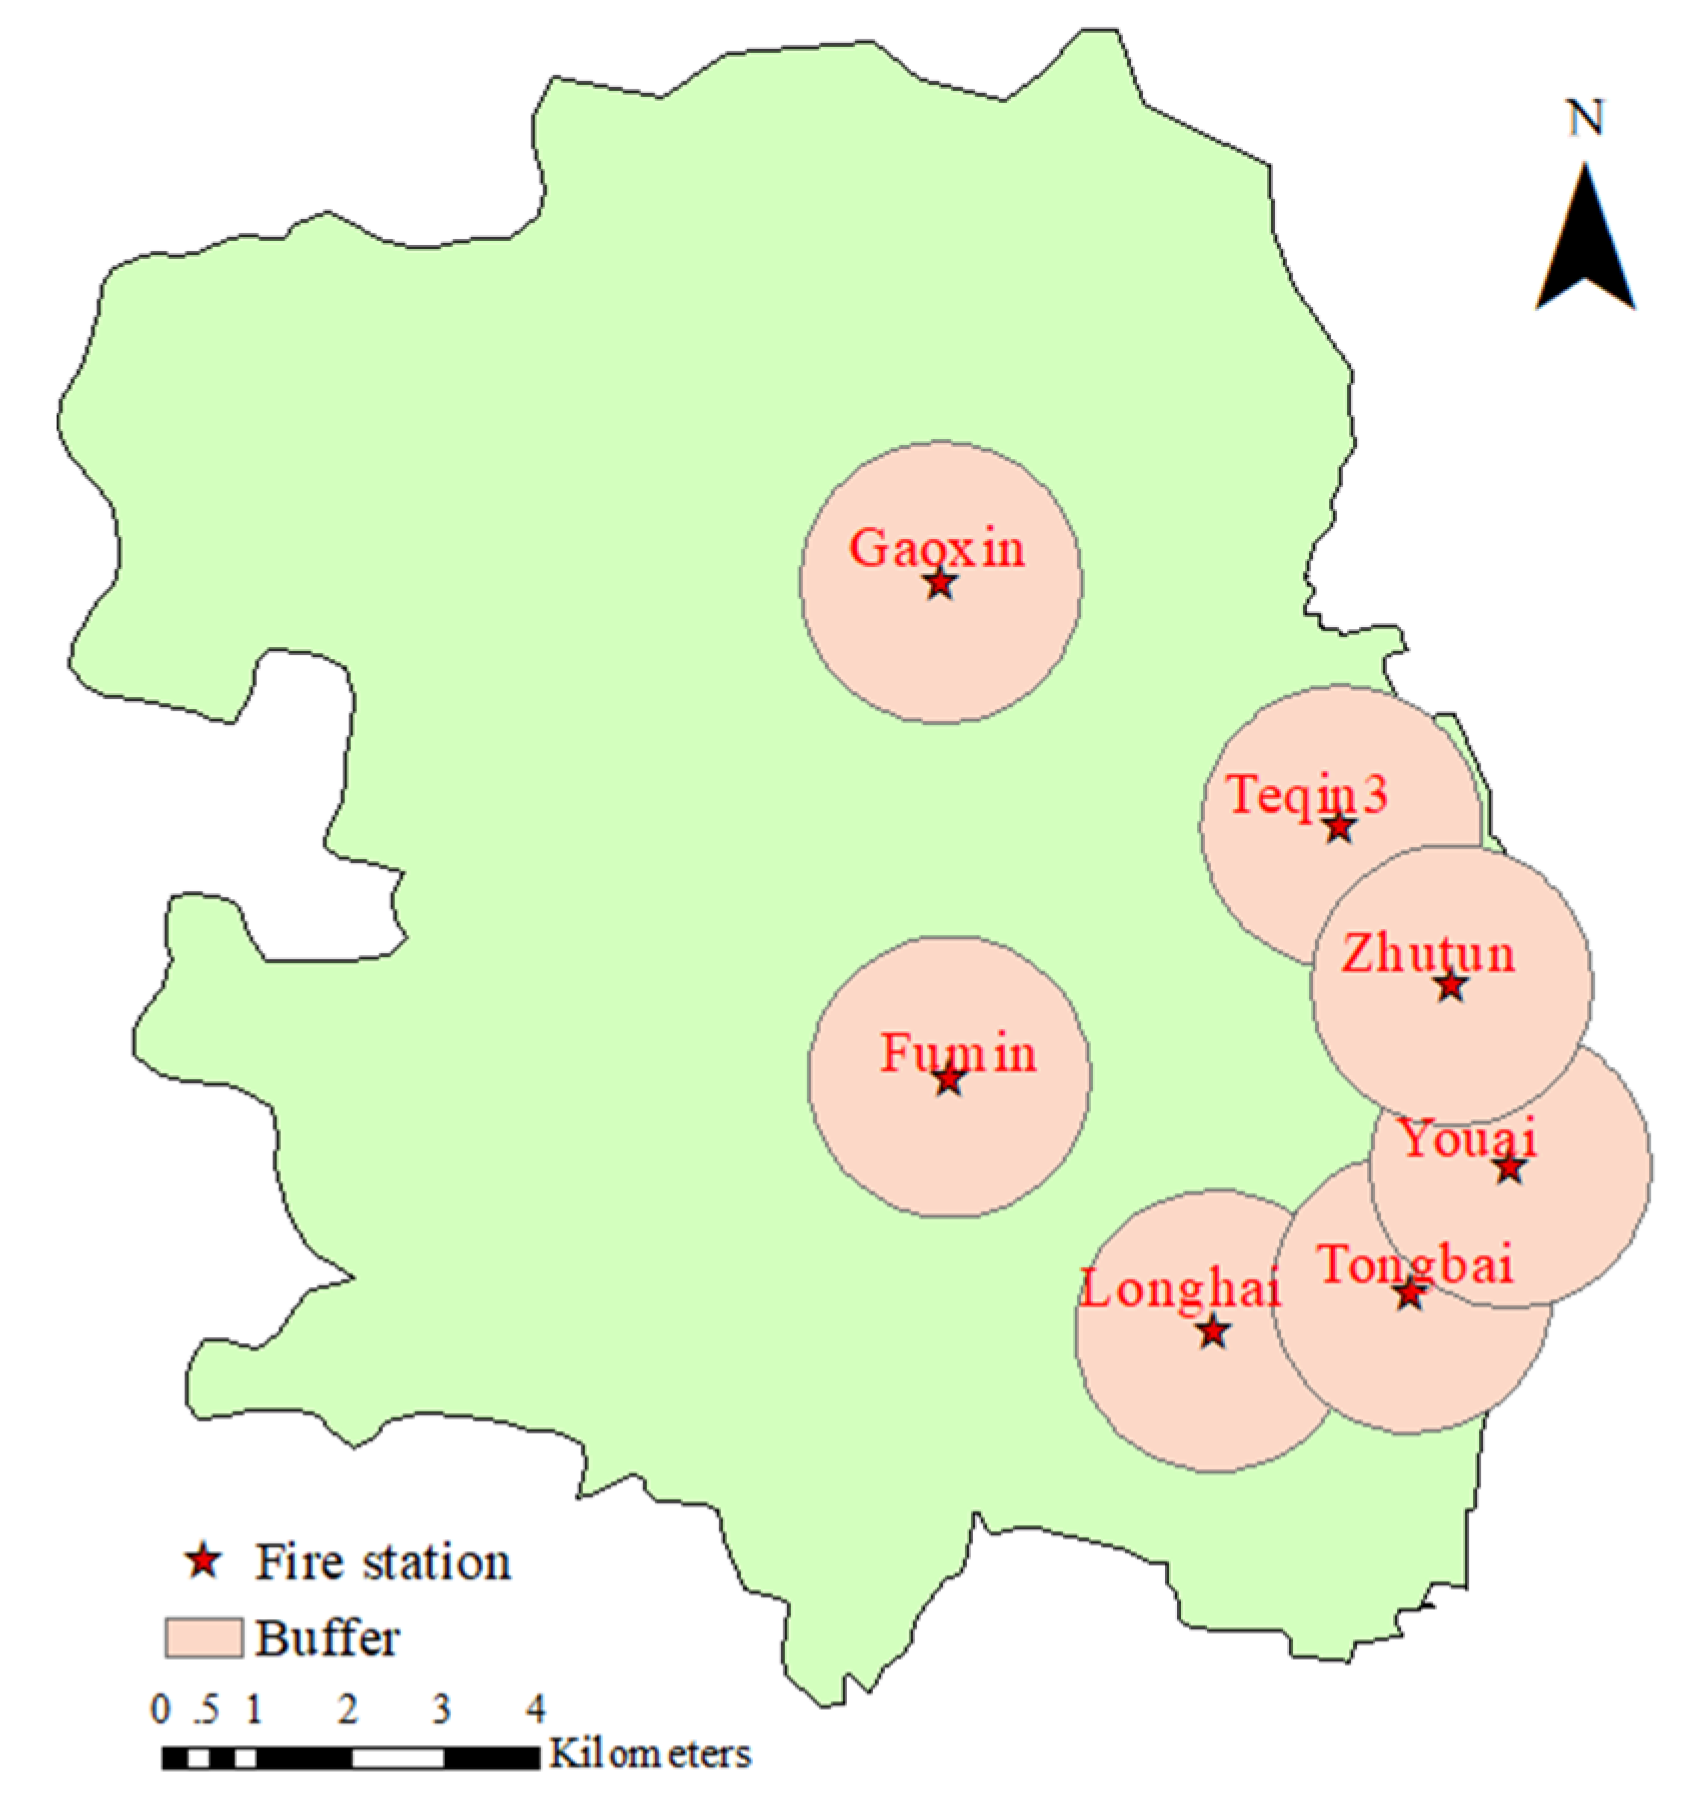
4.1. Current Fire Stations in Zhongyuan District

Zhengzhou is the provincial capital city of Henan Province. It has six municipal districts, one county, and five county-level cities, with a total area of about 7567 km2 (https://www.zhengzhou.gov.cn/view11.jhtml, accessed on 1 December 2022). Zhongyuan District is a municipal district of Zhengzhou. According to the Zhengzhou Statistical Yearbook (2000), the area and population of Zhongyuan District are approximately 195 km2 and 768,800 people, respectively. From 2018 to 2020, the fire stations in Zhongyuan District issued 3526 alarms. Among them, there were 1150 alarms belonging to firefighting ones. There are many old buildings and streets in Zhongyuan District, which makes it difficult to prevent or control fire accidents efficiently. Therefore, this area is selected as the research area. There are currently seven fire stations in Zhongyuan District. The spatial distribution of the current stations is shown in Figure 1, with most of them located in the southeast of the Target District. Only one fire station, namely Gaoxin Station, is located in the north of the district. The southeast of the target region is a densely populated and built-up area. The land has been sufficiently utilized. With the continuous growth of the population and economy, the development priority of Zhongyuan District has gradually shifted from the southeastern to the western and northern regions. Therefore, the fire station planning and construction will mainly focus in the future on the western and northern areas of the study site.
It is assumed that there is no overlap between the service areas of the different fire stations. According to the national standard [25], the coverage of existing fire stations is analyzed. In China, urban fire stations are generally divided into Level I, Level II, and mini fire stations. The maximum protection area assigned to the fire stations with different levels varies significantly. The seven fire stations in Zhongyuan District belong to Level I. The service area of the fire station belonging to Level I should not exceed 7 km2. Therefore, the maximum area that can be totally protected by the existing fire stations is 49 km2. However, the Zhongyuan District covers an area of 195 km2. The area protected by the fire stations is far from enough to meet the firefighting demands of Zhongyuan District. According to the legislation, the maximum service area of a fire station is commonly set at 7 km2. That means the serving radius is about 1493 m if the service area is in a circle shape. Then, the covering zone is identified by taking the fire station as the center. Moreover, whether the existing fire station meets the demand is roughly discussed. The coverage area of seven fire stations is shown in Figure 1. A large area of the target district falls beyond the area protected by the current stations. At the same time, there are many overlapping coverage areas among Teqin3, Zhutun, Youai, Tongbai, and Longhai fire stations. That means the effective protection area is much smaller than 49 km2.

4.2. POIs Distribution of Zhongyuan District

It is not necessary to assume all the land in Zhongyuan District has been fully developed and utilized. For example, there are no buildings in the southwest region. Therefore, it is not reasonable to analyze whether the fire station meets the requirements only according to the theoretical protection scope. Building fires are the most important type of urban fire. The POI data serves as a vector simplification point for various building sites. Therefore, the coverage of fire stations can be analyzed from the POI data point of view. The POIs used in this study were downloaded for free from the Baidu map in Shuijingzhu map downloader. The original POIs are divided into 15 categories. In order to conduct analysis, the original POIs need to be sorted. First of all, the POIs that are not related to fire hazards or have little fire risk should be deleted. Then, duplicate POIs in each classification should be deleted, which is an important task. Finally, according to the analysis of historical fire data and building classification, various POIs are reclassified. After reclassification, the original POIs are divided into eight categories [26]. The eight categories include residential places, hotels, restaurants, commerce places, office places, high-fire risk places, important firefighting places, and general firefighting places. The sorted POIs of various places are shown in Table 1. The number of POIs in different places varies greatly. The greatest number of POIs, namely, 7027, is observed in commerce places. The second number is found in office places and is equal to 6226. They are followed by those in restaurants, general firefighting places, and residential places. Comparing with POIs in other places, the number of POIs falling within important firefighting places and high-fire risk places are relatively small. The important firefighting places include government agencies, cultural relics, historic sites, museums, temples, exhibition halls, libraries, sanatoriums, etc. Gas stations, charging stations, warehouses, internet cafes, dance halls, KTVs, railway stations, bus stations, airports, etc. are categorized as high-fire risk places. As shown in Figure 2a, the POIs are mainly concentrated in the southeast of Zhongyuan District. Figure 2b shows the distribution of buildings, roads, green areas, and water systems in Zhongyuan District. It can be seen that the southeast and the north central area of Zhongyuan District are the two most densely built areas.

4.3. Optimization Scheme

The analysis results in Figure 1 show that there is no repeated coverage between the Gaoxin fire station and other fire stations. Gaoxin fire station covers a large amount of POI data. Therefore, the location of the Gaoxin fire station is relatively reasonable. In the optimization scheme, the Gaoxin fire station is set as a verification point. Thus, the location of the left six fire stations in the southeast region is taken as the restriction. The coverage of the collected POIs is analyzed by adding different numbers of fire stations to the target district. If the position of one added fire station is approximately coincidental with the Gaoxin fire station, it indicates that the optimization model adopted in this study is reliable. The model can be applied to the optimization analysis of the spatial layout of fire stations. Based on such a configuration, the coverage ratio of the POIs is analyzed, corresponding to different numbers of fire stations within the target district. According to the analysis results, the short-term goal for fire station construction is put forward. Based on the number of fire stations needed to be added, the fire station location and coverage ratio of the POIs will be analyzed.
In the analysis process, all road intersection nodes are taken as the candidate locations for fire stations. The POIs are taken as fire-demand points. After careful sorting of the download data, a total of 25,120 demand points in Zhongyuan District have been obtained. Combining the actual situation with the existing research [27], this study sets the preparation time of firefighters before dispatching to be 40 s. The driving time is commonly set to 4 min and 20 s. Therefore, the time of 4.3 min is taken as the impedance interruption of the road in the calculation process. Different grades of roads have different driving speeds [28]. According to the requirements of standard [29] and the actual situation of the region, the values set during calculation are shown in Table 2. ArcGIS is used to establish network data sets for vector road network data, such as highways and roads. In the simulation, the road priority for fire vehicles is taken into account. That is, the road network setting is reasonably selected without traffic restrictions such as traffic lights, one-way traffic, and no turning at intersections.

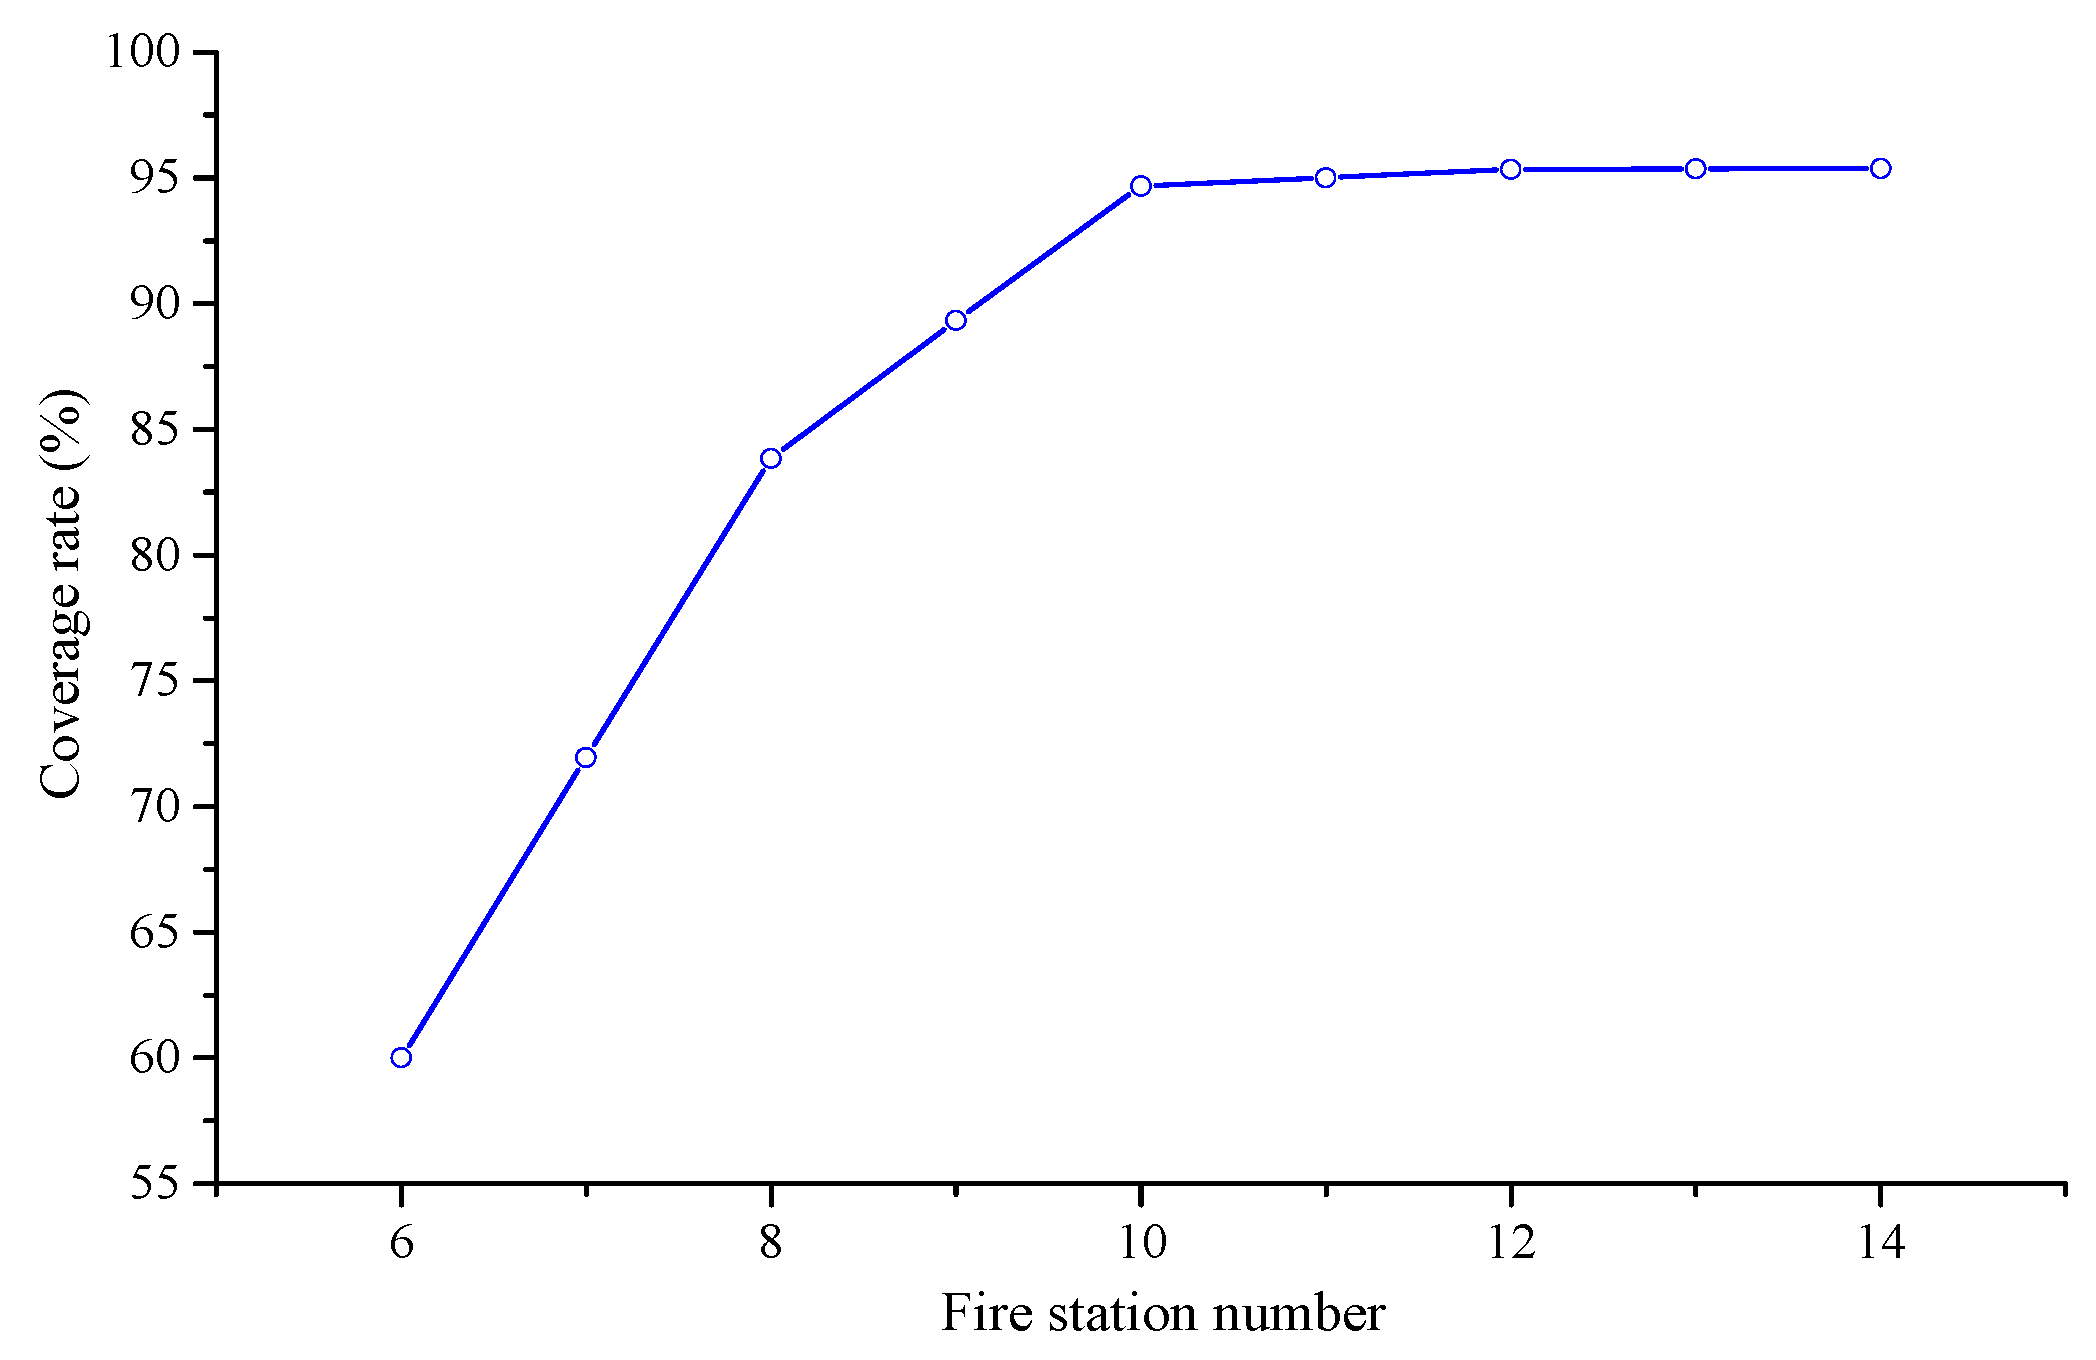
4.4. Coverage Analysis of Different Number of Fire Stations

In the analysis, the maximum capacity allocated to each fire station is set to be 3000. It means that the maximum number of POIs allowed to be assigned to a single fire station is 3000. The difference in the POIs assigned to each fire station can be reduced by limiting the maximum number of POIs. The simulation process follows the principle of maximizing the coverage of the POIs when optimizing fire station locations. Figure 3 gives the simulation result of the added fire stations for the remaining six fire stations except Gaoxin fire station. The results reveal a fire station stays at the location of Gaoxin station no matter how many fire stations are added to the target district, indicating the desirable reasonability of the simulation. In addition, the number of POIs assigned to different fire stations varies greatly. Regarding the same station, the distance between it and the assigned POIs presents an obvious difference. Such a difference decreases with the increase in the number of fire stations.
The travel time and coverage rate of the POIs under the condition of adding different fire stations to the target district are presented in Table 3. The existing fire stations, excluding Gaoxin fire station, can cover up to 60% of the POIs. The average arrival time is 1.77 min. An additional fire station can increase the coverage rate from 60% to about 72%. After adding 4 fire stations, the coverage rate increased to more than 90%. When five fire stations are added to the district, the coverage rate changes little compared with the scenario of adding four. The number of the POIs covered has increased by 87 due to the addition of the new station. When the total number of fire stations increases to 12, 13, and 14, the coverage rate of the POIs remains basically unchanged. Only the average arrival time is shortened, with limited value.
The evolution curve means the change in cumulative coverage rate with the number of fire stations. The evolution curve of the coverage rate of the POIs with the number of fire stations constructed in the target district is shown in Figure 4. With the increase in the number of fire stations, the coverage rate of the POIs presents an overall increasing trend. However, the growing speed of the coverage rate shows a downward trend, which means the sensitivity of the coverage rate to the station number drops quickly. The curve tends to be stable as the number of newly added fire stations reaches four. Therefore, it is reasonable to set up 10 fire stations, namely, 3 new fire stations that are necessary to be constructed in the target district. Based on such optimization, a total of 23,780 POIs are allocated to the fire stations. Figure 5 shows the positions of three additional fire stations when considering Gaoxin Station. At this time, 22,889 POIs are covered. The coverage rate reaches 91.12%. The coverage rate is lower than that of the planned fire station in Figure 3d, indicating that the layout predicted by the simulation is better. However, it is not economical to move Gaoxin Station to the predicted place due to the small difference between Figure 3d and Figure 5.

4.5. Determination of the Number and Location of Fire Stations

Theoretically, the more POIs the fire station covers, the better. However, a large number of fire stations are needed to realize full coverage of the considered POIs. Due to economic considerations and the actual development plan of Zhongyuan District, the number of fire stations should be minimized while the demand points falling within the service area should be maximized. According to the above analysis, 10 fire stations that should be planned in the short-term can meet about 95% of the POIs within 4.3 min. The average time for each fire station to reach the POIs in its service area is less than 3 min. Then, the locations for the newly added fire stations are shown by the blue dot in Figure 6. The specific geographical location is described as follows. Fire station 7 is located at the intersection of West Fourth Ring Road and Chemical Road. Fire station 8 is located at the intersection of Changchun Road and Lianhua Street. Fire station 9 is located at the intersection of Dongqing Street and Ruida Road. Fire station 10 is located at the intersection of Qinling Road and Qinhe Road. The location of fire station 9 is basically the same as that of the current Gaoxin fire station. Considering the capital investment, the Gaoxin fire station should be retained, which plays a similar role to station 9 shown in Figure 6. That means station 9 is not necessary to be constructed by the remaining Gaoxin Station. Based on this understanding, the number of POIs and average travel time corresponding to each station are achieved and listed in Table 4.

5. Service Area Identification of Fire Stations

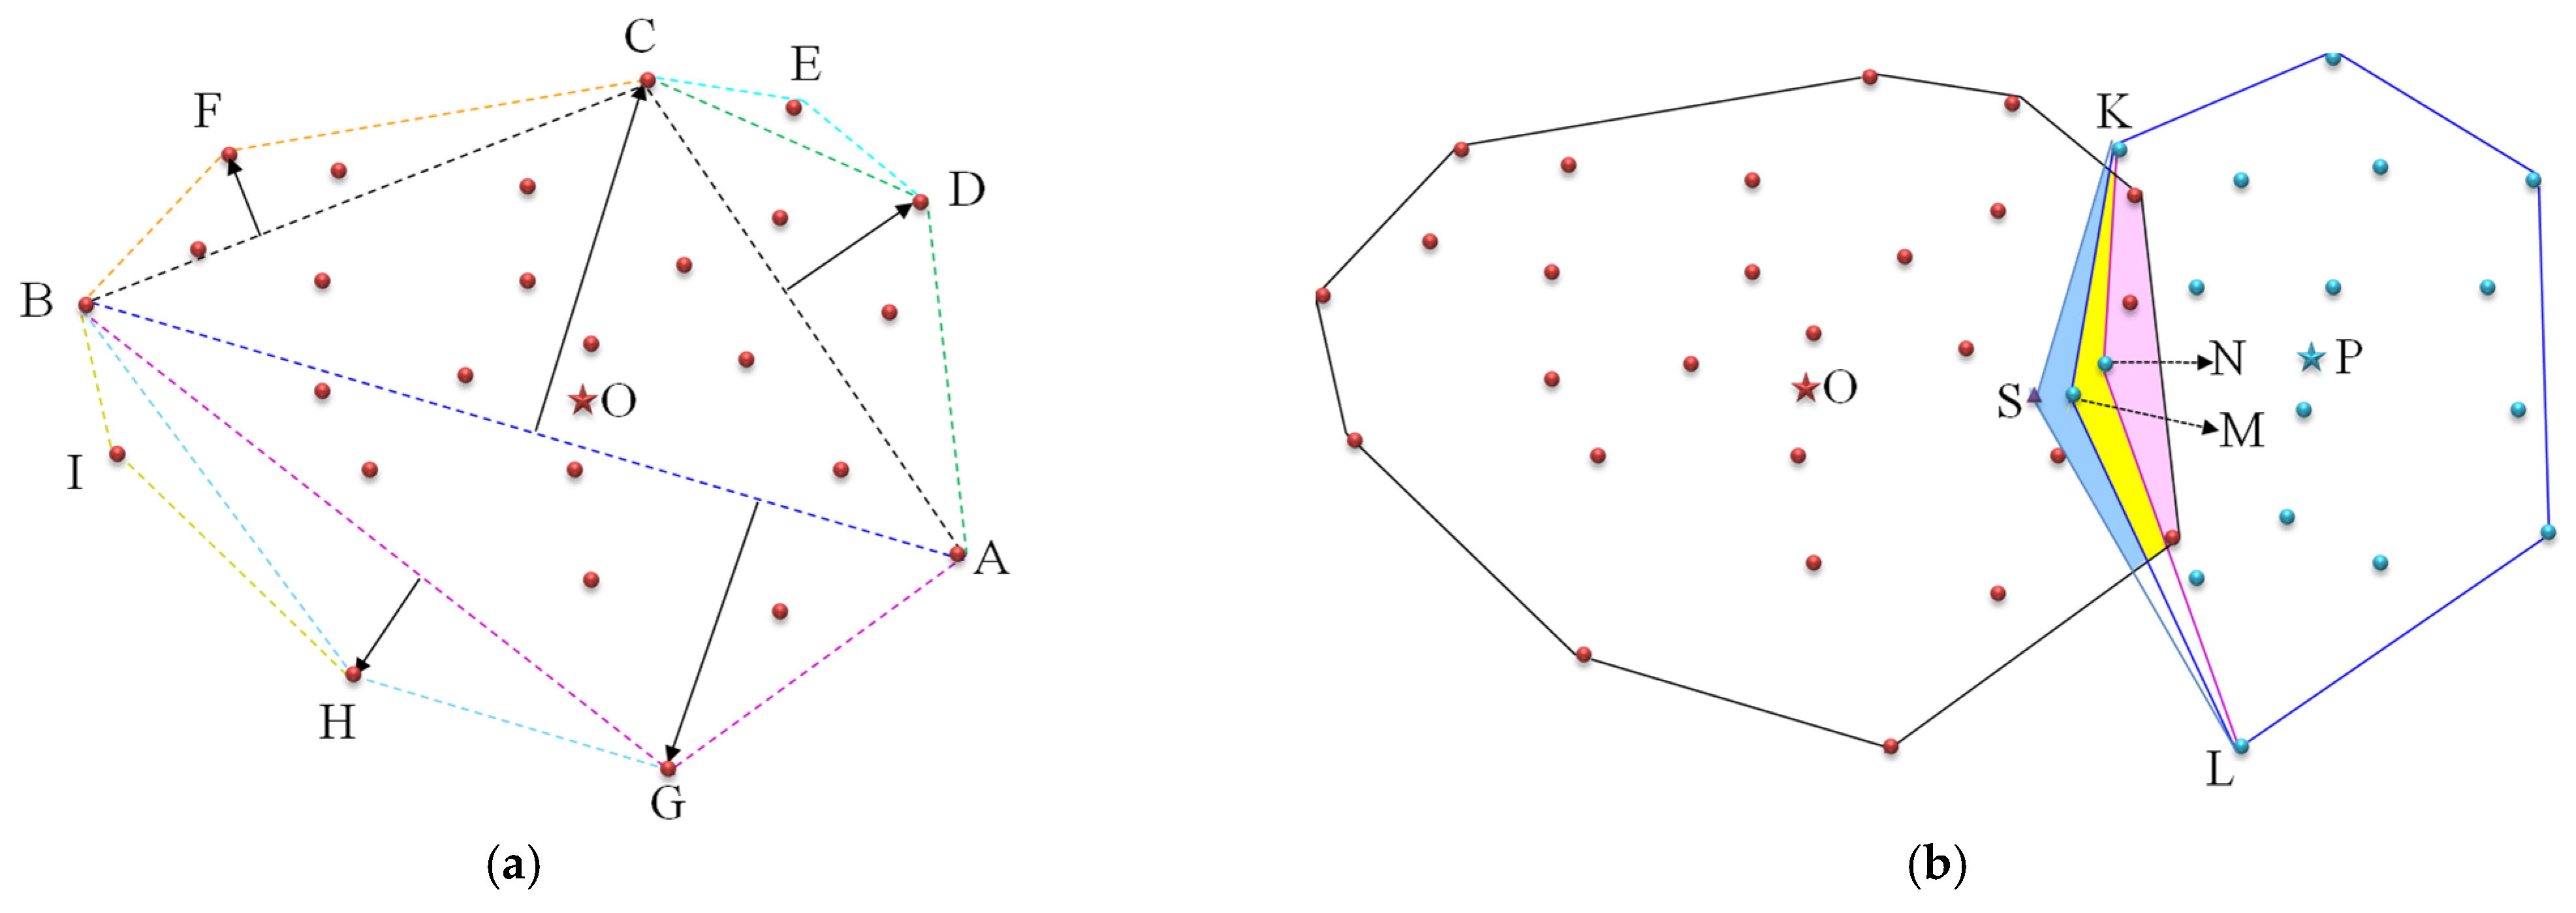
5.1. Principle of Topological Convex Hull

The topology method serves as an effective tool for geometric division. The minimum boundary geometry circling the POIs covered by each fire station is calculated by using the principle of the topology. Then, an irregular convex polygon enveloping the POIs is obtained, which is named the convex hull corresponding to each fire station. The convex hull is the minimum boundary geometry of a polygon constructed from a point set. A convex corner is formed at the intersection of all outer boundary lines. The topological convex hull principle is used to identify the service area of the fire station. Accordingly, the POIs and service area covered by each fire station can be identified. The division principle of the convex hull is shown in Figure 7a. Fire station O is represented by a red five-pointed star. The POIs assigned to fire station O are indicated by red dots. Firstly, points A and B, located at the two extreme points, are determined. The line AB between two points is the longest line. It divides POIs covered by fire station O into upper and lower groups. Then, it is necessary to find the point C farthest from the line AB in the upper group. Then, the lines of AC and BC are connected, respectively. The POIs surrounded by the triangle ABC are no longer considered. The points outside the triangle ABC need to be analyzed with a similar method. For the points on the right side of the line AC, the point D, which is farthest from the straight line, has been found. Then, the lines of CD and AD are connected, respectively. There is a point E falling outside of triangle ACD. Triangle CDE is obtained by connecting CE and DE. A similar recursive method is used to analyze the points on the left side of line BC and the lower side of line AB until all points are surrounded by triangles. The closed polygon ADECFBIGH formed by the outermost boundary lines of all the triangles is the target convex hull. The size and shape of the convex hull are mainly based on the POIs assigned to fire station O. This method ensures that all POIs assigned to the fire station are located inside the convex hull. At the same time, the coverage area of the service region related to the fire station reaches its maximum magnitude with this identification method.
It is inevitable that the POIs corresponding to different fire stations are staggered. As shown in Figure 7b, the POIs within the convex hull covered by fire stations O and P overlap in the specific region. Points M and N are assigned to fire station P, but they fall in the service area of fire station O. The service area of fire station P obtained by the topological convex hull method is a closed polygon circled by blue lines. The service area of fire station P takes point M as the vertex in the overlapping area of two fire station service areas. The overlapping areas are pink and yellow. In order to reduce the repeated coverage, demand point N is used as the vertex of the convex hull related to fire station P. In this scenario, only the pink area is left in the overlapping area. However, point M cannot be effectively covered, which increases the fire risk. On the contrary, if point S is taken as the vertex of the convex hull service area of the fire station P, location M can be effectively protected. However, the repeated coverage rate among different fire stations increased rapidly. Repeated coverage areas are the pink, yellow, and blue areas in Figure 7b. Thus, point M should be used in the service boundary identification of the service area of the fire station. That means the topological convex hull method, used to identify the service area of the fire station, can not only ensure the maximum coverage of the target area but also minimize the overlapping coverage area between the service areas of different fire stations.

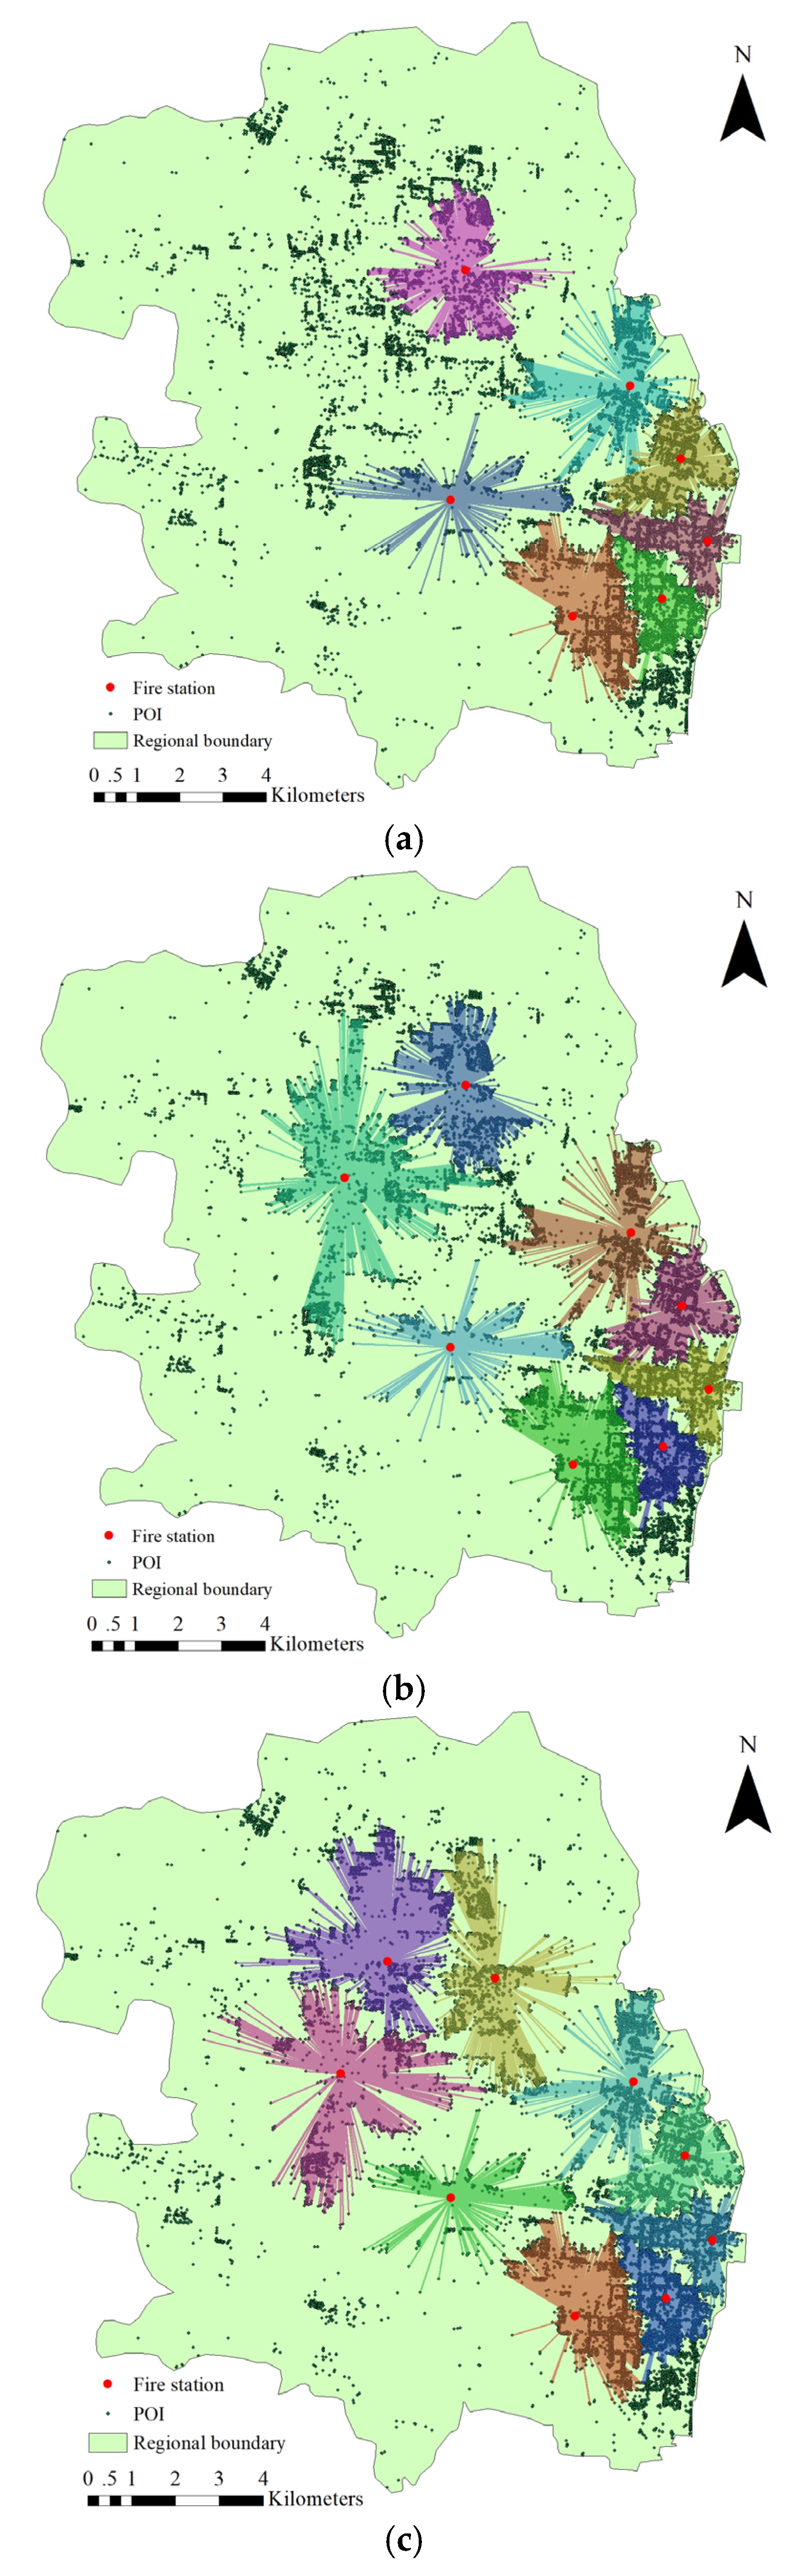
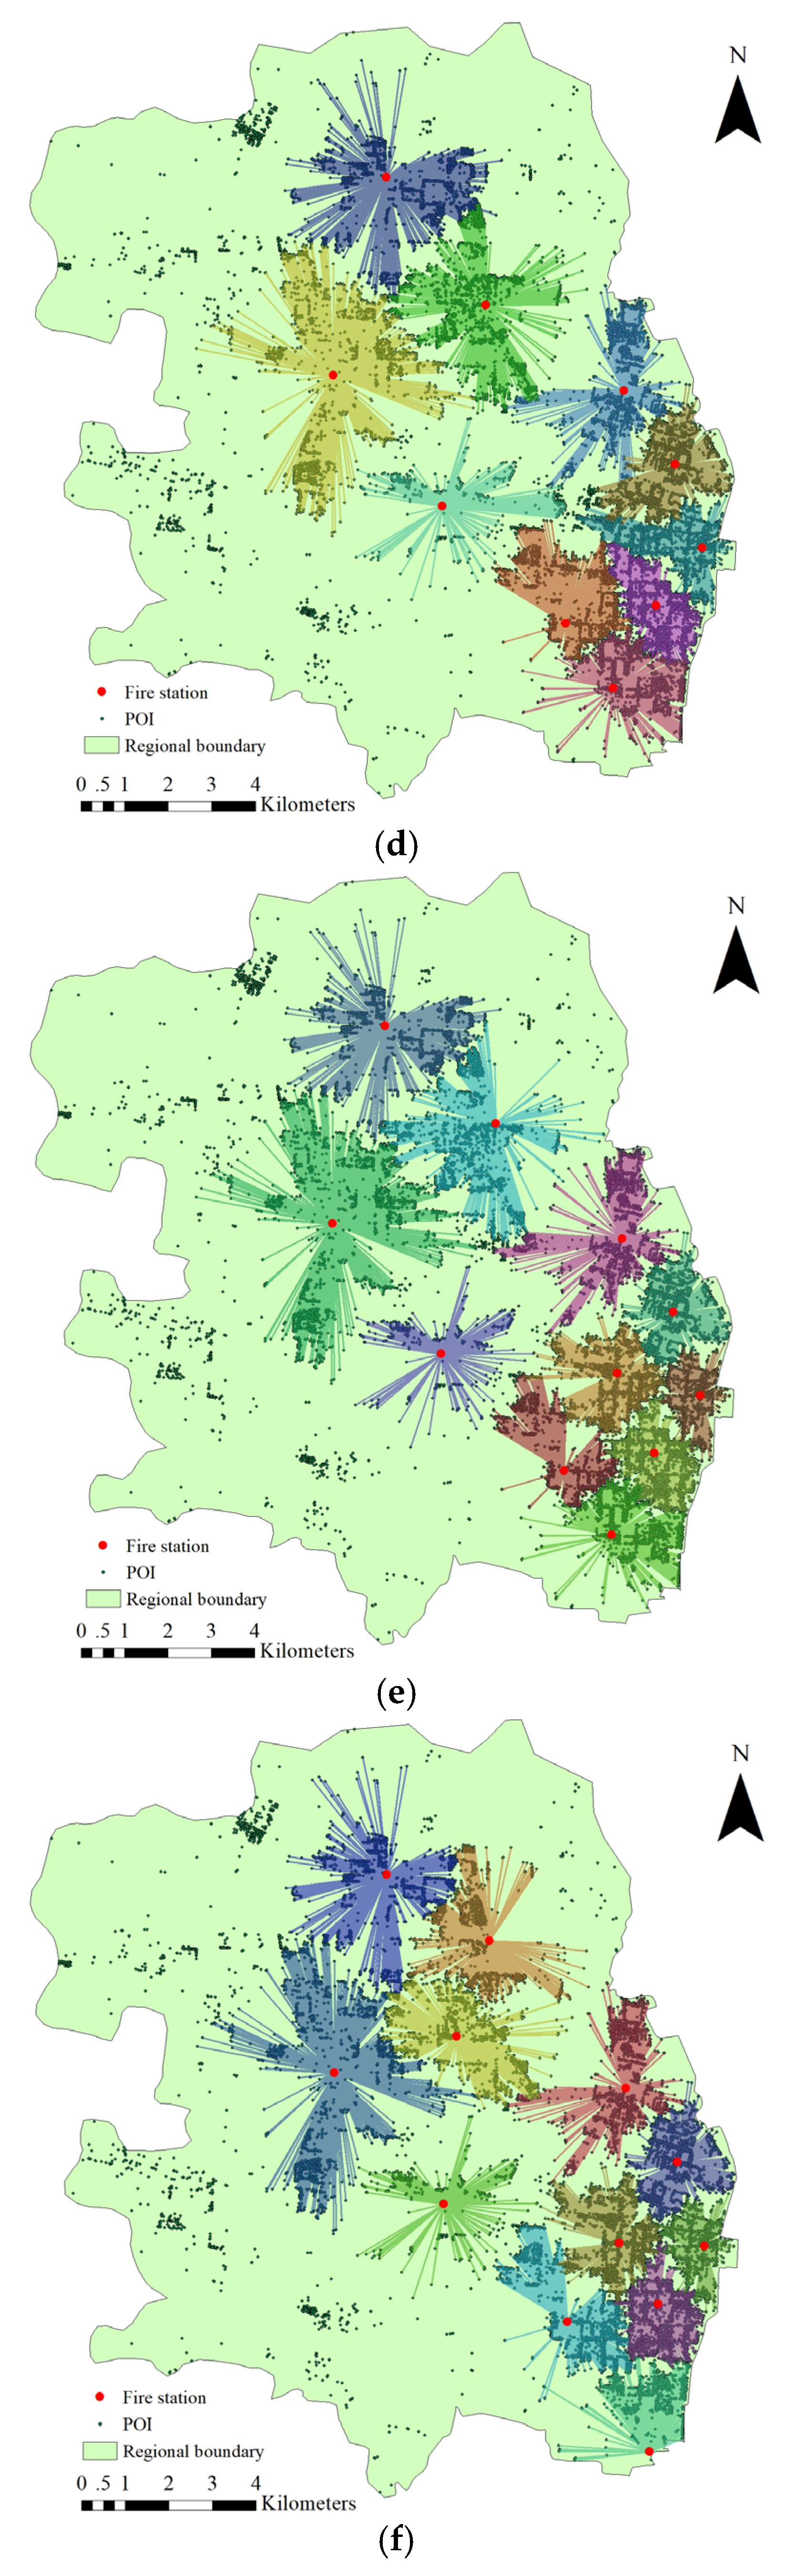
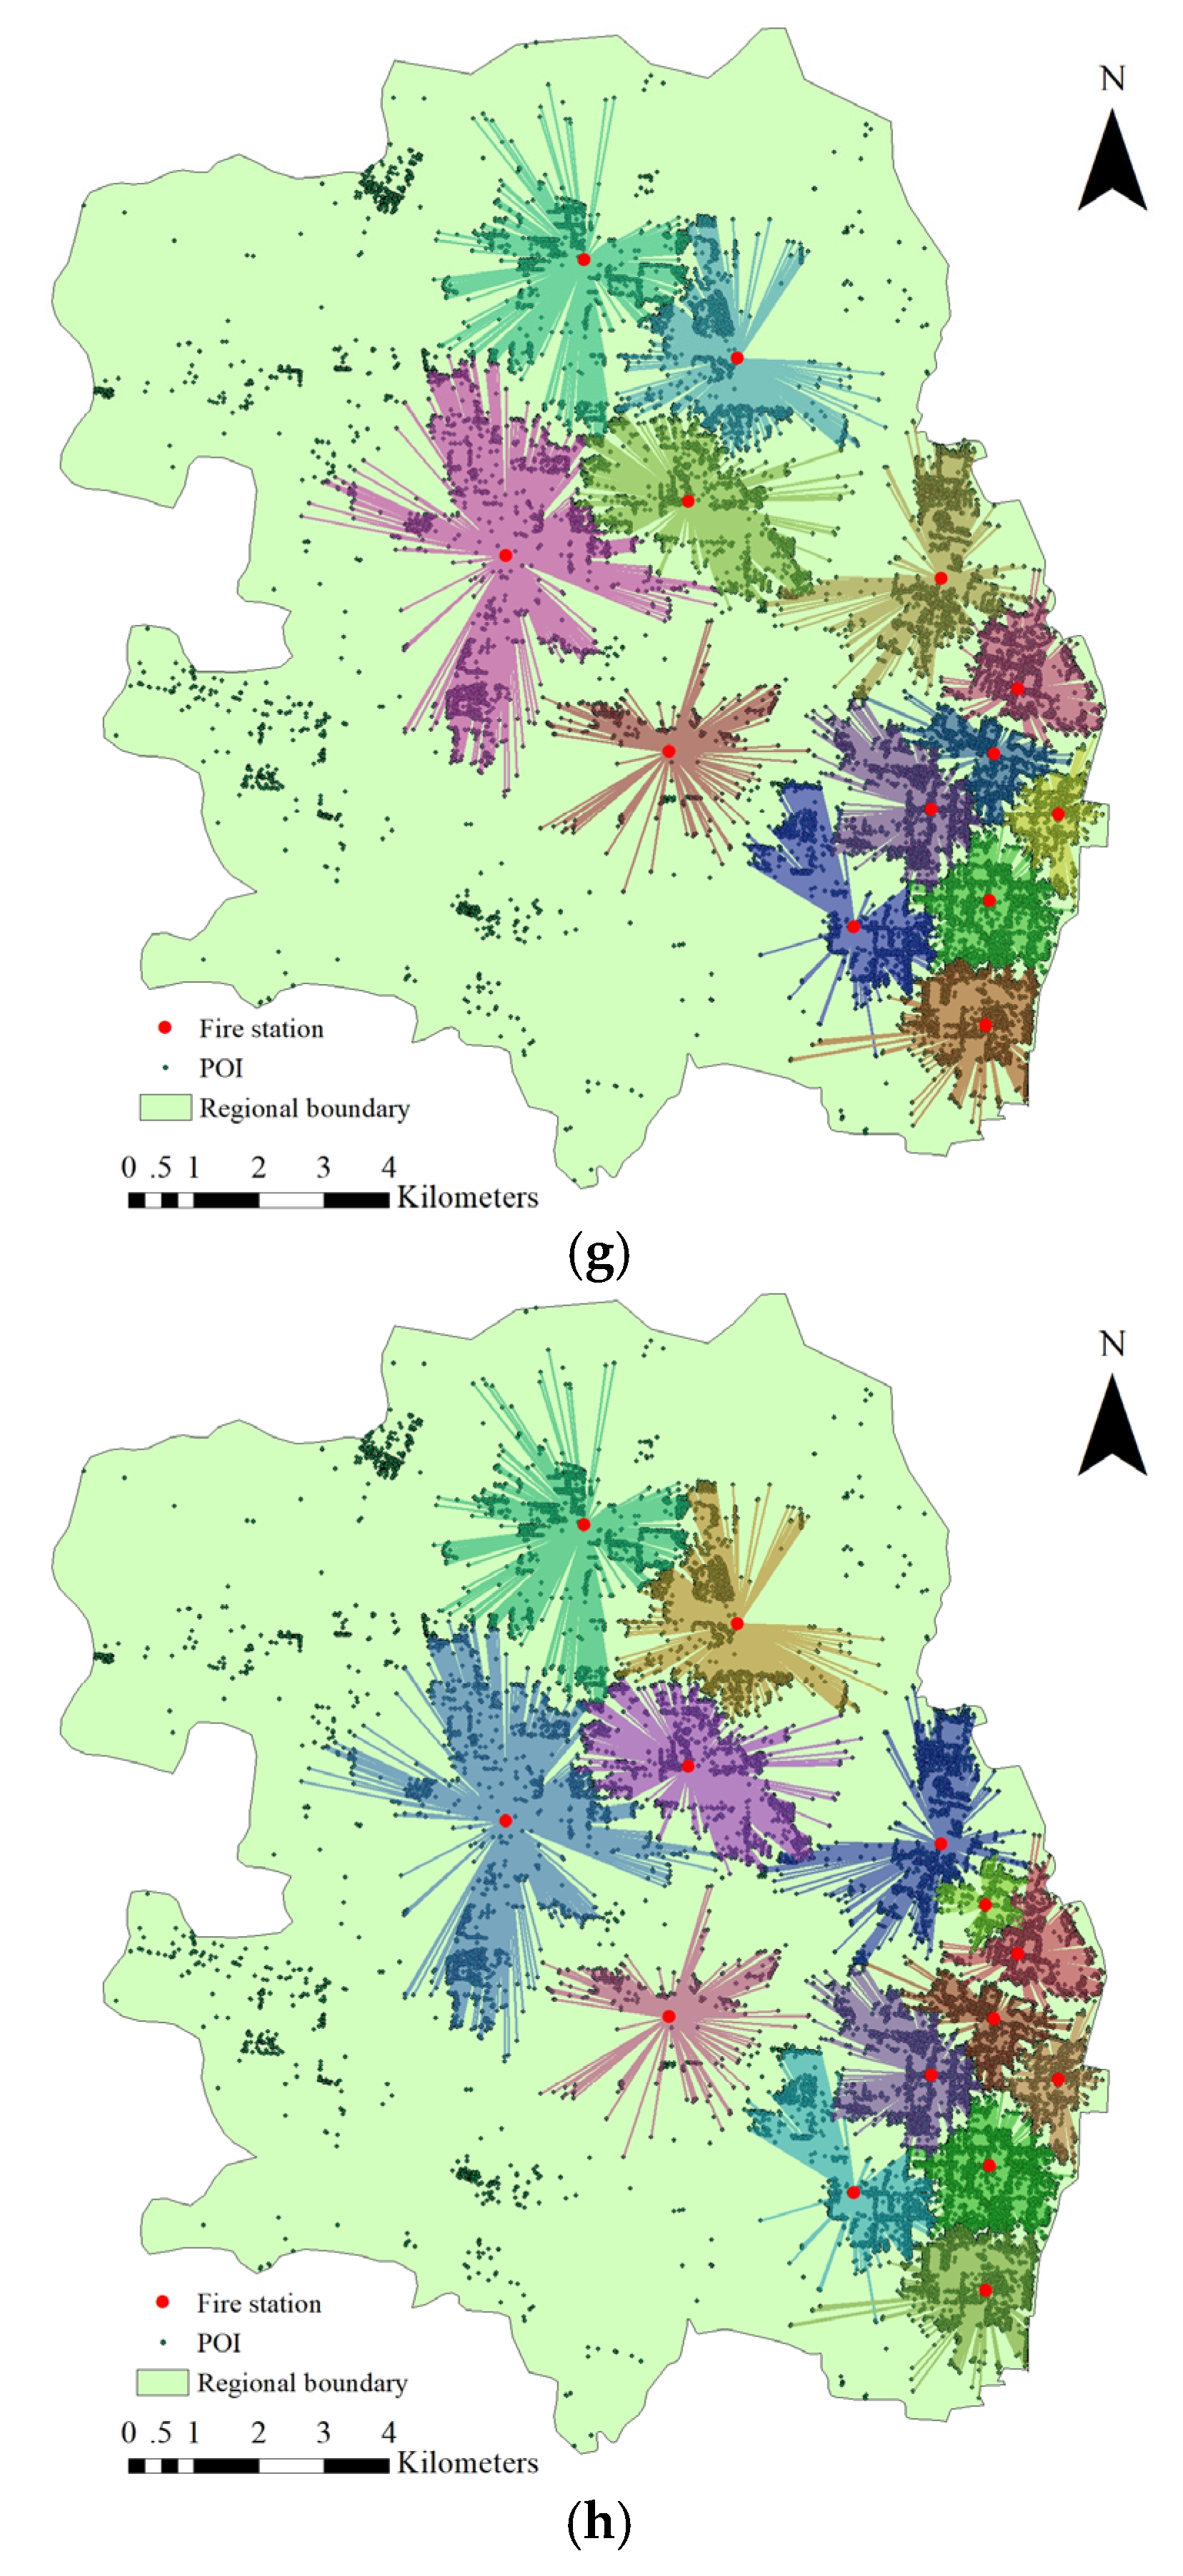
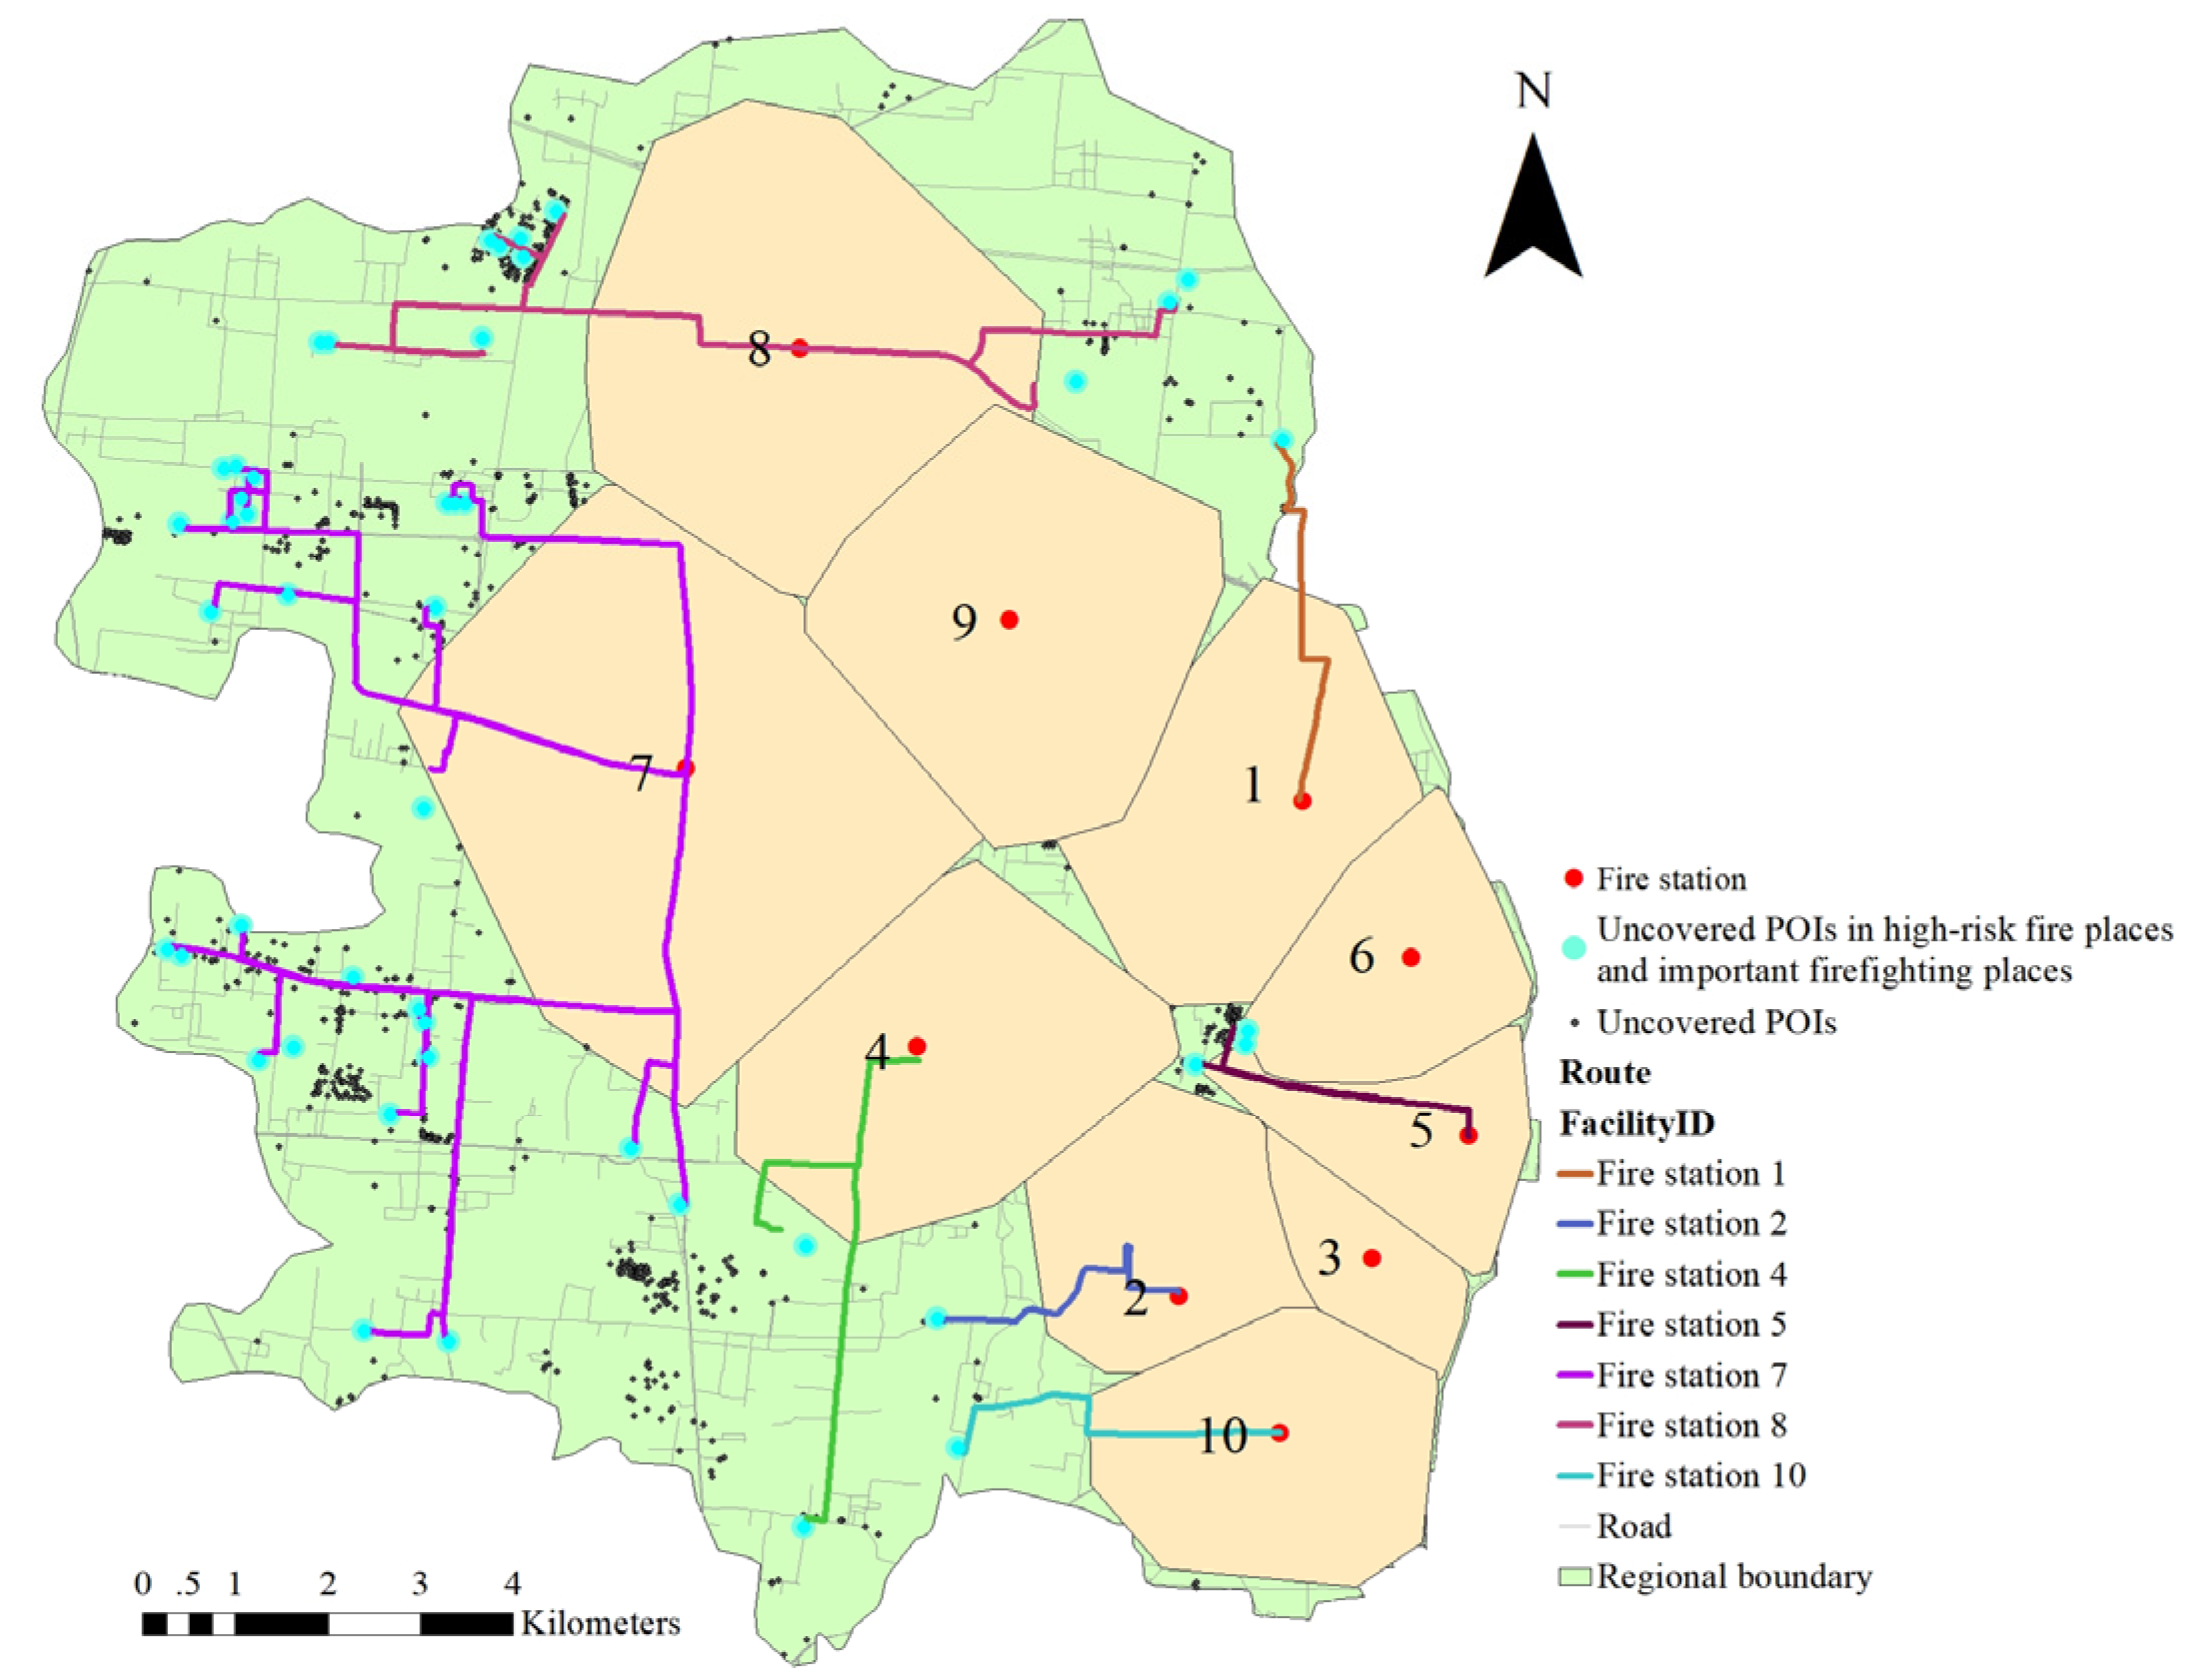
5.2. Division of Service Areas

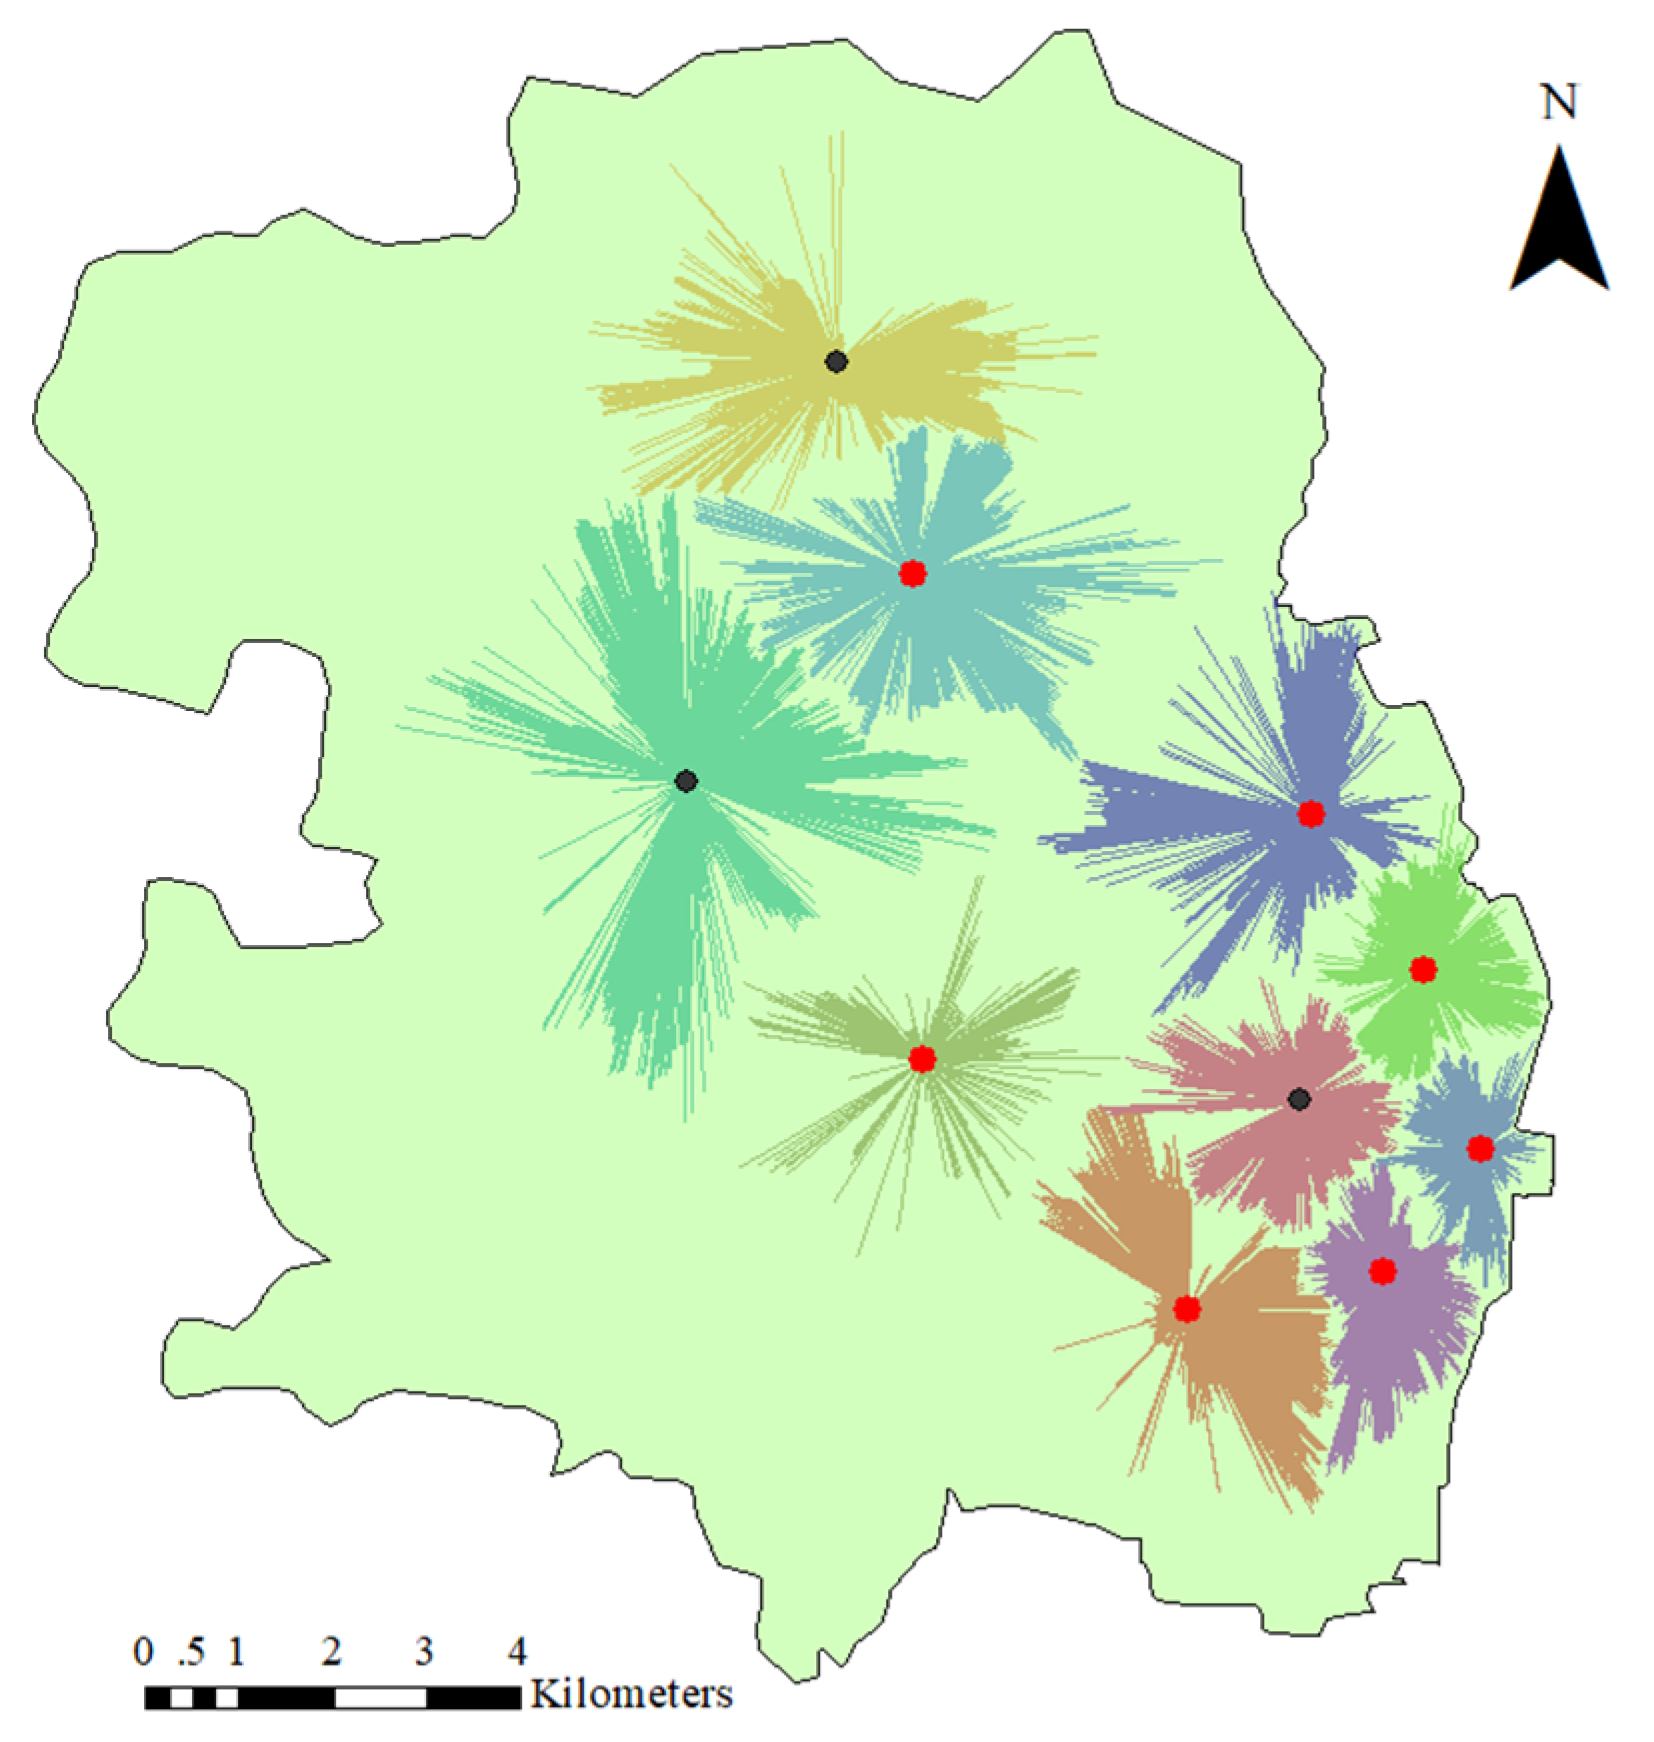
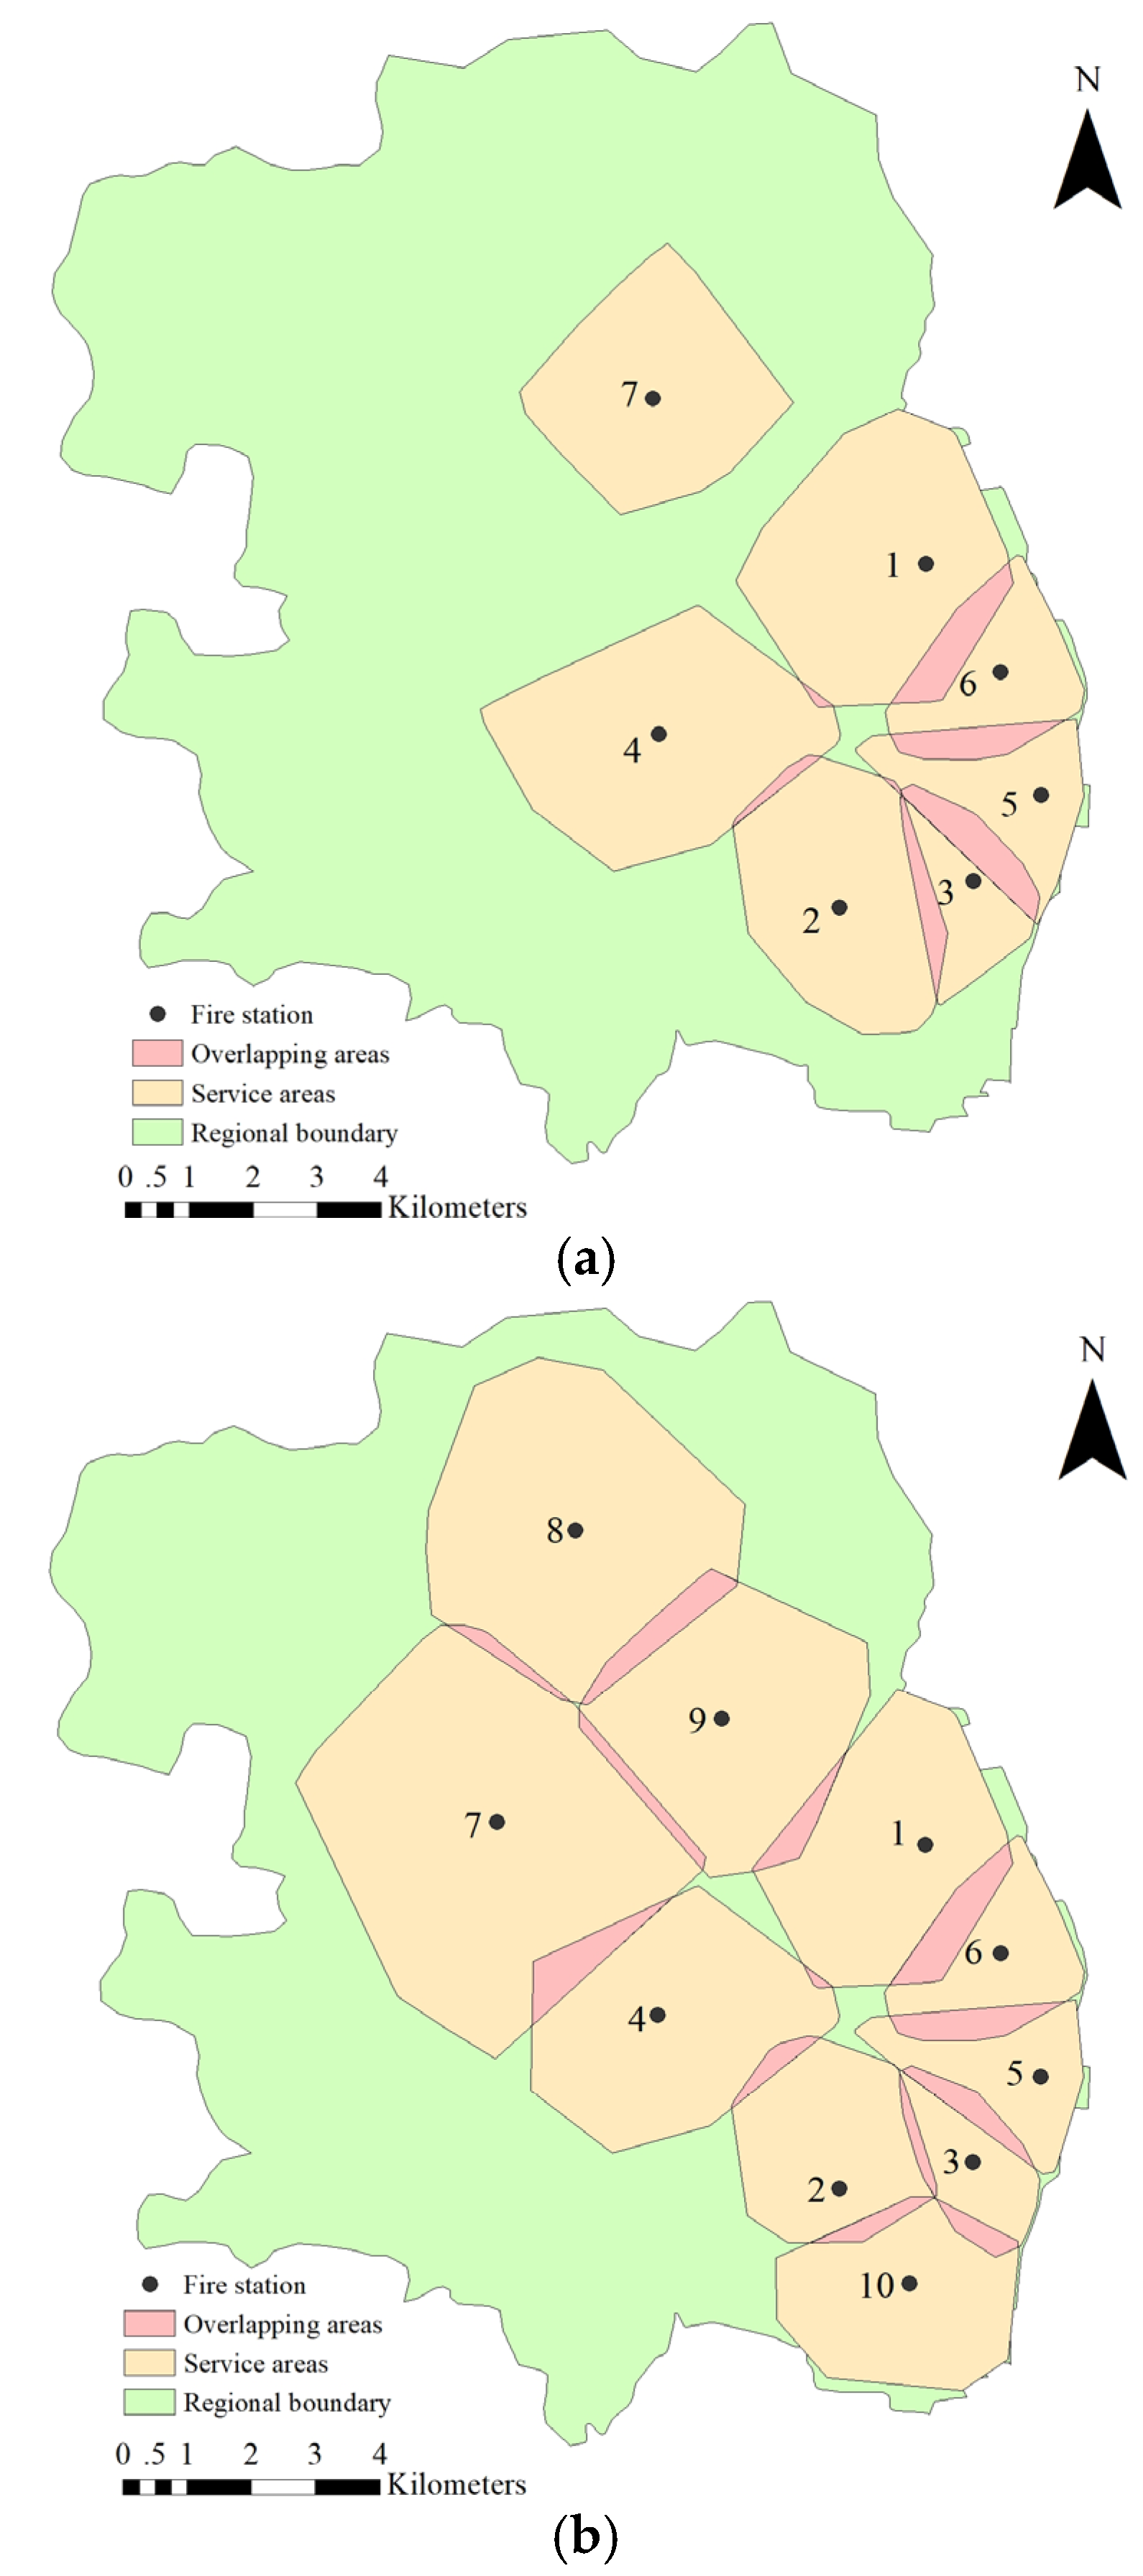
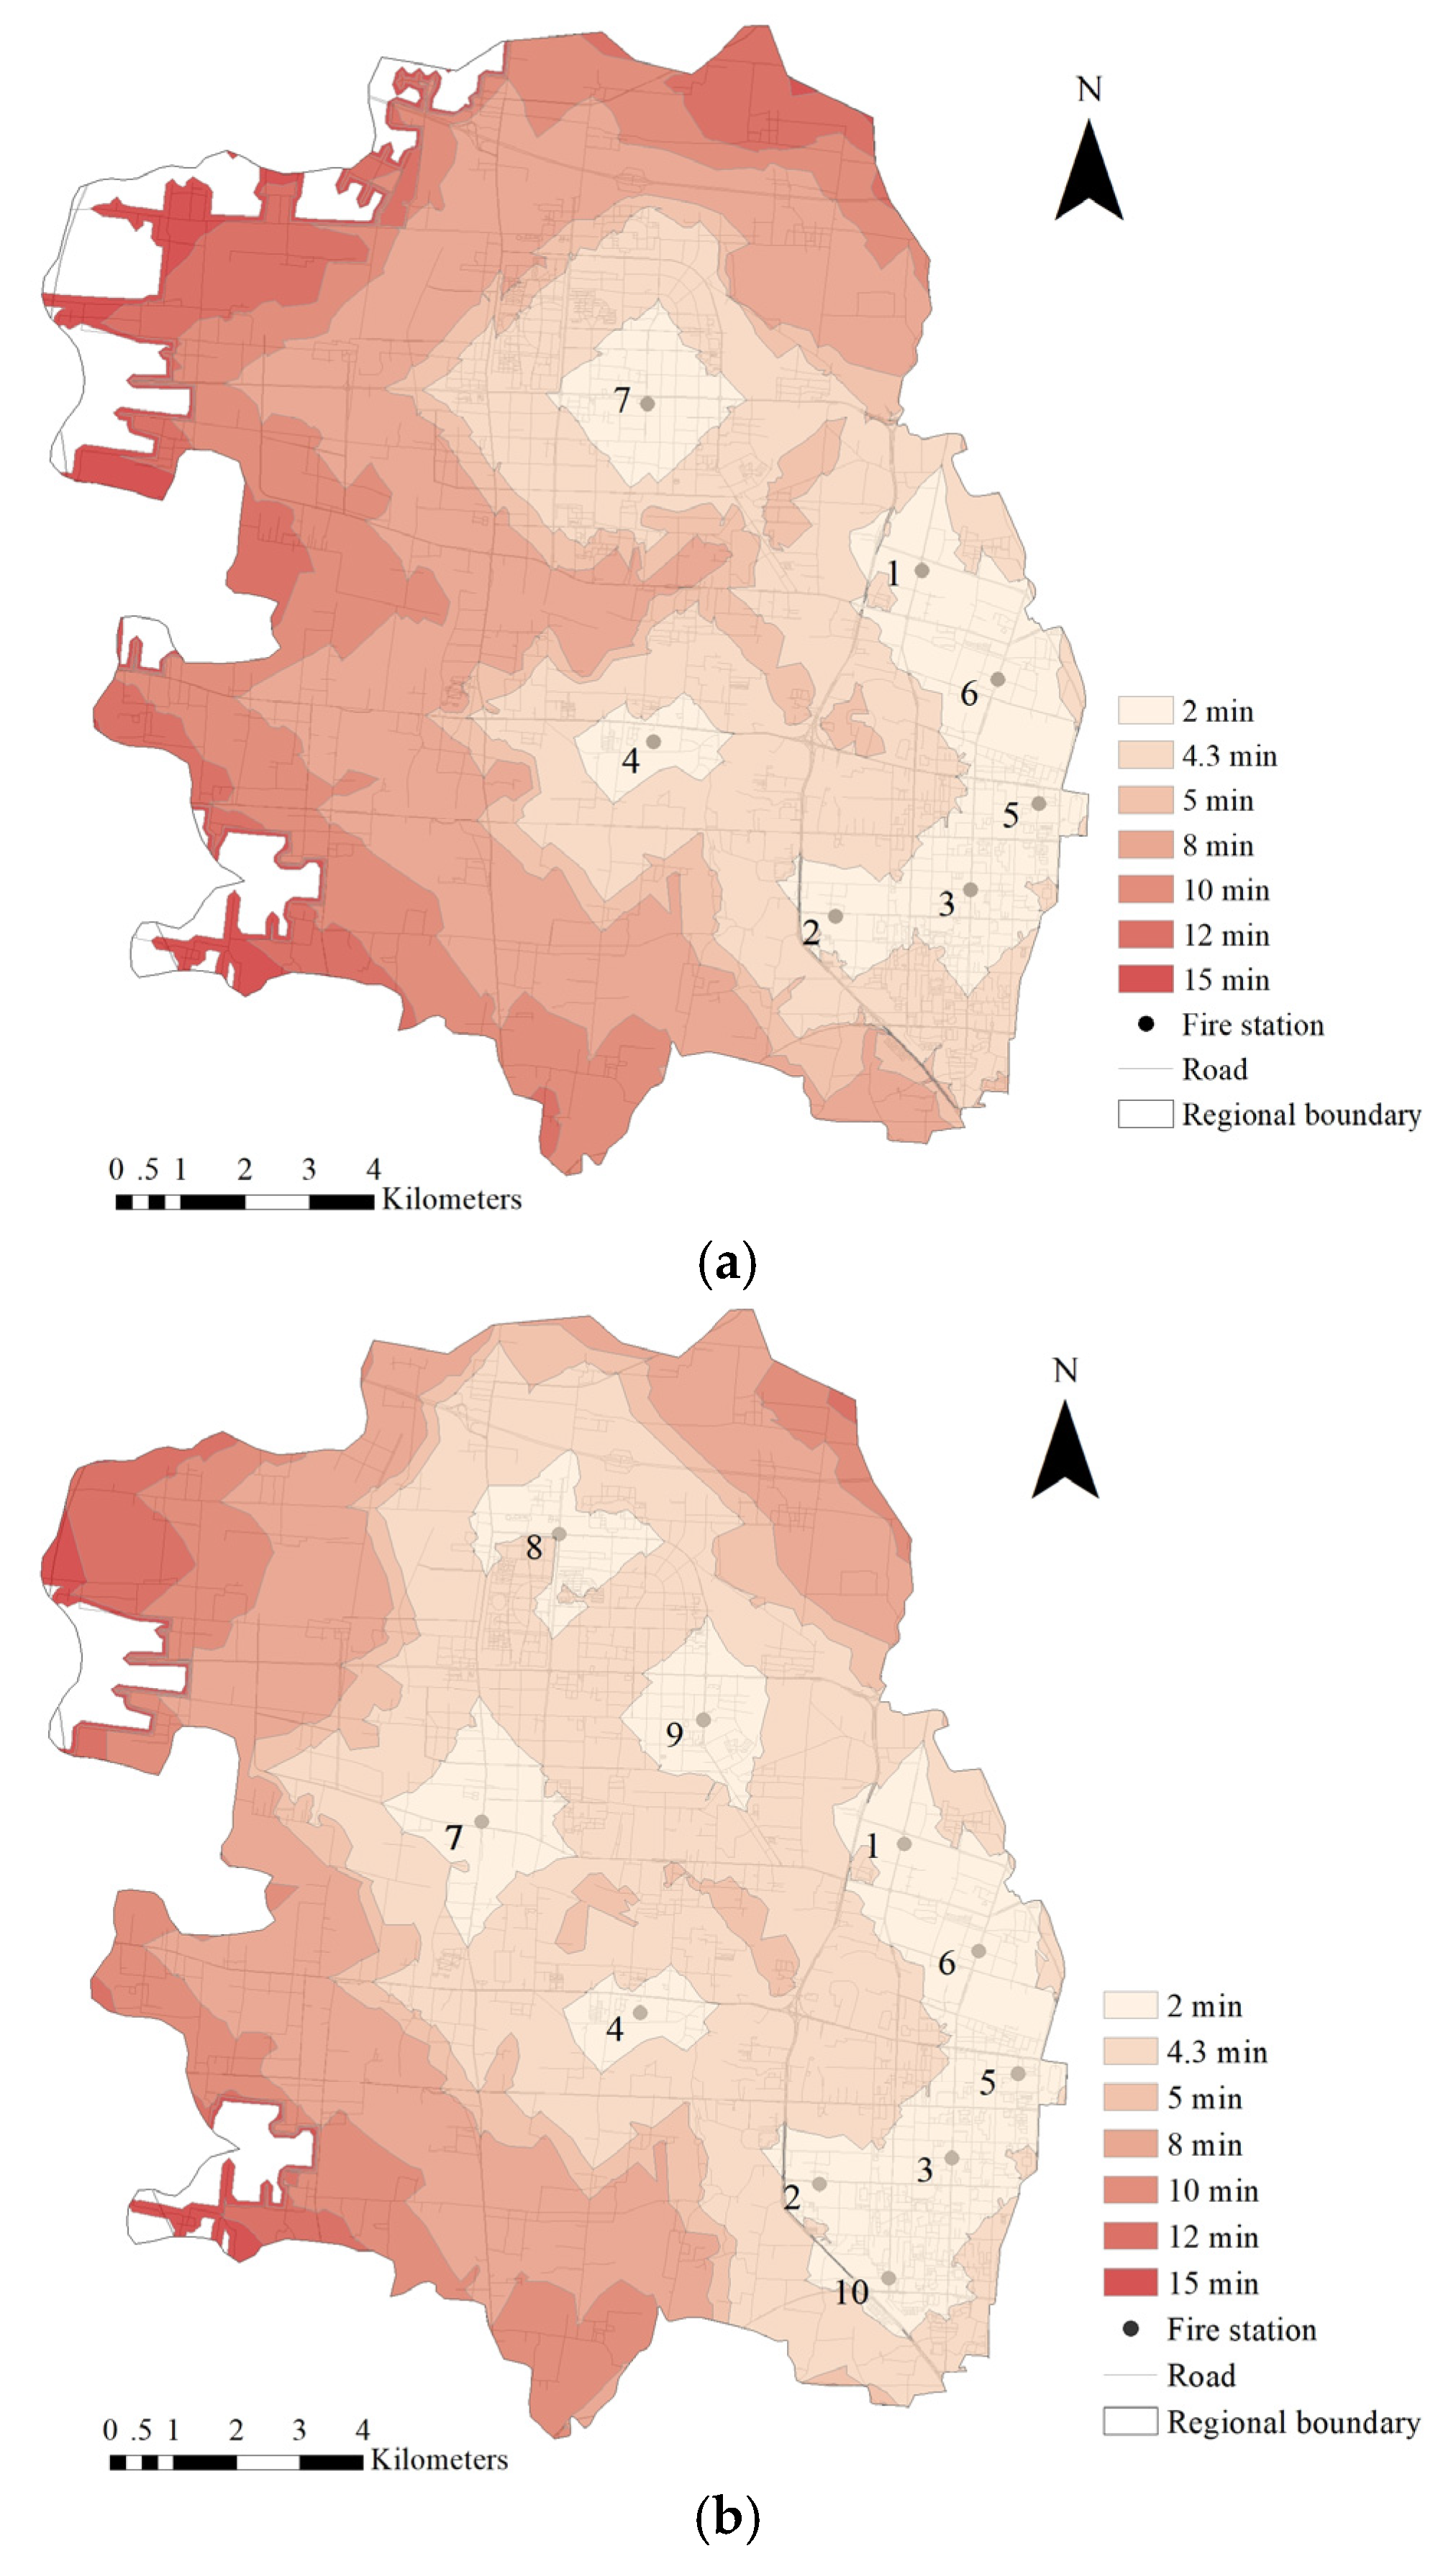
  • (1) Analysis of service areas of seven existing fire stations
The service areas of existing fire stations are obtained by the topological convex hull method, which is shown in Figure 8a. It can be seen that many areas are not covered by the identified convex hull. The number of POIs and the range of service areas are extracted and listed in Table 5. There are overlapping areas between the service areas of the current fire stations. The overlapping areas are marked red at the intersection between different service areas in Figure 8a. The overlapped area is about 4.6 km2. The total service area of the current seven fire stations reaches 61.11 km2 after subtracting the overlapping area, which accounts for about 31.34% of the total area. From the perspective of the coverage ratio of the area in the target district, it is difficult for the current fire stations to meet all the fire demands;
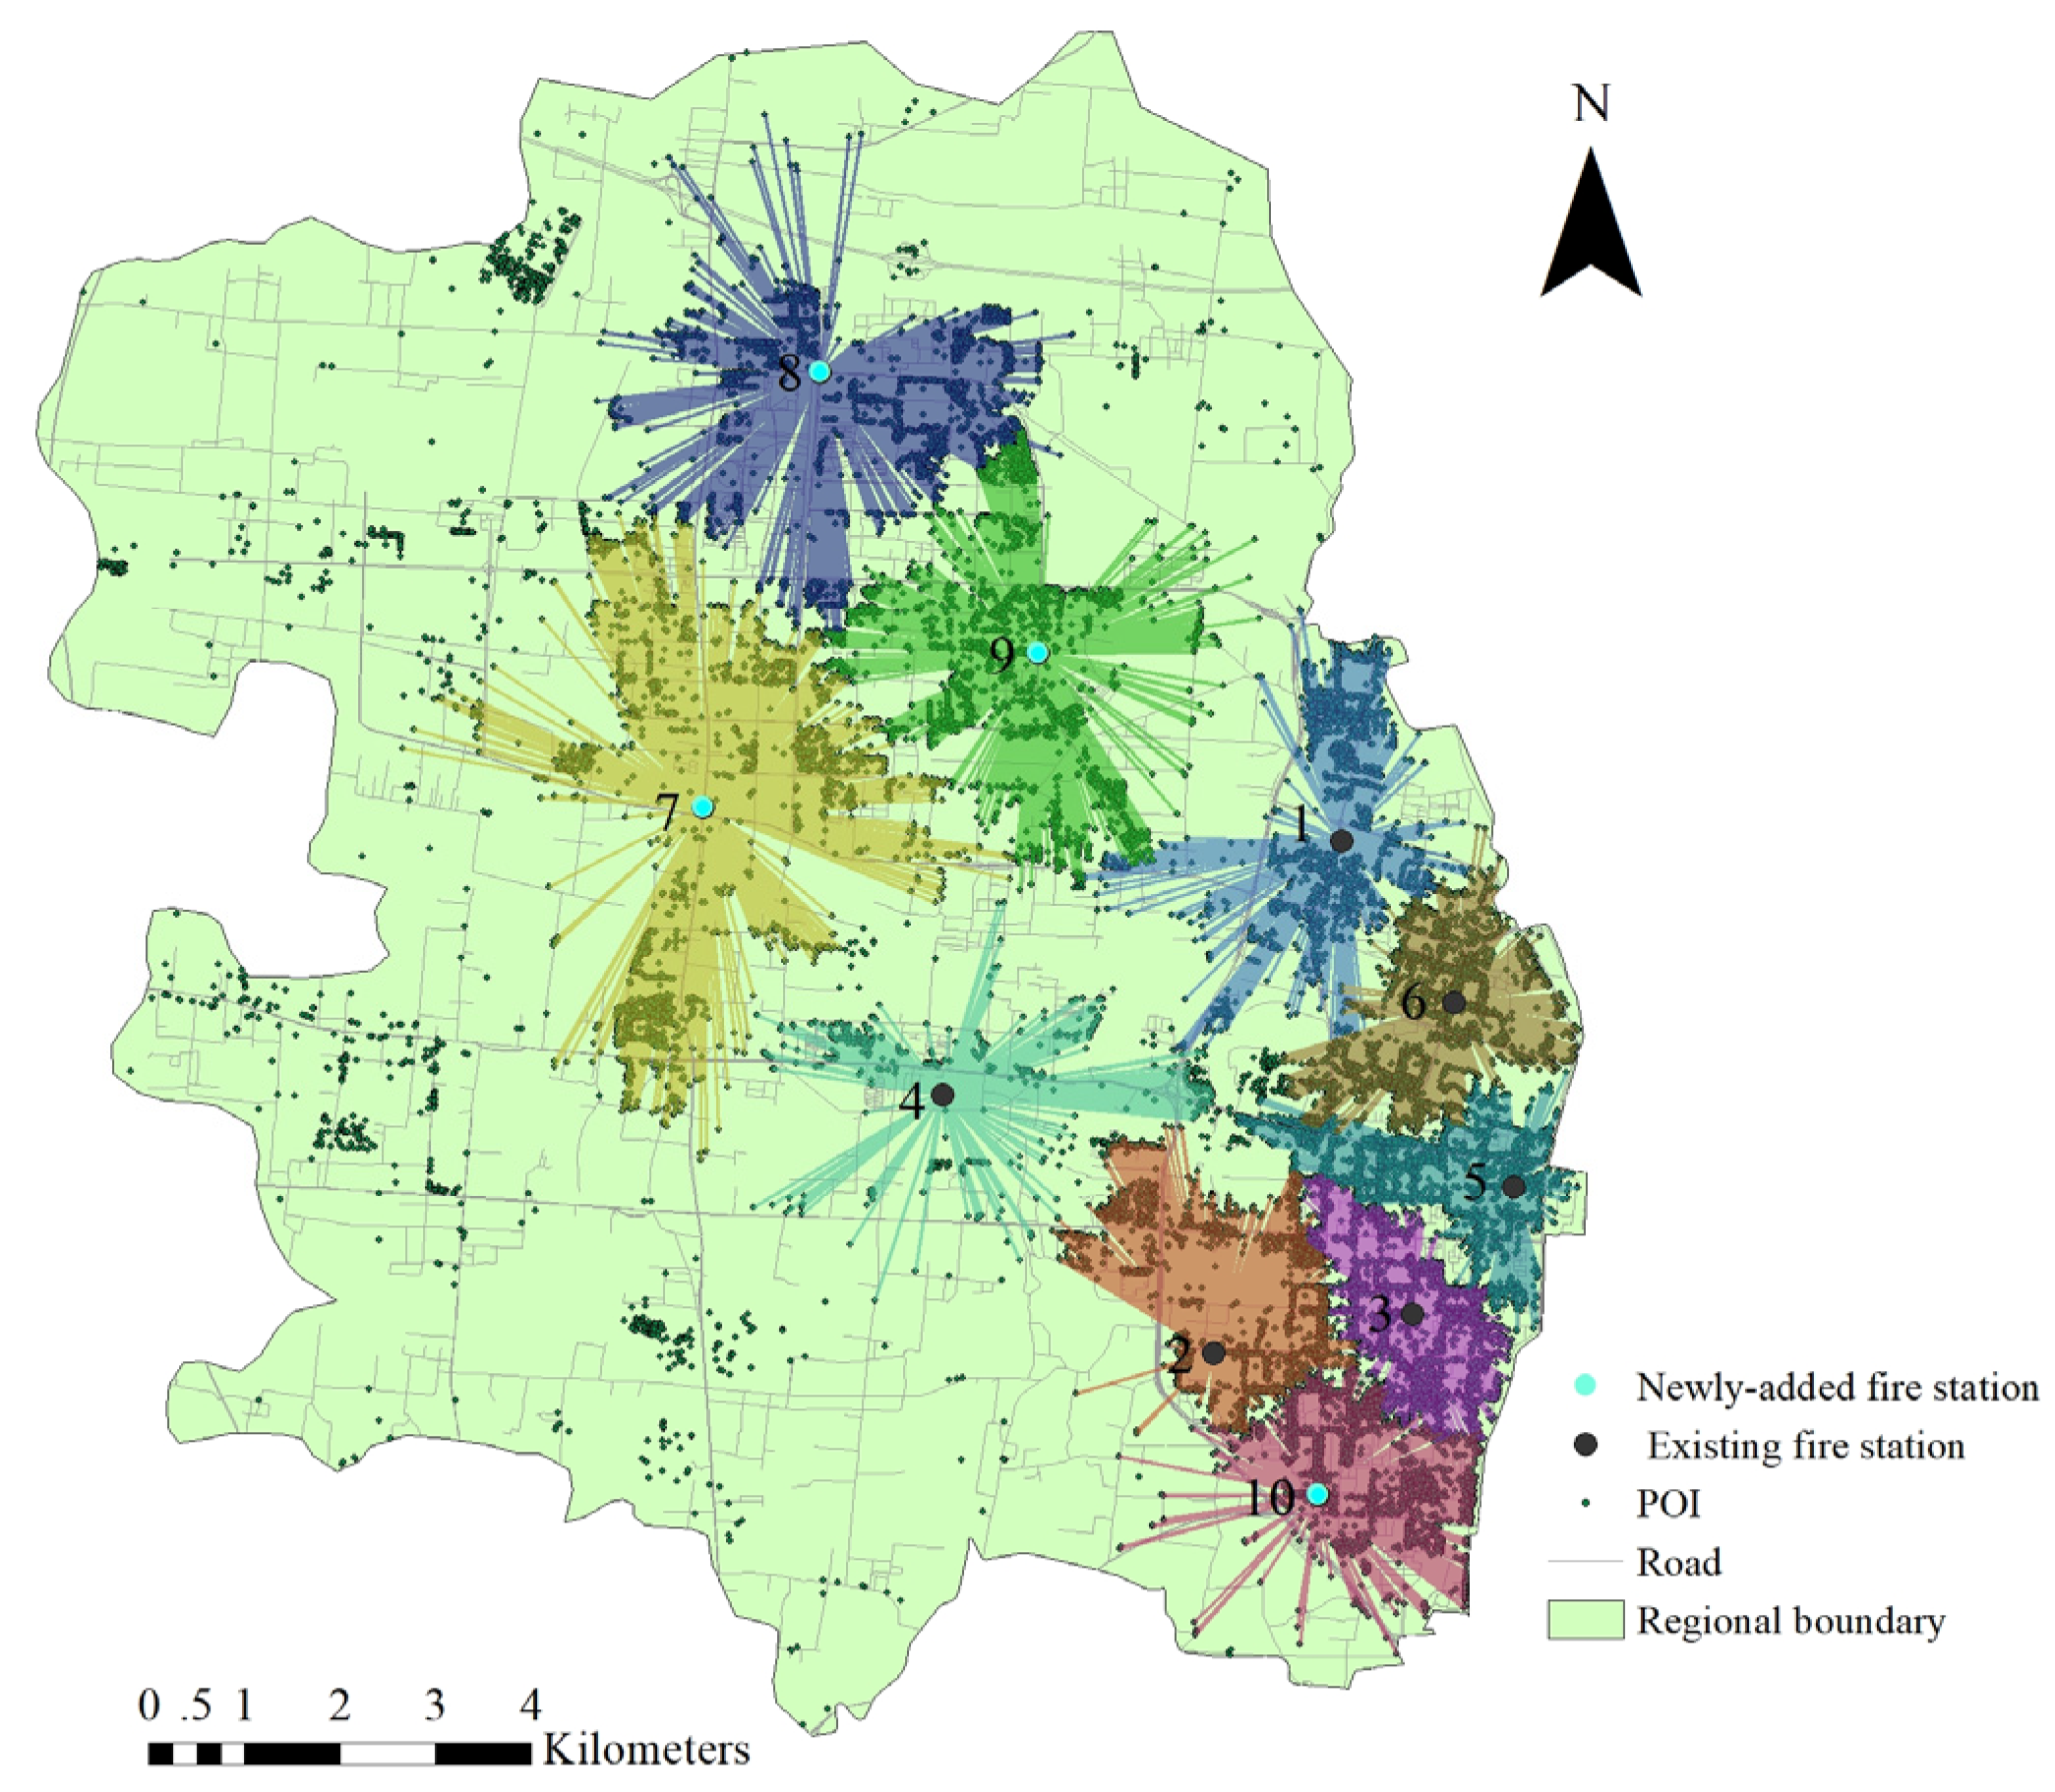
  • (2) Analysis of service areas of fire stations after optimization
The service areas of the 10 fire stations after optimization are shown in Figure 8b. The POIs and service area covered by each fire station are presented in Table 5. The red area where convex hulls intersect with each other in Figure 8b is the service area in an overlapping state. The overlapped area is about 8.1 km2. After merging the overlapping areas, the total service area of the optimized 10 fire stations is 107.34 km2. It accounts for 55.05% of the total area. Compared with the current situation listed in Table 4, the coverage area of the service area has increased by nearly one time, and the densely built regions in the target area are basically fully covered.

5.3. POIs Coverage Rate after Optimization

The existing fire stations are mainly distributed in the southeast of Zhongyuan District. It is also the most densely built area in this district. There are 18,526 POIs falling in the service area of the current fire stations. The coverage of various POIs is shown in Table 6. Existing fire stations have the highest coverage rate of the POIs in residential places, which is 80.3%. The coverage rate of POIs in high-fire risk places is the lowest, which decreases to 56.9%. The coverage of various POIs in the service areas of the 10 fire stations after optimization is presented in Table 6. It can be seen that the coverage rate of all kinds of POI has greatly improved. The coverage rate of high-fire risk places is 89.3%. The coverage rate in other places is over 90%. The highest increase in coverage rate is in hotels. Its POI coverage rate increased to 98.1%.
There are 38 and 9 uncovered POIs in high fire risk places and important firefighting places, respectively. The accessibility of the fire stations to the referred POIs is analyzed. The fire stations and route distribution to reach the unallocated points with the shortest time are identified and shown in Figure 9. All the leftover 47 points are matched to the nearest fire station. There are 6 points whose driving time to the nearest fire station is less than 5 min, and 2 points whose driving time is more than 10 min. Compared to the fire stations before optimization, the number of demand points in uncovered high-fire risk places and important firefighting places is obviously reduced. At the same time, more than 95% of the uncovered demand points can reach the nearest fire station within 10 min. That means the proposed optimization method improves the accessibility of the fire stations to a large extent.

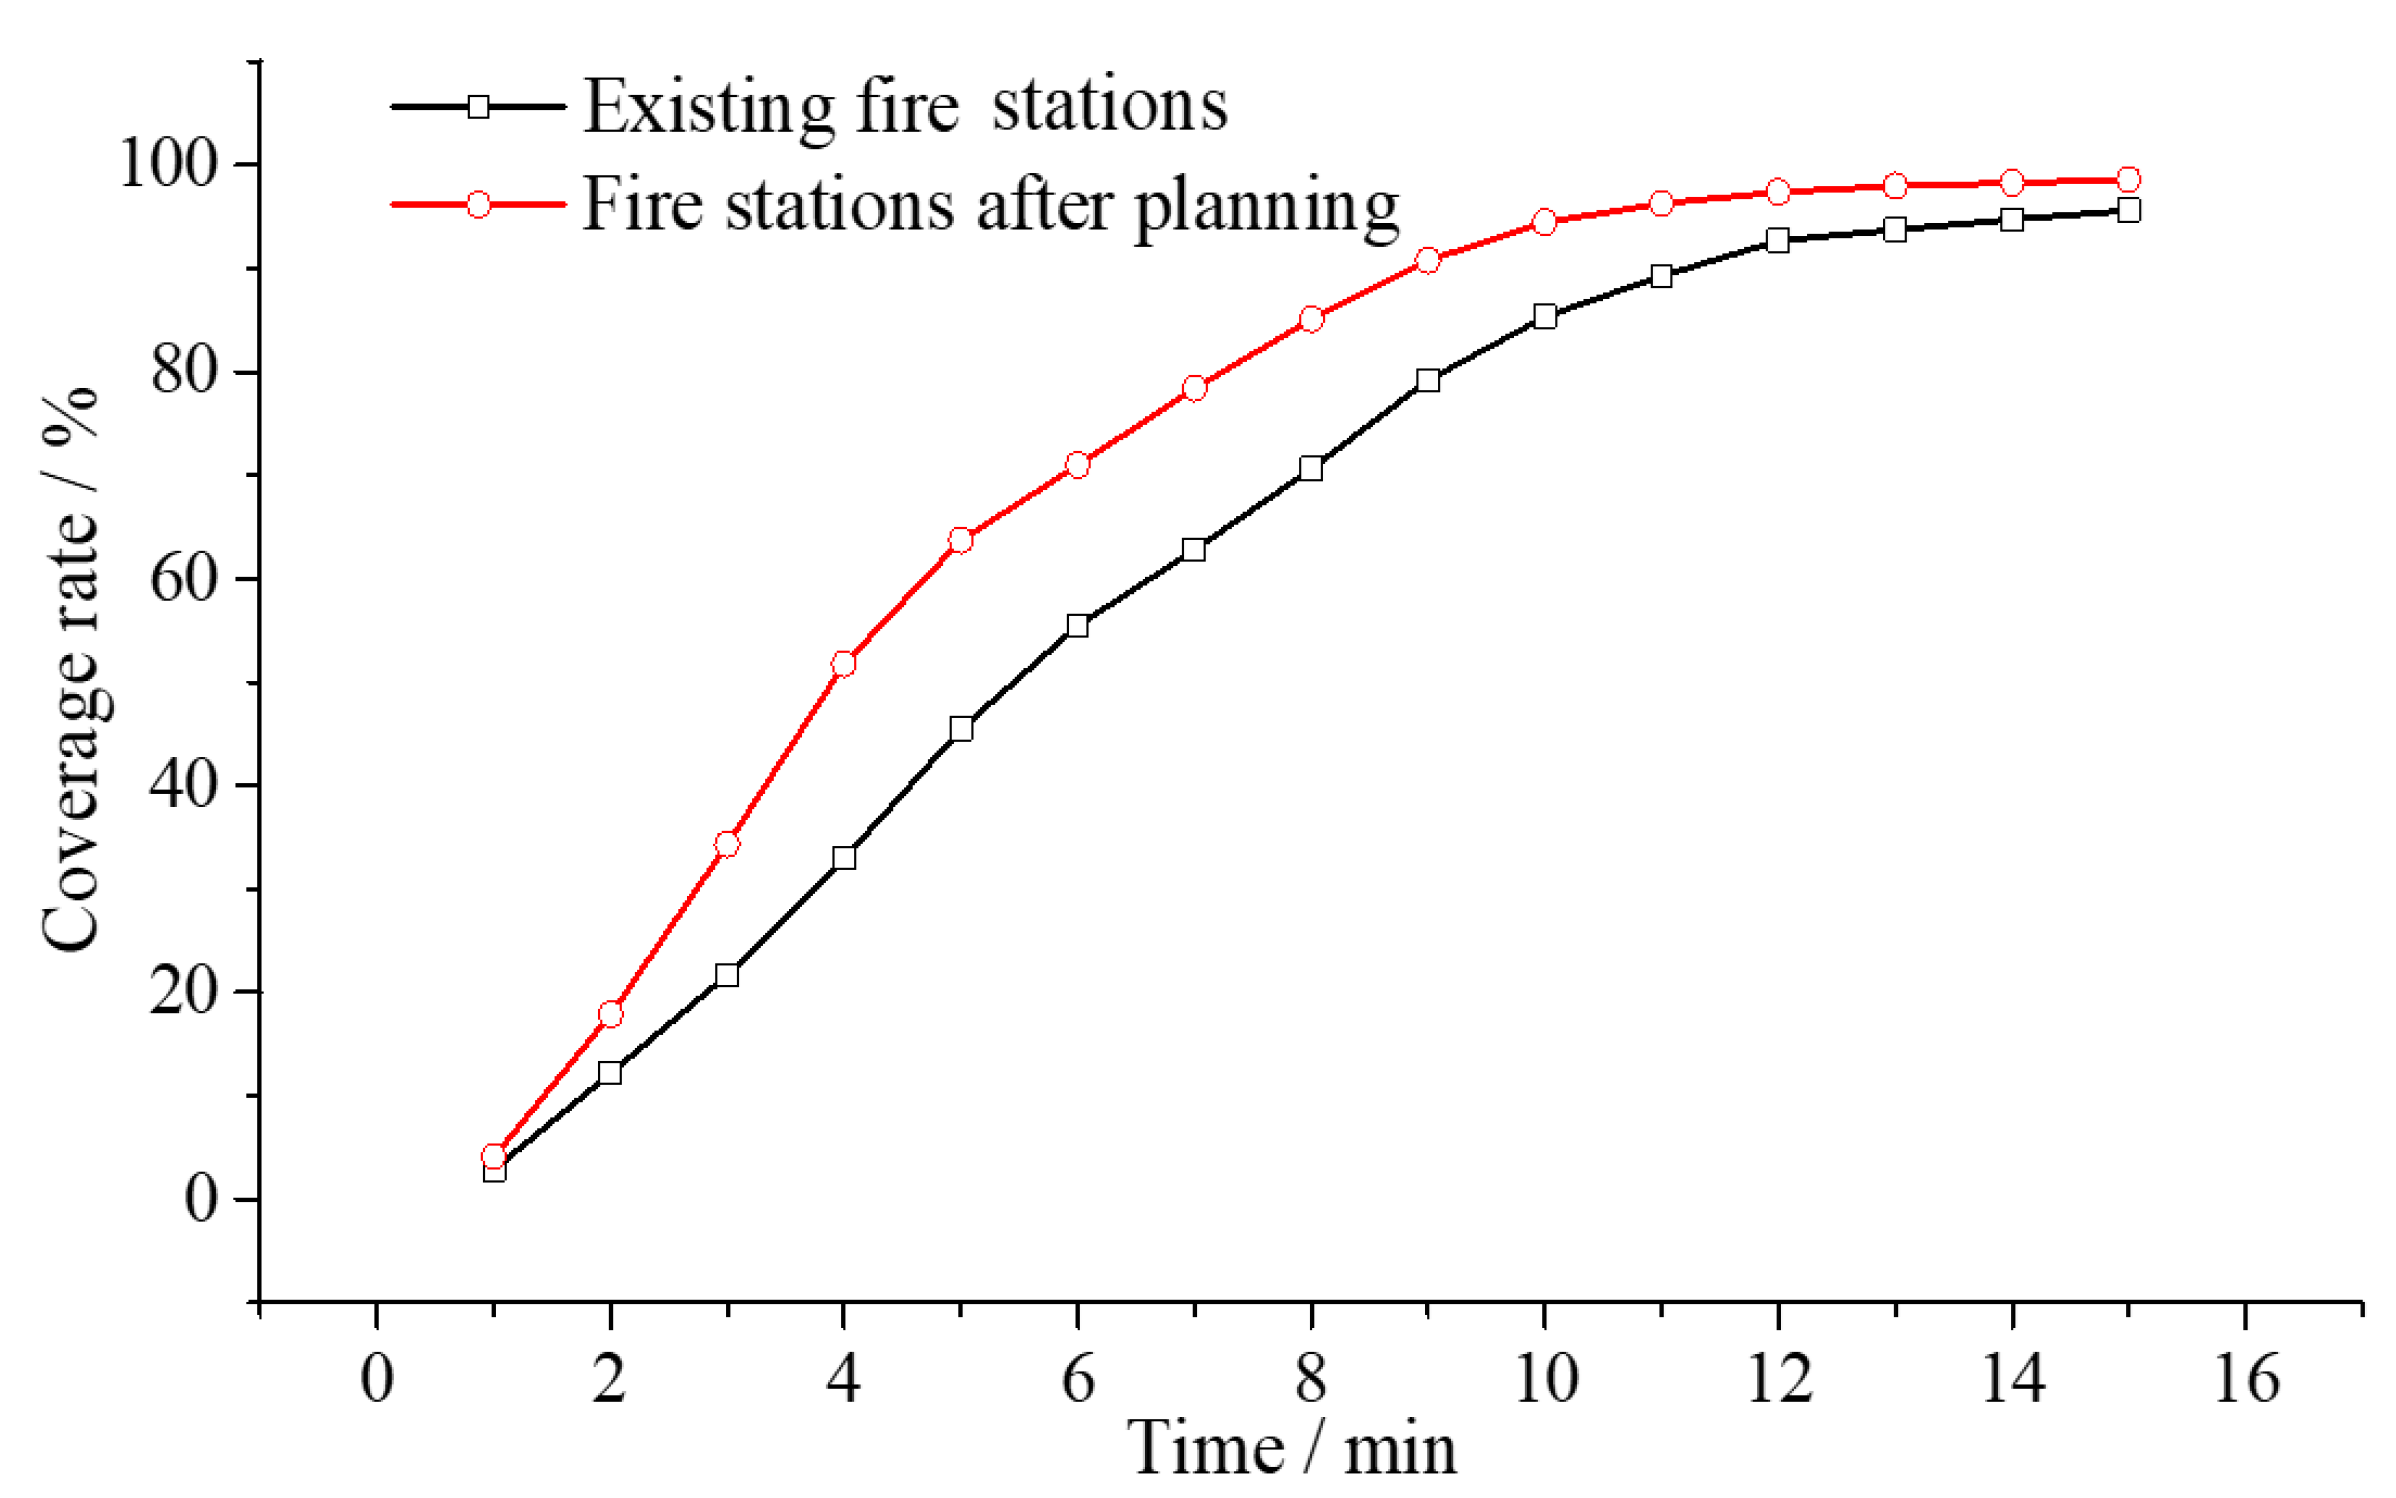
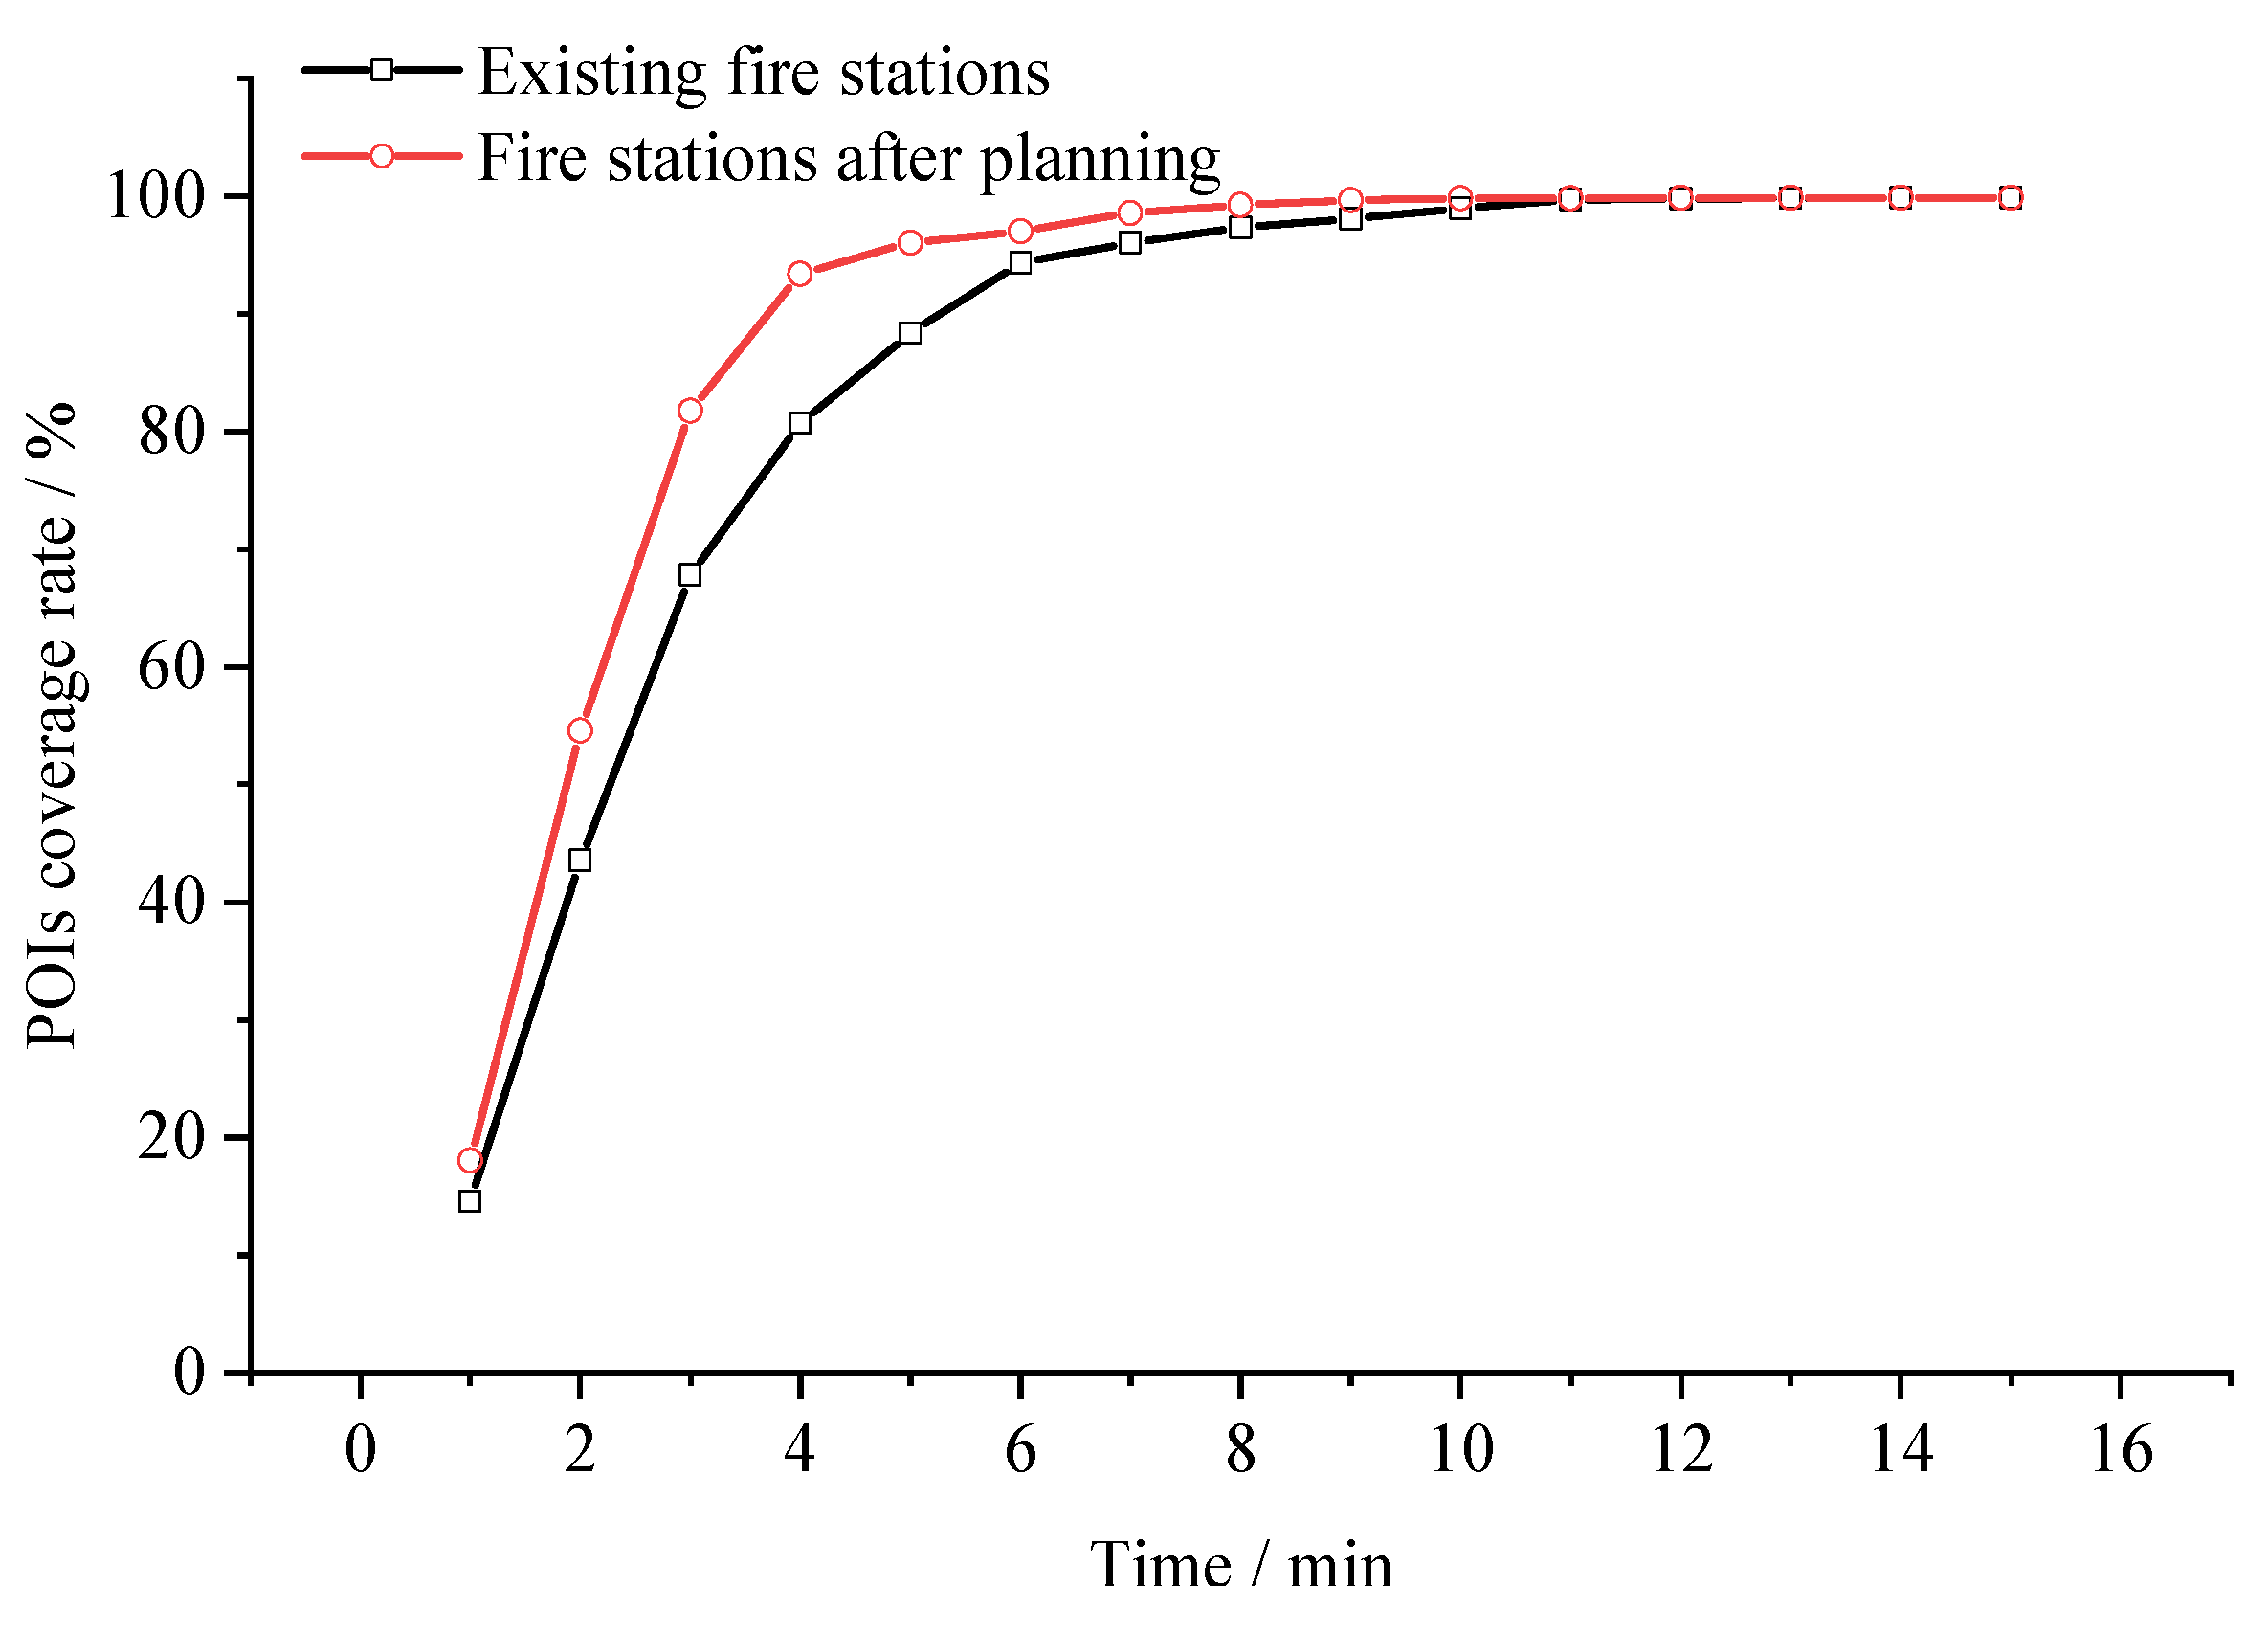
5.4. Time Sensitivity Analysis of Reachable Area

Accessibility refers to the range of areas where fire vehicles arrive at different times from the fire station. The purpose is to analyze the area that can be reached by fire vehicles from the fire station in different time periods before and after the optimization of the fire stations. The accessibility is closely related to the firefighting capabilities of the fire stations. In order to analyze the sensitivity of the accessibility of the fire station to travel time, 2 min, 4.3 min, 5 min, 8 min, 10 min, 12 min, and 15 min are set as the time interruptions for simulation. The accessible ranges of the existing fire stations and the fire stations after optimization are shown in Figure 10a,b, respectively. The area covered by the color, from light to dark, indicates the arrival time of the fire forces as it becomes increasingly longer. The total area of the reachable range of the fire stations corresponding to different arrival times is presented in Table 7. For existing fire stations, the area that can be reached within 2 min accounts for 12.2% of the whole district. The proportion of the area that can be reached within 4.3 min increases to 36.7% of the whole area. Within 5 min and 10 min, the fire stations can reach 45.5% and 85.3% of the target areas, respectively. Within 15 min, the fire vehicles can reach 95.6% of the Zhongyuan District. After optimization, the area that the fire stations can reach within 2 min accounts for 18% of the whole area. The area that can be reached within 4.3 min is 108.8 km2. The fire stations can reach 94.4% of the area within 10 min. Within 15 min, fire vehicles can reach almost every corner of the district. The uncovered area at the region boundary in Figure 10b is mainly affected by the electronic road network used in the simulation calculation. In addition, through the time sensitivity analysis of accessibility, it can be seen that some densely built areas are not effectively covered by fire stations within 4.3 min. According to the sensitivity analysis, the scope and location of the critical areas can be determined, thus providing a basis for constructing local miniature fire stations in the target district.
Regarding fire stations before and after the optimization work, the evolution trend in the coverage rate of the accessible area and POIs with the driving time (1~15 min) is shown in Figure 11 and Figure 12, respectively. As shown in Figure 11, the curve shape indicates that the coverage rate of existing fire stations increases steadily within 12 min. Beyond the critical time, namely, 12 min, the evolution curve remains unchanged. After optimization, the coverage rate of fire stations increased rapidly within 10 min and then the curve was stabilized. That means the rising speed of the evolution curve corresponding to the optimized stations is faster than that related to the existing stations. Within the critical time, the difference between the two evolution curves is obvious. The optimized curve remains about 15% higher than the current curve. Beyond the critical time, two evolution curves become stable; the former is about 5% higher than the latter, which reaches 95% and 90%, respectively. Compared with existing fire stations, the accessibility of the optimized 10 fire stations in the target area is better. Therefore, the fire rescue efficiency of the whole district is effectively improved after re-planning work. As shown in Figure 12, the number of POIs covered by current fire stations is smaller than that covered by the optimized ones when the driving time is less than 6 min. Within this time range, the rate difference experiences first increasing and then subsequent decreasing processes, respectively. The largest difference occurs when the driving time is set to 3 min. Beyond this time range, the difference in coverage rate becomes small. However, the arrival time is so long that the best time for firefighting has been missed. Thus, it is necessary to optimize the fire station layout in Zhongyuan District. After optimization, 94% of the POIs can be covered by the fire stations within 4 min. This rate reaches 97% at the time of 6 min if the current fire station layout is remained. That means the firefighting capacity of the fire stations is greatly strengthened after optimization with the method proposed in this study.

6. Conclusions

Based on the ArcGIS software, the spatial layout optimization of fire stations is realized in this study. The irregular service area of the fire station is identified. The optimization effect is evaluated in terms of the POI coverage and reachable area. Accordingly, the construction plan for the fire station has been put forward. The main conclusions are as follows:
  • (1) Based on the spatial distribution of POIs, an optimization method for spatial layout in the urban fire station is proposed. The LA model includes the MFM and MCM algorithms. Two principles should be combined in optimizing the layout of fire stations. Firstly, as a public facility serving the city, the fire stations should consider as many fire demand points (fire risk points) as possible. The fire stations should maximize the coverage rate of fire demand points. Secondly, the scope and shape of the service area of the fire stations should be reasonably identified. The identified method should make the optimized station maximize the coverage area and minimize the repeated coverage area of the target region. Based on such an understanding, the service area is identified by using the topological partition method of the convex hull according to the POIs assigned to the stations;
  • (2) The LA model is further used to optimize the spatial layout of fire stations in the Zhongyuan District of Zhengzhou City. Taking response time as the constraint, the coverage of seven existing fire stations is analyzed. The results show that the coverage rates of the area and POIs are 31.34% and 71.94%, respectively. The optimization results show that 10 fire stations are needed in the target district, which provides coverage for 95% of the POIs. Regarding the hotel, the highest coverage rate in POIs is reached, which is 98.1%. The fire risk place is the lowest, which also reaches 89.3%. The coverage rate of other categories of POI points is consistently over 90%. Only a small area is uncovered within 4.3 min. After the planning work, the firefighting capacity of fire stations has been greatly strengthened;
  • (3) The sensitivity of the accessible region of the fire stations to the travel time is analyzed. It was found that the evolution curve of the coverage rate in response to the travel time showed an increasing trend, but the rising speed slowed down at long travel time. The optimized curve grows more quickly than the current curve, which means the coverage area of the optimized 10 fire stations has been greatly improved compared with that of the existing fire stations. Especially within 10 min of the travel time, the growth in the coverage area is more obvious after optimization. The area reached within 4.3 min increases from 61.1 to 108.8 km2, accounting for 50% of the target district. About 94% of the research area can be reached in 10 min, and all areas can be reached in 15 min. Overall accessibility is desirable;
The research results can provide guidance for the planning of urban regional fire stations. In fact, many factors should be considered in the construction of a fire station. However, the construction of fire stations in cities should also be combined with whether there are many buildings in the analyzed locations. Furthermore, the land area where fire stations can be built should also be considered. It should be combined with the overall planning of the city. At last, the economic situation should also be considered. Therefore, the location of fire stations is a multi-objective optimization problem. Such factors would be considered in further studies.

Author Contributions

Conceptualization, M.C.; Methodology, Y.Y.; Resources, Y.Y. and C.Y.; Supervision, K.W.; Writing—original draft, K.W.; Writing—review and editing, M.C. All authors have read and agreed to the published version of the manuscript.

Funding

The authors gratefully acknowledge the support of the National Natural Science Foundation of China (No. 52130409).

Data Availability Statement

All data, models, or code that support the findings of this study are available from the corresponding author upon reasonable request.

Conflicts of Interest

The authors declare no conflict of interest.

References

  1. China Fire Yearbook; Yunnan People’s Publishing House: Kunming, China, 2018.
  2. Challands, N. The Relationships Between Fire Service Response Time and Fire Outcomes. Fire Technol. 2010, 46, 665–676. [Google Scholar] [CrossRef]
  3. Analysis of the Fire Accident in Harbin “8.25” Beilong Tangquan Leisure Hotel. 2019. Available online: http://yjgl.hlj.gov.cn/#/NewListDetail?id=49538&parentName (accessed on 24 July 2020).
  4. Investigation Report on “2·16” Fire Accident in Qingcheng District, Qingyuan City. 2019. Available online: http://www.huiyang.gov.cn/hyqzdlyxxgk/aqsc/sgdcbg/content/post_2465632.html (accessed on 29 April 2021).
  5. Investigation Report on “5.25” Fire Accident in Pingdingshan, Henan Province. 2015. Available online: https://www.mem.gov.cn/gk/sgcc/tbzdsgdcbg/2015/201510/t20151014_245219.shtml (accessed on 28 May 2021).
  6. Shahparvari, S.; Fadaki, M.; Chhetri, P. Spatial accessibility of fire stations for enhancing operational response in Melbourne. Fire Saf. J. 2020, 117, 103149. [Google Scholar]
  7. Nyimbili, P.H.; Erden, T. GIS-based fuzzy multi-criteria approach for optimal site selection of fire stations in Istanbul, Turkey. Soc.-Econ. Plan. Sci. 2020, 71, 100860. [Google Scholar] [CrossRef]
  8. Rodriguez, S.A.; Fuente, R.A.; Aguayo, M.M. A facility location and equipment emplacement technique model with expected coverage for the location of fire stations in the Concepción province, Chile. Comput. Ind. Eng. 2020, 147, 106522. [Google Scholar] [CrossRef]
  9. Liu, D.L.; Xu, Z.S.; Yan, L.; Fan, C.G. Dynamic estimation system for fire station service areas based on travel time data. Fire Saf. J. 2020, 118, 103238. [Google Scholar]
  10. Liu, D.L.; Xu, Z.S.; Wang, Z.Y.; Zhou, Y.; Fan, C.G. Estimation of effective coverage rate of fire station services based on real-time travel times. Fire Saf. J. 2021, 120, 103021. [Google Scholar] [CrossRef]
  11. Xu, Z.S.; Liu, D.L.; Yan, L. Evaluating spatial configuration of fire stations based on real-time traffic. Case Stud. Therm. Eng. 2021, 25, 100957. [Google Scholar] [CrossRef]
  12. Bolouri, S.; Vafaeinejad, A.; Alesheikh, A.; Aghamohammadi, H. The ordered capacitated multi-objective location-allocation problem for fire stations using spatial optimization. Int. J. Geo-Inf. 2018, 7, 44. [Google Scholar]
  13. Chaudhary, P.; Chhetri, S.K.; Joshi, K.M.; Shrestha, B.M.; Kayastha, P. Application of an Analytic Hierarchy Process (AHP) in the GIS interface for suitable fire site selection: A case study from Kathmandu Metropolitan City, Nepal. Soc.-Econ. Plan. Sci. 2016, 53, 60–71. [Google Scholar] [CrossRef]
  14. Murray, A.T. Optimising the spatial location of urban fire stations. Fire Saf. J. 2013, 62, 64–71. [Google Scholar]
  15. Zhang, Q. Fire Risk Assessment and Fire Station Layout Research of CBD in Binhai New Area of Tianjin; Tianjin University: Tianjin, China, 2016. [Google Scholar]
  16. Li, Y.J. Taiyuan Urban Space Expansion Based on “Smart Growth Theory”; Shanxi Normal University: Xi’an, China, 2013. [Google Scholar]
  17. Toregas, C.; Swain, R.; ReVelle, C.; Bergman, L. The location of emergency service facilities. Oper. Res. 1971, 19, 1363–1373. [Google Scholar] [CrossRef]
  18. Kiran, K.C.; Corcoran, J.; Chhetri, P. Spatial optimisation of fire service coverage: A case study of Brisbane, Australia. Geogr. Res. 2018, 56, 270–284. [Google Scholar]
  19. Zhu, Z.H. Charging Station Location Problem of Electric Vehicles; Beijing Jiaotong University: Beijing, China, 2018. [Google Scholar]
  20. Chen, Y.L. Geographical Calculation of Optimizing Location of Public Service Facilities in Rural Areas; East China Normal University: Shanghai, China, 2019. [Google Scholar]
  21. Pu, J.Y. Research on Decision-Making Method of Freeway Traffic Emergency Rescue Resource Deployment; Southeast University: Nanjing, China, 2019. [Google Scholar]
  22. Yang, X.H. Siting Facilities in Continuous Space to Maximize Spatial Demands Based on GIS; Tsinghua University: Beijing, China, 2013. [Google Scholar]
  23. Lei, T.L.; Church, R.L.; Lei, Z. A unified approach for location-allocation analysis: Integrating GIS, distributed computing and spatial optimization. Int. J. Geogr. Inf. Sci. 2016, 30, 515–534. [Google Scholar]
  24. Su, Z.Y. Python Optimization Algorithm; Peking University Press: Beijing, China, 2020. [Google Scholar]
  25. Fire Department of the Ministry of Public Security. Construction Standard of Urban Fire Station; China Planning Press: Beijing, China, 2017. [Google Scholar]
  26. Wang, K.; Yuan, Y.F.; Chen, M.M.; Wang, D.Z. A POIs based method for determining spatial distribution of urban fire risk. Process Saf. Environ. Prot. 2021, 154, 447–457. [Google Scholar]
  27. Que, Z.S.; Hu, H.W.; Chen, S.X. Analysis of the optimization in urban fire station layout planning based on location-allocation of GIS. Beijing Surv. Mapp. 2013, 2, 19–24. [Google Scholar]
  28. Jin, C.; Lu, Y.L.; Zhang, L.; Xu, Q. An analysis of accessibility of scenic spots based on land traffic network: A case study of Nanjing. Geogr. Res. 2009, 28, 246–258. [Google Scholar]
  29. Ministry of Housing and Urban-Rural Construction of the People’s Republic of China. Code for Design of Urban Road Engineering (CJJ37-2016); China Architecture & Building Press: Beijing, China, 2016. [Google Scholar]
Figure 1. Protection scope of existing fire stations.
Fire 06 00058 g001
Figure 2. POIs, roads, and buildings distribution of Zhongyuan District. (a) POIs distribution. (b) roads and buildings distribution.
Fire 06 00058 g002
Figure 3. Location and maximum coverage for different numbers of fire stations. (a) Seven fire stations. (b) Eight fire stations. (c) Nine fire stations. (d) Ten fire stations. (e) Eleven fire stations. (f) Twelve fire stations. (g) Thirteen fire stations. (h) Fourteen fire stations. (The lines with different colors in represent the POIs assigned to different fire stations)
Fire 06 00058 g003aFire 06 00058 g003bFire 06 00058 g003c
Figure 4. Coverage rates for different numbers of fire stations.
Fire 06 00058 g004
Figure 5. Maximum coverage of fire stations after planning. (The lines with different colors in represent the POIs assigned to different fire stations; The red and black dots represent the existing and newly added stations respectively.)
Fire 06 00058 g005
Figure 6. Location of optimized fire stations. (The lines with different colors represent the POIs assigned to different fire stations.)
Fire 06 00058 g006
Figure 7. Identification method of the convex service area corresponding to the fire station. (a) Recursive principle. (b) Overlapping coverage area. (The red and blue stars (O and P) represent the different fire stations; The red and blue dots represent POIs within the convex hull covered by fire stations O and P respectively; The letters except O and P represent the POIs selected for analysis.)
Fire 06 00058 g007
Figure 8. Service areas of fire stations. (a) Existing fire stations. (b) Fire stations after planning.
Fire 06 00058 g008
Figure 9. Uncovered POI points of high-fire risk places and important firefighting places.
Fire 06 00058 g009
Figure 10. Accessible area of fire stations at different times after planning. (a) Accessibility of existing fire stations. (b) Accessibility of fire stations after planning.
Fire 06 00058 g010
Figure 11. Area coverage rate of fire stations at different times before and after planning.
Fire 06 00058 g011
Figure 12. POI coverage rate of fire stations at different times before and after planning.
Fire 06 00058 g012
Table 1. The number of POIs in various places.
NameResidential PlacesHotelsRestaurantsCommerce PlacesOffice PlacesHigh Fire Risk PlacesImportant Fire-Fighting PlacesGeneral Fire-Fighting Places
Number22385364776702762263551093853
Table 2. The speed of the roads at all levels.
Road GradeHigh-Speed RoadMain RoadSecondary Trunk RoadBranchNational HighwayProvincial HighwayCountry Road
Speed/km/h70504030606040
Table 3. POI coverage rates for different numbers of fire stations.
Total Number of Fire StationsNumber of POIs CoveredTotal Time Required/minAverage Time Required/minNumber of POIs UncoveredCoverage Rate/%
615,07226,6851.7710,04860.00
718,07232,5941.80704871.94
821,06140,8171.94405983.84
922,44044,2071.97268089.33
1023,78044,8921.89134094.67
1123,86740,9771.72125395.01
1223,95340,8971.71116795.35
1323,95537,5401.57116595.36
1423,95636,9861.54116495.37
Table 4. The number of POIs covered by each fire station after short-term planning.
NumberNumber of POIs CoveredTotal Time/minAverage Time Required/minNumberNumber of POIs CoveredTotal Time/minAverage Time Required/min
1257544981.756282141231.46
2212448652.297255567562.64
3300038691.298245254042.20
445112902.869273855532.03
5300050851.7010206434491.67
Table 5. POI coverage and the convex hull area of each fire station before and after planning.
12345678910
Existing fire stationsNumber of POIs covered276030003000468300028443000///
Convex hull area/km213.7610.574.5114.096.396.0910.36///
Fire stations after planningNumber of POIs covered257521243000451300028212555245227382064
Convex hull area/km212.197.853.9413.195.586.092518.614.188.82
Table 6. The number of POIs in different places covered by fire stations before and after planning.
Total NumberNameResidential PlacesHotelsRestaurantsCommerce PlacesOffice PlacesHigh-Fire Risk PlacesImportant Firefighting PlacesGeneral Firefighting Places
7Number1797356343452254481202762955
Coverage rate/%80.366.471.974.371.956.969.776.6
10Number21745264624676857203171003690
Coverage rate/%97.198.196.896.391.989.391.795.8
Table 7. Coverage area of fire stations in different time periods.
NameTime/min24.358101215
Existing fire stationsCoverage area/km223.871.788.7137.7166.3180.7186.4
Coverage rate/%12.236.745.570.685.392.795.6
Fire stations after planningCoverage area/km234.9108.8124.3165.9184.1189.9192.2
Coverage rate/%17.955.863.785.194.497.498.6
Disclaimer/Publisher’s Note: The statements, opinions and data contained in all publications are solely those of the individual author(s) and contributor(s) and not of MDPI and/or the editor(s). MDPI and/or the editor(s) disclaim responsibility for any injury to people or property resulting from any ideas, methods, instructions or products referred to in the content.

