
Investigating the Effect of Oxidants on the Quantification and Characterization of Charcoal in Two Southeast Australian Sedimentary Records


Abstract
:1. Introduction
2. Methods
3. Results
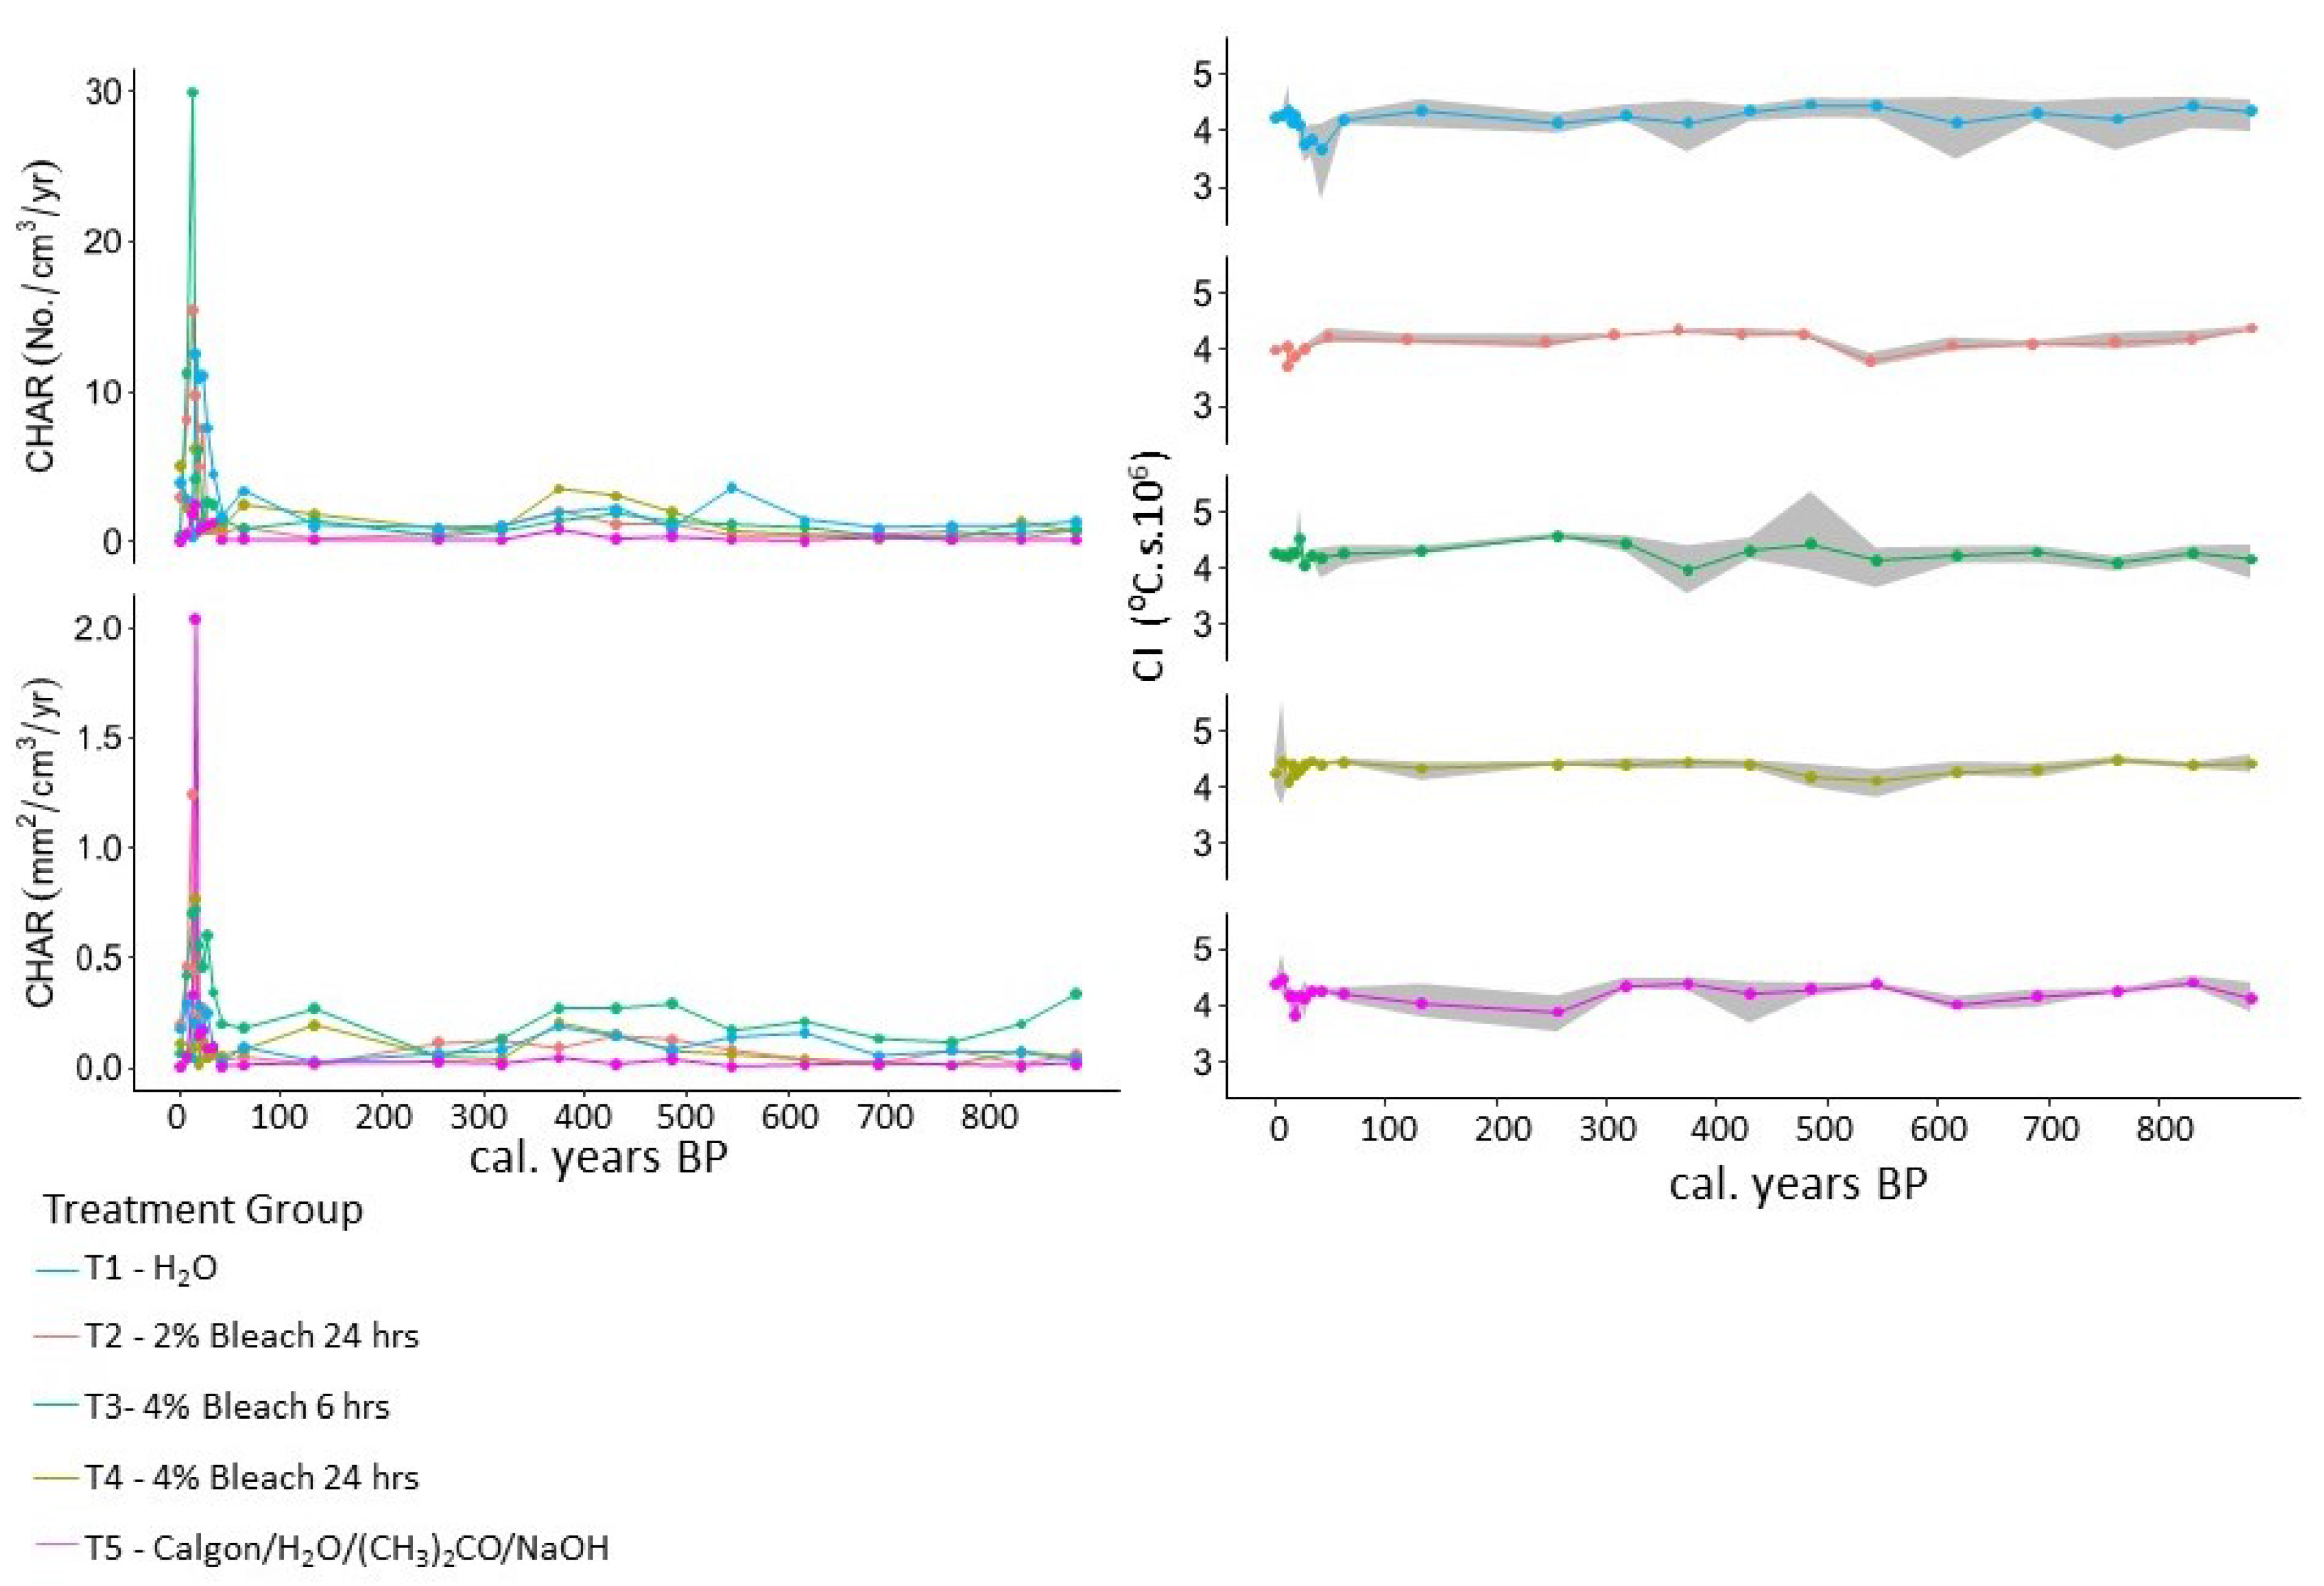
3.1. WB3
3.2. LC2
4. Discussion
5. Conclusions
Supplementary Materials
Author Contributions
Funding
Data Availability Statement
Acknowledgments
Conflicts of Interest
References
- Iversen, J. Landnam i Danmarks stenalder (Land occupation in Denmark’s Stone Age). Dan. Geol. Unders. 1941, 66, 1–68. [Google Scholar]
- Bird, M.I.; Ascough, P.L. Isotopes in pyrogenic carbon. Org. Geochem. 2012, 42, 1529–1539. [Google Scholar] [CrossRef]
- Scott, A.C. Charcoal recognition, taphonomy and uses in palaeoenvironmental analysis. Palaeogeogr. Palaeoclimatol. Palaeoecol. 2010, 291, 11–39. [Google Scholar] [CrossRef]
- Novakov, T.; Cachier, H.; Clark, J.S.; Gaudichet, A.; Macko, S.; Masclet, P. Characterization of Particulate Products of Biomass Combustion. In Sediment Records of Biomass Burning and Global Change; Springer: Berlin/Heidelberg, Germany, 1997; pp. 117–143. [Google Scholar] [CrossRef]
- Clark, R. Effects on charcoal of pollen preparation procedures. Pollen et Spores 1984, 26, 559–576. [Google Scholar]
- Patterson, W.A.; Edwards, K.J.; Maguire, D.J. Microscopic charcoal as a fossil indicator of fire*. Transport 1987, 6, 3–23. [Google Scholar] [CrossRef]
- Clark, R. Point count estimation of charcoal in pollen preparations and thin sections of sediments. Pollen et Spores 1982, 24, 523–535. [Google Scholar]
- Clark, J.S. Particle motion and the theory of charcoal analysis: Source area, transport, deposition, and sampling. Quat. Res. 1988, 30, 67–80. [Google Scholar] [CrossRef]
- MacDonald, G.M.; Larsen, C.P.S.; Szeicz, J.M.; Moser, K.A. The reconstruction of boreal forest fire history from lake sediments: A comparison of charcoal, pollen, sedimentological, and geochemical indices. Quat. Sci. Rev. 1991, 10, 53–71. [Google Scholar] [CrossRef]
- Millspaugh, S.H.; Whitlock, C. A 750-year fire history based on lake sediment records in central Yellowstone National Park, USA. Holocene 1995, 5, 283–292. [Google Scholar] [CrossRef]
- Long, C.J.; Whitlock, C.; Bartlein, P.J.; Millspaugh, S.H. A 9000-year fire history from the Oregon Coast Range, based on a high-resolution charcoal study. Can. J. For. Res. 1998, 28, 774–787. [Google Scholar] [CrossRef]
- Thevenon, F.; Williamson, D.; Bard, E.; Anselmetti, F.S.; Beaufort, L.; Cachier, H. Combining charcoal and elemental black carbon analysis in sedimentary archives: Implications for past fire regimes, the pyrogenic carbon cycle, and the human-climate interactions. Glob. Planet. Change 2010, 72, 381–389. [Google Scholar] [CrossRef]
- Tsakiridou, M.; Cunningham, L.; Hardiman, M. Toward a standardized procedure for charcoal analysis. Quat. Res. 2021, 99, 329–340. [Google Scholar] [CrossRef]
- Gardner, J.J.; Whitlock, C. Charcoal accumulation following a recent fire in the Cascade Range, northwestern USA, and its relevance for fire-history studies. Holocene 2001, 11, 541–549. [Google Scholar] [CrossRef]
- Carcaillet, C.; Bouvier, M.; Fréchette, B.; Larouche, A.C.; Richard, P.J.H. Comparison of pollen-slide and sieving methods in lacustrine charcoal analyses for local and regional fire history. Holocene 2001, 11, 467–476. [Google Scholar] [CrossRef]
- Constantine, M.; Mooney, S. Widely used charcoal analysis method in paleo studies involving NaOCl results in loss of charcoal formed below 400 °C. Holocene 2021, 32, 1–5. [Google Scholar] [CrossRef]
- Nguyen, B.T.; Lehmann, J.; Hockaday, W.C.; Joseph, S.; Masiello, C.A. Temperature sensitivity of black carbon decomposition and oxidation. Environ. Sci. Technol. 2010, 44, 3324–3331. [Google Scholar] [CrossRef]
- Alexis, M.A.; Rumpel, C.; Knicker, H.; Leifeld, J.; Rasse, D.; Péchot, N.; Bardoux, G.; Mariotti, A. Thermal alteration of organic matter during a shrubland fire: A field study. Org. Geochem. 2010, 41, 690–697. [Google Scholar] [CrossRef]
- Forbes, M.; Cohen, T.; Jacobs, Z.; Marx, S.; Barber, E.; Dodson, J.; Zamora, A.; Cadd, H.; Francke, A.; Constantine, M.; et al. Comparing interglacials in eastern Australia: A multi-proxy investigation of a new sedimentary record. Quat. Sci. Rev. 2021, 252, 1–20. [Google Scholar] [CrossRef]
- Francke, A.; Dosseto, A.; Forbes, M.; Cadd, H.; Short, J.; Sherborne-Higgins, B.; Constantine, M.; Tibby, J.; Marx, S.K.; Dodson, J.; et al. Catchment vegetation and erosion controls soil carbon cycling in south-eastern Australia during the last two Glacial-Interglacial cycles. Glob. Planet. Change 2022, 217, 103922. [Google Scholar] [CrossRef]
- Blaauw, M.; Christen, J.A.; Aquino-Lopez, M.A.; Esquivel-Vazquez, J.V.; Gonzalez, O.M.; Belding, T.; Theiler, J.; Gough, B.; Karney, C. rplum (0.2.2). 2021. Available online: https://www.rdocumentation.org/packages/rplum/versions/0.2.2 (accessed on 15 November 2022).
- Aquino-López, M.A.; Blaauw, M.; Christen, J.A.; Sanderson, N.K. Bayesian Analysis of 210 Pb Dating. J. Agric. Biol. Environ. Stat. 2018, 23, 317–333. [Google Scholar] [CrossRef]
- Turney, C.; Becerra-Valdivia, L.; Sookdeo, A.; Thomas, Z.; Palmer, J.; Haines, H.; Cadd, H.; Wacker, L.; Baker, A.; Anderson, M.; et al. Radiocarbon Protocols and First Intercomparison Results from the Chronos 14 Carbon-Cycle Facility, University of New South Wales, Sydney, Australia. Radiocarbon 2021, 63, 1003–1023. [Google Scholar] [CrossRef]
- Cadd, H.R.; Sherborne-Higgins, B.; Becerra-Valdivia, L.; Tibby, J.; Barr, C.; Forbes, M.; Cohen, T.; Tyler, J.; Vandergoes, M.; Francke, A.; et al. The application of pollen radiocarbon dating and Bayesian age-depth modelling for developing robust geochronological frameworks of wetland archive. Radiocarbon 2022, 64, 213–235. [Google Scholar] [CrossRef]
- Zheng, X.; Amesbury, M.J.; Hope, G.; Martin, L.F.; Mooney, S.D. Testate amoebae as a hydrological proxy for reconstructing water-table depth in the mires of south-eastern Australia. Ecol. Indic. 2019, 96, 701–710. [Google Scholar] [CrossRef]
- Mooney, S.D.; Tinner, W. The analysis of charcoal in peat and organic sediments. Mires Peat 2011, 7, 1–18. [Google Scholar]
- Rueden, C.T.; Schindelin, J.; Hiner, M.C.; DeZonia, B.E.; Walter, A.E.; Arena, E.T.; Eliceiri, K.W. ImageJ2: ImageJ for the next generation of scientific image data. BMC Bioinform. 2017, 18, 1–26. [Google Scholar] [CrossRef]
- Whitlock, C.; Millspaugh, S.H. Testing the assumptions of fire-history studies: An examination of modern charcoal accumulation in Yellowstone National Park, USA. Holocene 1996, 6, 7–15. [Google Scholar] [CrossRef]
- Constantine, M.; Mooney, S.; Hibbert, B.; Marjo, C.; Bird, M.; Cohen, T.; Forbes, M.; McBeath, A.; Rich, A.; Stride, J. Using charcoal, ATR FTIR and chemometrics to model the intensity of pyrolysis: Exploratory steps towards characterising fire events. Sci. Total Environ. 2021, 783, 1–9. [Google Scholar] [CrossRef]
- Ascough, P.L.; Bird, M.I.; Scott, A.C.; Collinson, M.E.; Cohen-Ofri, I.; Snape, C.E.; le Manquais, K. Charcoal reflectance measurements: Implications for structural characterization and assessment of diagenetic alteration. J. Archaeol. Sci. 2010, 37, 1590–1599. [Google Scholar] [CrossRef]
- Liland, K.H.; Mevik, B.-H.M.; Canteri, R. Baseline: Baseline Correction of Spectra (p. R Package Version 1.2-1). 2015. Available online: https://rdrr.io/cran/baseline/ (accessed on 15 November 2022).
- Liland, K.H.; Almøy, T.; Mevik, B.H. Optimal choice of baseline correction for multivariate calibration of spectra. Appl. Spectrosc. 2010, 64, 1007–1016. [Google Scholar] [CrossRef]
- Lieber, C.A.; Mahadevan-Jansen, A. Automated Method for Subtraction of Fluorescence from Biological Raman Spectra. Appl. Spectrosc. 2003, 57, 1363–1367. [Google Scholar] [CrossRef]
- Edwards, K.J.; Whittington, G. Multiple charcoal profiles in a Scottish lake: Taphonomy, fire ecology, human impact and inference. Palaeogeogr. Palaeoclim. Palaeoecol. 2000, 164, 67–86. [Google Scholar] [CrossRef]
- Schlachter, K.J.; Horn, S.P. Sample preparation methods and replicability in macroscopic charcoal analysis. J. Paleolimnol. 2010, 701–708. [Google Scholar] [CrossRef]
- Maezumi, S.Y.; Gosling, W.D.; Kirschner, J.; Chevalier, M.; Cornelissen, H.L.; Heinecke, T.; McMichael, C.N.H. A modern analogue matching approach to characterize fire temperatures and plant species from charcoal. Palaeogeogr. Palaeoclimatol. Palaeoecol. 2021, 578, 110580. [Google Scholar] [CrossRef]
- Gosling, W.D.; Cornelissen, H.L.; McMichael, C.N.H. Reconstructing past fire temperatures from ancient charcoal material. Palaeogeogr. Palaeoclimatol. Palaeoecol. 2019, 520, 128–137. [Google Scholar] [CrossRef]
- Mariani, M.; Connor, S.E.; Theuerkauf, M.; Herbert, A.; Kuneš, P.; Bowman, D.; Fletcher, M.; Head, L.; Kershaw, A.P.; Haberle, S.G.; et al. Disruption of cultural burning promotes shrub encroachment and unprecedented wildfires. Front. Ecol. Environ. 2022, 20, 292–300. [Google Scholar] [CrossRef]
- Jones, R. Fire Stick Farming. Aust. Nat. Hist. 1969, 16, 224–228. [Google Scholar] [CrossRef]
- Head, L. Prehistoric aboriginal impacts on australian vegetation: An assessment of the evidence. Aust. Geogr. 1989, 20, 37–46. [Google Scholar] [CrossRef]
- Black, M.P.; Mooney, S. The response of Aboriginal burning practices to population levels and El Niño—Southern Oscillation events during the mid- to late-Holocene: A case study from the Sydney basin using charcoal and pollen analysis. Aust. Geogr. 2007, 38, 37–52. [Google Scholar] [CrossRef]
- Roos, C.I.; Williamson, G.J.; Bowman, D.M.J.S. Is anthropogenic pyrodiversity invisible in paleofire records? Fire 2019, 2, 42. [Google Scholar] [CrossRef]
- Blarquez, O.; Vannière, B.; Marlon, J.R.; Daniau, A.L.; Power, M.J.; Brewer, S.; Bartlein, P.J. Paleofire: An R package to analyse sedimentary charcoal records from the Global Charcoal Database to reconstruct past biomass burning. Comput. Geosci. 2014, 72, 255–261. [Google Scholar] [CrossRef]
- Mooney, S.; Harrison, S.P.; Bartlein, P.J.; Daniau, A.L.; Stevenson, J.; Brownlie, K.C.; Buckman, S.; Cupper, M.; Luly, J.; Black, M.; et al. Late Quaternary fire regimes of Australasia. Quat. Sci. Rev. 2011, 30, 28–46. [Google Scholar] [CrossRef]
- Adeleye, M.A.; Connor, S.E.; Haberle, S.G.; Herbert, A.; Brown, J. European colonization and the emergence of novel fire regimes in southeast Australia. Anthr. Rev. 2021, 9. [Google Scholar] [CrossRef]


| Code | Chemical Treatment | Immersion Time |
|---|---|---|
| WB3 | ||
| T1 (control) | H2O (Ro) | 24 h |
| T2 | 2% sodium hypochlorite (bleach) | 24 h |
| T3 | 4% sodium hypochlorite (bleach) | 6 h |
| T4 | 4% sodium hypochlorite (bleach) | 24 h |
| T5 | sodium pyrophosphate/H2O, (CH3)2CO/NaOH | 24 h, 5 min at 80 °C |
| LC2 | ||
| M1 (control) | H2O (Ro) | 24 h |
| M2 | 4% sodium hypochlorite (bleach) | 24 h |
| Treatment Group | Count No./cm3 µ | Count No./cm3 σ | Area mm2/cm3 µ | Area mm2/cm3 σ | Spearman Rank Correlation |
|---|---|---|---|---|---|
| T1—H2O (Control) | 35.50 | 21.32 | 3.40 | 3.57 | 0.873 |
| T2—2% NaClO | 45.80 | 41.38 | 2.64 | 2.54 | 0.897 |
| T3—4% NaClO | 43.82 | 26.32 | 7.31 | 4.79 | 0.583 |
| T4—4% NaClO | 64.48 | 41.13 | 3.59 | 3.16 | 0.783 |
| T5—Calgon/H2O, (CH3)2CO/NaOH | 9.77 | 7.76 | 1.22 | 1.35 | 0.690 |
| Group | SS | df | MS | F | p-Value |
|---|---|---|---|---|---|
| Charcoal (no./cm3) | 34,872 | 4 | 8718 | 9.349 | 1.53−6 *** |
| Charcoal (mm2/cm3) | 448.7 | 4 | 112.17 | 9.932 | 7.43−7 *** |
| Treatment Group | CI (Mean) | CI (Min) | CI (Max) | CI (Range) | Area (mm2/cm3) | Count (No./cm3) |
|---|---|---|---|---|---|---|
| M1 | 3.8 | 3.1 | 4.4 | 1.3 | 48.85 | 289.57 |
| M2 | 4.1 | 3.4 | 5.1 | 1.7 | 10.60 | 24.35 |
| Treatment Group/Depth | CI (Mean) | CI (Min) | CI (Max) | CI (Range) | Area (mm2/cm3) | Count (No./cm) |
|---|---|---|---|---|---|---|
| M1-S1 | 3.2 | 2.3 | 3.8 | 1.5 | 32.78 | 232.29 |
| M1-S2 | 4.3 | 3.8 | 4.8 | 1.0 | 61.05 | 333.06 |
| M2-S1 | 4.1 | 3.3 | 5.0 | 1.7 | 8.86 | 17.67 |
| M2-S2 | 4.1 | 3.5 | 5.2 | 1.7 | 11.93 | 29.41 |
Disclaimer/Publisher’s Note: The statements, opinions and data contained in all publications are solely those of the individual author(s) and contributor(s) and not of MDPI and/or the editor(s). MDPI and/or the editor(s) disclaim responsibility for any injury to people or property resulting from any ideas, methods, instructions or products referred to in the content. |
© 2023 by the authors. Licensee MDPI, Basel, Switzerland. This article is an open access article distributed under the terms and conditions of the Creative Commons Attribution (CC BY) license (https://creativecommons.org/licenses/by/4.0/).
Share and Cite
Constantine IV, M.; Zhu, X.; Cadd, H.; Mooney, S. Investigating the Effect of Oxidants on the Quantification and Characterization of Charcoal in Two Southeast Australian Sedimentary Records. Fire 2023, 6, 54. https://doi.org/10.3390/fire6020054
Constantine IV M, Zhu X, Cadd H, Mooney S. Investigating the Effect of Oxidants on the Quantification and Characterization of Charcoal in Two Southeast Australian Sedimentary Records. Fire. 2023; 6(2):54. https://doi.org/10.3390/fire6020054
Chicago/Turabian StyleConstantine IV, Mark, Xiaohong Zhu, Haidee Cadd, and Scott Mooney. 2023. "Investigating the Effect of Oxidants on the Quantification and Characterization of Charcoal in Two Southeast Australian Sedimentary Records" Fire 6, no. 2: 54. https://doi.org/10.3390/fire6020054
APA StyleConstantine IV, M., Zhu, X., Cadd, H., & Mooney, S. (2023). Investigating the Effect of Oxidants on the Quantification and Characterization of Charcoal in Two Southeast Australian Sedimentary Records. Fire, 6(2), 54. https://doi.org/10.3390/fire6020054