Article

A Method of Detecting Candidate Regions and Flames Based on Deep Learning Using Color-Based Pre-Processing

Graduate School of Disaster Prevention, Kangwon National University, Samcheok 25913, Republic of Korea
*
Author to whom correspondence should be addressed.
Fire 2022, 5(6), 194; https://doi.org/10.3390/fire5060194
Submission received: 26 September 2022 / Revised: 9 November 2022 / Accepted: 11 November 2022 / Published: 16 November 2022
(This article belongs to the Section Fire Science Models, Remote Sensing, and Data)

Abstract

:
Recently, object detection methods using deep learning have made significant progress in terms of accuracy and speed. However, the requirements of a system to provide real-time detection are somewhat high, and current methods are still insufficient to accurately detect important factors directly related to life and safety, such as fires. Therefore, this study attempted to improve the detection rate by supplementing the existing research to reduce the false detection rate of flame detection in fire and to reduce the number of candidate regions extracted in advance. To this end, pre-processing based on the HSV and YCbCr color models was performed to filter the flame area simply and strongly, and a selective search was used to detect a valid candidate region for the filtered image. In addition, for the detected candidate region, a deep learning-based convolutional neural network (CNN) was used to infer whether the object was a flame. As a result, it was found that the flame-detection accuracy of the model proposed in this study was 7% higher than that of the other models presented for comparison, and the recall rate was increased by 6%.

1. Introduction

In this study, candidate regions were detected using HSV and YCbCr color conversion and selective search algorithms for CNN-based flame detection. This method enables inferences to be made using CNN with a high degree of responsiveness and reliability, as it can effectively select proposed candidate regions that are likely to be flame. In addition, when constructing a model that detects only specific objects using image pre-processing, unnecessary objects and pixels can be removed in advance, which has the advantage of detection rate. In the case of the previously studied paper [1], basically, if corners occur intensively for one color conversion result, the corresponding region was designated as a region of interest. In case of using this method, if the size occupied by the flame in the image is small, there are few corners and it is not extracted as a region of interest and can be ignored. In addition, the method of simply extracting through corners can be extracted for most flames, but some flame images may not be properly detected if they are obscured by other objects or are far away. However, in this study, in order to solve these shortcomings, the region of interest was extracted through selective search for the color-converted image. Through this, it was possible to obtain higher accuracy and precision than the method proposed in previous study.
Existing deep learning computer vision-based flame detection studies have a method proposed by Shen et al. [2], which is a paper that detected flames using a you only look once (YOLO) model based on Tensorflow and was detected without the separate filtering of input images. Even in this case, if additional image pre-processing was added, the accuracy would be improved as the unnecessary background area was removed in advance, reducing false negatives significantly. Another study was a fire detection method proposed by Muhammad et al. [3]. Other examples include CNN-based fire detection methods using pre-processing algorithms known as selective amplification. This technique enhances images that are to be used in CNN, which are then trained on pre-processed images to detect fires with high accuracy [4]. Other studies have shown adaptive priority mechanisms and fire detection methods using AlexNet. In this article, we proposed an early fire detection framework using fine-tuned CNN for CCTV surveillance cameras, which can detect fire in varying indoor and outdoor environments. Ref. [5] classified fire or non-fire from the image in order to efficiently detect fire in resource-constrained environments. However, in this case, the fire is judged not only for the flame but also for the entire unnecessary image area. Therefore, when classifying fires through pre-filtering, the accuracy is expected to be higher. Another study was to detect fires using object detection models such as Yolo V3 and Faster regions-based CNN (Faster R-CNN), but there is no filtering in advance, so the detection rate may decrease due to the occurrence of many candidate regions [6,7].
For deep learning-based object detection models, such as YOLO v3 and spatial pyramid pooling network (SPPNet), support vector machine (SVM) and pre-learned CNN models are used to extract candidate regions [8,9,10]. First, the location of all bounding boxes in which objects may exist are identified within the image through anchor boxes with a preset size and ratio. The candidate regions detected through this process are then classified into objects through a CNN-based model. Therefore, object detection models detect tens to hundreds of proposed regions during the detection step, and the computational load increases in the process of determining whether each candidate region is a meaningful object through CNN.
Figure 1 shows the overall image processing flowchart proposed in this study to improve this process. The input image is primarily filtered in advance by extracting a region in which a flame is likely to exist using HSV and YCbCr color conversion. Filtering is performed in the range proposed for each of the two color conversion. In addition, each color conversion is performed concurrently, and pixel values remaining after filtering are compared. Here, the pixel regions remaining in both color conversion are used as the flame candidate region. After performing this color conversion, some contrast areas in the image, in addition to the flame, may remain in the form of noise, or color areas similar to the flame may remain unfiltered. Therefore, a selective search was used to effectively extract the box area of a meaningful object while ignoring unnecessary areas. Selective search functions were used to suggest candidate regions by skipping objects that are unlikely to be foreground areas, such as noise or simple texture planes, and meaningful areas were then grouped. Therefore, using color conversion and selective search, a region with a high possibility of flame presence is selected, and the flame region is extracted from the original RGB input image through information on the detected candidate region. Finally, the detected candidate region was used to infer whether there was a flame using the Inception-V3 CNN model.

2. Proposed Method

2.1. Pre-Processing Using HSV Color Conversion

The first image pre-processing method used in this study involved converting the captured RGB image into an HSV color model and then extracting the pixel area that had a high probability of featuring a flame. The HSV color model is similar to how humans perceive colors and is useful for detecting color-based objects in image pre-processing and various applications. Hue in HSV represents the distribution of colors based on red, saturation represents the degree of darkness and lightness of the color, and value corresponds to the brightness of the color [11,12].
The all represented ranges of hue, saturation, and value of the HSV color model proposed in this study are 0–179, 0–255, and 0–255, respectively, and the range of colors limited for filtering those pixels in which a flame may exist is shown in Table 1.
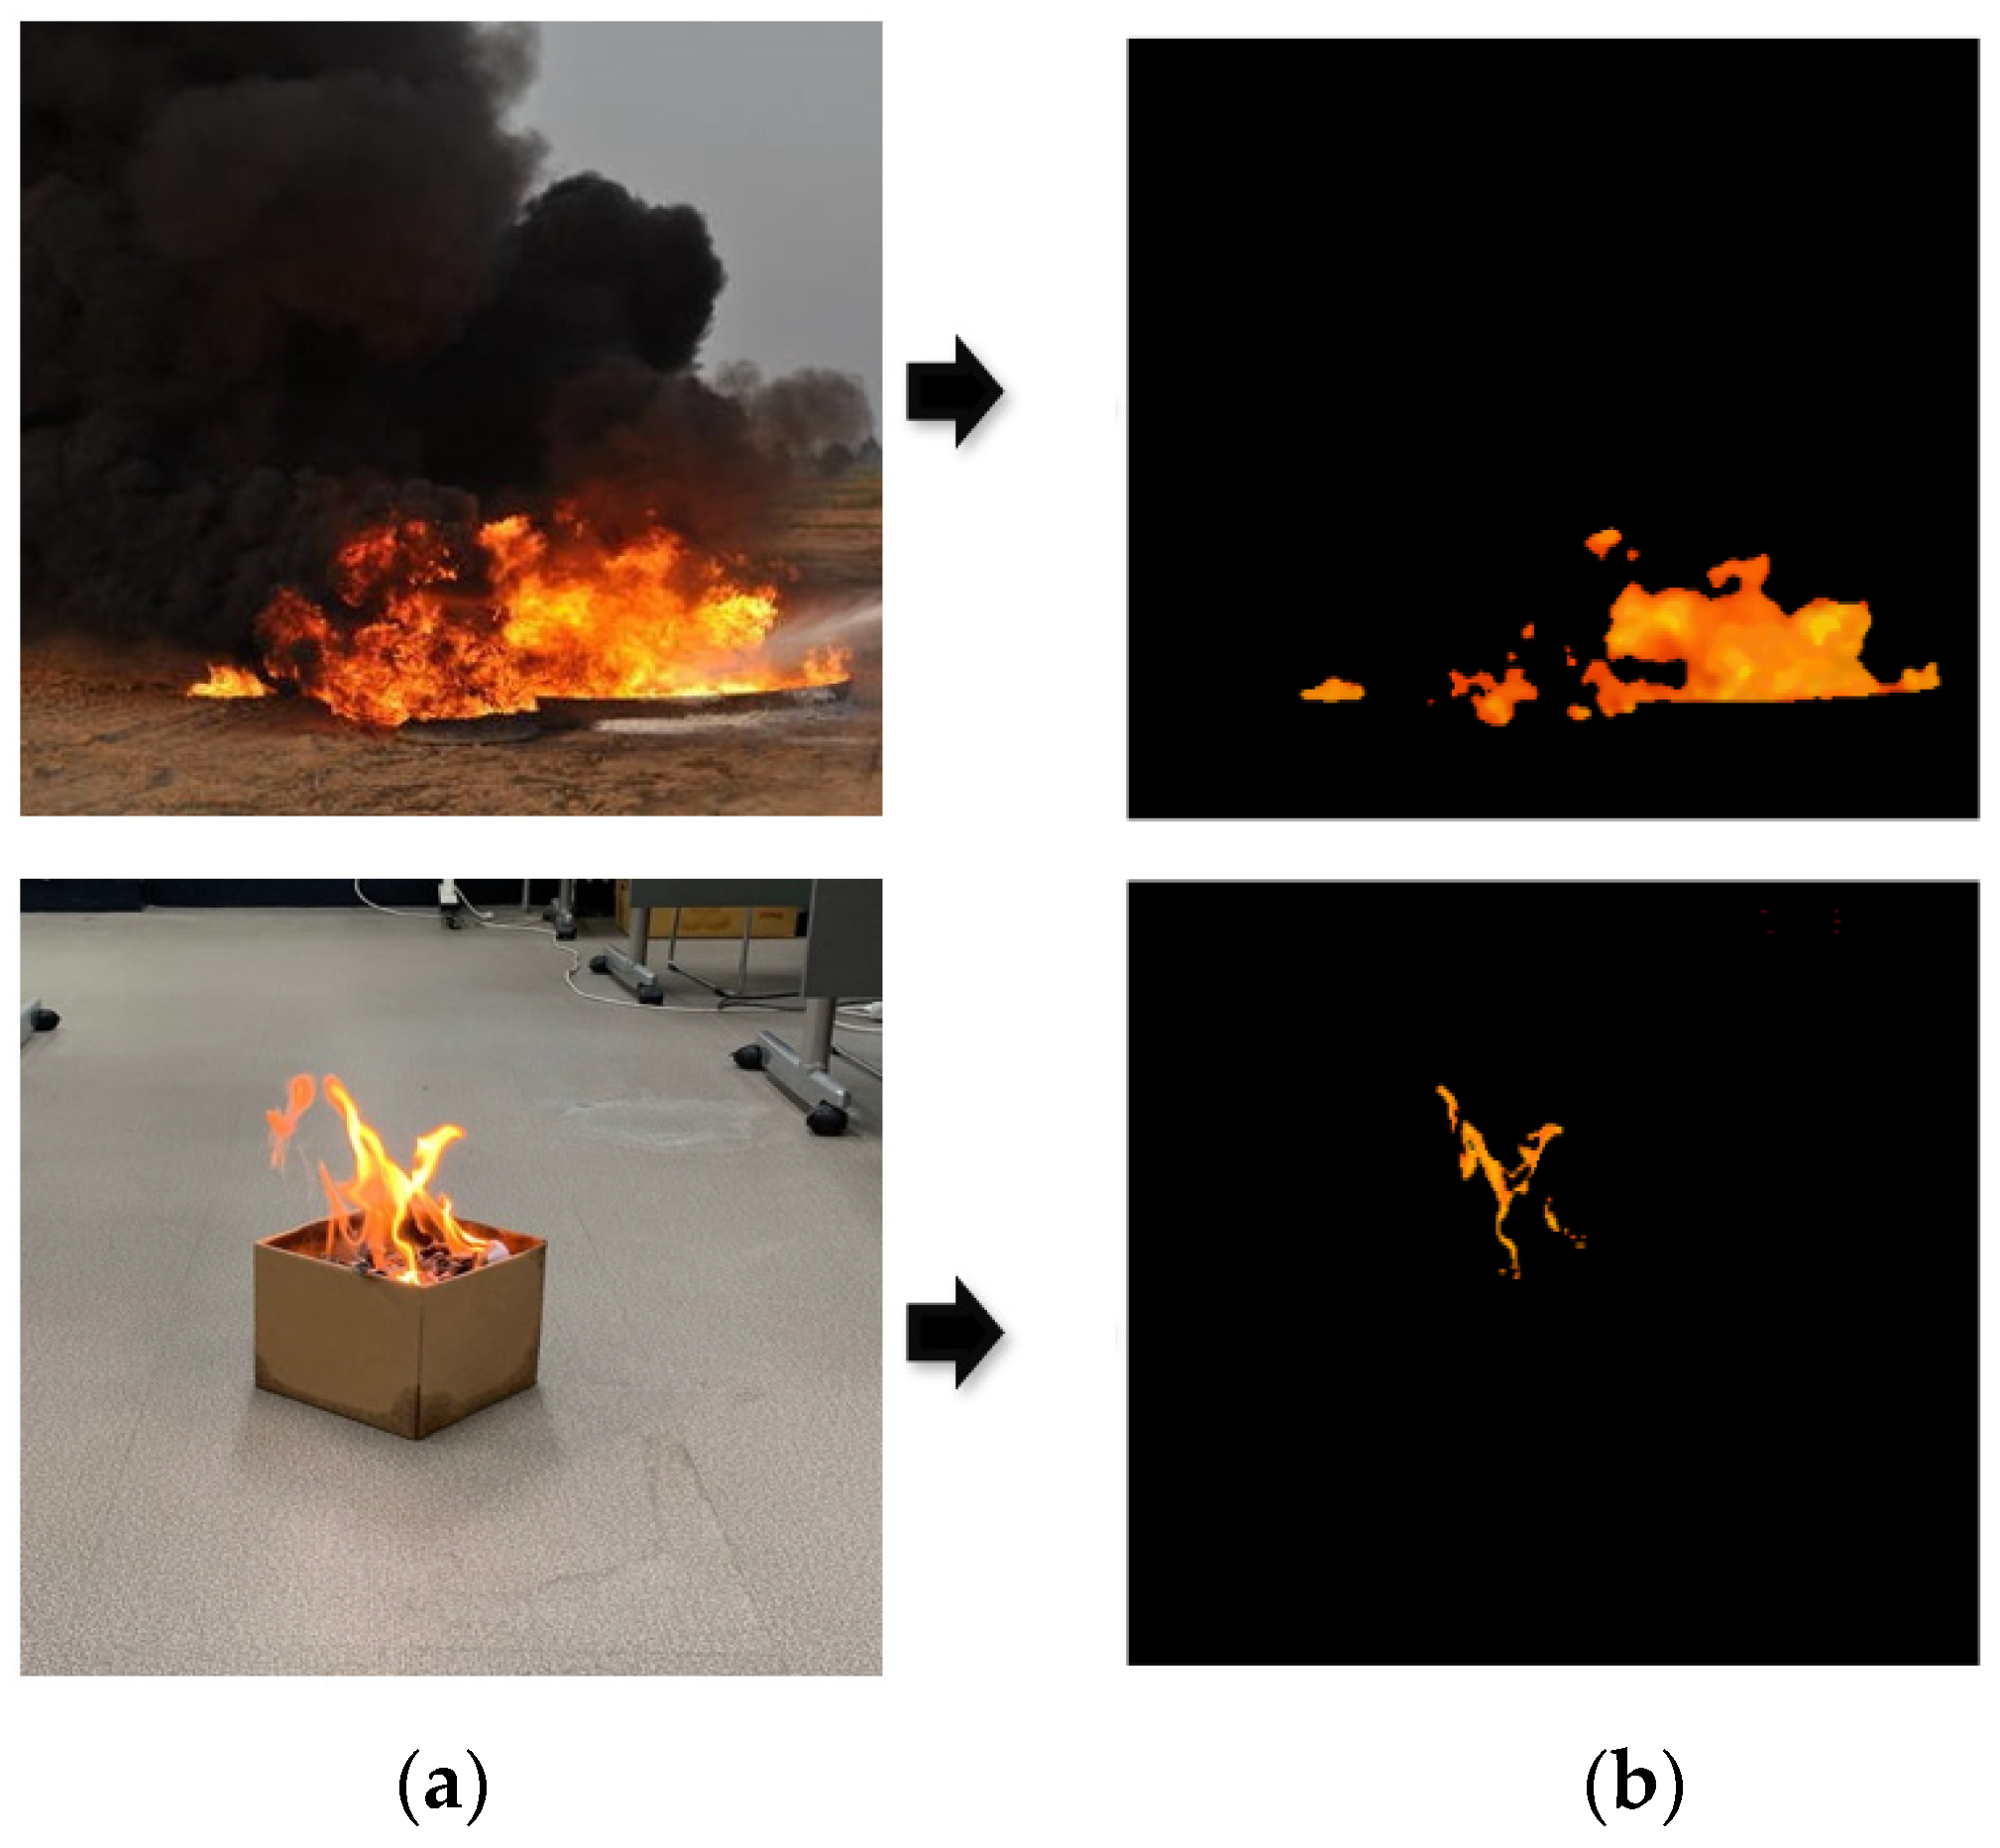
Figure 2 shows this HSV color conversion. As illustrated, Figure 2a corresponds to the original flame images, and Figure 2b presents the images of the results that were segmented based on the pixels to which the proposed HSV color conversion and flame-area filtering are applied.

2.2. Pre-Processing Using YCbCr Color Conversion

Even if the HSV color model is used to filter the area where the flame is likely to exist, it is not completely filtered for all areas. Therefore, the YcbCr color model was additionally used to further improve the color-based filtering performance [13,14].
In YCbCr, Y is luminance and is defined as a nominal 8-bit and range of 16–235, and chrominance blue ( C b ) and chrominance red ( C r ) represent chroma and have a nominal range of 16–240. This method has the advantage of being able to display many colors with less data, although the color separation and transfer effects are weaker than those of the RGB color model. It also has the advantage of being able to separate luminance from the color differences more effectively than other color models. Therefore, the first rule applied to detect pixels corresponding to the flame area using the characteristics of the YCbCr color model is shown in Equations (1) and (2) [15].
Y ( x , y ) > C b ( x , y )
C r ( x , y ) > C b ( x , y )  
According to the equation, luminance Y and C r should be greater than C b , which means that the flame of the red channel has saturation in the image. In addition, the same conditions as in Equation (3) were used to filter additional flame areas from the mean values of the three channels. Since the flame region is generally the brightest region in the image, the mean values of the three channels, in the overall image, Y m e a n , C b m e a n and C r m e a n contain valuable information. In a general flame region, luminance Y is greater than the total Y mean value, and C b and C r are each less than the mean value [15].
F ( x , y ) = { 1 ,     i f     Y ( x , y ) > Y m e a n ,   C b ( x , y ) < C b m e a n ,   C r ( x , y ) < C r m e a n 0 ,       otherwise                                                                                    
Moreover, the image of the flame in the fire demonstrates significant differences between the C b and C r components. Since the flame area of the C b channel is close to black, and the flame area of the C r channel is close to white, these rules can be expressed using Equation (4) below; τ was set to 40, which is the same as Celik proposed [15].
F τ ( x , y ) = { 1 ,       i f   | C b ( x , y ) C r ( x , y ) | τ 0 ,     otherwise                            
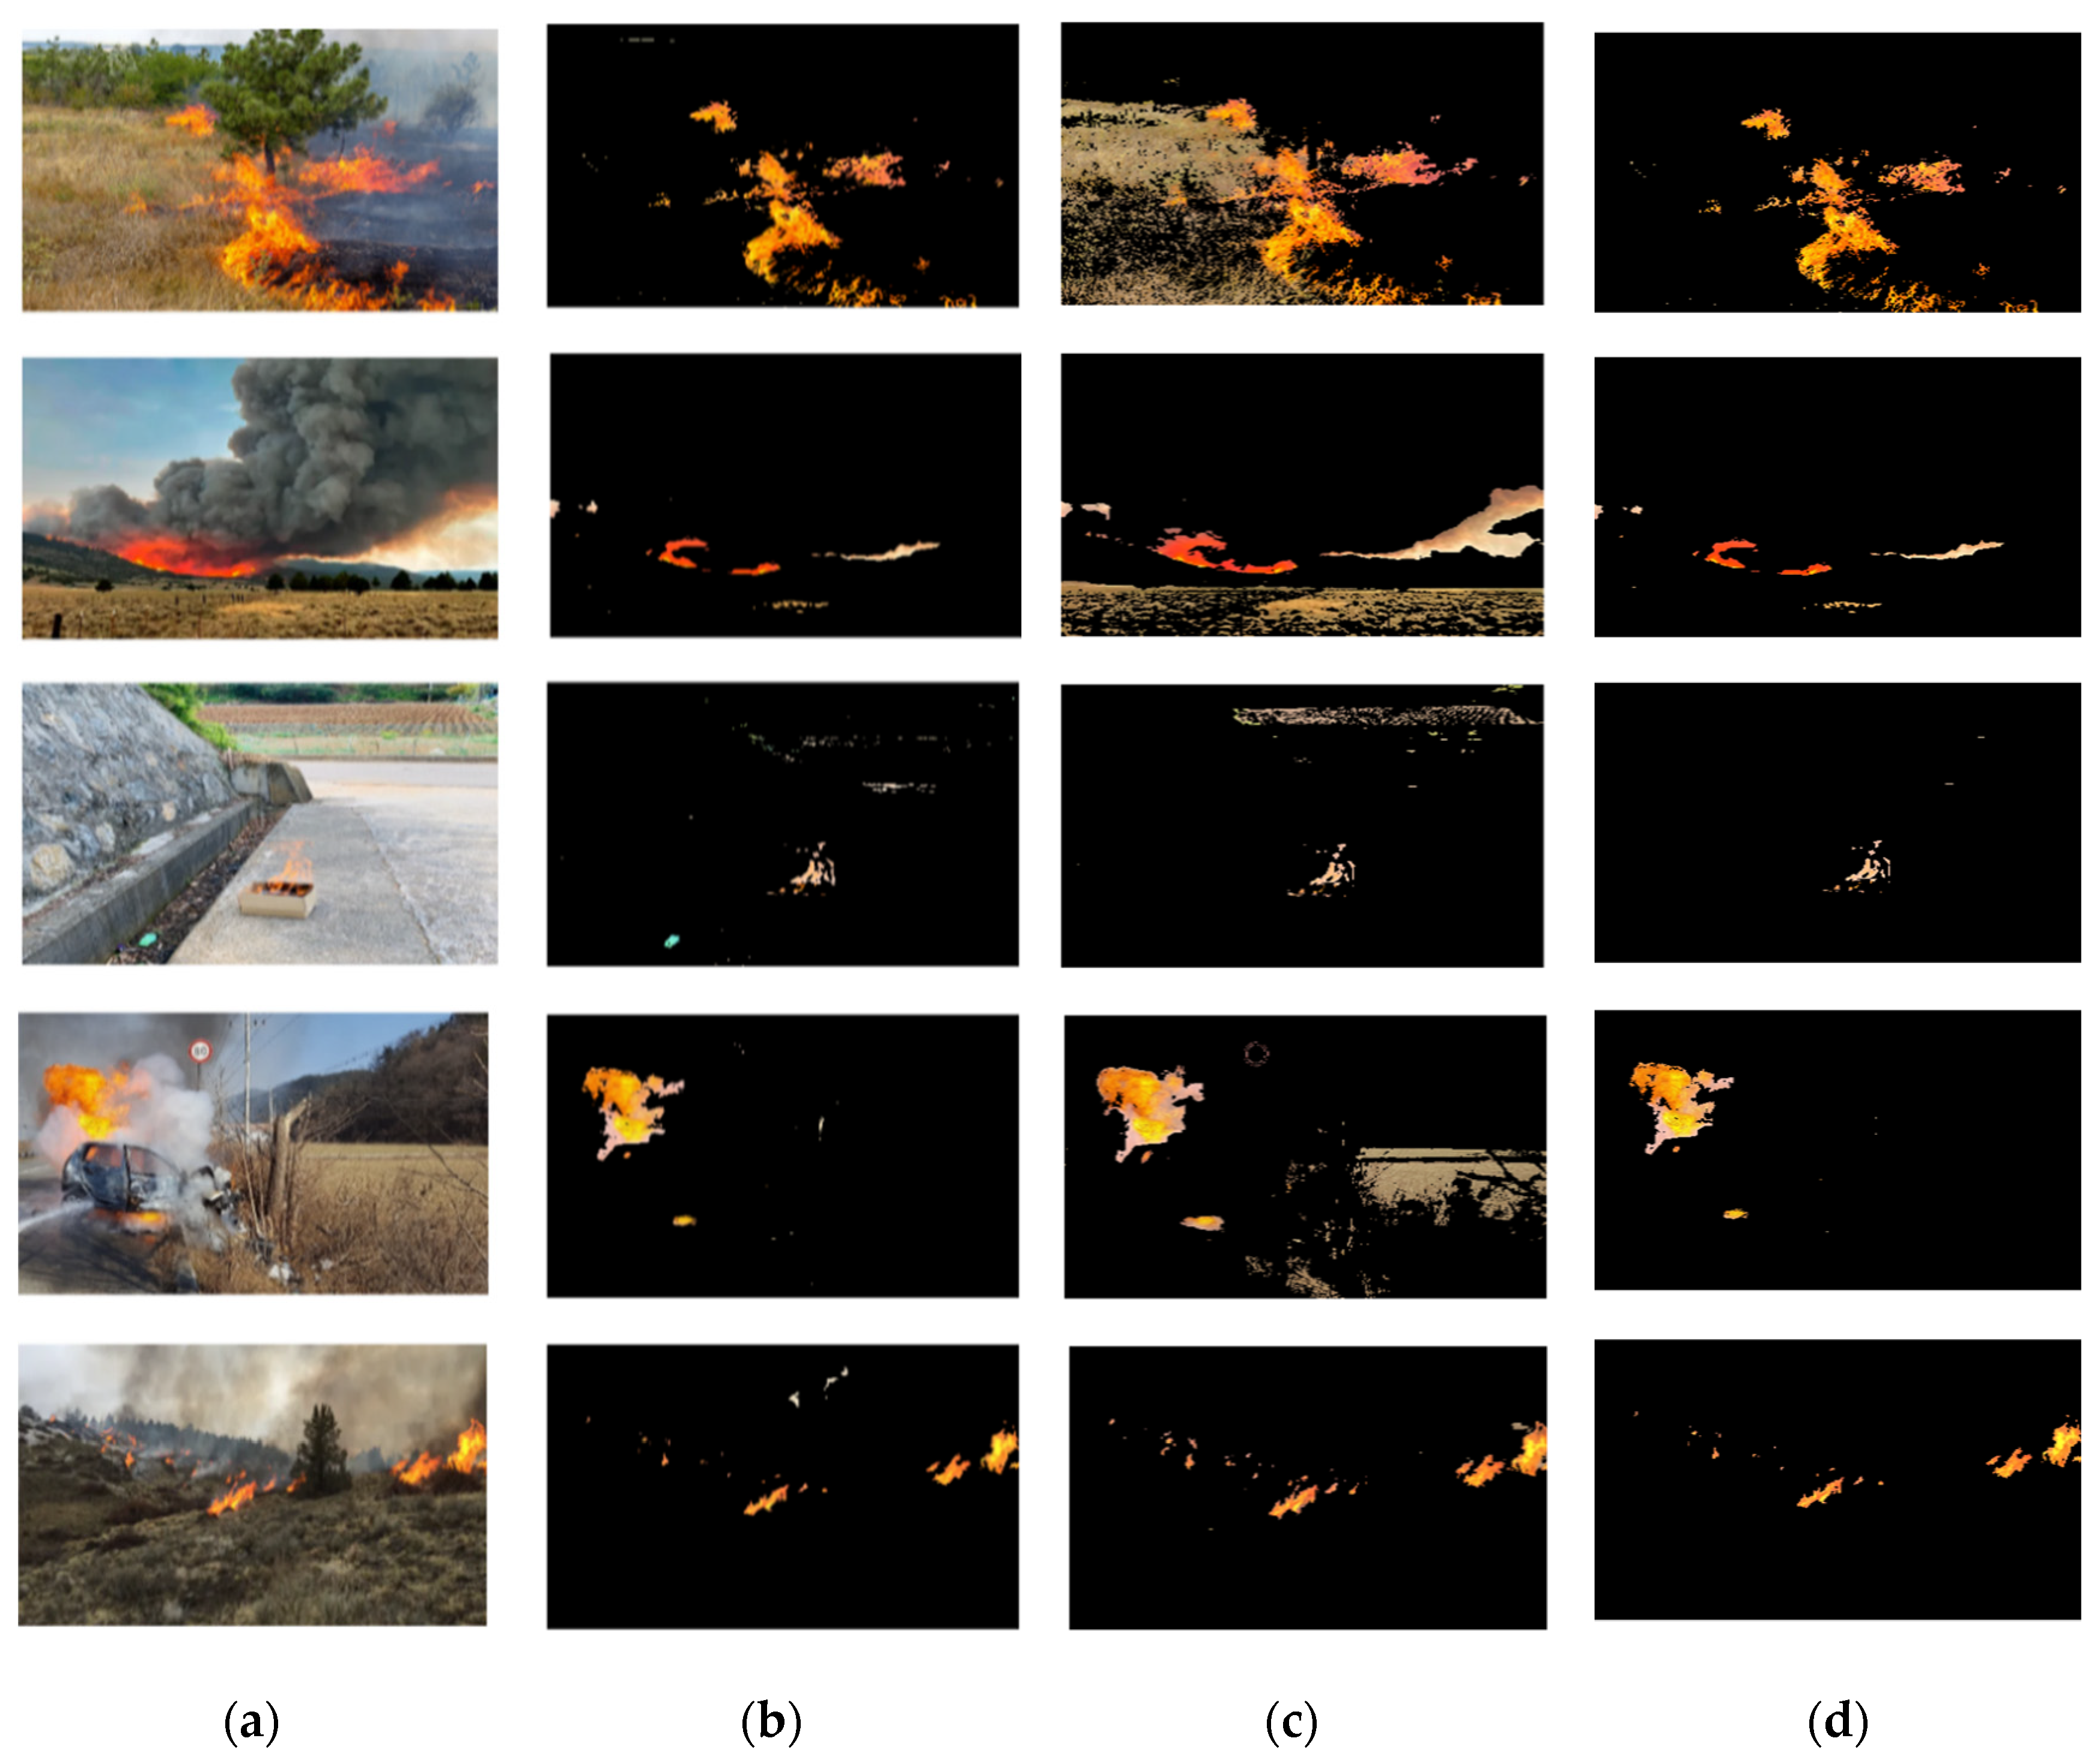
Therefore, through these three rules, it was possible to propose a flame-detection technique that is more robust to illuminance changes than the RGB color model, and the results of filtering the flame area are shown in Figure 3c.
For comparison with the HSV color model, the filtering results using the HSV color model are listed in Figure 3b, while Figure 3a shows the original input image, and Figure 3d shows the pixels detected when both the HSV color model and YCbCr model are used as filtering results for the final color model. That is, pixel areas remaining unfiltered in both the HSV color model and the YCbCr model are displayed.
As such, it was confirmed that the flame area was complementarily filtered in the area that each color model incorrectly detected. In addition, since most of the non-flame objects are filtered, the false detection rate can be reduced compared to using RGB images as they are for inference. Moreover, the detection of flame regions using HSV and YCbCr is an incomplete method. Therefore, in this study, it is used as a candidate region pre-detector for the selective search and CNN algorithm.

2.3. Detecting Candidate Regions Using Selective Search

Even after color-based pre-processing, objects other than flames, including leaves or objects that were light yellow, may remain unfiltered. Selective search was used to filter out these unnecessary small areas or noise and to detect significant candidate regions. Selective search is a superpixel-based candidate region-detection algorithm that uses a hierarchical grouping algorithm [16,17]. Selective search integrates areas with high similarity within the image and repeats this process until one area is finally created. To this end, initial segmentation is performed first through a graph-based image segmentation algorithm that was proposed by Felzenzwalb et al. [18] in 2004. In addition, these over-segmented regions are repeatedly grouped between regions with high adjacent similarities. Assuming that there are two adjacent regions, r i and r j , as shown in Equation (5), the similarity set S is calculated as the weighted sum of color, texture, size, and fill, which are four elements normalized between 0 and 1 [19].
S ( r i ,   r j ) = a 1 S c o l o r ( r i ,   r j ) + a 2 S t e x t u r e ( r i ,   r j ) + a 3 S s i z e ( r i ,   r j ) + a 4 S f i l l ( r i ,   r j ) , A = a 1 ,   a 2 ,   a 3 ,   a 4 ,       0 a i 1
The first element, color, generates 25 bins for each color channel and measures color similarity through histogram intersections between adjacent regions. This can be expressed as Equation (6), and n = 75 is obtained because it has 25 bins from each channel of R, G, and B.
S c o l o r ( r i , r j ) = k = 1 n min ( c i k ,   c j k )
Texture is an element used to group candidate regions using texture similarity. In this case, the scale-invariant feature transform (SIFT) algorithm was used to extract vectors by applying Gaussian differentials in eight directions per channel, and it was represented by a histogram with 10 bins to calculate the texture similarity between two adjacent regions. In addition, similarity was obtained through histogram intersection and could be expressed as Equation (7).
S t e x t u r e ( r i , r j ) = k = 1 n min ( t i k ,   t j k )
Size can be expressed using Equation (8). The s i z e ( i m ) is the number of pixels in the entire image, and s i z e ( r i ) and s i z e ( r j ) correspond to two adjacent regions that can be used to compare similarities. The smaller the size of the comparison area, the higher the similarity, so it is preferentially merged from the smaller area.
S s i z e ( r i , r j ) = 1 s i z e ( r i ) + s i z e ( r j ) s i z e ( i m )
Fill is shown in Equation (9) and is a factor that can be used for grouping via the differences in the size of B B i j , a candidate bounding box; the smaller the size difference between regions, the higher the similarity.
S f i l l ( r i , r j ) = 1 s i z e ( B B i j ) s i z e ( r i ) s i z e ( r j ) s i z e ( i m )
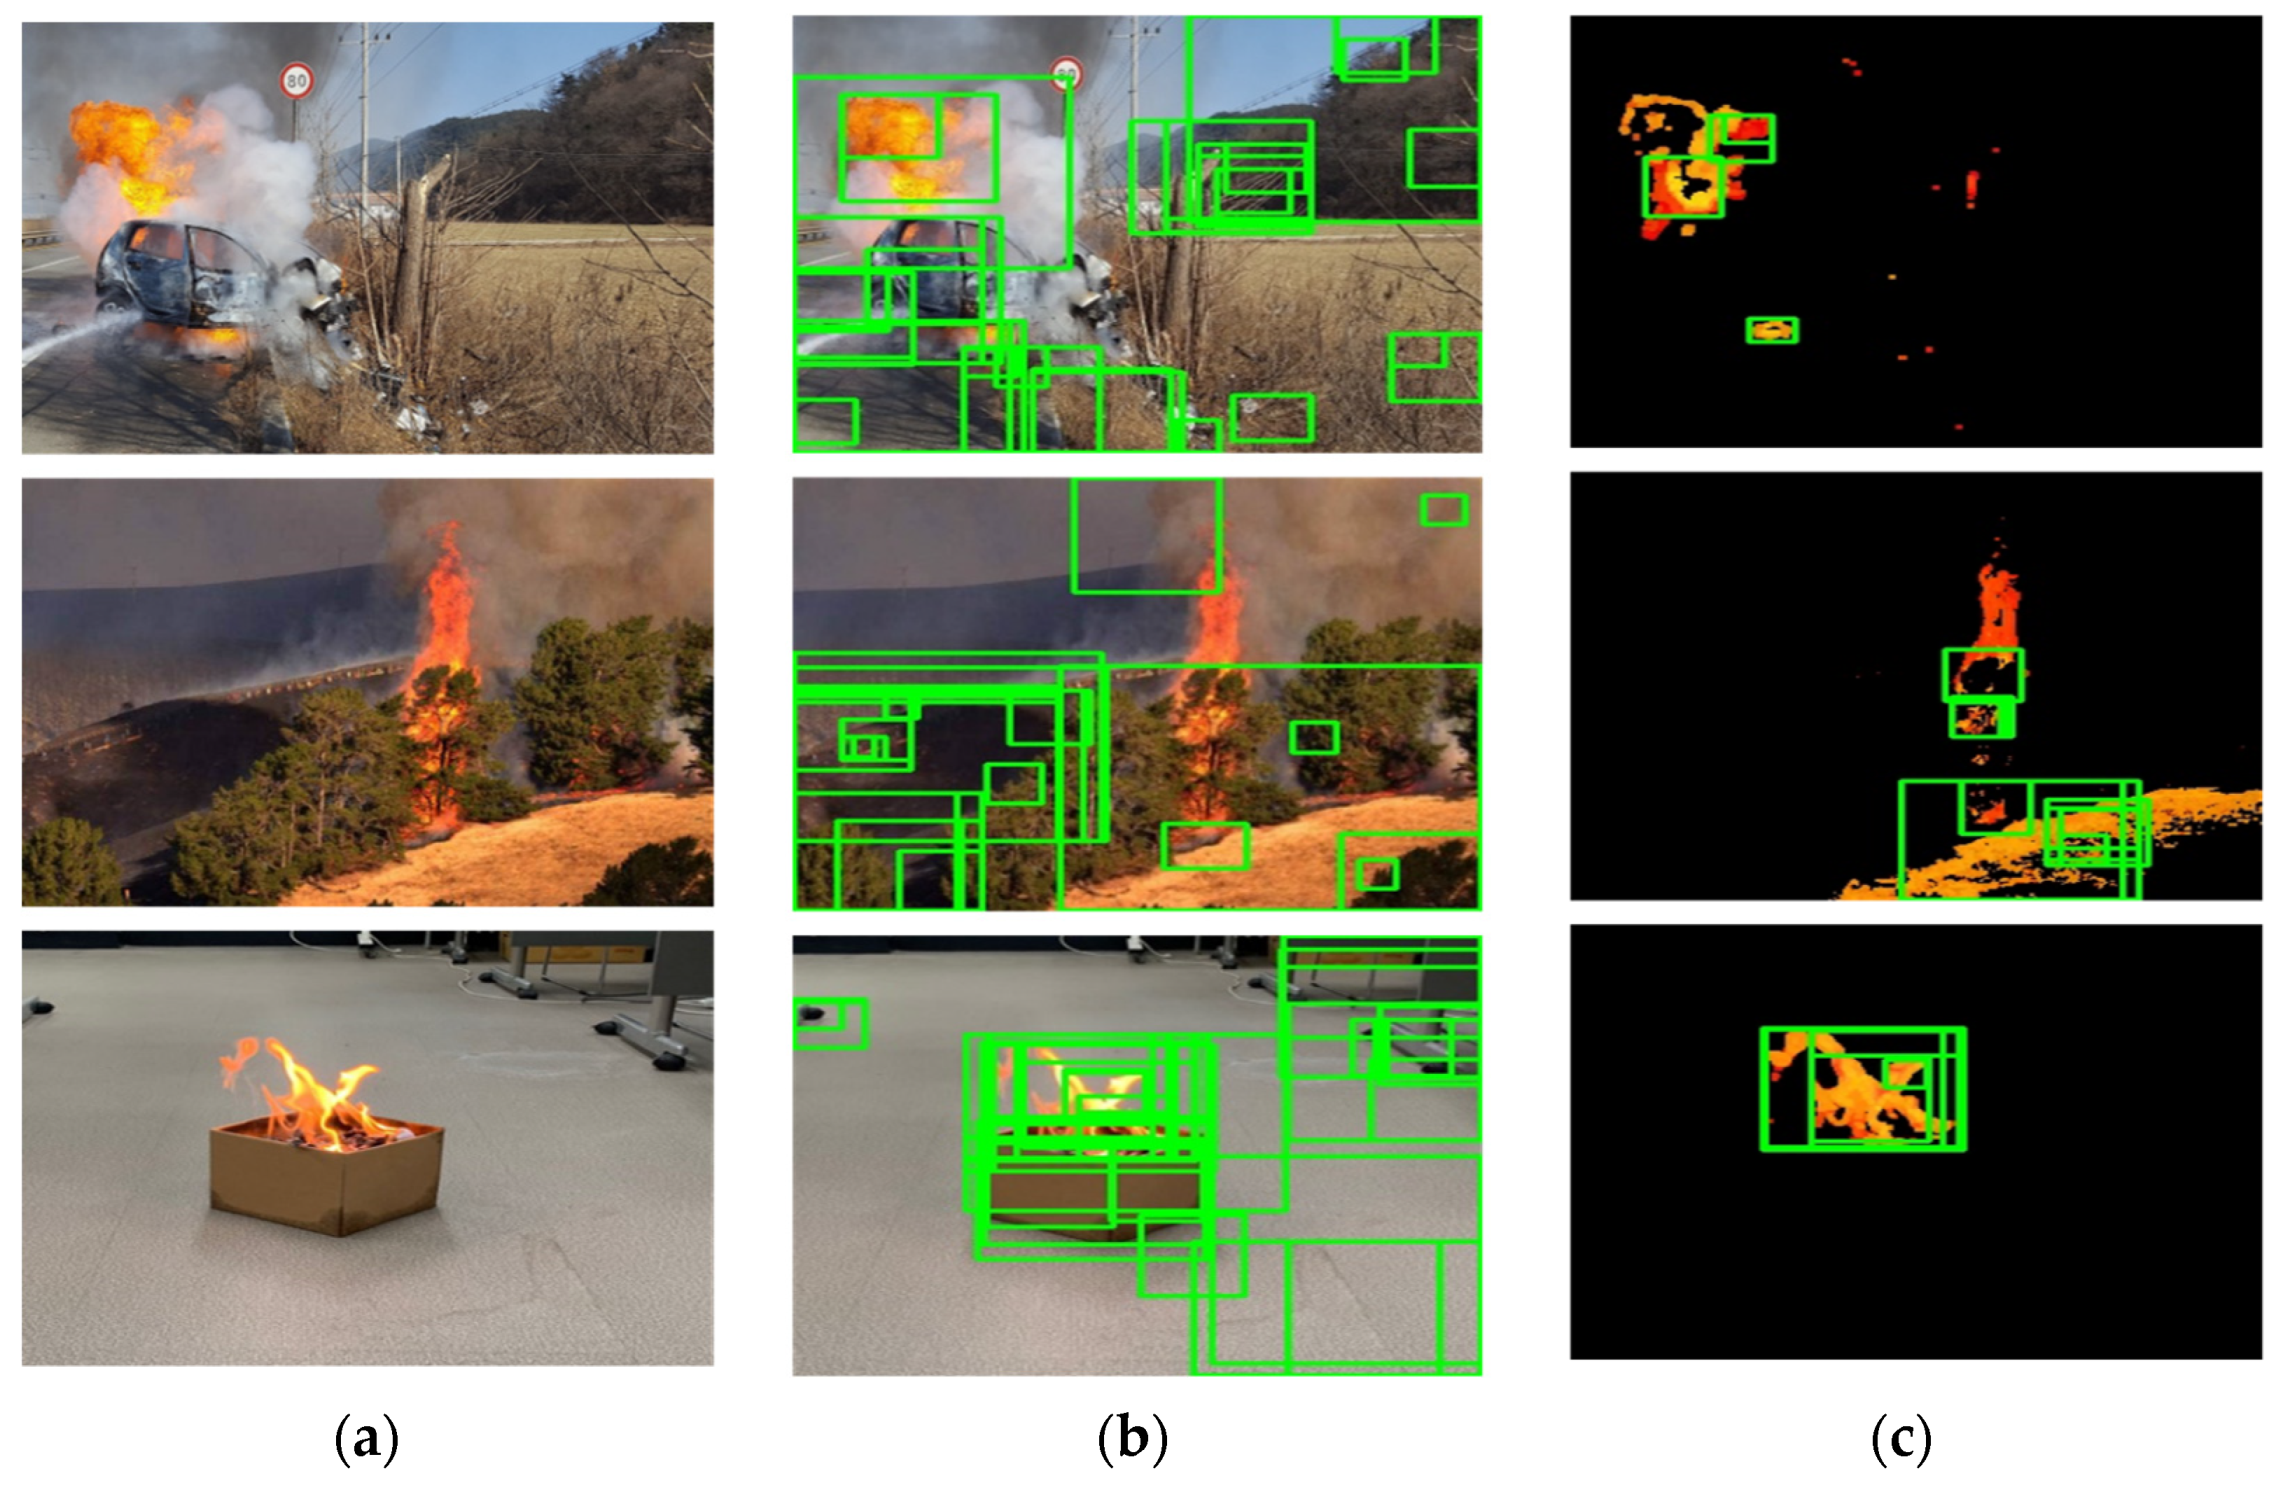
Figure 4 compares the difference in selective search application of the original image and the image after color conversion.
Figure 4a is the original input image, Figure 4b represents the candidate regions where the selective search was performed on the original image in green bound boxes, and Figure 4c visualized that the selective search was performed on the image color-converted to the designated flame area. As a result, it can be seen that when color-based pre-processing was performed, the number of candidate regions extracted was greatly reduced, and the number of candidate regions for objects other than flames was greatly reduced.
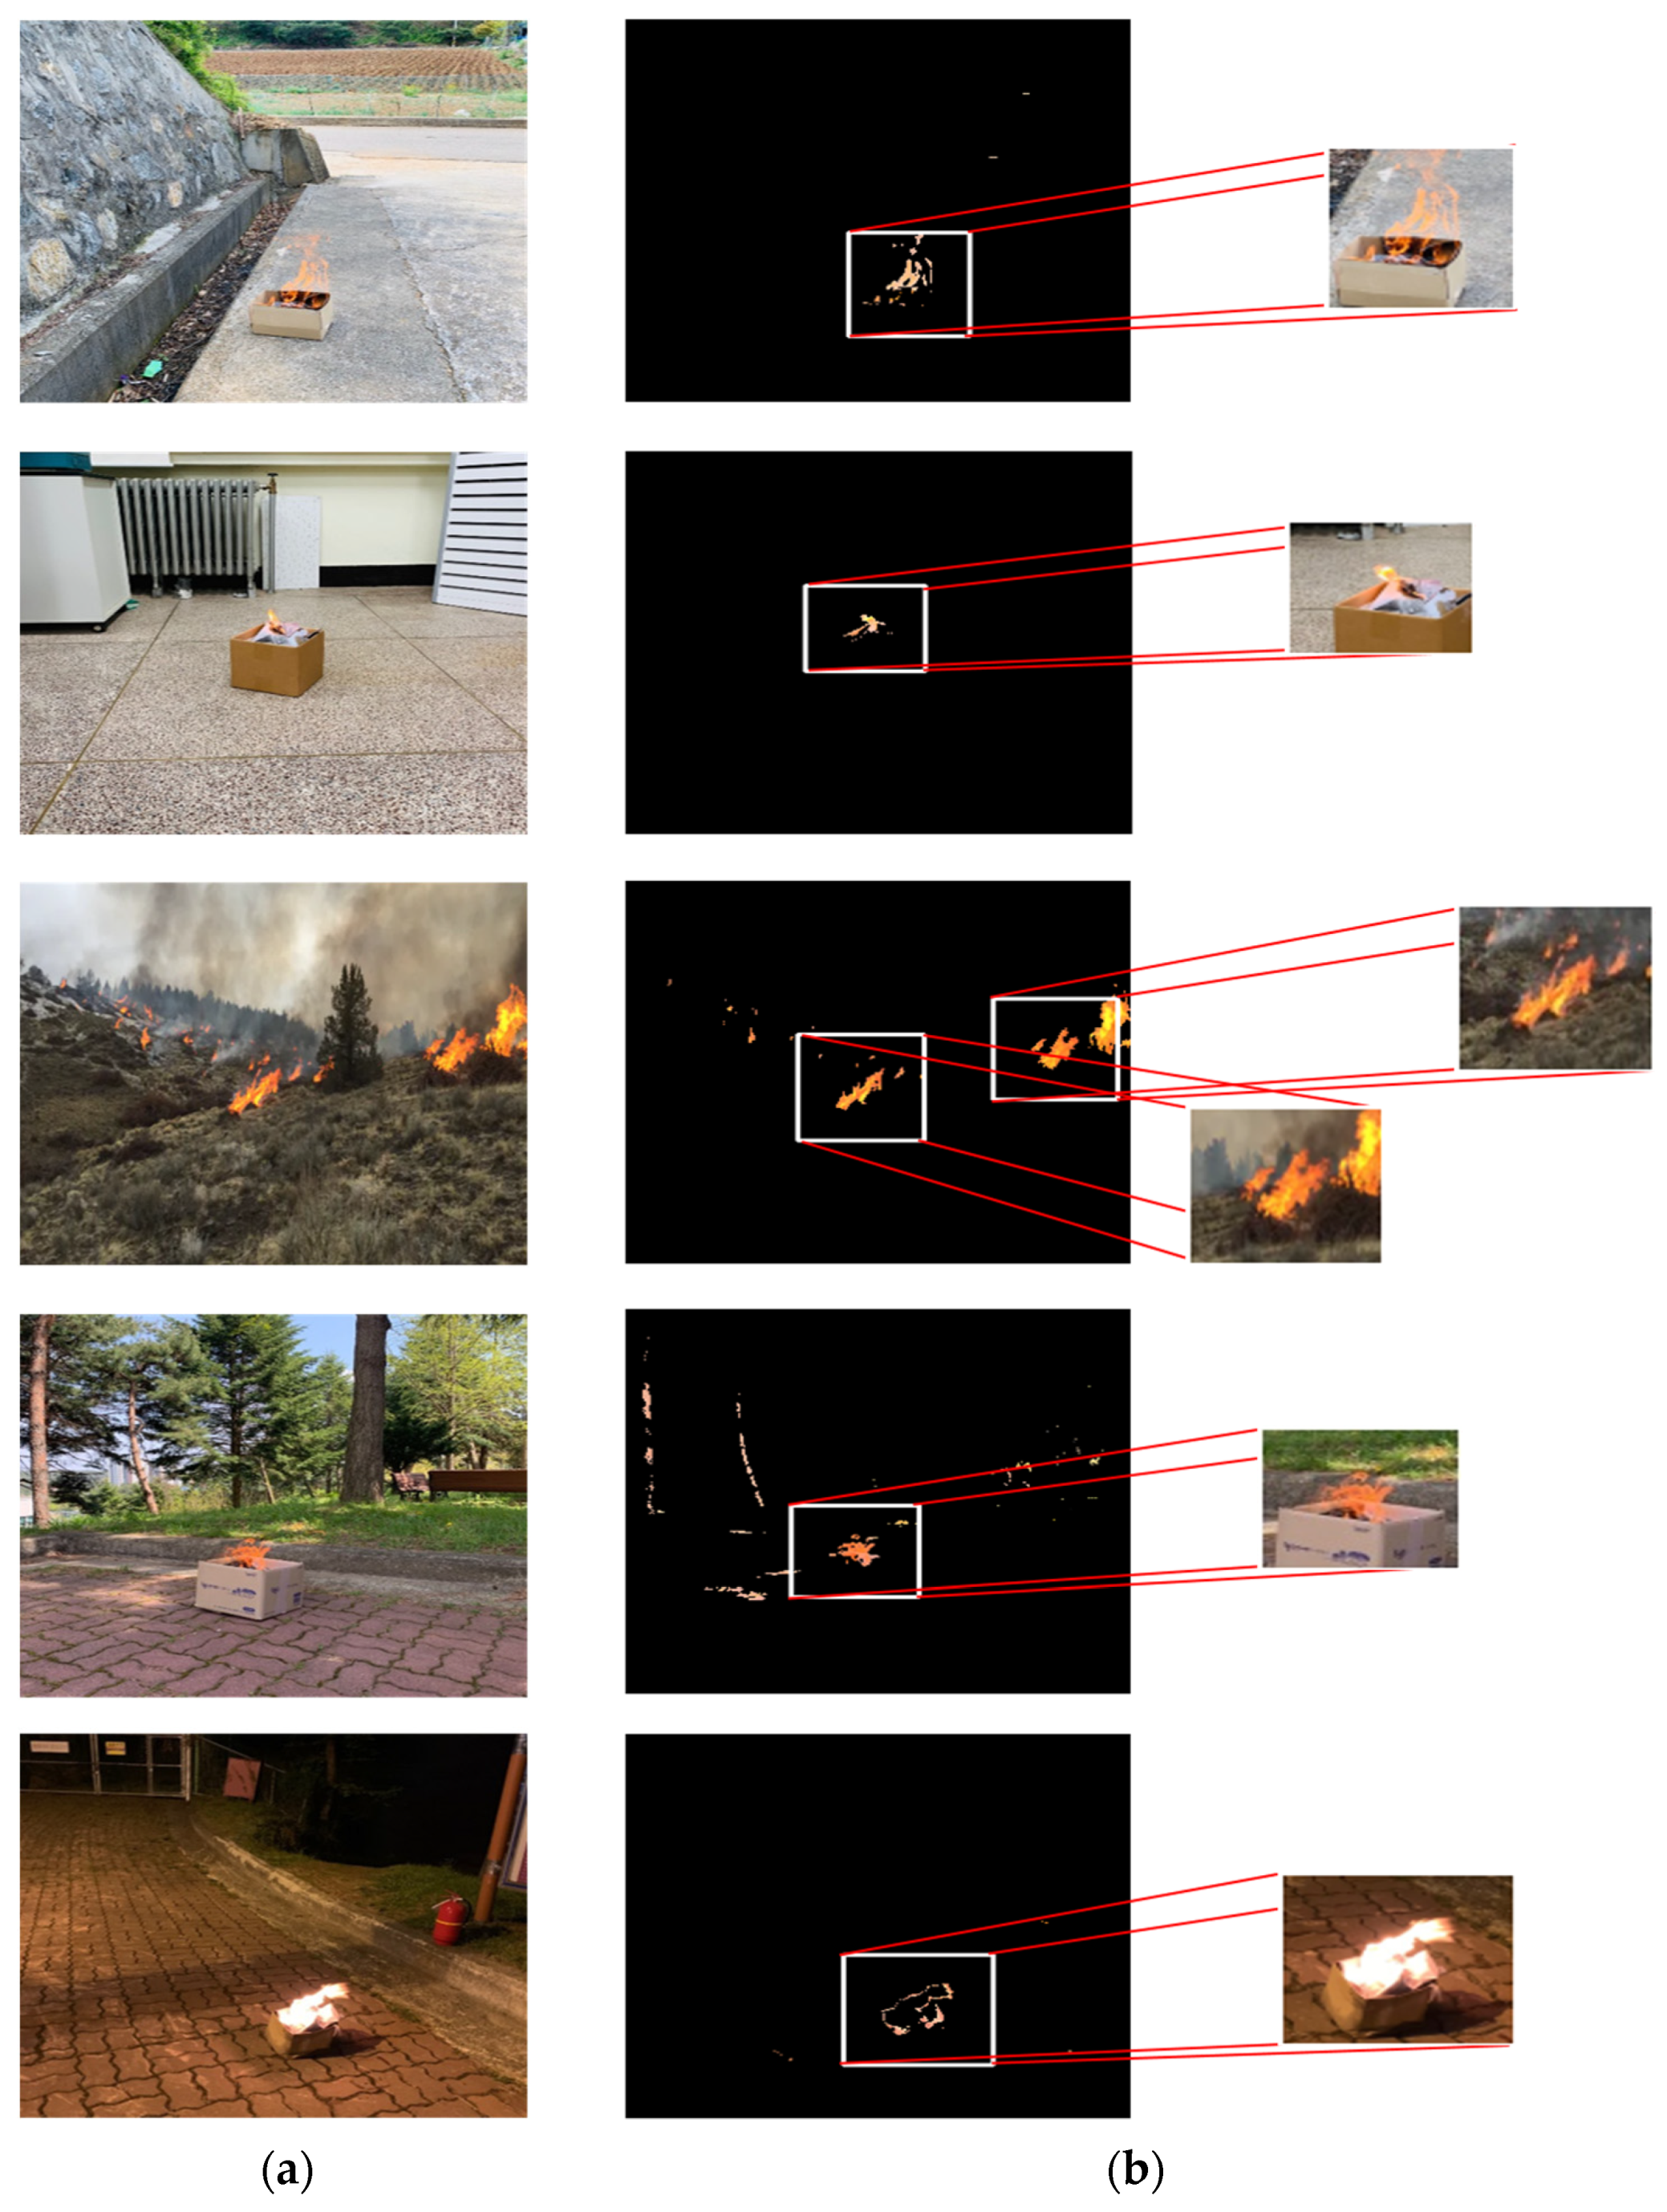
Figure 5 illustrates the region grouped from input images as well as the RGB images of corresponding regions. The leftmost panel corresponds to the original input images, and the middle panel is an image filtered through the HSV and YCbCr color models. In addition, the candidate regions detected through selective search are represented by white bounding boxes, and the figures listed in the right panel show segmentation of the RGB images corresponding to the candidate regions.

2.4. Constructing CNN for Inference

When applied as a flame-detection method using only color information, non-flame objects may also be included, so there is a problem in that accuracy is significantly lowered. Furthermore, during the image pre-processing step, an area in which an object may exist was extracted through selective search, but it could not identify what kind of object it was. Therefore, in order to compensate for these problems, a deep learning-based CNN was used in the last step of this study. CNNs are used in computer vision research, such as in image classification, object detection and recognition, and image matching. In particular, complex and deep network models have recently been developed in neural networks of the past that featured simple configurations; and considerable research has been conducted into the development and application of CNNs for various vision recognition tasks [20,21,22].
In this study, Inception-V3 was the CNN model used. There are VGG-16 and AlexNet as CNN models, but Inception-V3 was selected as the experimental model because of its relatively higher accuracy compared to resource use than these models. Inception-V3 is the third version of the GoogLeNet architecture developed by Szegedy et al. [23]. It commonly demonstrates a high degree of precision when used to configure deep layers and wide nodes in an artificial neural network (ANN). However, in this case, the number of parameters increases significantly, resulting in overfitting problems or gradient vanishing problems. Therefore, the connection between nodes is made sparse, and the matrix operation is made dense. To this end, Inception-V3 added several structures to improve the initial module and to achieve better performance and efficiency than before [24,25].
The Inception modules perform the convolution through three or more filtered paths to effectively extract feature. In the case of Inception A, the features from the convolutional layer of 4 paths are concatenated in the direction of a color channel. In the case of Inception B, it is similar to Inception A, and the 3 × 3 filter is factorized into the 1 × 3 filter and the 3 × 1 filter. As a result, the number of parameters can be reduced from 9 to 6 by about 33%. Therefore, the role of this filter serves to increase the number of channels due to the convolution of several layers, which controls the number of channels. This saves the number of parameters in the 3 × 3 or 5 × 5 filter following the 1 × 1 filter. For conventional convolutional neural networks, pooling was used between modules or layers to reduce the size of the parameters, but to solve the problem of representational bottleneck with increasing feature loss, a dimensional reduction method was used.
Therefore, the Inception-v3 model has the advantage of having a deeper layer than other CNN models but not having a relatively large parameter.
Table 2 shows the configuration of CNN layers configured using the Inception modules. The input image size 299 × 299 was set, and the first five general convolutional layers are called stem. The layers are more effective than the Inception module. Furthermore, the 9 Inception modules have a size of 1 × 2048 through a fully connected layer. Finally, since the activation function in the final layer is a classification problem for both flame and non-flame, sigmoid was used [10,24].
In addition, learning was conducted via the Inception-V3 CNN model using a dataset that was divided into two classes of flame and non-flame images, as shown in Table 3. The number of flame images used was 10,153, the training dataset was 80%, and the remaining 20% images comprised the test dataset. The learning was terminated at 10,000 steps, where accuracy and loss during learning did not change significantly and converge. The used train and test image dataset is obtained from Kaggle and CVonline as public materials for use in research, and the dataset is shown in Table 3. In addition, all the photos used for performance evaluation are taken directly.

3. Experimental Results

Figure 6a shows the results of a selective search for RGB images without any additional pre-processing. Figure 6b shows the results of detecting the flame through the method proposed in this study.
Internally in the image process, a selective search algorithm was performed on only the remaining pixel regions after the color conversion, but for clear comparison, the detected candidate regions were visualized on the RGB images. The CNN algorithm inferred the candidate region extracted using the image pre-processing method presented in this study, and the output took the form of a red bounding box when the object was determined to be a flame; the object was visualized as a green bounding box when it was determined to be a non-flame object. In the case of a light yellow object, it was sometimes extracted as a candidate region, but it was classified as non-flame through the CNN model. In the case of night images, it was confirmed that flames could be sufficiently detected at illuminance not too low.
As a result, the number of candidate regions decreased to 20% when detected after color filtering compared to when the RGB image was detected as it is. These results helped to reduce false detection and reduce frequent inference to improve accuracy.
In order to more objectively determine the performance of the flame-detection experiment results obtained in this study, the results were calculated using the following four indicators.
First, accuracy and precision were obtained through Equations (10) and (11), and recall was obtained using Equation (12); F1 score, which is the harmonic mean of the precision and recall rate, was obtained using Equation (13). Meanwhile, Equation (14) is a metric used to evaluate the performance of the binary classifier with the Matthews Correlation Coefficient (MCC). As with other correlation coefficients, it has a value between −1 and 1. When it is +1, it is a perfect prediction, when it is 0, it is a random prediction, and when it is −1, it is a completely opposite prediction.
A c c u r a c y = T P + T N T P + T N + F P + F N
P r e c i s i o n = T P T P + F P
R e c a l l = T P T P + F N
F 1   S c o r e = 2 P r e c i s i o n R e c a l l P r e c i s i o n + R e c a l l
M C C = T P T N F P F N ( T P + F P ) ( T P + F N ) ( T N + F P ) ( T N + F N )
TP is the case where the model correctly determined the area in which the flame existed as a flame, and FN represents the case where it was incorrectly determined to not be a flame. TN correctly judged that it was not a flame in the negative area without a flame, and FP was mistakenly judged as a flame. For this test, 100 positive images with flames and negative images without flames were each tested. In addition, for comparison with the model presented in this study, the single shot multibox detector (SSD) [26,27] and the Faster R-CNN algorithm [28,29], which are deep learning-based object detection models, were evaluated using the same test images. In addition, the accuracy results of existing papers using AlexNet and SA-CNN were added through additional literature search.
The results are shown in Table 4, and in the model presented in this study, the accuracy was 97.0%, precision was 96.1%, and detection and F1 scores were 98.0% and 97.0%, respectively. In order to check the quantify the statistical significance of accuracy, the accuracy was additionally evaluated five times each for 100 images, and the p-value was obtained through this. As a result, the p-value with Bonferroni correction applied is 0.182. In the case of SSD, the accuracy was 90.0% and Faster R-CNN was 91.0%. When the accuracy cases through an additional literature search are shown, the AlexNet and SA-CNN-based papers showed 94.4% and 95.6% accuracy, respectively. The accuracy of the flame-detection algorithm suggested in this study was relatively high, and the frequency of false positives that misdetect non-flame objects was significantly reduced compared to other studies, which greatly affected the increase in precision.
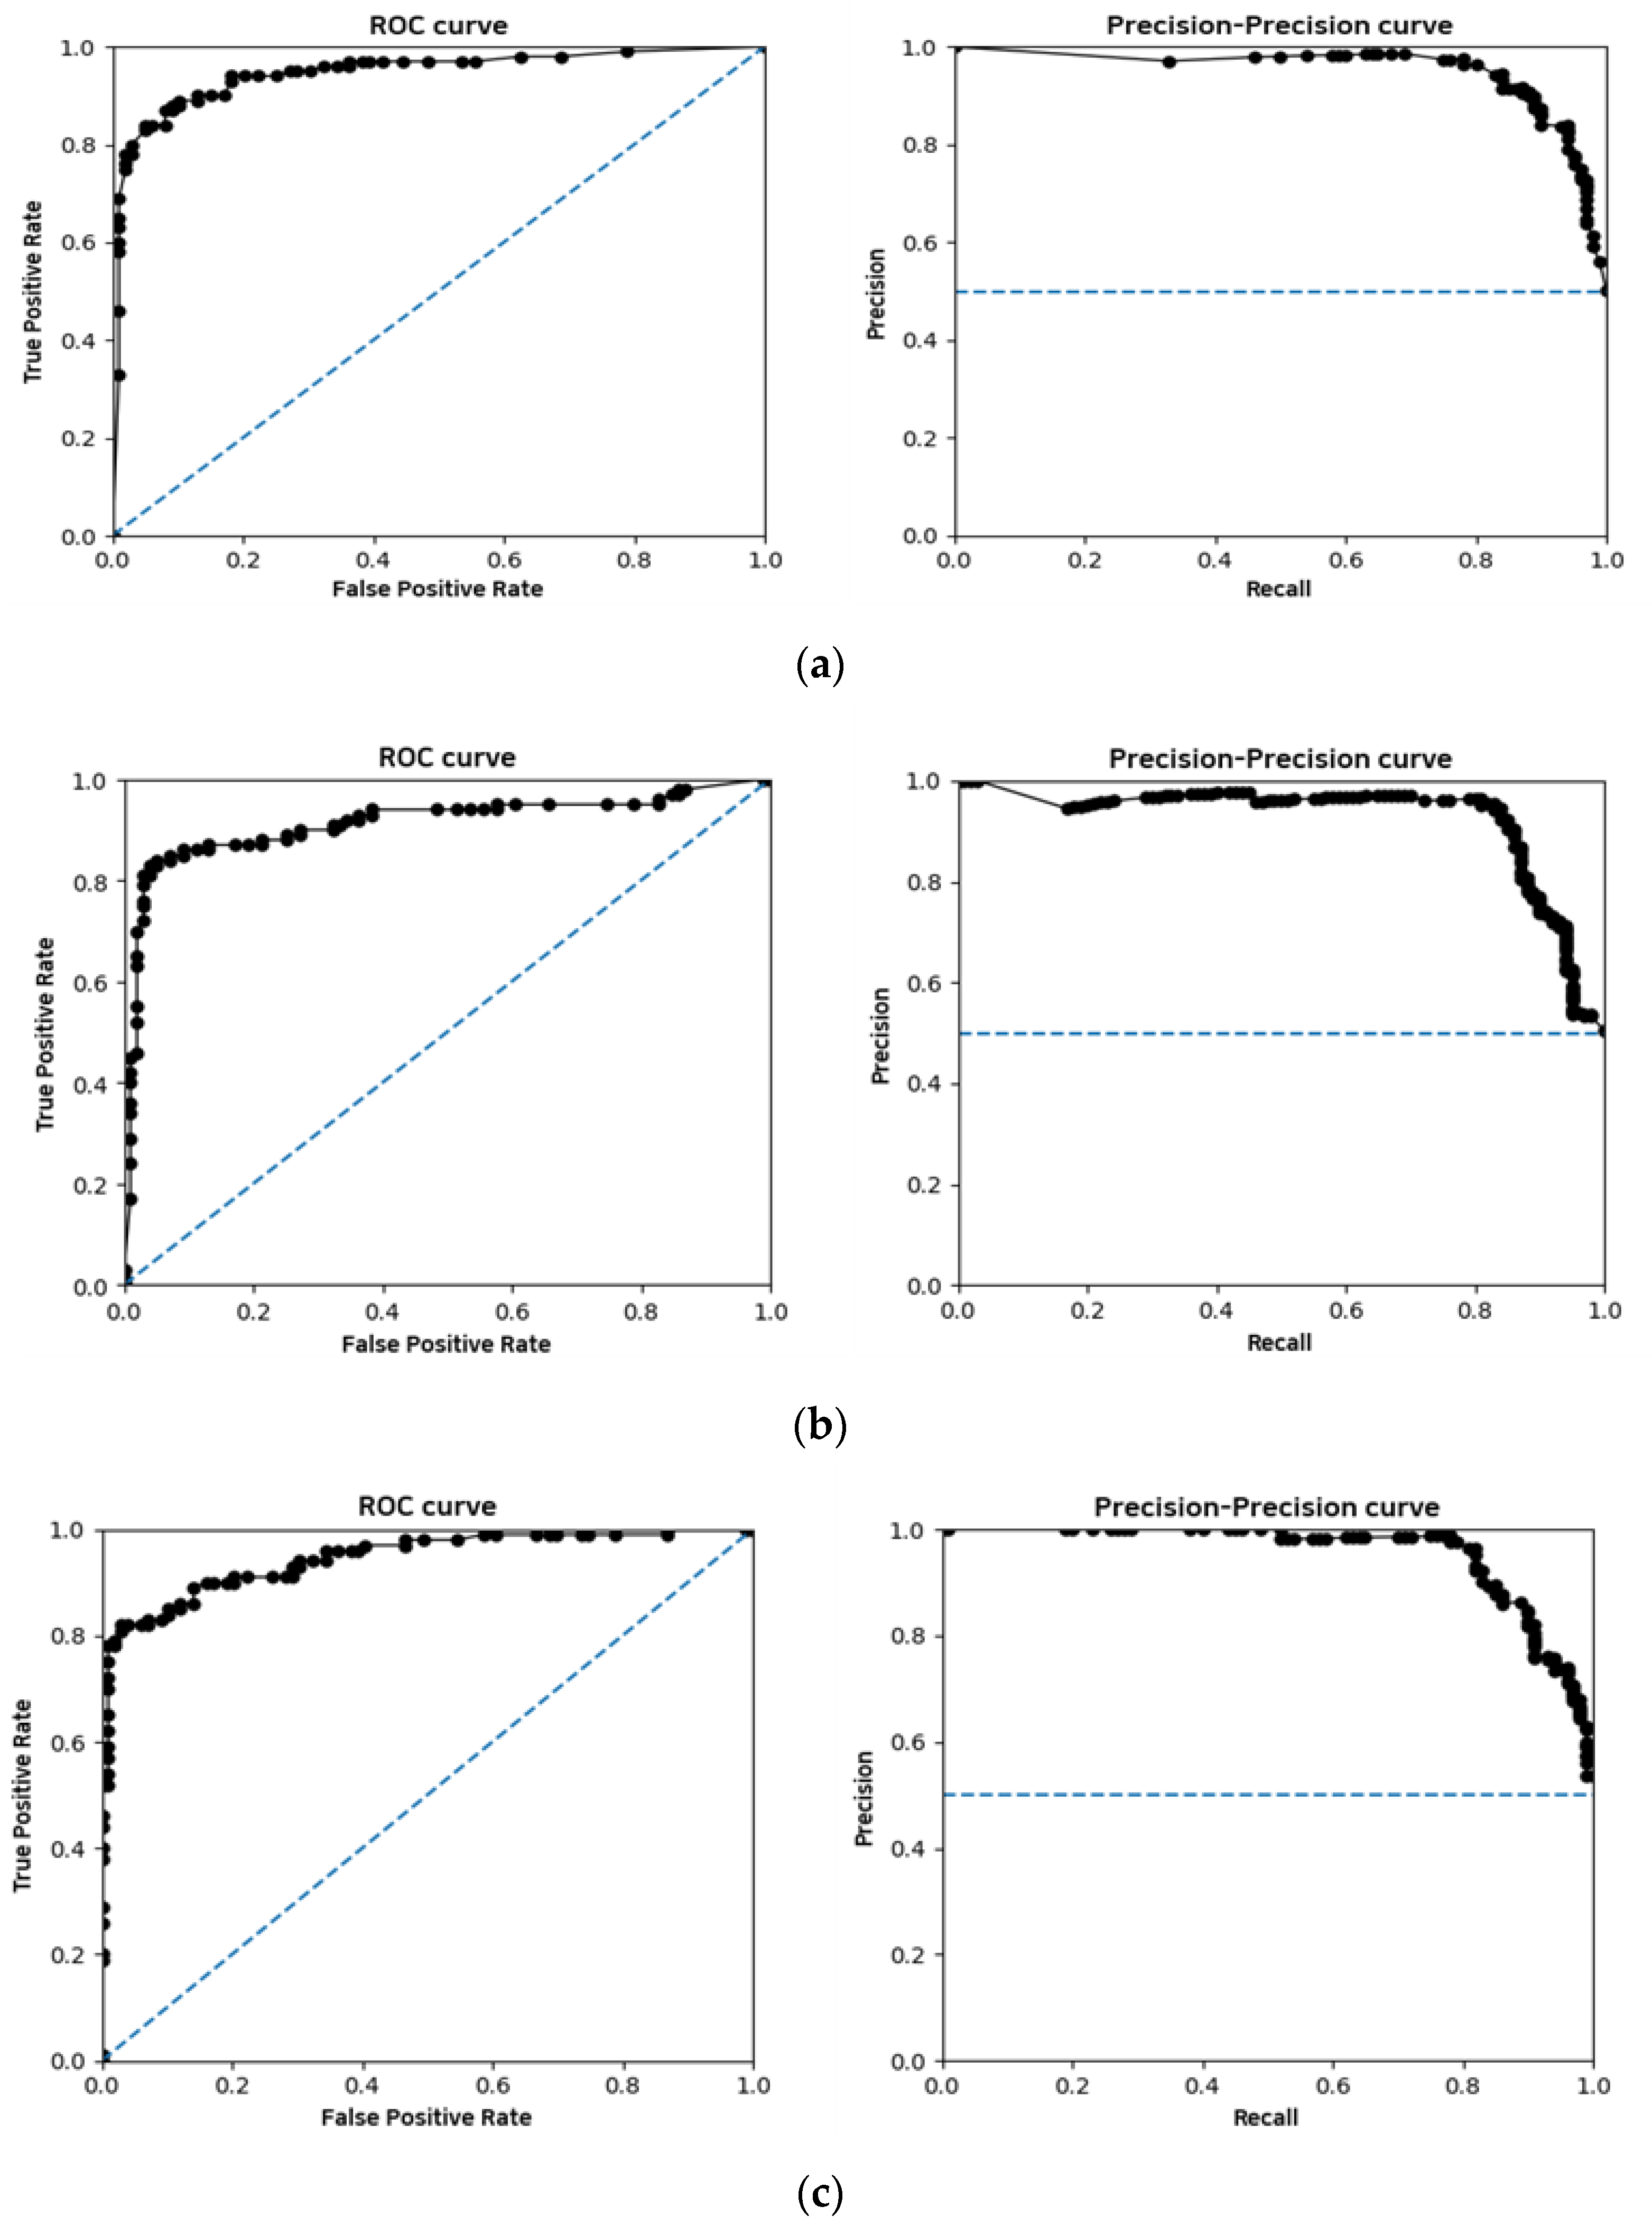
In addition, the receiver operating characteristic (ROC) curve and the precision–recall (PR) curve are calculated by arranging the results of the correct answer and the confidence level of the model in the prediction process and are shown in Figure 7.
The ROC curves were expressed through two parameters, true positive rate (TPR) and false positive rate (FPR), and they showed that the ROC curve changed by changing the threshold criteria. At this time, if the classification threshold was lowered, the TPR and FPR classified as positive in the general classification model increased together. Therefore, a curve with a higher TPR and a lower FPR on the graph can be judged as a better classification model. Likewise, PR curves are a method of evaluating the performance of classification models by changing thresholds, and the higher the precision and recall values, the better the model.
Figure 7a shows similar evaluation results compared to the Faster R-CNN model corresponding to Figure 7b with the ROC and PR curves of the SSD model. However, if the size of the object occupied by some evaluation images was small, the SSD model could not detect it, whereas the Faster R-CNN detected relatively small objects. Finally, Figure 7c showed the best performance among the models presented in this study. This is the effect of filtering most non-flame objects through color-based conversion in advance. Using this method, it was possible to increase detection accuracy by significantly reducing false positives. In addition, this approach could also detect objects that were smaller than those detected using the other two models.

4. Conclusions

Deep learning technology has dramatically improved detection accuracy in areas such as safety, autonomous driving, and medical imaging, and there are countless applicable technologies. Nevertheless, there are many areas to be improved upon in terms of accuracy and responsiveness when detecting objects such as flames in real time. To this end, this study attempted to increase accuracy by removing unnecessary objects and background data through color-based pre-processing. As a result, flame-related RGB images could be detected with about 7% higher accuracy than when detected with object-detection algorithms, such as Faster R-CNN or SSD, without separate filtering. In addition, the proposed model showed higher accuracy than the Faster R-CNN model or SSD that performed object detection through a general input image. This will be a more accurate fire detection method than human judgment if a more suitable CNN model is developed and applied. The application of this pre-processing method could effectively increase detection accuracy and precision by effectively reducing not only the false-positive ratio but also the false-negative ratio. Future research will pursue the development of an intelligent flame detector that can be applied to low-specification systems and which can easily perform real-time detection by supplementing pre-processing methods. In addition, we will study a method that can accurately detect flames even from small characteristics in images and develop a flame detection model with higher reliability than can be achieved by human observation. This can be accomplished by either applying the dynamic characteristics of flames or by being fused with hardware, such as infrared cameras, to ensure faster detection and improved accuracy when compared to human-based approaches.

Author Contributions

Conceptualization, J.R. and D.K.; Methodology, J.R.; Software, J.R.; Supervision, D.K.; Validation, D.K.; Writing—original draft preparation, J.R.; Writing—review and editing, D.K. All authors have read and agreed to the published version of the manuscript.

Funding

This research was supported by a grant (20010162) of Regional Customized Disaster-Safety R&D Program funded by Ministry of Interior and Safety (MOIS, Korea).

Institutional Review Board Statement

Not applicable.

Informed Consent Statement

Not applicable.

Data Availability Statement

Not applicable.

Acknowledgments

This research was supported by “Regional Innovation Strategy (RIS)” through the National Research Foundation of Korea (NRF) funded by the Ministry of Education (MOE) (2022RIS-005).

Conflicts of Interest

The authors declare no conflict of interest.

References

  1. Ryu, J.; Kwak, D. Flame detection using appearance-based pre-processing and Convolutional Neural Network. Appl. Sci. 2021, 11, 5138. [Google Scholar] [CrossRef]
  2. Shen, D.; Chen, X.; Nguyen, M.; Yan, W. Flame detection using deep learning. In Proceedings of the 2018 4th International Conference on Control, Automation and Robotics (ICCAR), Auckland, New Zealand, 20–23 April 2018; pp. 416–420. [Google Scholar]
  3. Muhammad, K.; Khan, S.; Elhoseny, M.; Ahmed, S.; Baik, S. Efficient Fire Detection for Uncertain Surveillance Environment. IEEE Trans. Ind. Inform. 2019, 15, 3113–3122. [Google Scholar] [CrossRef]
  4. Sarkar, S.; Menon, A.S.; T, G.; Kakelli, A.K. Convolutional Neural Network (CNN-SA) based selective amplification model to enhance image quality for efficient fire detection. Int. J. Image Graph. Signal Process. 2021, 13, 51–59. [Google Scholar] [CrossRef]
  5. Muhammad, K.; Ahmad, J.; Baik, S.W. Early fire detection using convolutional neural networks during surveillance for effective disaster management. Neurocomputing 2018, 288, 30–42. [Google Scholar] [CrossRef]
  6. Abdusalomov, A.; Baratov, N.; Kutlimuratov, A.; Whangbo, T. An Improvement of the Fire Detection and Classification Method Using YOLOv3 for Surveillance Systems. Sensors 2021, 21, 6519. [Google Scholar] [CrossRef] [PubMed]
  7. Kim, B.; Lee, J. A Video-Based Fire Detection Using Deep Learning Models. Appl. Sci. 2019, 9, 2862. [Google Scholar] [CrossRef] [Green Version]
  8. Redmon, J.; Divvala, S.; Girshick, R.; Farhadi, A. You only look once: Unified, real-time object detection. In Proceedings of the 2016 IEEE Conference on Computer Vision and Pattern Recognition (CVPR), Las Vegas, NV, USA, 27–30 June 2016; pp. 779–786. [Google Scholar]
  9. He, K.; Zhang, X.; Ren, S.; Sun, J. Spatial pyramid pooling in deep convolutional networks for visual recognition. IEEE Trans. Pattern Anal. Mach. Intell. 2015, 37, 1904–1916. [Google Scholar] [CrossRef] [Green Version]
  10. Kurilová, V.; Goga, J.; Oravec, M.; Pavlovičová, J.; Kajan, S. Support Vector Machine and deep-learning object detection for localisation of hard exudates. Sci. Rep. 2021, 11, 16045. [Google Scholar] [CrossRef]
  11. Chmelar, P.; Benkrid, A. Efficiency of HSV over RGB gaussian mixture model for fire detection. In Proceedings of the 2014 24th International Conference Radioelektronika, Bratislava, Slovakia, 15–16 April 2014. [Google Scholar]
  12. Chen, X.J.; Dong, F. Recognition and segmentation for fire based HSV. In Computing, Control, Information and Education Engineering; CRC Press: Boca Raton, FL, USA, 2015; pp. 369–374. [Google Scholar]
  13. Ibrahim, A.S.; Sartep, H.J. Grayscale image coloring by using YCbCr and HSV color spaces. Int. J. Mod. Trends Eng. Res. 2017, 4, 130–136. [Google Scholar]
  14. Munshi, A. Fire detection methods based on various color spaces and gaussian mixture models. Adv. Sci. Technol. Res. J. 2021, 15, 197–214. [Google Scholar] [CrossRef]
  15. Celik, T.; Demirel, H. Fire detection in video sequences using a generic color model. Fire Saf. J. 2009, 44, 147–158. [Google Scholar] [CrossRef]
  16. Zhu, L.; Zhang, J.; Sun, Y. Remote Sensing Image Change Detection using superpixel cosegmentation. Information 2021, 12, 94. [Google Scholar] [CrossRef]
  17. Qiu, W.; Gao, X.; Han, B. A superpixel-based CRF Saliency Detection Approach. Neurocomputing 2017, 244, 19–32. [Google Scholar] [CrossRef]
  18. Felzenszwalb, P.F.; Huttenlocher, D.P. Efficient graph-based image segmentation. Int. J. Comput. Vis. 2004, 59, 167–181. [Google Scholar] [CrossRef]
  19. Uijlings, J.R.; van de Sande, K.E.; Gevers, T.; Smeulders, A.W. Selective search for object recognition. Int. J. Comput. Vis. 2013, 104, 154–171. [Google Scholar] [CrossRef] [Green Version]
  20. Nan, H.; Tong, M.; Fan, L.; Li, M. 3D RES-inception network transfer learning for multiple label crowd behavior recognition. KSII Trans. Internet Inf. Syst. 2019, 13, 1450–1463. [Google Scholar]
  21. Kim, H.; Park, J.; Lee, H.; Im, G.; Lee, J.; Lee, K.-B.; Lee, H.J. Classification for breast ultrasound using convolutional neural network with multiple time-domain feature maps. Appl. Sci. 2021, 11, 10216. [Google Scholar] [CrossRef]
  22. Pu, Y.; Apel, D.B.; Szmigiel, A.; Chen, J. Image recognition of coal and coal gangue using a convolutional neural network and transfer learning. Energies 2019, 12, 1735. [Google Scholar] [CrossRef] [Green Version]
  23. Szegedy, C.; Liu, W.; Jia, Y.; Sermanet, P.; Reed, S.; Anguelov, D.; Erhan, D.; Vanhoucke, V.; Rabinovich, A. Going deeper with convolutions. In Proceedings of the 2015 IEEE Conference on Computer Vision and Pattern Recognition (CVPR), Boston, MA, USA, 7–12 June 2015. [Google Scholar]
  24. Szegedy, C.; Vanhoucke, V.; Ioffe, S.; Shlens, J.; Wojna, Z. Rethinking the inception architecture for computer vision. In Proceedings of the 2015 IEEE Conference on Computer Vision and Pattern Recognition (CVPR), Las Vegas, NV, USA, 27–30 June 2016. [Google Scholar]
  25. Al Husaini, M.A.; Habaebi, M.H.; Gunawan, T.S.; Islam, M.R.; Elsheikh, E.A.; Suliman, F.M. Thermal-based Early Breast Cancer Detection Using Inception V3, inception V4 and modified inception MV4. Neural Comput. Appl. 2021, 34, 333–348. [Google Scholar] [CrossRef] [PubMed]
  26. Liu, W.; Anguelov, D.; Erhan, D.; Szegedy, C.; Reed, S.; Fu, C.-Y.; Berg, A.C. SSD: Single shot multibox detector. In Computer Vision—ECCV 2016; Springer: Berlin/Heidelberg, Germany; pp. 21–37.
  27. Yan, C.; Zhang, H.; Li, X.; Yuan, D. R-SSD: Refined single shot multibox detector for pedestrian detection. Appl. Intell. 2022, 52, 10430–10447. [Google Scholar] [CrossRef]
  28. Girshick, R. Fast R-CNN. In Proceedings of the 2015 IEEE International Conference on Computer Vision (ICCV), Santiago, Chile, 7–13 December 2015. [Google Scholar]
  29. Ren, S.; He, K.; Girshick, R.; Sun, J. Faster R-CNN: Towards real-time object detection with region proposal networks. IEEE Trans. Pattern Anal. Mach. Intell. 2017, 39, 1137–1149. [Google Scholar] [CrossRef] [PubMed]
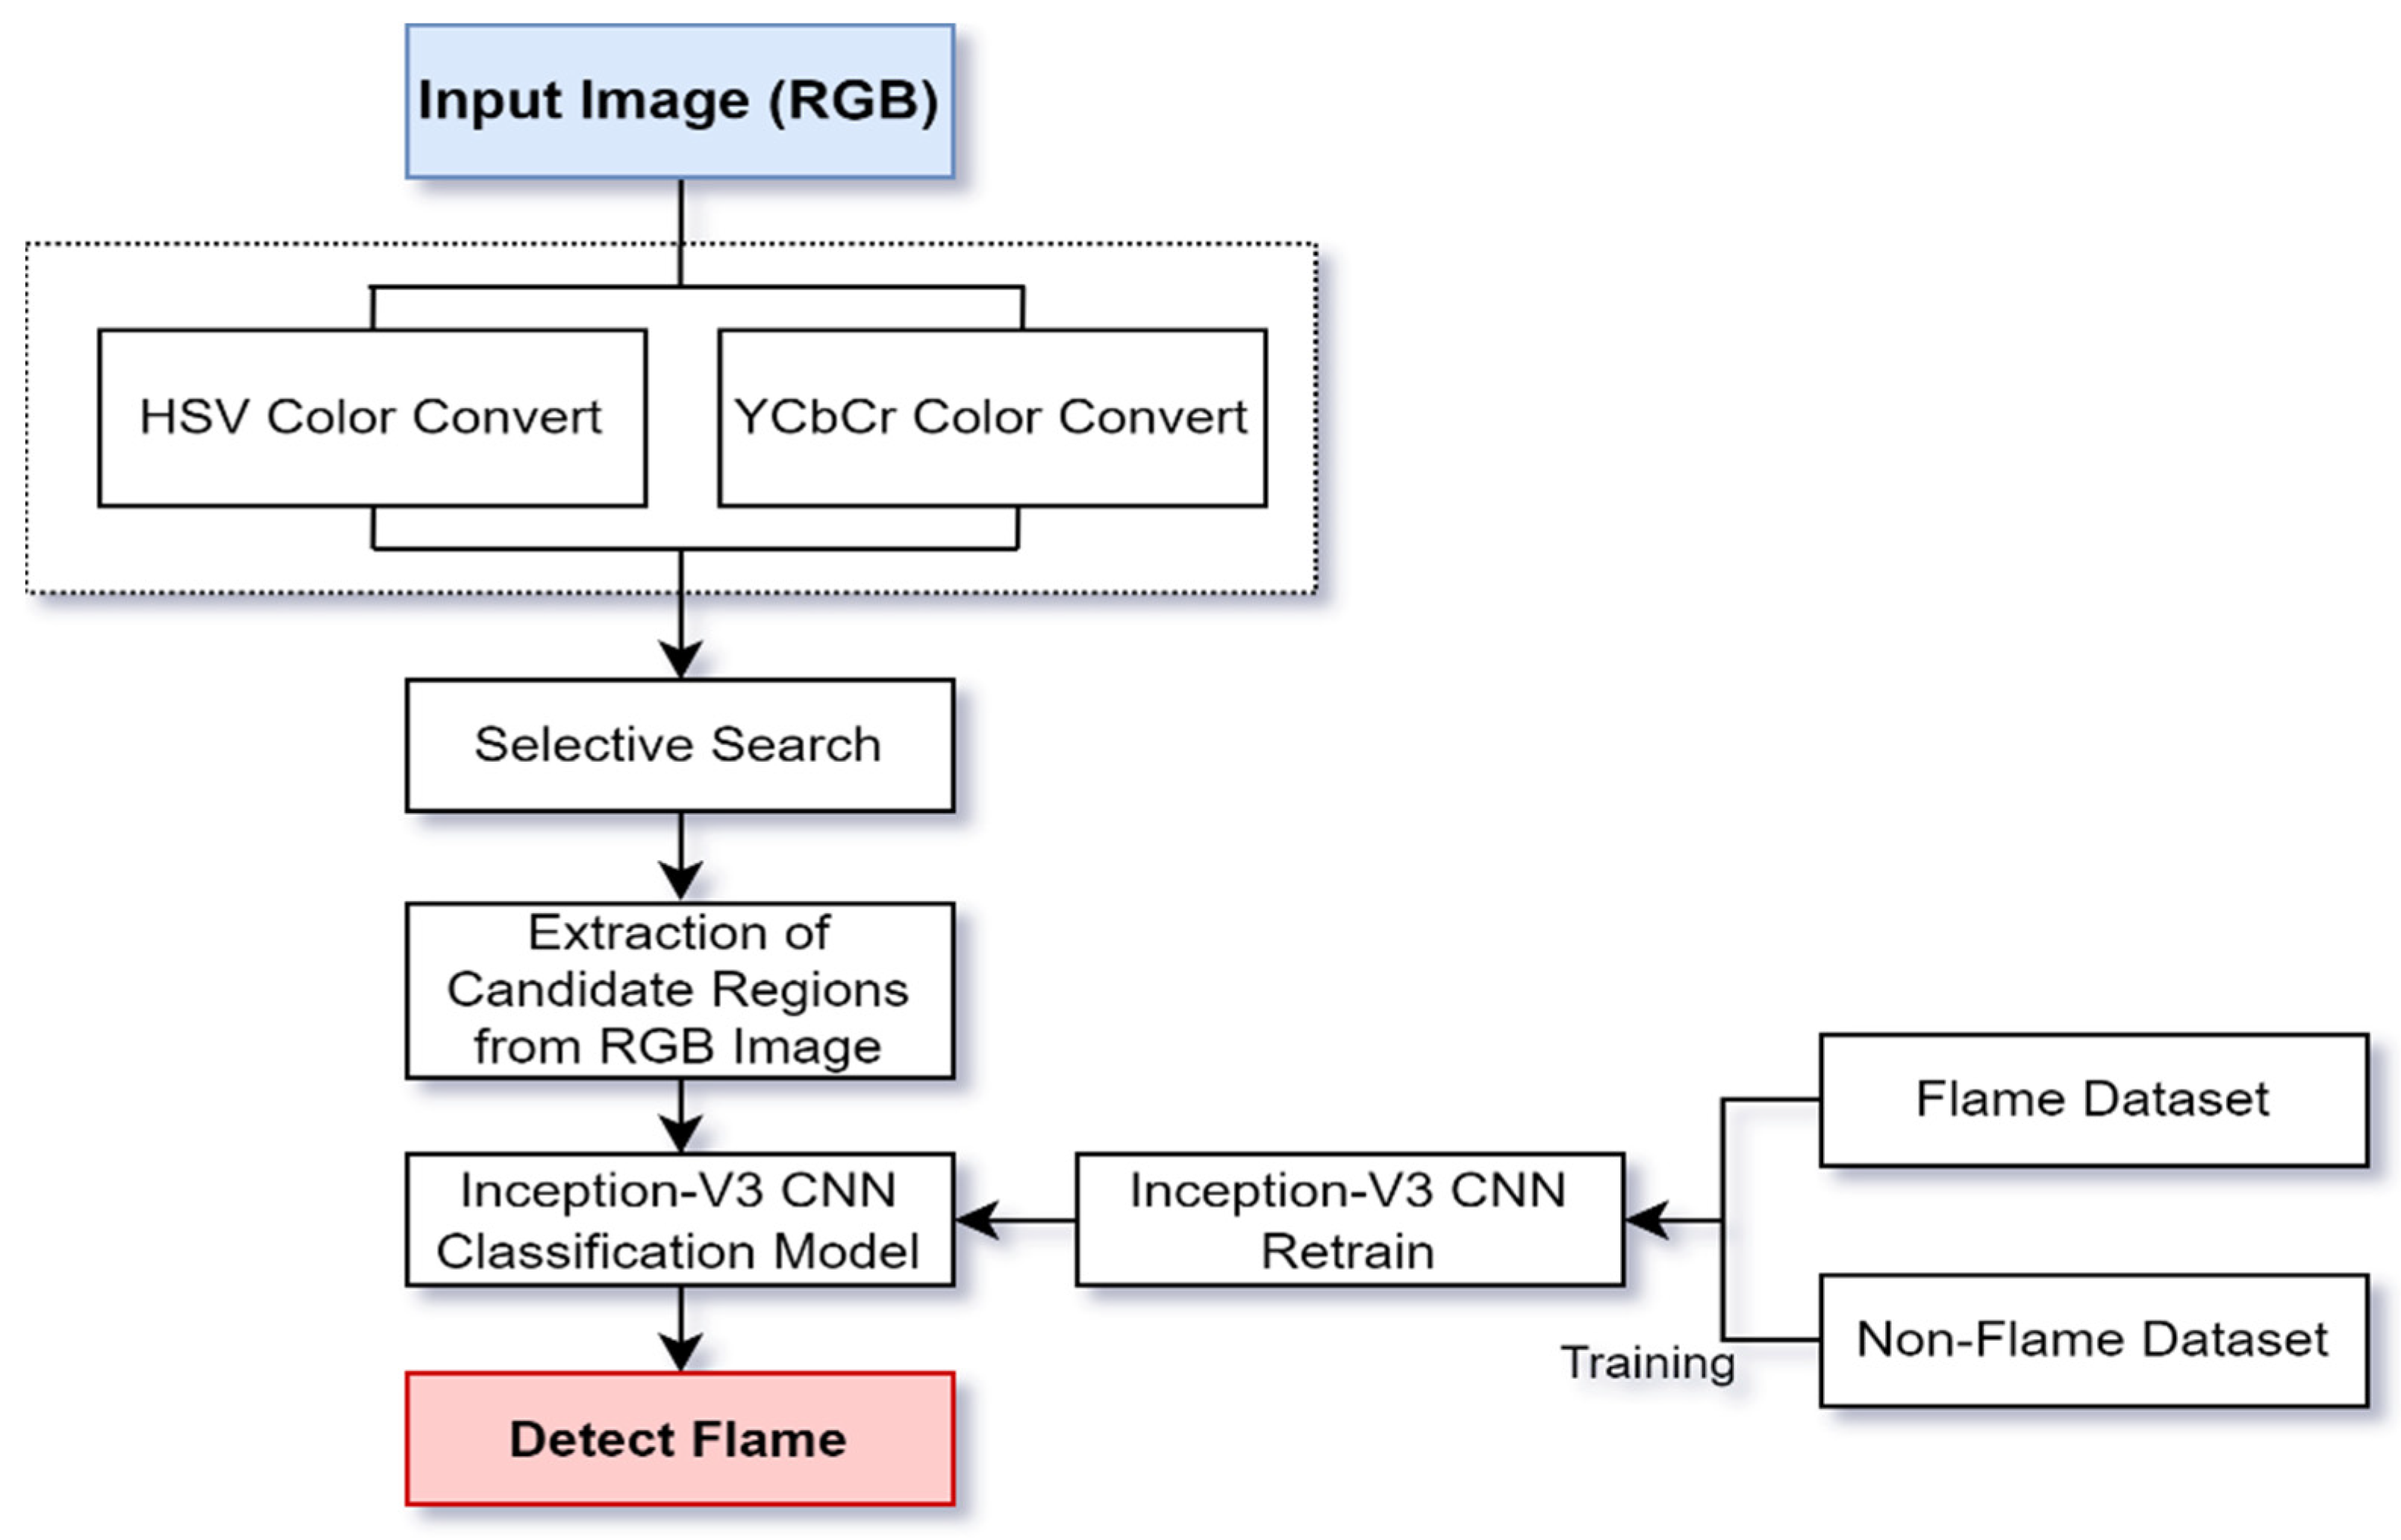
Figure 1. Image pre-processing and deep learning-based inference process for flame detection.
Fire 05 00194 g001
Figure 2. HSV color conversion of flame images. (a) Original flame images; (b) HSV color conversion images within the range.
Fire 05 00194 g002
Figure 3. Color conversion of flame images. (a) Original images; (b) HSV color conversion images within the range; (c) YCbCr color conversion images to which the rule is applied; (d) Images to which both YCbCr and HSV color conversion are applied.
Fire 05 00194 g003
Figure 4. Perform selective search of flame images. (a) Original images; (b) Selective search for the original images; (c) Selective search for the color conversion images.
Fire 05 00194 g004
Figure 5. Extraction of final flame candidate regions. (a) Original images; (b) Detection of candidate regions using the proposed method.
Fire 05 00194 g005
Figure 6. Flame detection results from the evaluation images. (a) CNN detection results for candidate regions using selective search of RGB images; (b) CNN detection results in candidate regions using proposed pre-processing method and selective search.
Fire 05 00194 g006
Figure 7. ROC and PR curve for each detection model. (a) ROC and PR curve of the Faster R-CNN; (b) ROC and PR curve of the SSD; (c) ROC and PR curve of the proposed model.
Fire 05 00194 g007
Table 1. Color range of flame pixels in HSV color model.
Greater thanLess than
Hue590
Saturation40255
Value220255
Table 2. Inception-V3 CNN parameter.
LayerKernel SizeInput Size
Conv 3 × 3 299 × 299 × 3
Conv 3 × 3 149 × 149 × 32
Convolution (Padded) 3 × 3 147 × 147 × 32
MaxPool 3 × 3 147 × 147 × 64
Conv 3 × 3 73 × 73 × 64
Conv 3 × 3 73 × 73 × 80
MaxPool 3 × 3 71 × 71 × 192
Inception   A × 3 - 35 × 35 × 192
Reduction- 35 × 35 × 228
Inception   B × 3 - 17 × 17 × 768
Reduction- 17 × 17 × 768
Inception   C × 3 - 8 × 8 × 1280
AveragePool- 8 × 8 × 2048
FC- 1 × 2048
Sigmoid--
Table 3. Number of images in the dataset.
Train DatasetTest Dataset
FlameNon-FlameFlameNon-Flame
8152802420012000
Table 4. Evaluation result for each detection models.
Evaluation Indicator
AccuracyPrecisionRecallF1-ScoreMCC
SSD90.0%88.5%92.0%90.2%0.80
Faster R-CNN91.0%90.2%92.0%91.1%0.82
Sarkar et al. [4] (SA-CNN)95.6%96.0%97.1%96.6%0.90
Muhammad et al. [5] (AlexNet)94.4%97.7%90.9%89.0%0.89
Our proposal97.0%96.1%98.0%97.0%0.94
Publisher’s Note: MDPI stays neutral with regard to jurisdictional claims in published maps and institutional affiliations.