Article

Chromatic Coding (ConForest_RGB) for the Detection of Spatial-Temporal Patterns in Collective Lands in Galicia (Spain)

by
Gervasio López Rodríguez
and
Manuel Francisco Marey Pérez
*
Research Group PROePLA GI-1716, Department of Plant Production and Engineering Projects, Higher Polytechnic School of Engineering, University of Santiago de Compostela, Campus Terra, 27002 Lugo, Spain
*
Author to whom correspondence should be addressed.
Fire 2022, 5(6), 179; https://doi.org/10.3390/fire5060179
Submission received: 16 September 2022 / Revised: 24 October 2022 / Accepted: 30 October 2022 / Published: 31 October 2022
(This article belongs to the Special Issue Spatial Statistics and Operational Research for Wildfires Management)

Abstract

:
In the scientific literature, numerous different analyses have been reported on forest fires, in a constant effort to predict their behavior and occurrence. It is known that a variety of factors come together in these events: climatic, physiographic, socioeconomic and territorial, among others. However, although forest fires have a significant relationship with social conflict, this aspect has not been sufficiently studied. This aspect is particularly important in regions such as Galicia (Northwest Spain), where forest fires, either intentional or related to human activity, account for up to 95% of the total annual number of fires. As a measure of this social conflict, in this article, we compile the court sentences and newspaper reports, in which the montes vecinales en mano común VMC) of Galicia (a special type of property and tenure right) have been involved, which allows us to elaborate a chromatic coding that relates the three factors and allows us to detect spatio-temporal patterns. The resulting coding is a grid made up of 3034 rows and 15 columns, in which the color of each cell indicates the relationship between fires, newspaper reports, and court rulings. This coding also makes it possible to detect differences between the geographical sectors considered, which helps to detect spatio-temporal patterns and facilitates the implementation of specific prevention policies for each geographical sector.

1. Introduction

Fire is a fundamental component of most of the Earth’s terrestrial ecosystems [1,2,3] and, although there are others, wildfires are one of the greatest risks to property and people [4,5,6,7,8]. Forest fires destroy more than 1.3 million hectares in Europe each year [9,10], causing dozens of deaths annually [11] and in some years hundreds of deaths [12]. However, their impact is expected to increase in the future [13,14], despite great economic efforts that have been made in recent years [15,16,17]. It is also necessary to highlight the fact that forest fires are closely linked to human activity, and are often caused by social conflicts [18,19,20]. Although a recent study claimed that the number of human-caused fires had been overestimated [21], other authors have pointed out that up to 95% of forest fires were either caused by humans [22,23] or related to human activity [24].
In order to fight forest fires, it is necessary to increase our knowledge of them, as this knowledge allows us to predict the behavior of forest fires [25]. In the following paragraphs, we briefly explain some of the factors that determine the behavior and spread of wildfires, some of the causes that lead to ignition, and some of the different mathematical models that have been developed to evaluate the roles of these factors.
Among the causes studied are social or socioeconomic factors, whose role is currently much less known than that played by biophysical factors [26,27,28]. It is also necessary to consider that the role of biophysical factors is more relevant for their effect on fire behavior than for their direct effect on fire itself, and that human pressure is one of the most important drivers of a wildfire [29]. This factor, human pressure, is among the main causes of forest fires as once pointed out by [19] and in a recent work by [21] contrasted for a large part of the Mediterranean area. The same aspect has also been verified in other regions of the world. In this sense, a study on forest plantations in Brazil stated that most of the climatic variables, considered in isolation, do not have a strong direct relationship with fire occurrence [30]. More factors, therefore, need to be analyzed, as detailed information on the causes and motivations of fires is crucial to develop actions aimed at changing social and individual attitudes and behaviors that lead to forest fires [21,25].
This intentional nature is due to various factors. Thus, changes in population density [26,31], for example, or the abandonment of agricultural work and the consequent use of fire as a tool for clearing and fertilizing plots increase the possibility of fire. In this sense, small-sized land plots can also increase the occurrence of forest fires, as the mechanization of these plots is more expensive and difficult, which may encourage managers to carry out cheaper brush removal methods, such as the removal of the undergrowth with fire [32]. Depopulation in wildland–urban interface areas can also lead to a higher number of wildfires [33,34,35,36]. This is especially important as deliberate fires are, together with those caused by lightning and power lines, the fires that affect houses the most [37,38,39]. In addition, high density of machinery increases the likelihood of accidental ignition by sparks [32]. Additional causes include unemployment as a trigger for forest fires [39], or the loss of land value [40], which favors land abandonment and increases the risk of fires. Other authors have also emphasized the density of roads and road networks [41]; another author, in a now classic paper [32], found a direct relationship between twelve of the thirteen variables they analyzed and the occurrence of forest fires. Some other causes for which a relationship with fire occurrence was found were poverty [11,42], an increase in forest area [43] and scrubland [44]; and ineffective forest policies [45,46].
The process of collecting data has been made difficult for two reasons. Firstly, there is an enormous amount of information coming from different sources, in various formats, etc. Secondly, in the case of judgments, the legislation on personal data protection has made access to information difficult.
The fact that a wide range of factors are involved in the occurrence of forest fires has led to the development of different statistical methods to assess the role of each of these factors. Different simulation models have been developed. Simulation modeling is an effective and economical way to study the relationships among fire regimes, climatic vegetation, and fire management [39], which can be used to preassess the potential impact of different fire management techniques. In this regard, many different mathematical models have been developed over time to try to predict the possible occurrence of a forest fire, which have been progressing in a constant study of the multiple factors involved in the phenomenon. However, given that there is no linear relationship between wildfire drivers and the occurrence of wildfires [12], it is necessary to establish highly flexible nonlinear models to predict the complex processes that occur in reality [17]. In this constant search for flexibility and accuracy, there has been a shift from generalized linear regression models (GLM) [47,48,49] to generalized linear mixed models (GLMM), which incorporate random effects to linear predictors [50]. GLM models are an extension of linear models that can handle non-normal distributions of the response variable, providing an alternative way of transforming the response. The distributions used include those such as Poisson, binomial, negative binomial and gamma [26]. Subsequently, non-linear models emerged such as generalized additive models (GAM), which include smoothing functions associated with the covariates of the linear predictor [51,52], or generalized additive mixed models (GAMM), which are an extension of the previous ones. Others authors [53], in a study on wildfire prediction in Galicia (Spain), have taken a step beyond the classic GLM and GAM and developed structured additive regression (STAR) models, which are much more flexible, as they allow the combined use of spatial and temporal covariates with continuous covariates, which improve the calculation of forest fire risk. Another example is GWR models, a statistical technique used in the exploratory analysis of spatial data and developed in the framework of local or statistical spatial modeling. Local models can be inferred as the spatial disaggregation of global statistics whose main characteristic is the fact that they are calibrated from a spatially limited sample set, and therefore, produce local regression parameter estimates [54]. Therefore, GWR techniques extend the traditional use of global regression models, allowing the calculation of local regression parameters [26].
With regard to the variables used as predictors in the different mathematical models, these have also undergone enormous variations. For example, the first studies used only climatic variables, such as precipitation or average temperature [55,56,57]. Later, variables describing physiography, such as slope or exposure, were added [58]. Variables referring to the existing fuel in a study area were also introduced, such as the moisture content of the dead fine fuel or the type of scrub [59], which largely determine fire behavior. In any case, the choice of variables depends, to a large extent, on the country under study and the fire casuistry in that country. Thus, in those countries where intentionality is high, socioeconomic variables tend to be included in the models, while in those countries where the occurrence of forest fires is due to random ignition, climate and physiographic variables are included, in addition to those that refer to the existing fuel.
Among the socioeconomic variables most commonly used by researchers we can cite population density [5,29,60,61]; unemployment [62,63]; machinery density [35,64]; and livestock density [65,66]. The influence of more unusual variables has also been analyzed, such as the relationship between the occurrence of wildfires and the holding of electoral processes in Northwest Spain [67], or the possible relationship that forest fires may have with the value of land [68], or with the presence of the Natura 2000 network [69].
Regarding the role of infrastructure in the occurrence of wildfires, various variables have been analyzed such as the distances of ignition sources to road networks or to the nearest population center [14,17,30,61]; the density of roads [70,71]; or the presence of infrastructure where accidental or negligent ignition is common, such as railways or power lines [49,72].
However, social conflict has been poorly discussed in the scientific literature, despite the fact that it is an aspect of great relevance in geographical regions where the percentage of human-caused forest fires is very high. It is, therefore, necessary to develop methods to analyze the role of social conflict in the occurrence of forest fires. In relation to this, to give continuity to what was outlined in two previous papers [73,74], in this study, we propose a new methodology for the detection of spatio-temporal patterns of human-caused forest fires. Thus, by means of the proposed chromatic code, which uses variables related to social conflict, it would be possible to detect spatio-temporal patterns that could not be detected by more classical methods, such as clusters. The aim of this paper is to show the methodology developed by integrating spatial and temporal information of the conflict measured by counting journalistic news and/or judicial proceedings in which montes vecinales en mano común (MVMC) has been involved, and then by means of the proposed chromatic coding, a visual way allows us to easily determine the most problematic incendiary areas. We hypothesize that the existence of distinct spatial and temporal trends can be explained by analyzing the evolution of each MVMC separately over time. The fact that MVMCs have been chosen as the working units is due to the importance of this type of land tenure in Galicia, the relevance of which for the forestry sector is described in subsequent paragraphs.

2. Materials and Methods

2.1. Methods

To elaborate the chromatic coding, a visual basic module was programmed which, based on the annual values of wildfires, newspaper reports, and court sentences given in each MVMC in a given year, created with them an RGB (Red-Green-Blue) chromatic code (Table 1). In this RGB code, the color red (R) indicated the number of wildfires, green (G) represented the number of newspaper reports, and blue (B) represented the number of court sentences. The greater or lesser chromatic intensity depended on the number of wildfires, newspaper reports, or court rulings that had taken place. Finally, the addition of the three primary colors indicate the combination of the three study parameters, and gave an idea of the relationship between these parameters (Table 2). The choice of the range of each variable (forest fires, newspaper reports, and sentences) was arbitrary. The result was a chromatic coding made up of a series of fifteen cells (one for each year of the study period from 2000 to 2014), where the shade of each cell was determined by the combination of wildfires, newspaper reports, and court sentences that occurred in each of the years of the series and in each existing MVMC. In this way, the chromatic classification facilitated the visual detection of possible spatial patterns without resorting statistical calculations.
To facilitate the visualization of the chromatic code, it was decided to give a white color to the cells that corresponded to a number of wildfires, newspaper reports, and judicial sentences equal to zero, so that the RGB code of these cells became (255,255,255). If we had chosen to give a value of (0, 0, 0), the color of these cells would have been black, which would complicate the visualization of the code.
Finally, the resulting chromatic coding, which we call ConForest_RGB, is presented in 3034 rows (one for each existing MVMC in Galicia) and 15 columns, each of which reflects the resulting RGB code for the annual combination of wildfires, newspaper reports, and judicial proceedings (15 cells/15 years). In some ways, the appearance of this chromatic coding is similar to the chromatic coding used in a paper on the relationship between drought and forest fires [75].
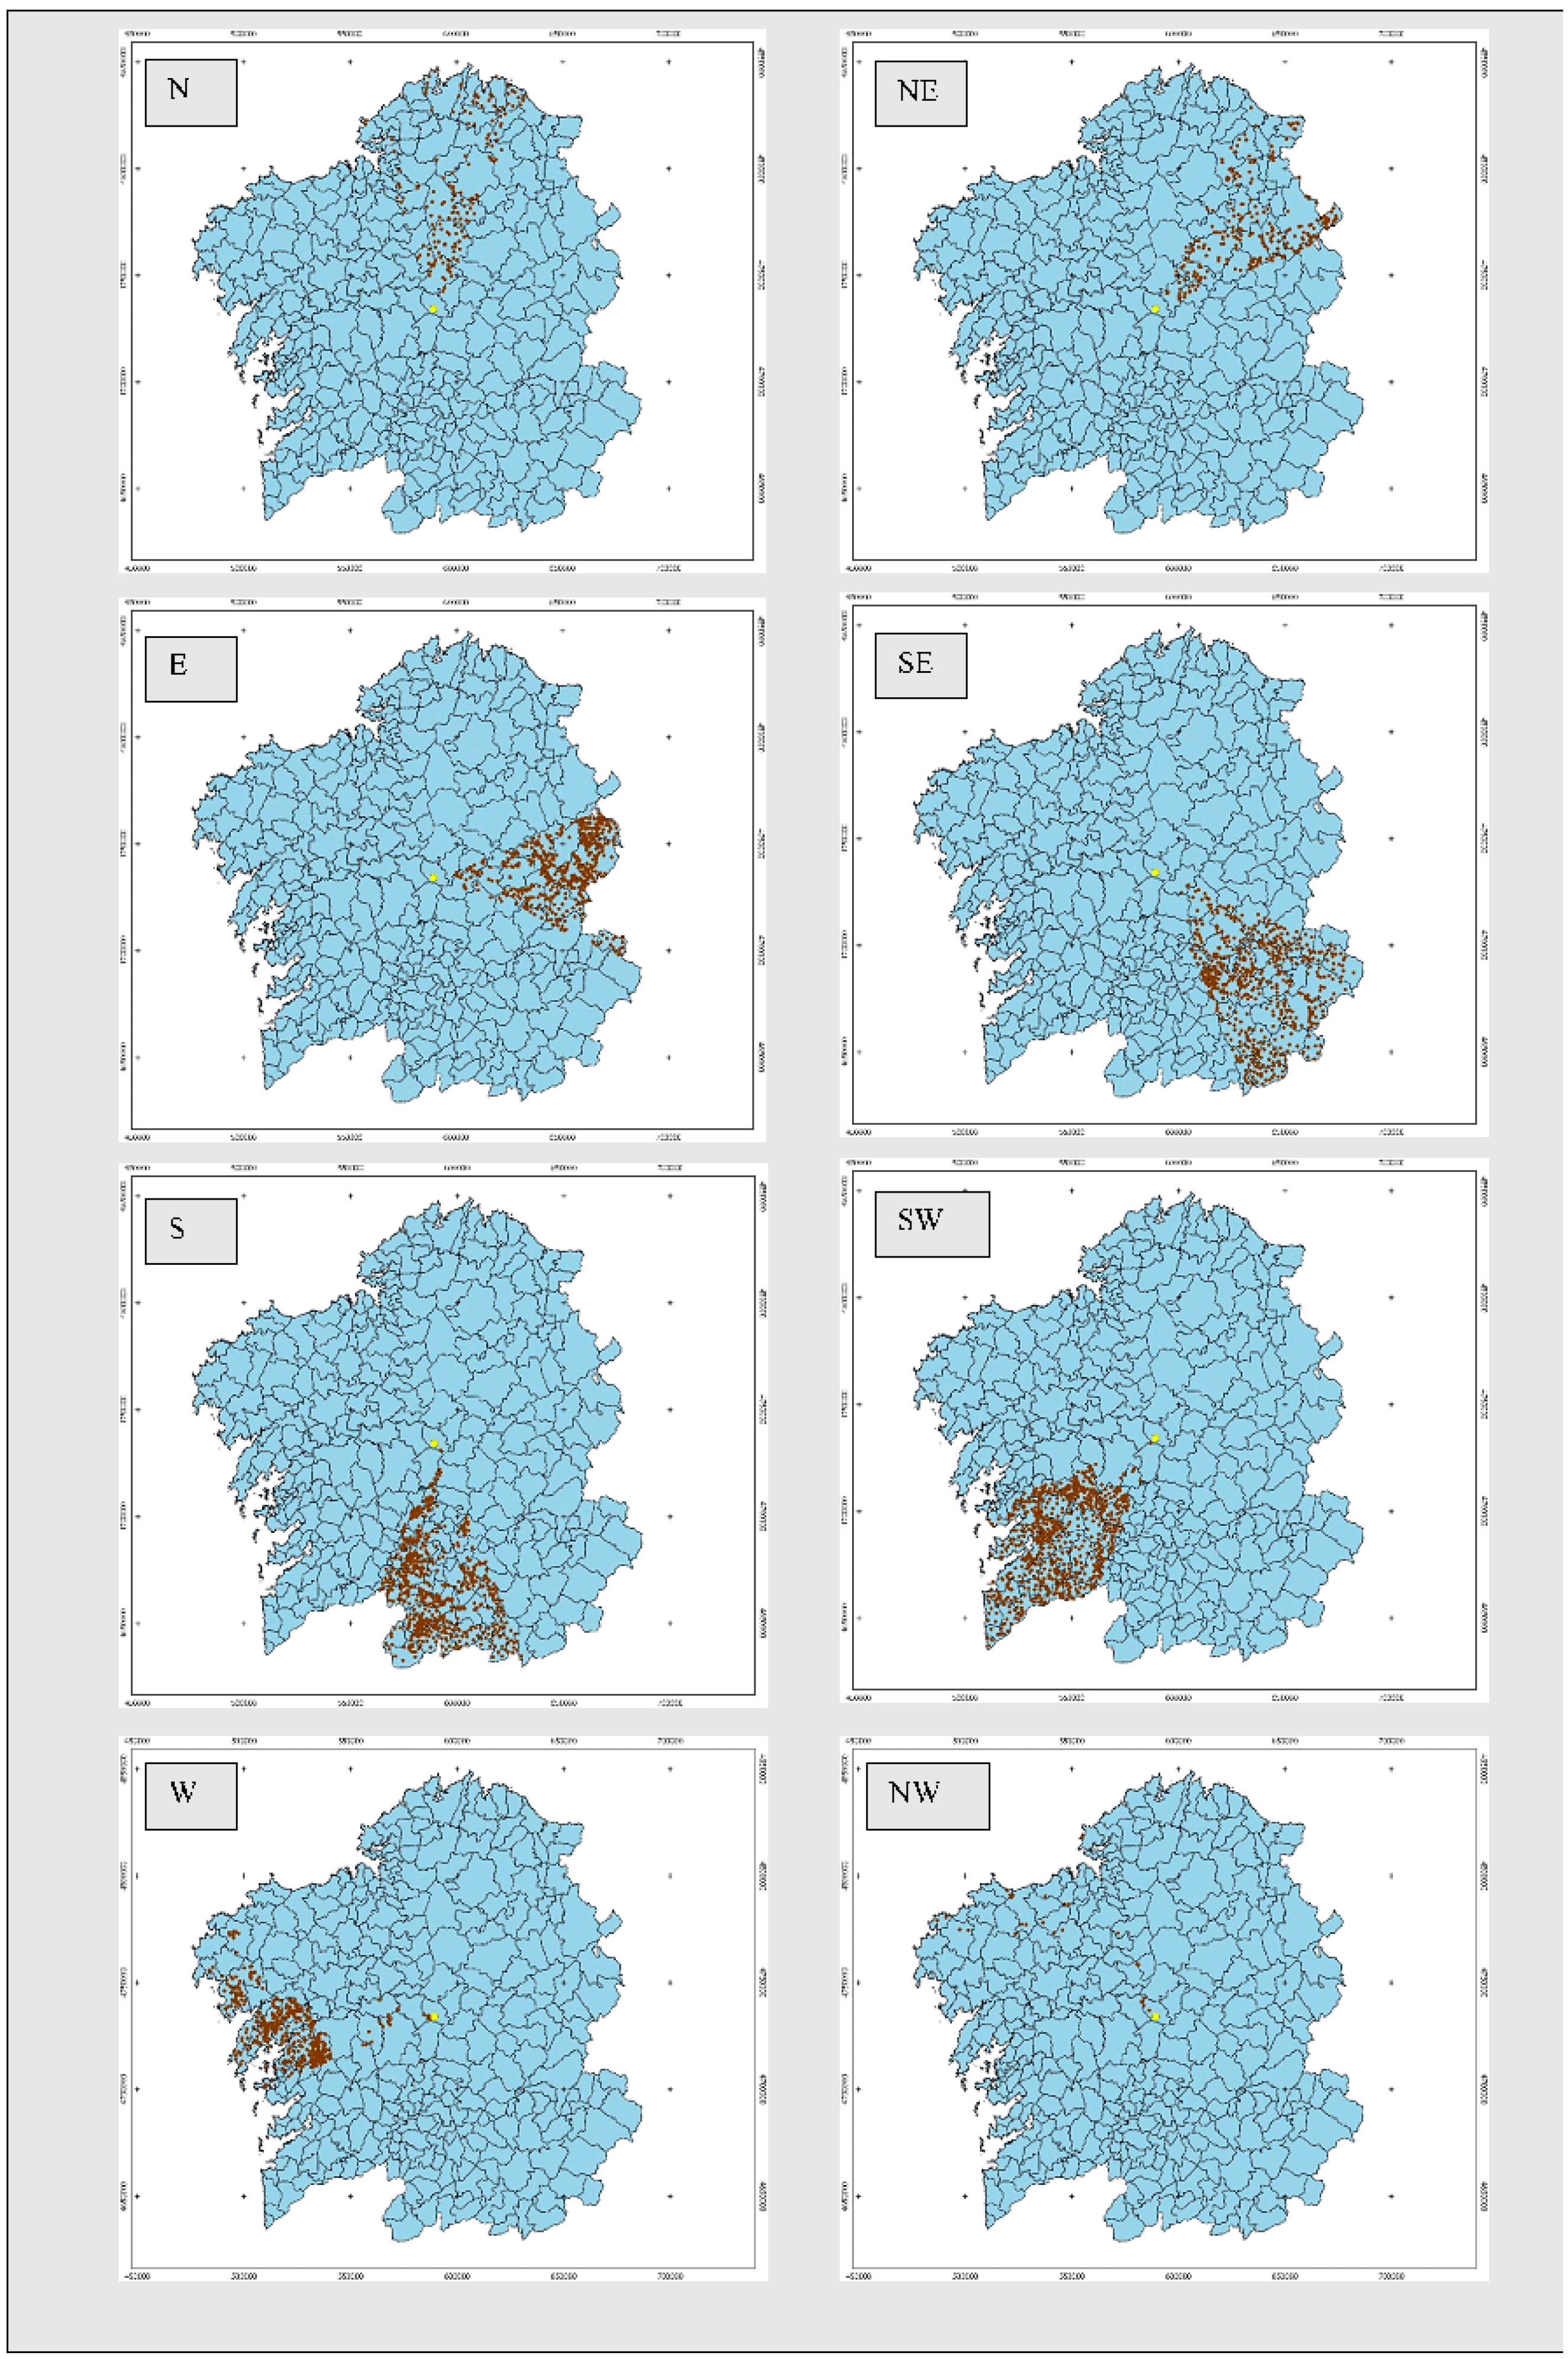
Taking into account the described databases, we designed a chromatic coding that allowed us to detect possible spatial patterns in the occurrence of forest fires. To achieve this, in the first phase, the study area was geographically divided into eight sectors (N, NE, E, SE, S, SW, W, and NW). This division was carried out by taking the geographical centroid of the study area. Since many of the MVMCs may have belonged to two adjacent sectors, the inclusion of each MVMC in its respective sector was done based on its centroid, i.e., each MVMC was included in the sector in which its centroid was located (Table 3 and Figure 1). In addition, the azimuth of the centroid of each MVMC determined the order that MVMC occupied in the chromatic coding. The coding started with the MVMC whose azimuth was closest to 337.5° (N sector) and continued with a dextrorotatory bearing.
The methodological process followed is shown in Figure 2.

2.2. Area of Study and Validation

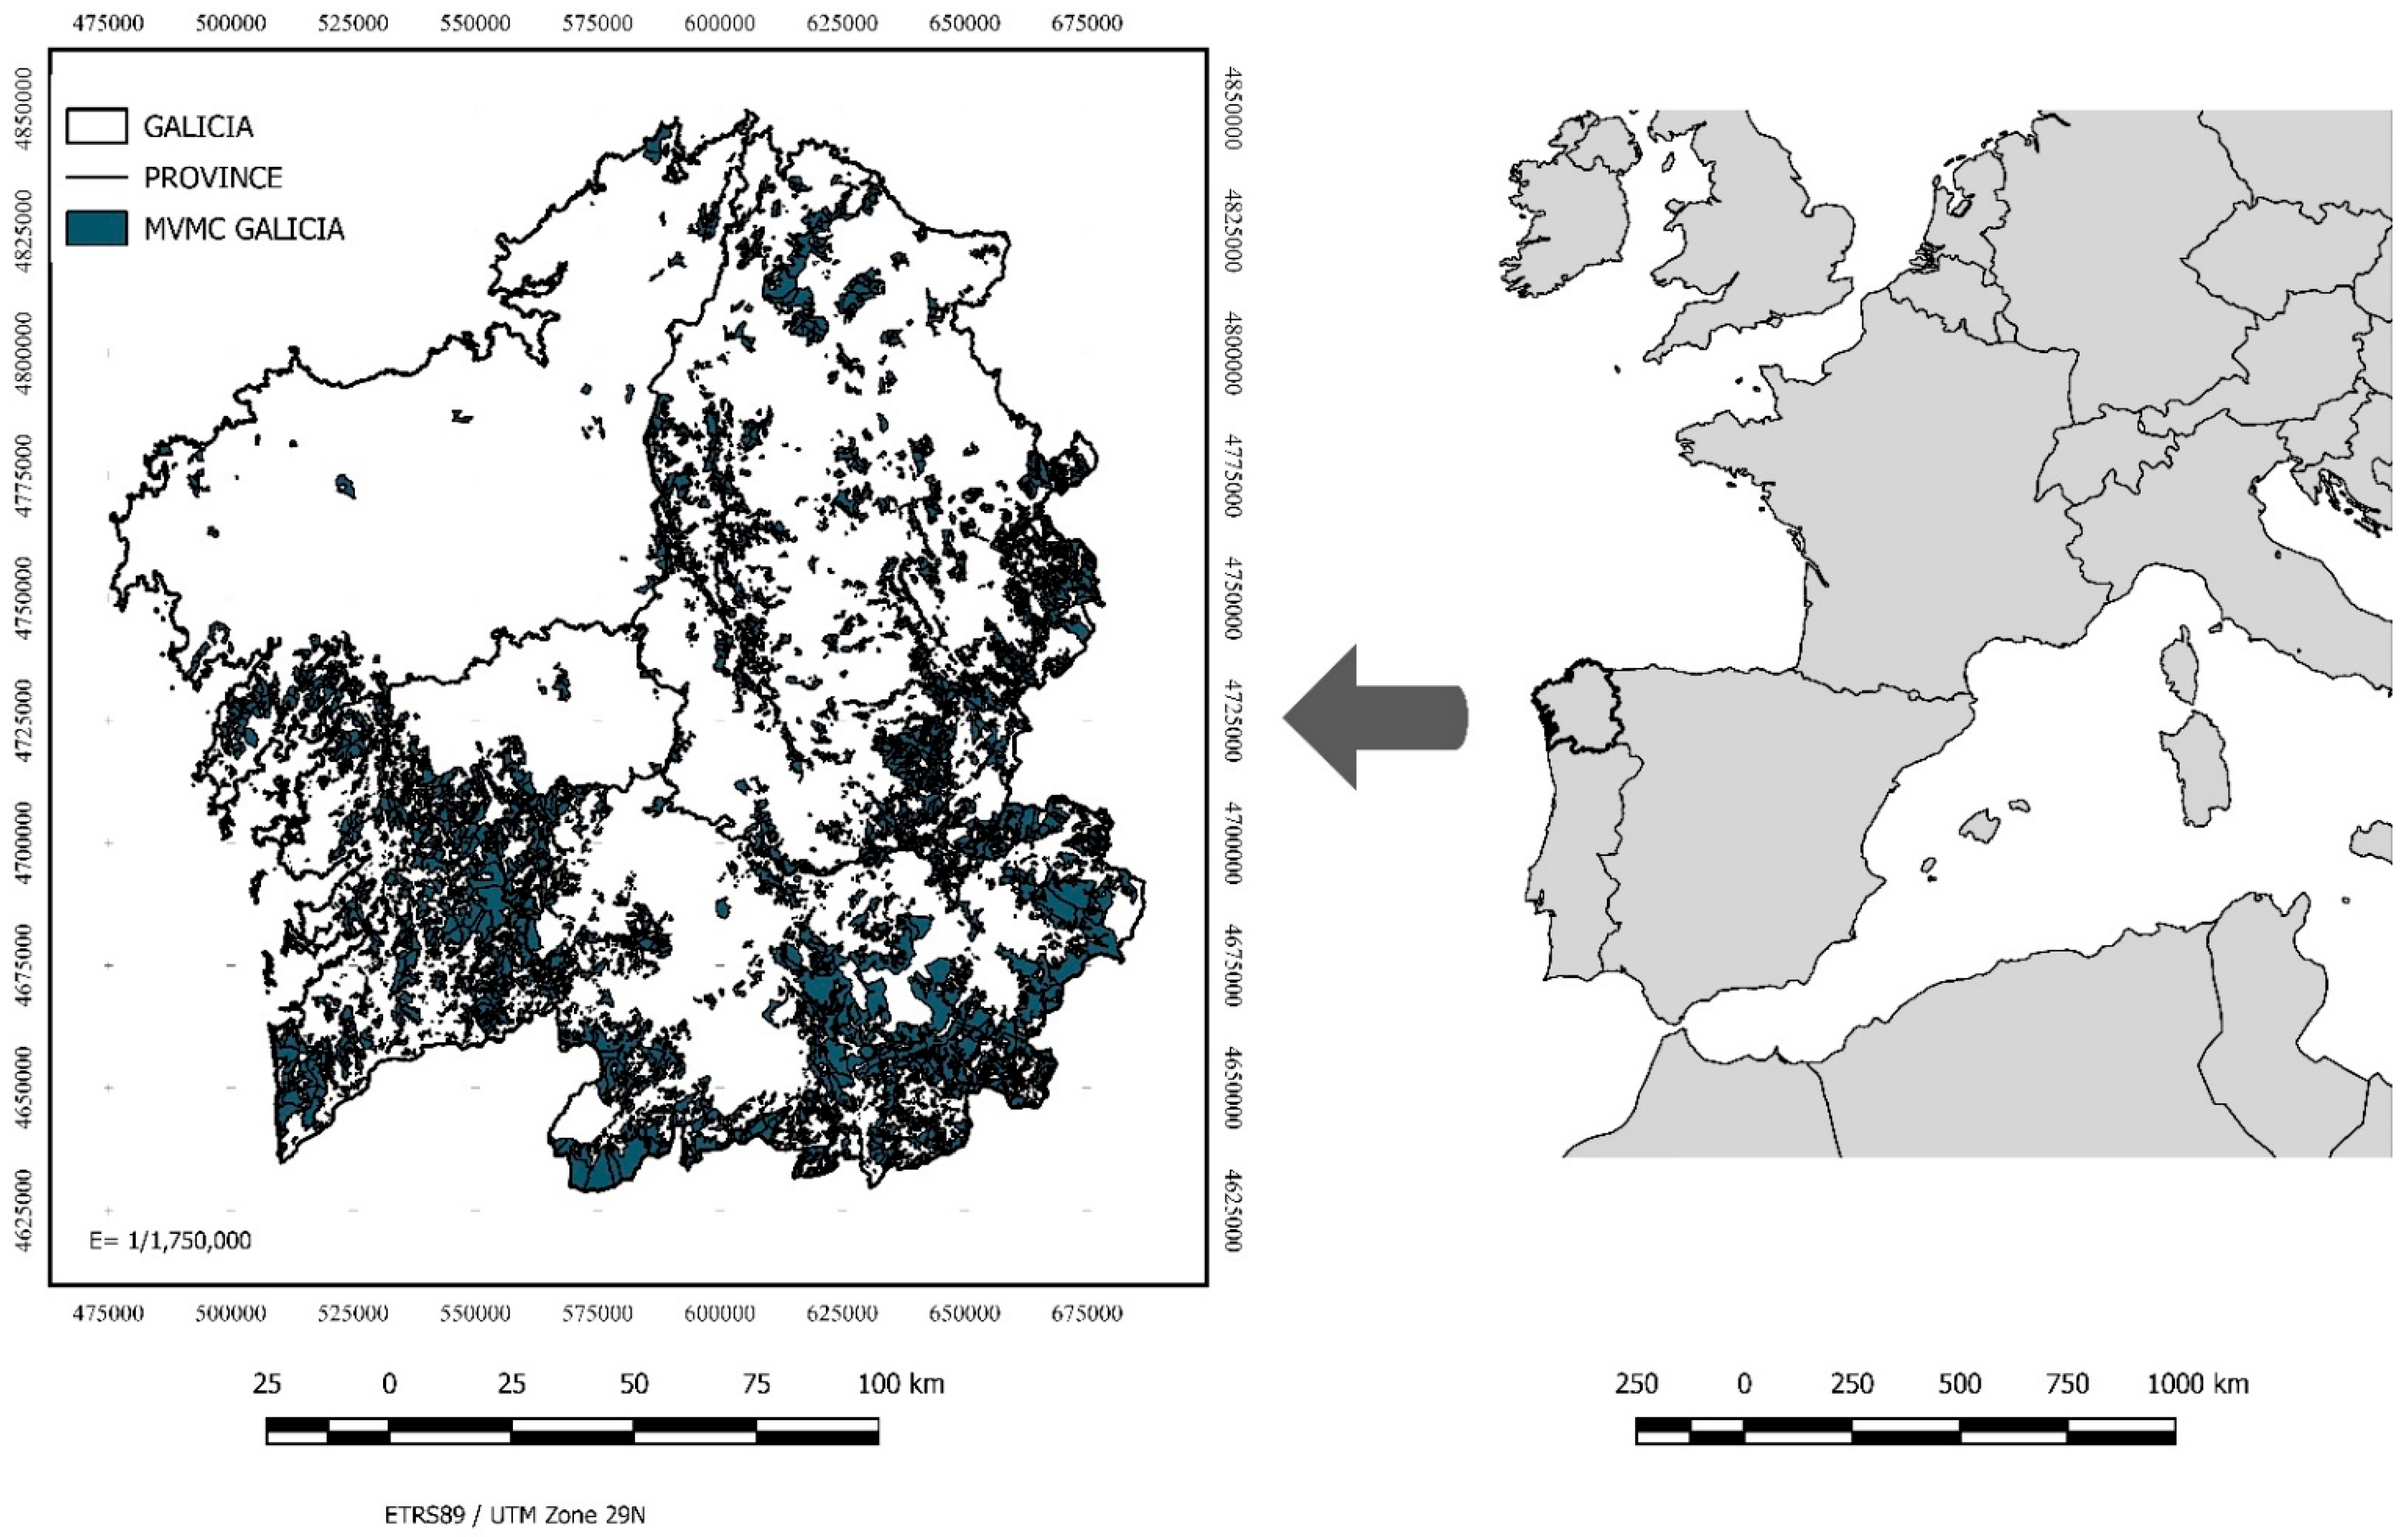
The autonomous community of Galicia (Figure 3) is characterized as a livestock and forestry area of great potential [67,76,77], in which 61% of its territory (1.8 M ha) is forested [78]. It has more than 1.4 M ha of forested land, producing 9.7 million m3 of wood per year, which represents 50% of the annual felling in Spain. The most relevant species in the region are Pinus pinaster Ait., Quercus robur L., and Eucalyptus globulus Labill [78]. Climatologically, Galicia presents great differences between its coastal and inland areas. Average annual rainfall varies between 800 and 1000 mm in inland areas, and 1600 and 1900 in coastal areas. The average annual temperature is 13 °C, with maximum temperatures exceeding 30 °C in the SE of the region, and winters with average minimum temperatures of 5 °C in the interior [62].
Galicia is also the autonomous community most affected by forest fires and the one with the highest rate of human-caused fires [79,80]. It is also characterized by a high density of ignitions, although the area burnt per fire is usually small [81]. In the period 2000/2019, more than 110,000 wildfires occurred in this region, affecting a total area of more than 0.5 M ha, of which 37.35% were forested [82].
Regarding the ownership structure of forest use, approximately 99.5% of Galician woodland is privately owned, and of this, almost 38% is Monte Vecinal en Mano Común (MVMC) [79], a collective private property where the ownership of the woodland is assigned to a group of neighbors (comuneros) [83,84]. The communal neighbors are simultaneously owners and managers of the CMVMs [20,85,86]. According to official statistics, there are 3326 CMVMs in Galicia, with a total area of 663,488.96 ha and an average area of 219.48 ha per CMVM. In 2019, there were 118,564 commoners in Galicia [78].
The database used consisted of newspaper reports, court rulings, and forest fires that occurred in the MVMCs of Galicia during the period from 2000 to 2014, following the method used in previous papers [73,74]. The journalistic news reports were obtained through two main channels: On the one hand, from the website of the Galician Organisation of Neighbourhood Forest Communities in Common Hand [87], where journalistic articles related to the MVMCs are collected, and on the other hand, from the digital newspaper libraries of various media. Only news items referring to conflicts were considered for the calculations, because it was considered that social conflicts underlie the occurrence of forest fires, as specified in the introduction. For the compilation of the court sentences, we carried out an exhaustive reading and analysis of the legal processes related to MVMCs, a method already referred to by Cedeira, A. [88], who highlighted that lawsuits were a very useful source to build a history of the conflict in the Galician rural environment around MVMCs. The documentary source used for the provision of sentences was the legal database called “Tirant on line” [89].
The wildfires, on the other hand, were obtained from the Ministry of Agriculture, Fisheries and Food (MAPA) [90], Government of Spain, whose data table offerred up to 30 variables related to the date of detection, affected areas broken down by plant stratum, and property regime, geographical coordinates of the point of ignition, cause, etc. We only used wildfires whose causes were coded by MAPA as “unknown”, “negligence”, or “intentional”.
Finally, the cartography of the MVMCs was obtained from the Consellería de Medio Rural [91], an organism belonging to the Xunta de Galicia with competencies in the field. This database is made up of 3034 records (MVMC), for which 20 different fields are collected, including the type of management (public or private), administrative division, or surface area.
All this information was organized in spatial databases for processing with geographic information systems and different statistical programs, as detailed in several previous articles [18,68,69,73,74,92].

3. Results

Relevant differences were found between geographical sectors in terms of the distribution of wildfires, press reports, and legal proceedings (Table 4). It was observed, for example, that the highest wildfire rate was in the SW sector (6.92 wildfires/100 ha of MVMC). This ratio was also found to be 3.37 in the SE sector, very similar to that found in the NW sector (3.13), where the area of MVMC was about 43 times lower.
Differences can also be observed in Table 5, which shows the wildfires, newspaper reports, and sentences produced in the MVMCs of Galicia during the period considered which serves as a basis for obtaining the chromatic code. This table shows that the highest number of wildfires (35.3% of the total) occurred in the SW sector, where 50.66% of the news items and 43.11% of the court rulings also took place. These data seem to indicate, at a first approximation, a certain relationship between these variables, since only 21.62% of the MVMCs are included in this sector. However, this supposed relationship seems to be contradicted in the SE sector, where, with a similar number of MVMC (17.66% of the total), 24.25% of the fires occur, and only 4.38% of the newspaper reports or 10.55% of the sentences. At the opposite end of the spectrum are the NW sectors, where, with 0.82% of MVMCs, 0.52% of fires, 1.90% of news items, and 1.79% of sentences are concentrated; and the N sector, where 5.14% of MVMCs, 3.17% of arson, 3.84% of newspaper reports, and 6.98% of sentences are concentrated.
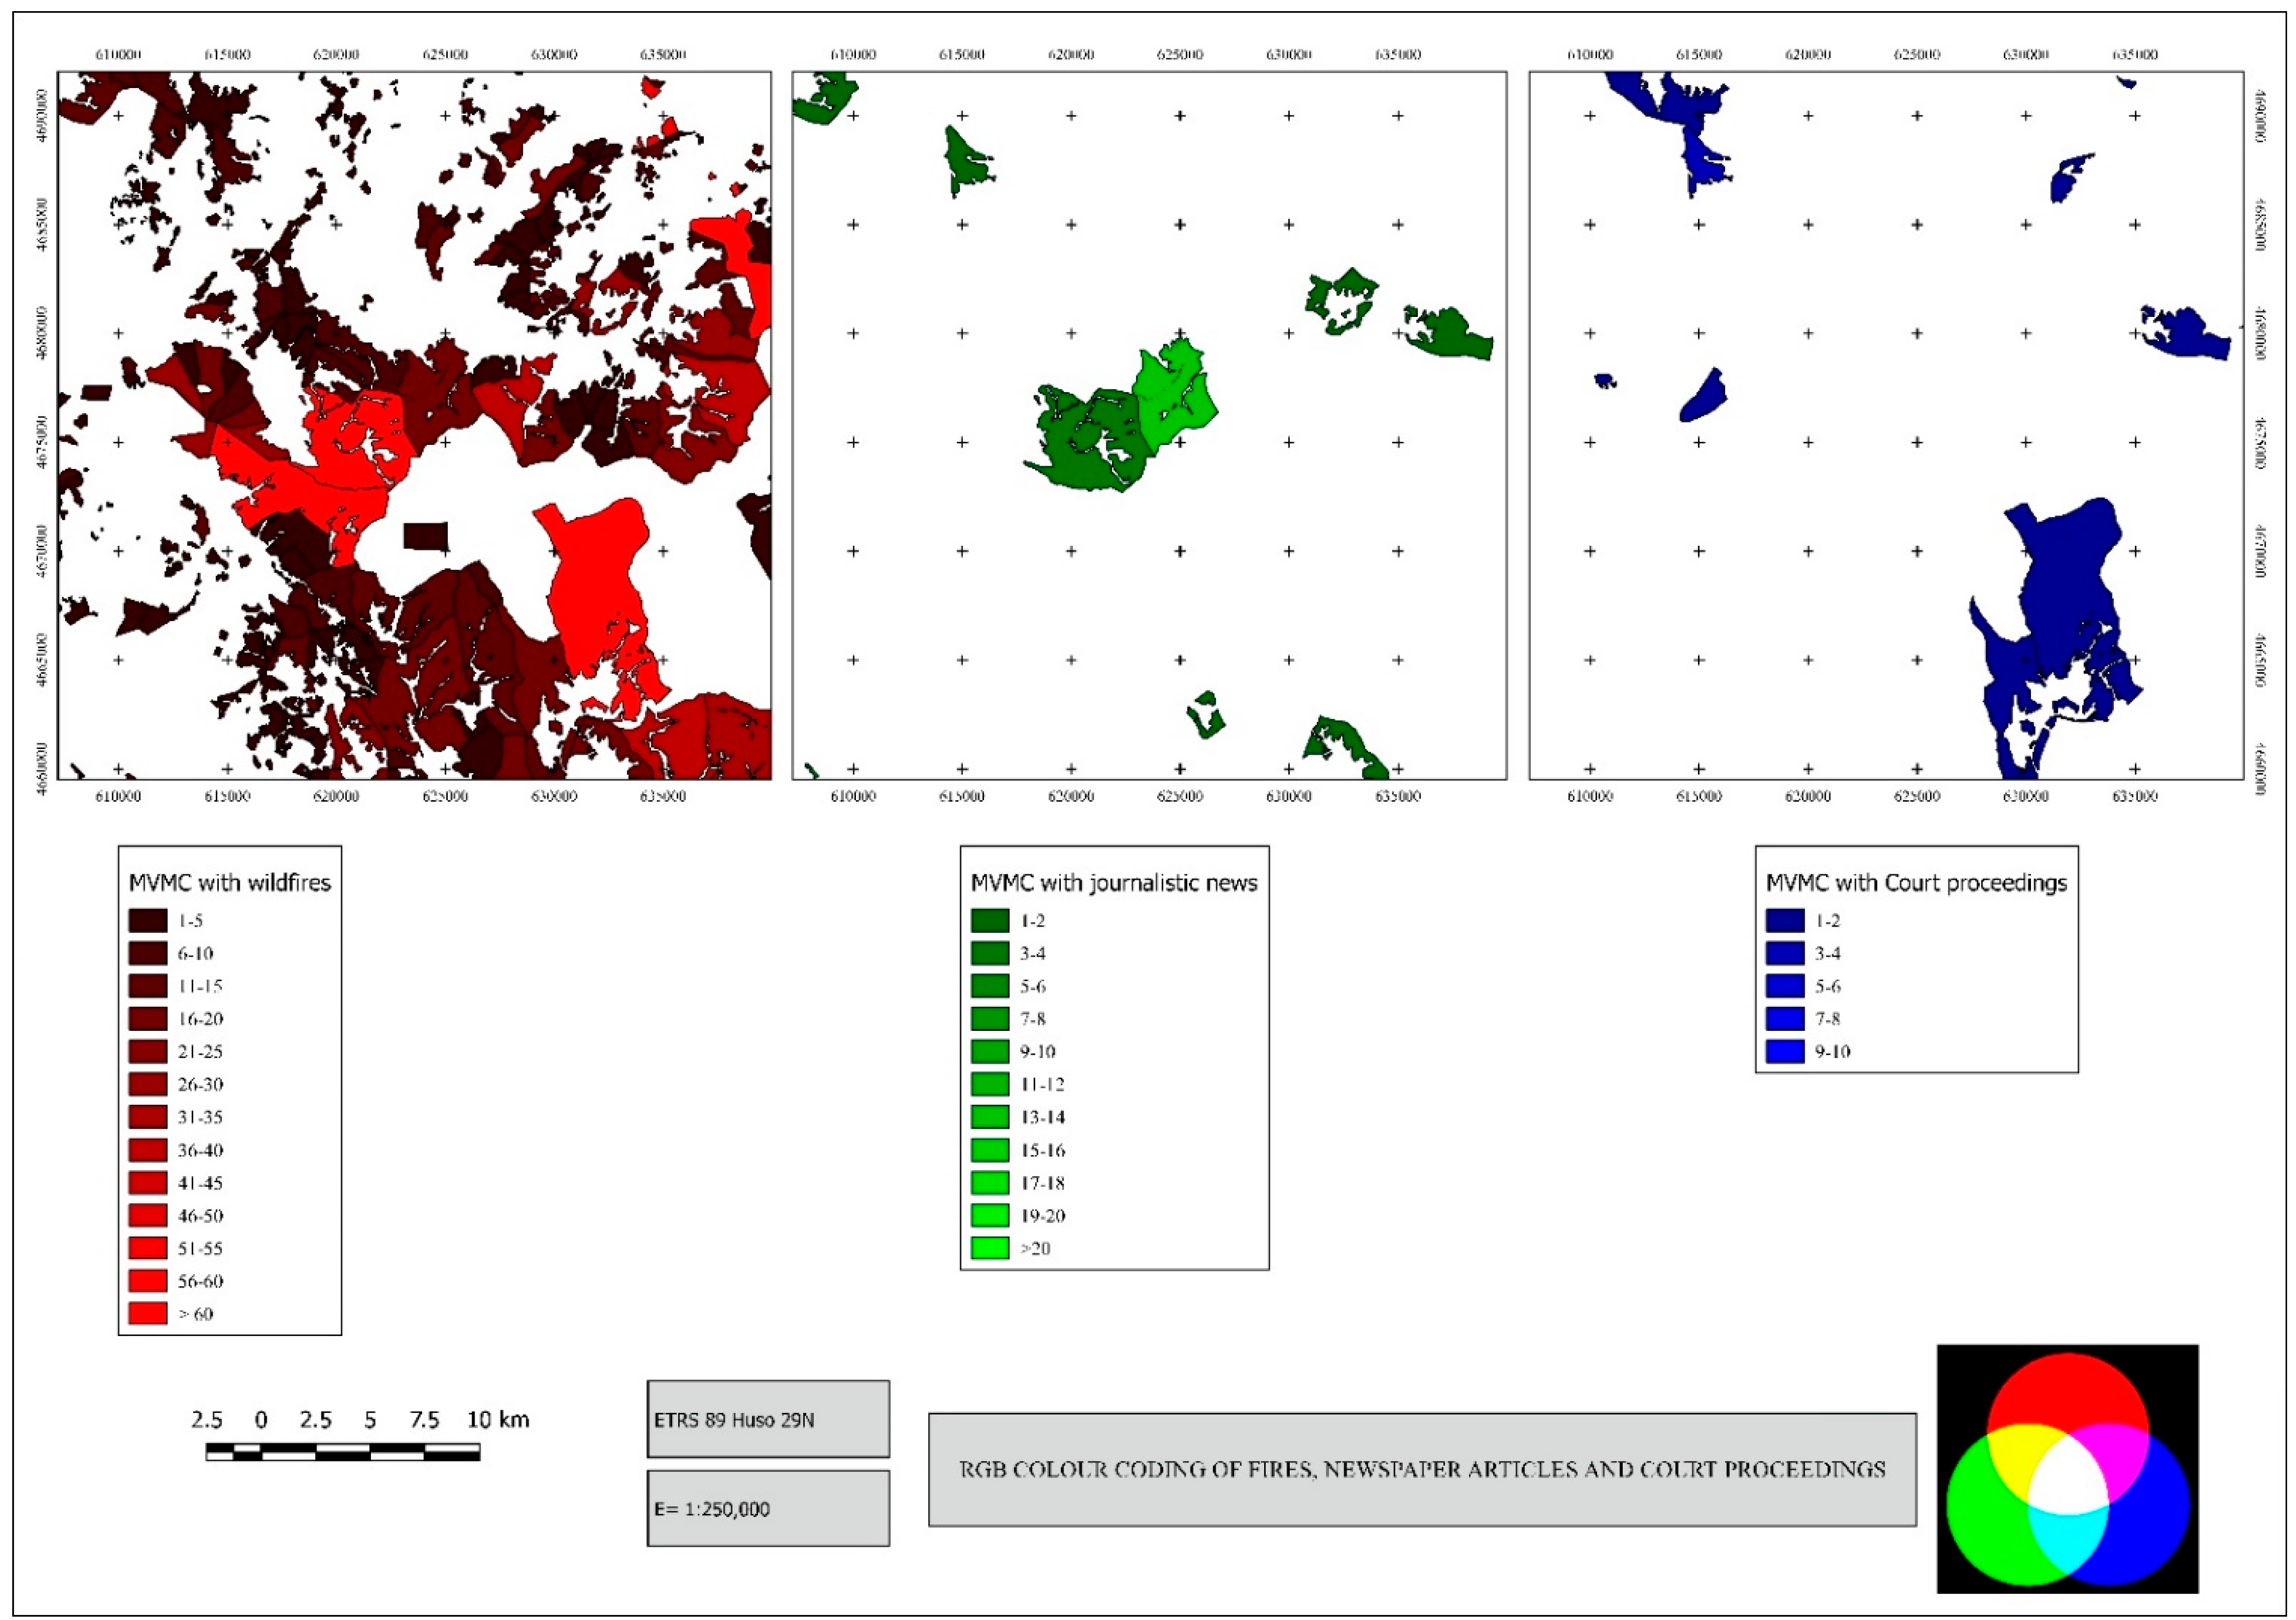
By applying the proposed color coding to the data in Table 1, a color or RGB code is obtained for each MVMC (Figure 4) and year of the historical series.
The number and percentage of white cells that can be seen in each geographical sector of ConForest, whose meaning has already been explained in the Methodology Section, are shown in Table 6. If we understand the expression of conflict as the sum of the percentages of wildfires, newspaper reports, and sentences in each sector, we can see that those in which this sum is greater tend to show a lower percentage of white cells in their representation.
After applying ConForest_RGB to each of the MVMCs, we obtain the colors shown in Table 7, where the frequency of each of the resulting colors is also shown.
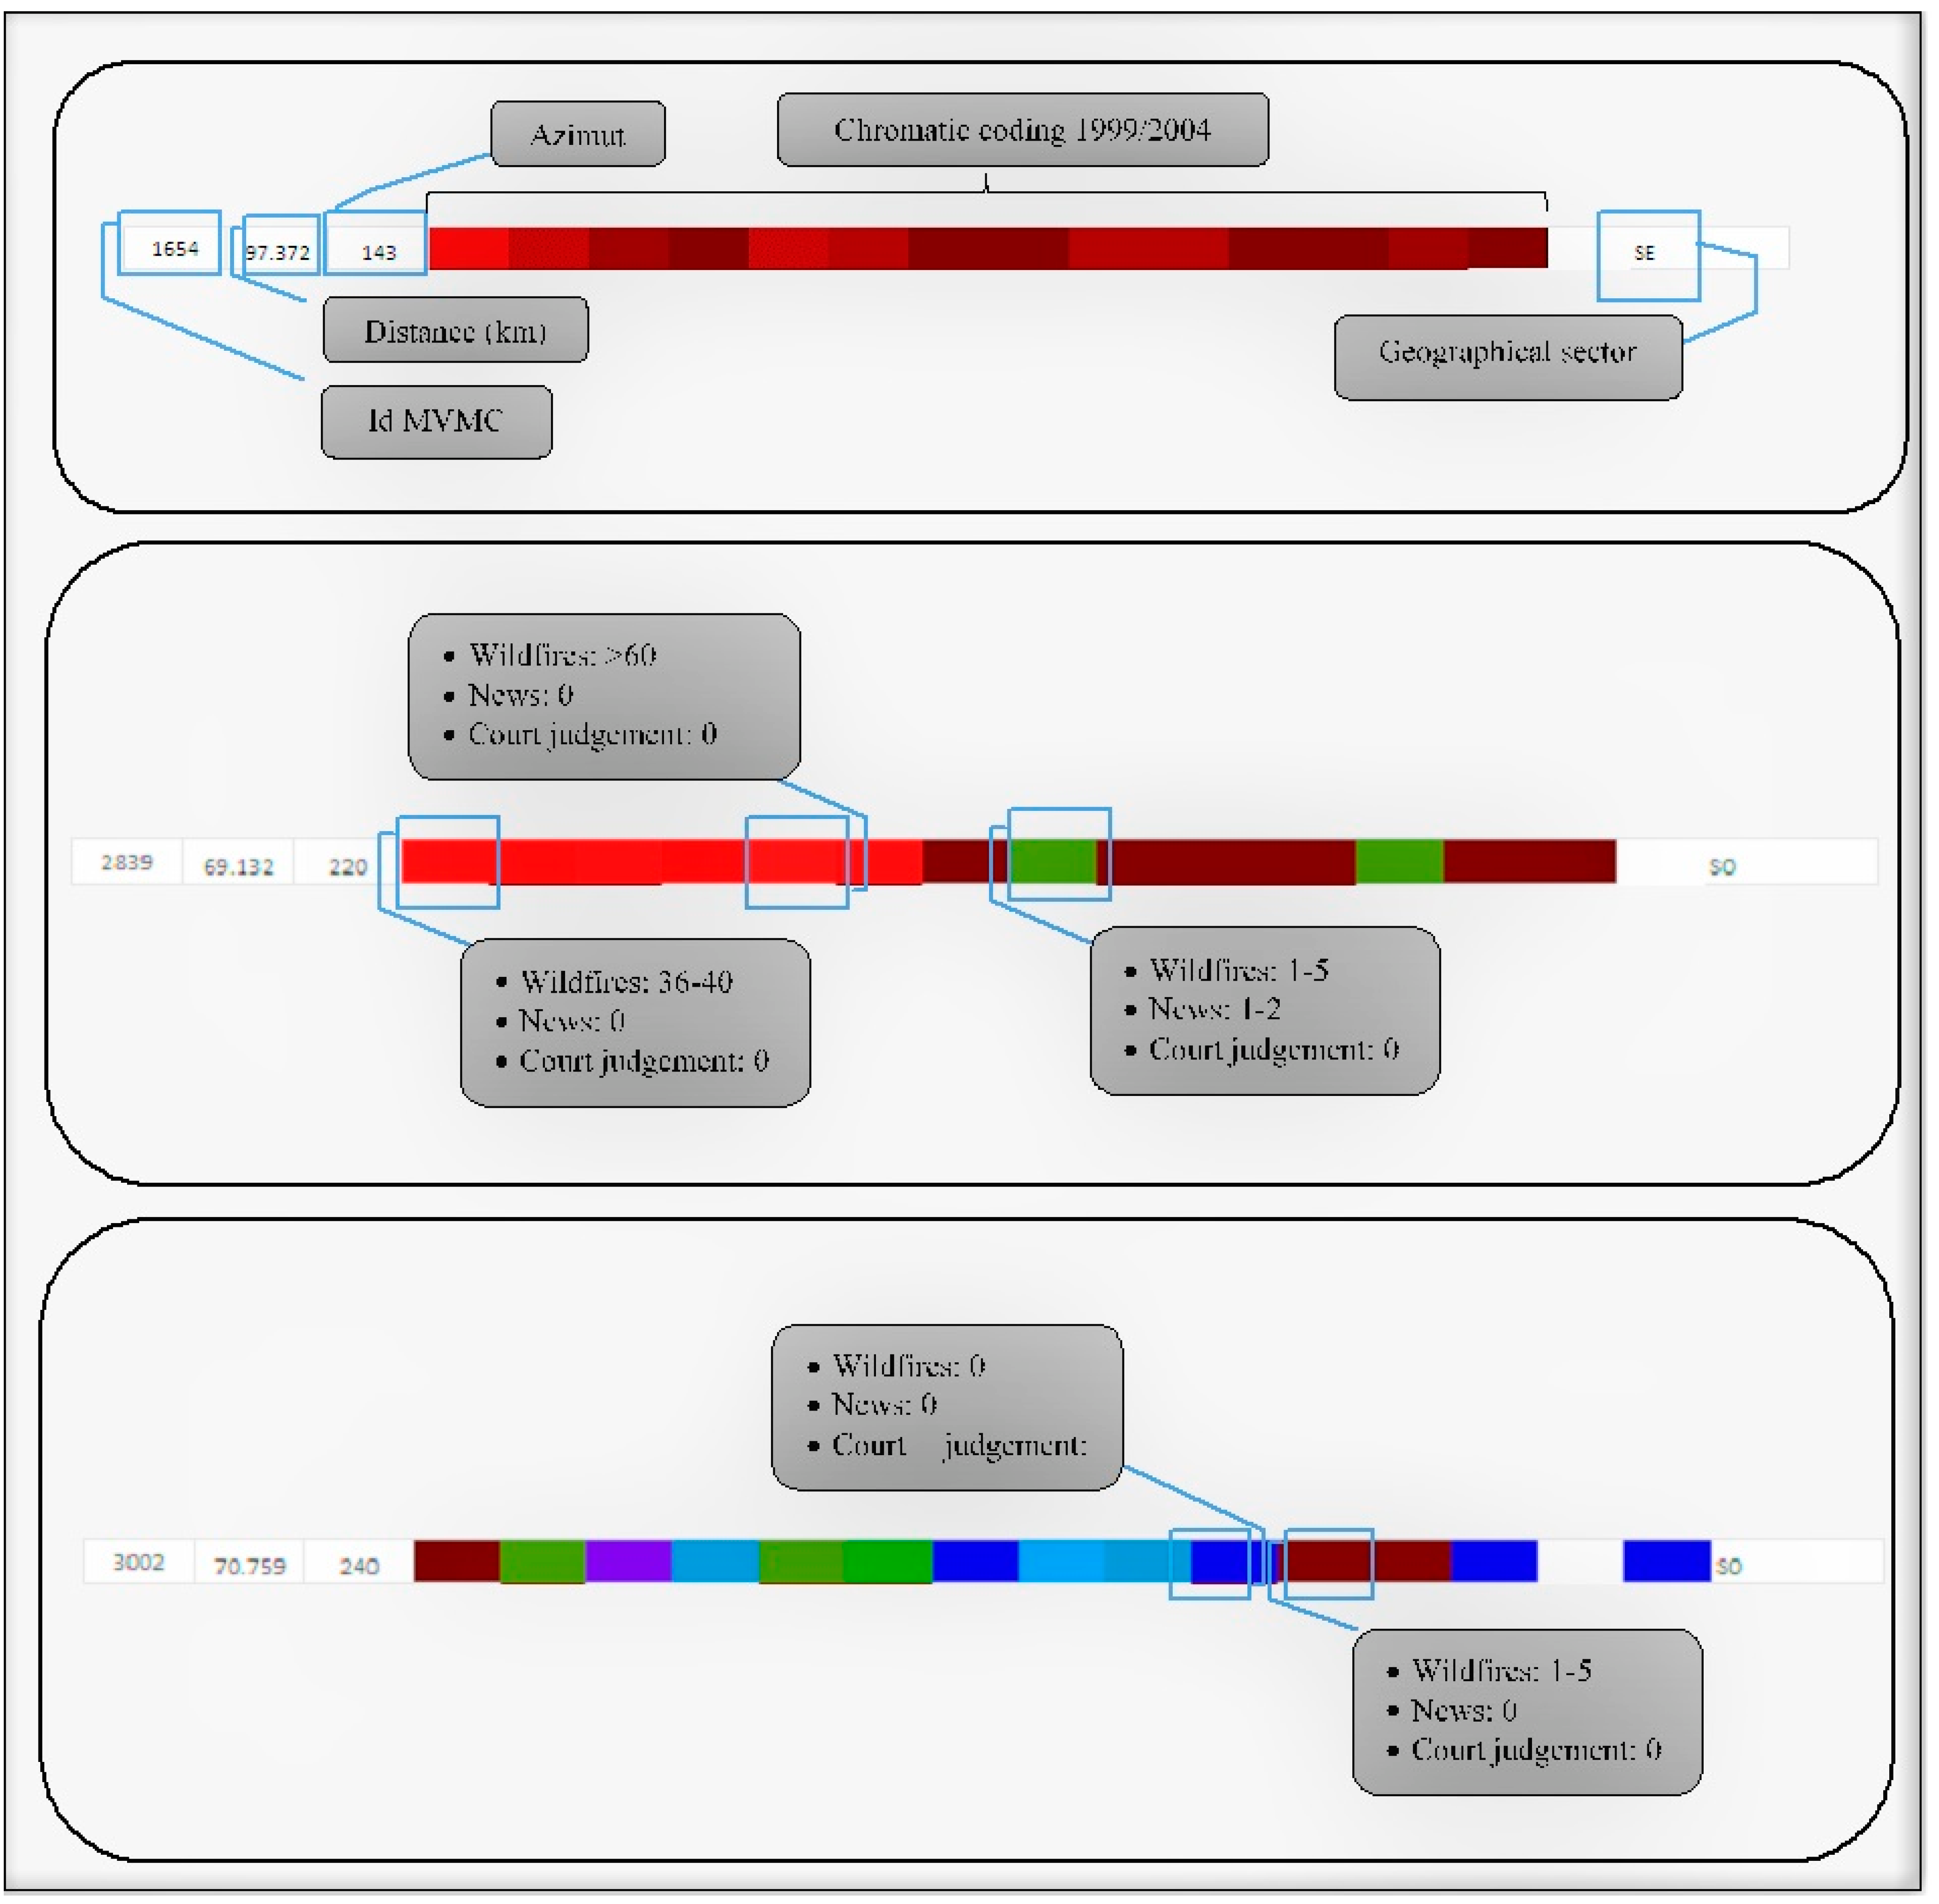
As a final explanation, Figure 5 is provided, which shows three examples of the chromatic coding. For a correct interpretation of the results obtained, it is important to observe the chromatic changes that occur in the coding of a specific MVMC over the years, especially if after the occasional appearance of green and blue colors (newspaper reports and court sentences, respectively), more reddish tones appear (wildfires).
The cartographic representation of ConForest_RGB allows us to detect the existing differences between MVMC in terms of social conflict, as shown in Figure 6, where we have represented several maps to check the evolution of conflict during the study period considered. Due to the scale at which we are forced to represent the map, we prefer to show only a small region of Galicia to facilitate the visibility of the image (in this case a region of the southwest sector). Figure 7 shows the representation of the ConForest_RGB coding for Galicia, as well as a window showing the area represented in the previous figure. In this case it is the coding corresponding to the year 2005.
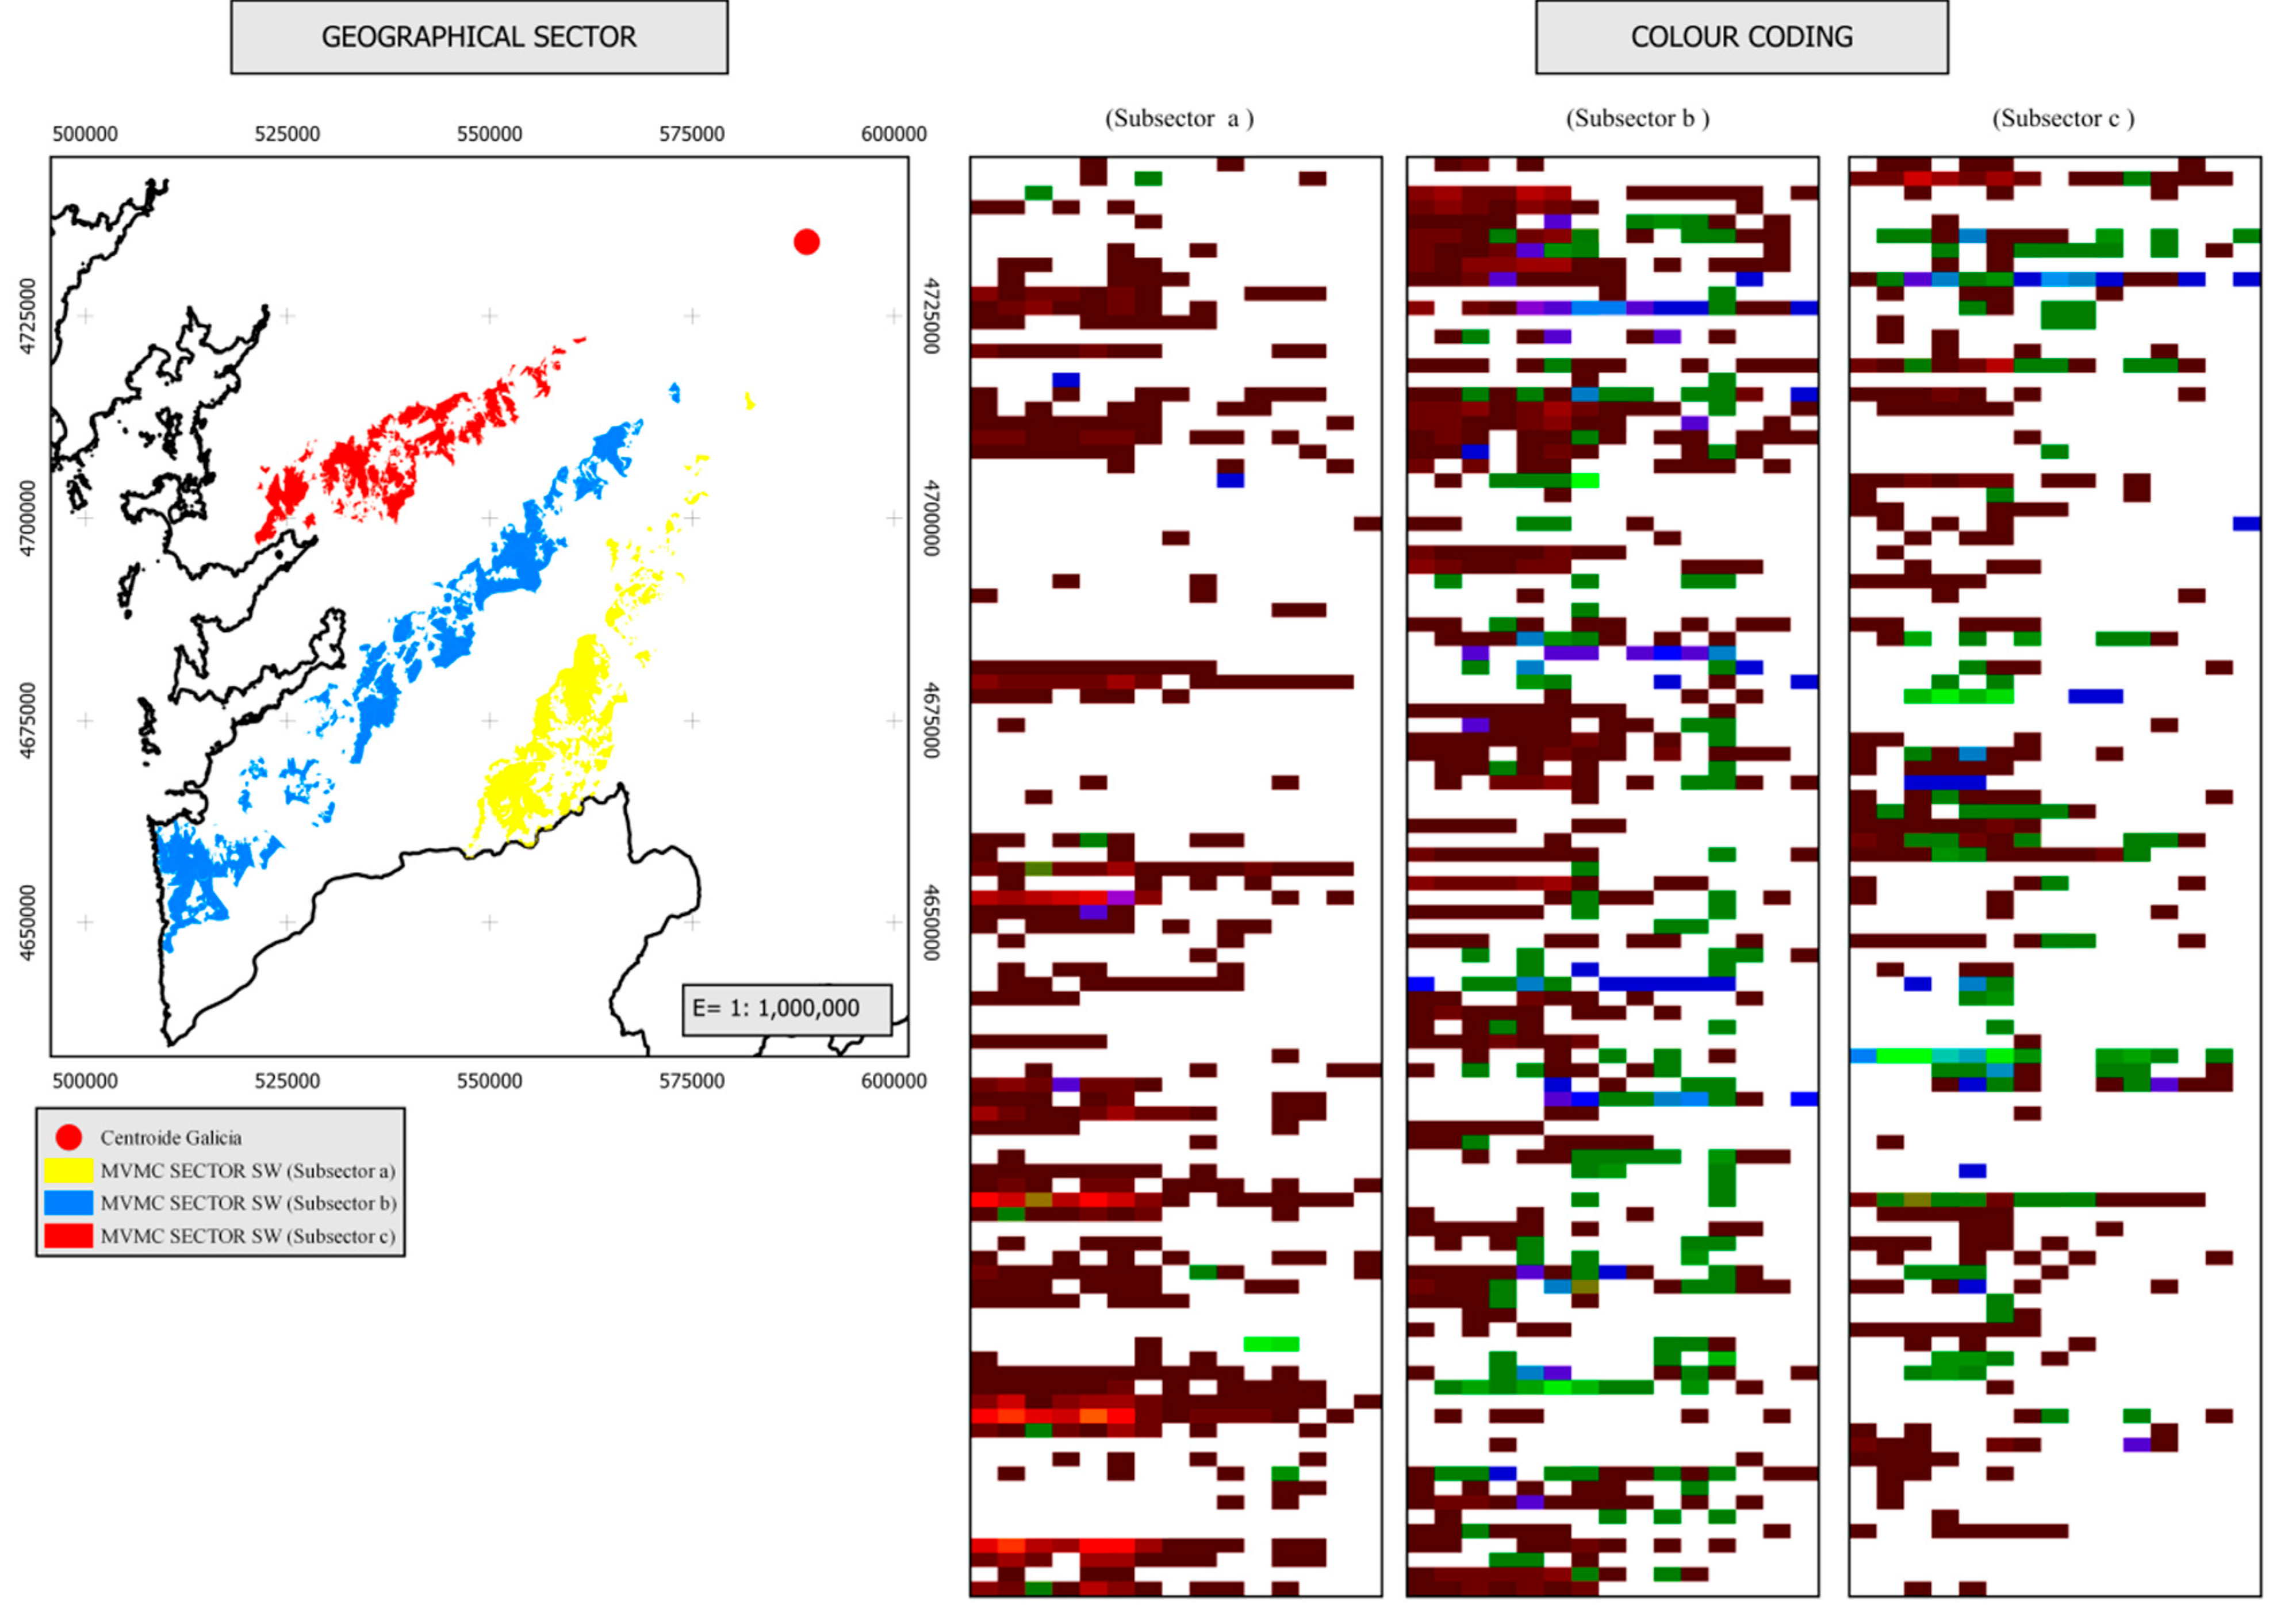
Given the large number of rows that make up the chromatic coding of some geographical sectors (in the SW sector, for example, there are 656 MVMCs, so the coding has the same number of rows) it is not possible to include the final result of the chromatic coding in a single representation. Therefore, we have chosen to show only the individual results of two geographical sectors (Figure 8 and Figure 9). One additional aspect should also be noted. In the sectors depicted in Figure 8 and Figure 9, there are a large number of MVMCs. Therefore, we decided to include in these chromatic codings only 300 MCVMs (45.73% of the existing MVMCs in the southwest sector, and 75.76% of the existing MVMCs in the West sector), divided into three columns of 100 MVMCs each. The first column includes the 100 MVMCs that occupy the first positions in the geographical sector, according to their azimuth. The second column corresponds to the central part of the geographical sector, and the third column includes the last 100 MVMCs of the geographical sector.

4. Discussion

First of all, it must be recognized that the data sources, mainly journalistic reports, may be affected by a significant bias due to the heterogeneity of the study area and, above all, to the demographic differences between coastal and interior areas. In the interior areas, for example (east and southeast geographical sectors, basically), which are much more rural, there is a much lower population density than in the west and southwest sectors. Consequently, the management of MVMCs will also have different objectives, as the negative growth of population density favors short-term approaches, mainly because the economic performance of the MVMC increases substantially in aging communities [18,92]. Moreover, in these geographic sectors with lower population density, it is logical that a smaller number of journalistic news items are produced. This is due, fundamentally, to three aspects: the existence of a smaller number of digital newspapers due to the small population and their level of aging; the limited attention paid by the population in these areas to digital media and the written press; and the limited interest of readers in general in forest communities. However, in areas such as the east and southwest sectors, where there is greater economic activity, higher population density and more urban development, it is logical that there are many more news items and even that CMVMCs are involved in legal proceedings concerning surface rights issues.
We know that the occurrence of forest fires can be related to the occurrence of social conflicts [5,10,11,19,21,34,62]. We also know that conflicts over land ownership and management are the cause of numerous forest fires [18,20,25,31,92,93]. In addition, we also know that an adequate analysis of human-induced forest fires requires a detailed study of social conflict [68]. Consequently, it seems almost obligatory that the predictive models we use in the investigation of human-induced forest fires include, among their predictor variables, those that express this social conflict. Otherwise, we will not know how to interpret reality and it will be impossible to combat the problem. Aware of this, in the preparation of our article, we used newspaper reports and legal proceedings that referred to boundary disputes, assembly disagreements, surface rights, or actions denying easements, for example, because all these reasons can give rise to social conflicts and cause, as a response, numerous forest fires.
Our research team has participated in different proposals related to the prediction and explanation of wildfires [3,24,50,94], in which advanced statistical methodologies have been developed and applied. Experience tells us that there are two important problems, the first of which is the difficulty of integrating those variables related to qualitative aspects related to the conflict. The second is that the visualization and interpretation of the results requires a high level of knowledge of the statistical methodologies applied. That is why we propose this new methodology ConForest_RGB, which we believe contributes to improve these two aspects.
As shown in Figure 6 and Figure 7, ConForest_RGB can also be used in a GIS, in order to check on a map the chromatic variations over the years, which in a way facilitates the visualization of the proposed methodology.
As has been shown, ConForest_RGB allows a visual understanding of the spatial and temporal components of human-induced forest fires. In this aspect, ConForest_RGB satisfies the need for a good knowledge of the spatio-temporal distribution of forest fires, which is crucial for the design of prevention policies adapted to each region [8,95]. This method also allows us to visually understand the social conflict that may have been at the origin of these forest fires, thus, allowing us to understand what type of conflicts are more common in each area. If we understand, for example, that in a certain sector there are more conflicts with public administrations, this helps us to implement specific measures. This can be observed, for example, in the SO and O sectors (Figure 6 and Figure 7), where MVMCs often have numerous legal proceedings due to urban planning issues or with resource exploitation companies.
The proposed model arose as an evolution and consequence of the 15-year experience of the research group to explain, model, and predict forest fires in the Mediterranean area, especially in the region of Galicia, and focused on arson. Different methodologies have been developed and published, some of which are referenced in this paper. Most of these methodologies are based on advanced statistical techniques, which imply that the reader and the forest manager must have significant knowledge of the applied techniques, which implies a difficulty for their transfer and management by forest and territorial managers. However, the experience acquired over the years, during which we have studied forest fires in depth and participated in decision-making in this field, allows us to affirm that ConForest_RGB can facilitate the understanding of this problem and the decision-making of forest managers.
The methodology presented in this work is novel and, in addition, we consider it to be applicable and transferable due to its simplicity in application and interpretation in a quick and visual way, in the same line in which modern statistical methods are advancing. We believe that it can be applied in all regions where wildfires occur as a result of human activity (conflict) that can be associated with a point in the territory (lawsuits, news about conflicts, burnings derived from agricultural activity, etc.), regardless of the type of property where they are applied.

5. Conclusions

The ConForest_RGB methodology is novel and can help in the explanation of forest fires caused by conflict problems. Social conflict can be measured with metrics such as the number of court sentences and press news reports that act as leading or simultaneous indicators of arson fires.
The main advantage of ConForest_RGB is that it is easy to understand. It is basically a visual method, which does not require the application of complex statistical operations to obtain results. It also allows for the detection of differences between the geographical sectors considered, which helps in the implementation of specific prevention policies for each geographical sector. The figures in Appendix A clearly show the differences between geographical sectors.
ConForest_RGB does not demonstrate the existence of a statistical relationship between forest fires, newspaper reports, and court sentences. However, it allows for the detection of differences between geographical sectors and red hots, which is a first step towards the development of a predictive system for the occurrence of forest fires based on the existence of social conflicts.
Despite the above advantages, there are some things that need to be improved in ConForest_RGB. One of these is the categorization of the conflict. In a dispute, the response would depend, to a large extent, on its type of identity, for example, in a land rights dispute the response would be different if a public administration or a commoner who has been excluded from the CMVMC. It is also necessary to assess the bias alluded to above, when mentioning the demographic differences between coastal and inland areas. Moreover, is not easy to examine newspaper archives over a long period of time, it would be necessary to analyze which variables we could use as an expression of social conflict in order to introduce them into ConForest_RGB.
Future works should be oriented to verify the existence of a statistical relationship among forest fires, newspaper reports, and judicial sentences. This would allow the development of a version of ConForest_RGB with predictive capacity.
Author Contributions

Conceptualization, M.F.M.P.; Data curation, G.L.R.; Formal analysis, G.L.R.; Funding acquisition, M.F.M.P.; Investigation, G.L.R. and M.F.M.P.; Software, M.F.M.P.; Supervision, G.L.R.; Writing—review & editing, M.F.M.P. All authors have read and agreed to the published version of the manuscript.

Funding

This work was supported by the project 07MRU035291PR of the Galician Government, Dirección Xeral de Investigación, Desenvolvemento e Innovación.

Institutional Review Board Statement

Not applicable.

Informed Consent Statement

Not applicable.

Data Availability Statement

Not applicable.

Conflicts of Interest

The authors declare no conflict of interest.

References

  1. McLauchlan, K.K.; Higuera, P.E.; Miesel, J.; Rogers, B.M.; Schweitzer, J.; Shuman, J.K.; Tepley, A.J.; Varner, J.M.; Veblen, T.T.; Adalsteinsson, S.A.; et al. Fire as a fundamental ecological process: Research advances and frontiers. J. Ecol. 2020, 108, 2047–2069. [Google Scholar] [CrossRef]
  2. Maillard, O.; Herzog, S.K.; Soria-Auza, R.W.; Vides-Almonacid, R. Impact of Fires on Key Biodiversity Areas (KBAs) and Priority Bird Species for Con0servation in Bolivia. Fire 2022, 5, 4. [Google Scholar] [CrossRef]
  3. Ríos-Pena, L.; Kneib, T.; Cadarso-Suárez, C.; Marey-Pérez, M. Predicting the occurrence of wildfires with binary structured additive regression models. J. Environ. Manag. 2017, 187, 154–165. [Google Scholar] [CrossRef] [PubMed] [Green Version]
  4. Franciosi, C.; Giambelli, M.; Bertran, M.; Martí, G.; Garcia, C.; Hörl, J.; Serra, M.; Hengst-Ehrhart, Y.; Maier, C.; Hartebrodt, C.; et al. Report on Impacts of Climate Change Projections on Wildfires, Floods, Storms, Avalanches, Rockfalls, Landslides and Multi-Hazard Risk Management. Deliverable 3.1. RECIPE Project (Reinforcing Civil Protection Capabilities into Multi Hazard Risk Assess. 874402-UCPM-2019-PP-AG. 2020; p. 223. 2020. Available online: https://recipe.ctfc.cat/results/ (accessed on 1 September 2022).
  5. Boubeta, M.; Lombardía, M.J.; Marey-Pérez, M.; Morales, D. Poisson mixed models for predicting number of fires. Int. J. Wildland Fire 2019, 28, 237–253. [Google Scholar] [CrossRef]
  6. Sayad, Y.O.; Mousannif, H.; Al Moatassime, H. Predictive modeling of wildfires: A new dataset and machine learning approach. Fire Saf. J. 2019, 104, 130–146. [Google Scholar] [CrossRef]
  7. North, M.P.; Stephens, S.L.; Collins, B.M.; Agee, J.K.; Aplet, G.; Franklin, J.F.; Fule, P.Z. Reform forest fire management. Science 2015, 349, 1280–1281. [Google Scholar] [CrossRef]
  8. Turco, M.; Levin, N.; Tessler, N.; Saaroni, H. Recent changes and relations among drought, vegetation and wildfires in the Eastern Mediterranean: The case of Israel. Glob. Planet. Chang. 2017, 151, 28–35. [Google Scholar] [CrossRef]
  9. FAO. Wildfires Prevention in the Mediterranean. 2011. Available online: http://www.fao.org/forestry/40319-06791969d1427714a896b8faeee2aa501.pdf (accessed on 1 September 2022).
  10. Alló, M.; Loureiro, M. Assessing preferences for wildfire prevention policies in Spain. For. Policy Econ. 2020, 115, 102145. [Google Scholar] [CrossRef]
  11. Palaiologou, P.; Ager, A.A.; Nielsen-Pincus, M.; Evers, C.R.; Day, M.A. Social vulnerability to large wildfires in the western USA. Landsc. Urban Plan. 2019, 189, 99–116. [Google Scholar] [CrossRef] [Green Version]
  12. Oliveira, M.; Delerue-Matos, C.; Pereira, M.C.; Morais, S. Environmental Particulate Matter Levels during 2017 Large Forest Fires and Megafires in the Center Region of Portugal: A Public Health Concern? Int. J. Environ. Res. Public Health 2020, 17, 1032. [Google Scholar] [CrossRef]
  13. Paveglio, T.B.; Edgeley, C.M.; Stasiewicz, A.M. Assessing influences on social vulnerability to wildfire using surveys, spatial data and wildfire simulations. J. Environ. Manag. 2018, 213, 425–439. [Google Scholar] [CrossRef]
  14. Hong, H.; Jaafari, A.; Zenner, E.K. Predicting spatial patterns of wildfire susceptibility in the Huichang County, China: An integrated model to analysis of landscape indicators. Ecol. Indic. 2019, 101, 878–891. [Google Scholar] [CrossRef]
  15. Tutmez, B.; Ozdogan, M.G.; Boran, A. Mapping forest fires by nonparametric clustering analysis. J. For. Res. 2018, 29, 177–185. [Google Scholar] [CrossRef]
  16. Oliveira, S.; Félix, F.; Nunes, A.; Lourenço, L.; Laneve, G.; Sebastián-López, A. Mapping wildfire vulnerability in Mediterranean Europe. Testing a stepwise approach for operational purposes. J. Environ. Manag. 2018, 206, 158–169. [Google Scholar] [CrossRef]
  17. Jaafari, A.; Zenner, E.K.; Panahi, M.; Shahabi, H. Hybrid artificial intelligence models based on a neuro-fuzzy system and metaheuristic optimization algorithms for spatial prediction of wildfire probability. Agric. For. Meteorol. 2019, 266, 198–207. [Google Scholar] [CrossRef]
  18. Marey-Pérez, M.F.; Gómez-Vázquez, I.; Díaz-Varela, E. Different approaches to the social vision of communal land management: The case of Galicia (Spain). Span. J. Agric. Res. 2010, 8, 848. [Google Scholar] [CrossRef] [Green Version]
  19. Ganteaume, A.; Camia, A.; Jappiot, M.; San-Miguel-Ayanz, J.; Long-Fournel, M.; Lampin, C. A Review of the Main Driving Factors of Forest Fire Ignition Over Europe. Environ. Manag. 2013, 51, 651–662. [Google Scholar] [CrossRef] [Green Version]
  20. Caballero, G. Community-based forest management institutions in the Galician communal forests: A new institutional approach. For. Policy Econ. 2015, 50, 347–356. [Google Scholar] [CrossRef]
  21. Tedim, F.; Leone, V.; Lovreglio, R.; Xanthopoulos, G.; Chas-Amil, M.-L.; Ganteaume, A.; Efe, R.; Royé, D.; Fuerst-Bjeliš, B.; Nikolov, N.; et al. Forest Fire Causes and Motivations in the Southern and South-Eastern Europe through Experts’ Perception and Applications to Current Policies. Forests 2022, 13, 562. [Google Scholar] [CrossRef]
  22. Krasovskii, A.; Khabarov, N.; Migliavacca, M.; Kraxner, F.; Obersteiner, M. Regional aspects of modelling burned areas in Europe. Int. J. Wildland Fire 2016, 25, 811. [Google Scholar] [CrossRef]
  23. Costafreda-Aumedes, S.; Vega-Garcia, C.; Comas, C. Improving fire season definition by optimized temporal modelling of daily human-caused ignitions. J. Environ. Manag. 2018, 217, 90–99. [Google Scholar] [CrossRef]
  24. Boubeta, M.; Lombardía, M.J.; González-Manteiga, W.; Marey-Pérez, M.F. Burned area prediction with semiparametric models. Int. J. Wildland Fire 2016, 25, 669–678. [Google Scholar] [CrossRef]
  25. Leone, V.; Koutsias, N.; Martínez, J.; Vega-García, C.; Allgöwer, B.; Lovreglio, R. The human factor in fire danger assessment. In Wildland Fire Danger Estimation and Mapping: The Role of Remote Sensing Data; World Scientific: Munich, Germany, 2003; pp. 143–196. [Google Scholar]
  26. Rodrigues, M.; Jiménez, A.; de la Riva, J. Analysis of recent spatial–temporal evolution of human driving factors of wildfires in Spain. Nat. Hazards 2016, 84, 2049–2070. [Google Scholar] [CrossRef] [Green Version]
  27. Vilar, L.; Camia, A.; San-Miguel-Ayanz, J.; Martín, M.P. Modeling temporal changes in human-caused wildfires in Mediterranean Europe based on Land Use-Land Cover interfaces. For. Ecol. Manag. 2016, 378, 68–78. [Google Scholar] [CrossRef]
  28. Molina, C.M.; Martín, L.G. Uso del fuego y régimen de incendios en la provincia de Cáceres. Conclusiones a partir de los datos del Interrogatorio de la Real Audiencia de Extremadura (1790). Estud. Geogr. 2019, 80. [Google Scholar] [CrossRef] [Green Version]
  29. Gómez-González, S.; González, M.E.; Paula, S.; Díaz-Hormazábal, I.; Lara, A.; Delgado-Baquerizo, M. Temperature and agriculture are largely associated with fire activity in Central Chile across different temporal periods. For. Ecol. Manag. 2019, 433, 535–543. [Google Scholar] [CrossRef]
  30. Eugenio, F.C.; dos Santos, A.R.; Pedra, B.D.; Pezzopane, J.E.M.; Mafia, R.G.; Loureiro, E.B.; Martins, L.D.; Saito, N.S. Causal, temporal and spatial statistics of wildfires in areas of planted forests in Brazil. Agric. For. Meteorol. 2019, 266, 157–172. [Google Scholar] [CrossRef]
  31. Parente, J.; Pereira, M.; Amraoui, M.; Tedim, F. Negligent and intentional fires in Portugal: Spatial distribution characterization. Sci. Total Environ. 2018, 624, 424–437. [Google Scholar] [CrossRef] [Green Version]
  32. Martínez, J.; Vega-Garcia, C.; Chuvieco, E. Human-caused wildfire risk rating for prevention planning in Spain. J. Environ. Manag. 2009, 90, 1241–1252. [Google Scholar] [CrossRef]
  33. Moreno, J.M.; Arianoutsou, M.; González-Cabán, A.; Mouillot, F.; Oechel, W.C.; Spano, D.; Thonicke, K.; Vallejo, V.R.; Vélez, R. Forest Fires under Climate, Social and Economic Changes in Europe, the Mediterranean and Other Fire-Affected Areas of the World: FUME: Lessons Learned and Outlook; European Commission: Brussels, Belgium, 2014; 56p, ISBN 978-84-695-9759-0. [Google Scholar]
  34. Loureiro, M.L.; Barreal, J. Modelling spatial patterns and temporal trends of wildfires in Galicia (NW Spain). For. Syst. 2015, 24, e022. [Google Scholar] [CrossRef]
  35. Viedma, O.; Moity, N.; Moreno, J.M. Changes in landscape fire-hazard during the second half of the 20th century: Agriculture abandonment and the changing role of driving factors. Agric. Ecosyst. Environ. 2015, 207, 126–140. [Google Scholar] [CrossRef]
  36. Galiana-Martín, L. Spatial Planning Experiences for Vulnerability Reduction in the Wildland-Urban Interface in Mediterranean European Countries. Eur. Countrys. 2017, 9, 577–593. [Google Scholar] [CrossRef] [Green Version]
  37. Collins, K.M.; Penman, T.D.; Price, O.F. Some Wildfire Ignition Causes Pose More Risk of Destroying Houses than Others. PLoS ONE 2016, 11, e0162083. [Google Scholar] [CrossRef] [PubMed] [Green Version]
  38. Mhawej, M.; Faour, G.; Adjizian-Gerard, J. Establishing the Wildland-Urban interface building risk index (WUIBRI): The case study of Beit-Meri. Urban For. Urban Green. 2017, 24, 175–183. [Google Scholar] [CrossRef]
  39. Clarke, H.; Gibson, R.; Cirulis, B.; Bradstock, R.A.; Penman, T.D. Developing and testing models of the drivers of anthropogenic and lightning-caused wildfire ignitions in south-eastern Australia. J. Environ. Manag. 2019, 235, 34–41. [Google Scholar] [CrossRef]
  40. Farina, A. Principles and Methods in Landscape Ecology; Chapman & Hall: London, UK, 1998; 235p. [Google Scholar]
  41. Grala, K.; Grala, R.K.; Hussain, A.; Cooke, W.H., III; Varner, J.M., III. Impact of human factors on wildfire occurrence in Mississippi, United States. For. Policy Econ. 2017, 81, 38–47. [Google Scholar] [CrossRef]
  42. Wigtil, G.; Hammer, R.B.; Kline, J.D.; Mockrin, M.H.; Stewart, S.I.; Roper, D.; Radeloff, V.C. Places where wildfire potential and social vulnerability coincide in the coterminous United States. Int. J. Wildland Fire 2016, 25, 896–908. [Google Scholar] [CrossRef] [Green Version]
  43. Regos, A.; Brotons, L.; Aquilué, N.; de Cáceres, M. Uso de estrategias oportunistas de extinción para reducir el impacto de los incendios en condiciones climáticas extremas. In Proceedings of the 6th Spanish Forestry Congress, Vitoria-Gasteiz, Spain; Spanish Society of Forestry Sciences, 2013. Available online: https://www.congresoforestal.es/index.php?men=405&idCP=85 (accessed on 1 July 2022).
  44. Fernandes, P.M.; Cruz, M.G. Plant flammability experiments offer limited insight into vegetation–fire dynamics interactions. New Phytol. 2012, 194, 606–609. [Google Scholar] [CrossRef]
  45. Molina, C.M. Comparative assessment of wildland fire legislation and policies in the European Union: Towards a Fire Framework Directive. For. Policy Econ. 2013, 29, 1–6. [Google Scholar] [CrossRef]
  46. Galiana, L.; Aguilar, S.; Lázaro, A. An assessment of the effects of forest-related policies upon wildland fires in the European Union: Applying the subsidiarity principle. For. Policy Econ. 2013, 29, 36–44. [Google Scholar] [CrossRef]
  47. Loepfe, L.; Rodrigo, A.; Lloret, F. Two thresholds determine climatic control of forest-fire size in Europe. Biogeosciences Discuss. 2012, 9, 9065–9089. [Google Scholar]
  48. Gudmundsson, L.; Rego, F.C.; Rocha, M.; Seneviratne, S.I. Predicting above normal wildfire activity in southern Europe as a function of meteorological drought. Environ. Res. Lett. 2014, 9, 084008. [Google Scholar] [CrossRef]
  49. Fusco, E.J.; Abatzoglou, J.T.; Balch, J.K.; Finn, J.T.; Bradley, B.A. Quantifying the human influence on fire ignition across the western USA. Ecol. Appl. 2016, 26, 2390–2401. [Google Scholar] [CrossRef] [Green Version]
  50. Boubeta, M.; Lombardía, M.J.; Marey-Pérez, M.F.; Morales, D. Prediction of forest fires occurrences with area-level Poisson mixed models. J. Environ. Manag. 2015, 154, 151–158. [Google Scholar] [CrossRef]
  51. Zumbrunnen, T.; Menéndez, P.; Bugmann, H.; Conedera, M.; Gimmi, U.; Buergi, M. Human impacts on fire occurrence: A case study of hundred years of forest fires in a dry alpine valley in Switzerland. Reg. Environ. Change 2012, 12, 935–949. [Google Scholar] [CrossRef]
  52. McWethy, D.B.; Pauchard, A.; García, R.A.; Holz, A.; González, M.E.; Veblen, T.T.; Currey, B. Landscape drivers of recent fire activity (2001–2017) in south-central Chile. PLoS ONE 2018, 13, e0201195. [Google Scholar] [CrossRef] [Green Version]
  53. Laura, R.-P.; Carmen, C.-S.; Thomas, K.; Manuel, M.-P. Applying Binary Structured Additive Regression (STAR) for Predicting Wildfire in Galicia, Spain. Procedia Environ. Sci. 2015, 27, 123–126. [Google Scholar] [CrossRef] [Green Version]
  54. Brunsdon, C.; Fotheringham, S.; Charlton, M. Geographically weighted local statistics applied to binary data. In International Conference on Geographic Information Science; Springer: Berlin/Heidelberg, Germany, 2002; pp. 38–50. [Google Scholar]
  55. Show, S.B. Climate and forest fires in northern California. J. For. 1919, 17, 965–979. [Google Scholar]
  56. Gisborne, H.T. Deadwood lying on duff drier tan in air. J. For. 1933, 34, 979–980. [Google Scholar]
  57. Gisborne, H.T. The principles of measuring forest fire danger. J. For. 1936, 34, 786–793. [Google Scholar]
  58. Ordóñez, C.; Saavedra, A.; Rodríguez-Pérez, J.; Castedo-Dorado, F.; Covián, E. Using model-based geostatistics to predict lightning-caused wildfires. Environ. Model. Softw. 2012, 29, 44–50. [Google Scholar] [CrossRef]
  59. Nolan, R.H.; de Dios, V.R.; Boer, M.M.; Caccamo, G.; Goulden, M.L.; Bradstock, R.A. Predicting dead fine fuel moisture at regional scales using vapour pressure deficit from MODIS and gridded weather data. Remote Sens. Environ. 2016, 174, 100–108. [Google Scholar] [CrossRef] [Green Version]
  60. Curt, T.; Frejaville, T.; Lahaye, S. Modelling the spatial patterns of ignition causes and fire regime features in southern France: Implications for fire prevention policy. Int. J. Wildland Fire 2016, 25, 785. [Google Scholar] [CrossRef] [Green Version]
  61. Ganteaume, A.; Guerra, F. Explaining the spatio-seasonal variation of fires by their causes: The case of southeastern France. Appl. Geogr. 2018, 90, 69–81. [Google Scholar] [CrossRef]
  62. Chas-Amil, M.; Prestemon, J.; McClean, C.; Touza, J. Human-ignited wildfire patterns and responses to policy shifts. Appl. Geogr. 2015, 56, 164–176. [Google Scholar] [CrossRef]
  63. Seijo, F.; Millington, J.D.; Gray, R.; Sanz, V.; Lozano, J.; García-Serrano, F.; Sangüesa-Barreda, G.; Camarero, J.J. Forgetting fire: Traditional fire knowledge in two chestnut forest ecosystems of the Iberian Peninsula and its implications for European fire management policy. Land Use Policy 2015, 47, 130–144. [Google Scholar] [CrossRef] [Green Version]
  64. González-Olabarria, J.R.; Mola-Yudego, B.; Coll, L. Different Factors for Different Causes: Analysis of the Spatial Aggregations of Fire Ignitions in Catalonia (Spain). Risk Anal. 2015, 35, 1197–1209. [Google Scholar] [CrossRef] [Green Version]
  65. Oliveira, S.; Moreira, F.; Boca, R.; San-Miguel-Ayanz, J.; Pereira, J.M.C. Assessment of fire selectivity in relation to land cover and topography: A comparison between Southern European countries. Int. J. Wildland Fire 2014, 23, 620–630. [Google Scholar] [CrossRef]
  66. Nunes, A.; Lourenço, L.; Castro-Meira, A. Exploring spatial patterns and drivers of forest fires in Portugal (1980–2014). Sci. Total Environ. 2016, 573, 1190–1202. [Google Scholar] [CrossRef]
  67. Alvarez-Diaz, M.; González-Gómez, M.; Otero-Giraldez, M.S. Detecting the socioeconomic driving forces of the fire catastrophe in NW Spain. Forstwiss. Cent. 2015, 134, 1087–1094. [Google Scholar] [CrossRef]
  68. López-Rodríguez, G.; Rodríguez-Vicente, V.; Marey-Pérez, M. Study of Forest Productivity in the Occurrence of Forest Fires in Galicia (Spain). Sustainability 2021, 13, 8472. [Google Scholar] [CrossRef]
  69. Rodríguez, G.L.; Vicente, V.R.; Pérez, M.F.M. Influence of the Declaration of Protected Natural Areas on the Evolution of Forest Fires in Collective Lands in Galicia (Spain). Forests 2022, 13, 1161. [Google Scholar] [CrossRef]
  70. Ganteaume, A.; Long-Fournel, M. Driving factors of fire density can spatially vary at the local scale in south-eastern France. Int. J. Wildland Fire 2015, 24, 650–664. [Google Scholar] [CrossRef]
  71. Marchal, J.; Cumming, S.G.; McIntire, E.J.B. Exploiting Poisson additivity to predict fire frequency from maps of fire weather and land cover in boreal forests of Québec, Canada. Ecography 2017, 40, 200–209. [Google Scholar] [CrossRef]
  72. Gallardo, M.; Gómez, I.; Vilar, L.; Martínez-Vega, J.; Martín, M.P. Impacts of future land use/land cover on wildfire occurrence in the Madrid region (Spain). Reg. Environ. Change 2016, 16, 1047–1061. [Google Scholar] [CrossRef]
  73. López Rodríguez, G.; Pérez, M.M. Introducción de la conflictividad en el modelo de predicción de incendios forestales para Galicia. In Proceedings of the 7° Congreso Forestal Español: Gestión del Monte: Servicios Ambientales y Bioeconomía, Plasencia, Spain, 26–30 June 2017; Sociedad Española de Ciencias Forestales; p. 11. [Google Scholar]
  74. López Rodríguez, G.; Pérez, M.F.M. Análisis de series de noticias para introducir la conflictividad en el modelo de predicción de incendios forestales para Galicia. Proceedings from the 21th International Congress on Project Engineering, Comunicaciones Presentadas al XXI Congreso Internacional de Ingeniería de Proyectos, Cádiz, Spain, 12–14 July 2017; Asociación Española de Ingeniería de Proyectos (AEIPRO); p. 5. [Google Scholar]
  75. Richardson, D.; Black, A.S.; Irving, D.; Matear, R.J.; Monselesan, D.P.; Risbey, J.S.; Squire, D.T.; Tozer, C.R. Global increase in wildfire potential from compound fire weather and drought. npj Clim. Atmos. Sci. 2022, 5, 23. [Google Scholar] [CrossRef]
  76. Pérez, M.M.; Vicente, V.R.; Maseda, R.C. Using GIS to measure changes in the temporal and spatial dynamics of forestland: Experiences from north-west Spain. For. Int. J. For. Res. 2006, 79, 409–423. [Google Scholar] [CrossRef] [Green Version]
  77. Marey-Pérez, M.F.; Calvo-González, A.; Domínguez-Torres, G. Are the communal forest owners involved in the management of their lands?: A qualitative analysis for the case of Galicia (Spain). Bosque 2014, 35, 207–215. [Google Scholar] [CrossRef] [Green Version]
  78. CMR. Anuario de Estadística Forestal de Galicia 2019; Consellería do Medio Rural, Xunta de Galicia: Santiago de Compostela, Spain, 2020; 120p. [Google Scholar]
  79. Barreiro, J.B.; Hermosilla, T. Socio-geographic analysis of the causes of the 2006’s wildfires in Galicia (Spain). For. Syst. 2013, 22, 497–509. [Google Scholar] [CrossRef] [Green Version]
  80. Barreal, J.; Jannes, G. Spatial and Temporal Wildfire Decomposition as a Tool for Assessment and Planning of an Efficient Forest Policy in Galicia (Spain). Forests 2020, 11, 811. [Google Scholar] [CrossRef]
  81. Vega, J.A.; Arellano-Pérez, S.; Fernández, C.; Fontúrbel, T.; Ruiz, A.D. Os Incendios Forestais do Cambio Global xa Estan Aquí: Un Desafío e Unha Ocasión Para Lograr Unha Resposta Social Consensuada. Dialnet 2021. Available online: http://consellodacultura.gal/mediateca/extras/CCG_2021_Unha-nova-xeracion-de-lumes_49-119.pdf (accessed on 1 February 2022).
  82. PLADIGA. Plan de Prevención e Defensa Contra os Incendios Forestais de Galicia; Consellería do Medio Rural, Xunta de Galicia: Santiago de Compostela, Spain, 2020; 260p. [Google Scholar]
  83. Elands, B.H.; O’Leary, T.N.; Boerwinkel, H.W.; Wiersum, K.F. Forests as a mirror of rural conditions; local views on the role of forests across Europe. For. Policy Econ. 2004, 6, 469–482. [Google Scholar] [CrossRef]
  84. Arenas-Ruiz, S.; Díaz-Balteiro, L.; Rodriguez-Soalleiro, R. Impacto de la fiscalidad en la rentabilidad de plantaciones forestales de particulares y montes vecinales en mano común en Galicia. Inf. Tec. Econ. Agrar. 2020. [Google Scholar] [CrossRef]
  85. Pagdee, A.; Kim, Y.-S.; Daugherty, P.J. What makes community forest management successful: A meta-study from community forests throughout the world. Soc. Nat. Res. 2006, 19, 33–52. [Google Scholar] [CrossRef]
  86. Guadilla-Sáez, S.; Pardo-De-Santayana, M.; Reyes-García, V. Forest commons, traditional community ownership and ecological consequences: Insights from Spain. For. Policy Econ. 2020, 112, 102107. [Google Scholar] [CrossRef]
  87. Organización Galega de Comunidades de Montes Veciñais. Available online: http://www.orgaccmm.gal/ (accessed on 1 January 2017).
  88. Cedeira, A.F. Las fuentes judiciales y gubernativas como recurso para el estudio de la conflictividad social generada en torno a la propiedad forestal gallega durante el siglo XX. In No es País Para Jóvenes; Instituto Valentín Foronda: Vitoria-Gasteiz, Spain, 2012; p. 152. [Google Scholar]
  89. Tirant on Line. Available online: https://www.tirantonline.com/tol/ (accessed on 1 January 2017).
  90. Official Databases of Forest Fires; Ministry of Agriculture, Fisheries and Food, Government of Spain: Palacio de Fomento Madrid, Spain.
  91. Consellería do Medio Rural. Available online: https://mediorural.xunta.gal/es (accessed on 1 February 2022).
  92. GóMez-Vázquez, I.; ÁlvArez-ÁlvArez, P.; MArey-Pérez, M.F. Conflicts as enhancers or barriers to the management of privately owned common land: A method to analyze the role of conflicts on a regional basis. For. Policy Econ. 2009, 11, 617–627. [Google Scholar]
  93. Comas, C.; Costafreda-Aumedes, S.; Vega-Garcia, C. Characterizing configurations of fire ignition points through spatiotemporal point processes. Nat. Hazards Earth Syst. Sci. Discuss. 2014, 2, 2891–2911. [Google Scholar]
  94. Fuentes-Santos, I.; Marey-Pérez, M.F.; González-Manteiga, W. Forest fire spatial pattern analysis in Galicia (NW Spain). J. Environ. Manag. 2013, 128, 30–42. [Google Scholar] [CrossRef]
  95. Urbieta, I.R.; Zavala, G.; Bedia, J.; Gutiérrez, J.M.; Miguel-Ayanz, J.S.; Camia, A.; E Keeley, J.; Moreno, J.M. Fire activity as a function of fire–weather seasonal severity and antecedent climate across spatial scales in southern Europe and Pacific western USA. Environ. Res. Lett. 2015, 10, 114013. [Google Scholar] [CrossRef]
Figure 1. Geographical sectors used in the forest fire analysis, according to values indicated in Table 3. In the NW sector, there are very few MVMCs, so the chromatic coding of this sector will have fewer rows.
Fire 05 00179 g001
Figure 2. Methodological process outline.
Fire 05 00179 g002
Figure 3. Location map with the distribution of the MVMCs (neighboring forests in common ownership) in Galicia.
Fire 05 00179 g003
Figure 4. Cartographic representation of the chromatic code (in this case, of MVMCs located in the southeast sector). The hue of each MVMC varies according to the number of wildfires, newspaper reports, and court sentences that have occurred in that MVMC in a given year. The union of these colors in an RGB code results in a new color, which indicates the number of wildfires, newspaper reports, and sentences that occurred in a MVMC during a given year.
Fire 05 00179 g004
Figure 5. Shows the chromatic coding of three MVMCs, and the wildfires, newspaper reports, and court sentences that occur in certain years. In MVMC 3002, for example (3rd coding), we can see how, in 2009 (box 11), the number of wildfires increases after the sentence of 2008 (box 10).
Fire 05 00179 g005
Figure 6. It shows the temporal evolution, during the period 2000–2014, of the ConForest_RGB chromatic coding. It has been chosen to show only a small region of the southwest sector to increase the visibility of the coding.
Fire 05 00179 g006
Figure 7. ConForest_RGB coding for Galicia (2005), as well as a window showing the area represented in Figure 6.
Fire 05 00179 g007
Figure 8. Sector SW (202.5°–247.5°). In the southernmost MVMCs of the SW sector (Subsector a) there is a higher proportion of forest fires (different shades of red), while in the northernmost MVMCs (Subsector c) there is a higher proportion of newspaper reports (green). In Subsector b, corresponding to the MVMCs in the central zone of the SW sector, the relevance of journalistic news is already much higher than in Subsector a. In the cells corresponding to the last years of the study period, the density of white cells is higher than in the left part of the coding, corresponding to the first years of the study period.
Fire 05 00179 g008
Figure 9. Sector W (247.5°–292.5°). In this case, in the southernmost MVMCs of sector W (Subsector a) there is a lower proportion of forest fires, and even in many of them there is no evidence of the general decrease in fires since 2005. The highest number of fires in this sector is in the central section (Subsector b) and, to a lesser extent, in the northernmost MVMCs (Subsector c). The highest proportion of reports is in the northern section, while in Subsections b and c there is a higher proportion of court proceedings.
Fire 05 00179 g009
Table 1. RGB color code. The color that each cell of the coding acquires depends on the number of wildfires, newspaper reports, and sentences that correspond to that cell (RGB code: R, wildfires; G, news; B, sentences).
WildfiresNewsCourt Sentences
RangeRGBColorRangeRGBColorRangeRGBColor
1 to 5(55,0,0) 1 to 2(0,100,0) 1 to 2(0,0,145)
6 to 10(70,0,0) 3 to 4(0,115,0) 3 to 4(0,0,175)
11 to 15(85,0,0) 5 to 6(0,130,0) 5 to 6(0,0,200)
16 to 20(100,0,0) 7 to 8(0,145,0) 7 to 8(0,0,220)
21 to 25(115,0,0) 9 to 10(0,160,0) 9 to 10(0,0,240)
26 to 30(130,0,0) 11 to 12(0,175,0)
31 to 35(145,0,0) 13 to 14(0,190,0)
36 to 40(160,0,0) 15 to 16(0,205,0)
41 to 45(175,0,0) 17 to 18(0,220,0)
46 to 50(190,0,0) 19 to 20(0,235,0)
51 to 55(205,0,0) >20(0,250,0)
56 to 60(220,0,0)
>60(235,0,0)
Table 2. Resulting colors (RGB code) as a function of the annual number of wildfires, newspaper reports, and court sentences.
RGBWildfiresNewsCourt SentencesRGBWildfiresNewsCourt Sentences
RClassGClassBClassRClassGClassBClass
551 to 51001 to 21451 to 2 11521 to 2525501451 to 2
551 to 51001 to 21753 to 4 11521 to 2525502550
551 to 51001 to 22550 13026 to 301001 to 22550
551 to 51153 to 41451 to 2 13026 to 301153 to 42550
551 to 51153 to 42550 13026 to 3025502550
551 to 51305 to 62550 14531 to 3525502550
551 to 51305 to 62550 16036 to 4025502550
551 to 51457 to 82550 17541 to 4525502550
551 to 51609 to 101451 to 2 19046 to 501001 to 22550
551 to 517511 to 122550 19046 to 5025502550
551 to 519013 to 142550 20551 to 5525502550
551 to 520515 to 162550 25501001 to 22550
551 to 522017 to 182550 235>6025502550
551 to 525501451 to 2 25501001 to 21451 to 2
551 to 525501753 to 4 25501001 to 21753 to 4
551 to 525502005 to 6 25501001 to 22550
551 to 525502550 25501153 to 41451 to 2
706 to 101001 to 21753 to 4 25501153 to 41753 to 4
706 to 101001 to 22550 25501153 to 42550
706 to 101457 to 81451 to 2 25501305 to 61451 to 2
706 to 101153 to 41753 to 4 25501305 to 61753 to 4
706 to 101153 to 42550 25501305 to 62550
706 to 101305 to 62550 25501457 to 82550
706 to 101609 to 102550 25501609 to 101451 to 2
706 to 1025501451 to 2 25501609 to 102550
706 to 1025502550 255017511 to 122550
8511 to 151001 to 22550 255019013 to 142550
8511 to 151153 to 42550 255020515 to 162550
8511 to 151305 to 62550 255022017 to 182550
8511 to 1525501451 to 2 255023519 to 202550
8511 to 1525502550 2550250>202550
10016 a 201001 a 21451 a 2 255025501451 a 2
10016 a 201001 a 22550 255025501753 a 4
10016 a 2025501451 a 2 255025502207 a 8
10016 a 2025502550 255025502409 a 10
11521 a 251001 a 22550 255025502550
Table 3. Geographical sectors and amplitude of each one of them (sexagesimal degrees).
SectorAzimutSectorAzimut
N337.5°–22.5°S157.5°–202.5°
NE22.5°–67.5°SW202.5°–247.5°
E67.5°–112.5°W247.5°–292.5°
SE112.5°–157.5°NW292.5°–337.5°
Table 4. Distribution of wildfires, newspaper reports, and court sentences by geographical sectors, as well as the percentage of MVMC area represented by each geographic sector (% area) and the wildfire rate (fires/100 ha) by geographic sector.
ConceptNNEESESSWWNWTotal
MVMC156234441536590656396253034
Average area of MVMC357.22193.24190.28354.30155.03205.51122.45174.61215.52
MVMC with wildfires121144319453417504265162239
% MVMC with wildfires77.5661.5472.3484.5170.6876.8366.9264.0073.80
MVMC with News56641051169027918114905
News26816621731525324621290545025
News on conflict9396731061401227641462422
% News on conflict3.84 3.96 3.01 4.38 5.78 50.66 26.47 1.90 100.00
MVMC with News on conflict353335475122313311568
MVMC with court sentences252622362197654296
Court sentences39293559472419910559
% court sentences6.985.196.2610.558.4143.1117.711.79100.00
Wildfires8375461200641249519338302213726,443
% Wildfires3.172.064.5424.2518.7235.3111.430.52100.00
% area.8.526.9212.8329.0413.9920.627.420.67100.00
Fires/100 has1.5011.2071.4303.3765.4126.9266.2323.1384.043
Table 5. Wildfires (Wf), news (N), and court sentences (CS) produced in Galician MVMCs during the period analyzed (2000–2014), according to geographic sectors.
Orient.200020012002200320042005200620072008200920102011201220132014Total%
NWf1226181124113102602511271646251778373.17
N0061279101513280515933.84
CS102233524424223396.98
NEWf744244883358461614161936332345462.06
N0039601127121135702963.96
CS0000412232012201295.19
EWf2271471471641188766293726304935241412004.54
N00342315237573100733.01
CS000656421142400356.26
SEWf101363561559261281529030731131424031418212250641224.25
N005131691518812610121064.38
CS02466410125382155910.55
SWf8286276373895586392411681741561321991027823495118.72
N011123252183570098101405.78
CS110632575350324478.41
SWWf1151121311668841410156067022818917815322313714234933835.31
N057511513217312910773435211619584122750.66
CS21021420361915252222151714824143.11
WWf2875713852694004323615625253659305927302211.43
N12638982791116348172430206664126.47
CS510131214121249520379917.71
NWWf714131532208615933101370.52
N003599314421122461.90
CS120112010010001101.79
Table 6. Total conflict in each sector. This expression of conflict is obtained by adding the percentages of wildfires, newspaper reports, and court sentences that occur in each sector.
ConceptNNEESESSWWNW
N° of MVMC15623444153659065639625
N° de cells2340351066158040885098405940375
Number of white cells1802304257175617681567374614287
% White cells77.01%86.67%86.42%69.86%77.01%68.47%77.68%76.53%
Sum of conflict13.99%11.21%13.81%39.18%32.91%129.08%55.61%4.21%
Table 7. Number of cells of each color in each of the geographical sectors.
ColorNNEESESSOONOColorNNEESESSOONO
1802304257175617681567374614287 00000010
42538379820561752201385251 00000300
423842342926016115 00000100
212527241580454 00000420
15311178143241612 00000100
115101726126676 00000210
704241345162 00000100
5902347184 000751410
3102324140 00010100
301462155180 00000010
20000500 00042820
10001110 00010500
10116103831 00021620
123201392 00001300
10001520 00000100
00001960 00000200
00000100 00000200
00010120 00000200
00020530 00000110
00011520 00000200
00000100 00000111
00000100 00000100
00000100 00001210
00001010 00000010
00000010 020101220
00002300 00000100
00000100 00000120
00000100 00100300
0001122100 00000400
00000010 00000100
00000010 00000100
00000530 00000200
00000120 00000010
00001000 00000100
00010260 00000100
00000020
Publisher’s Note: MDPI stays neutral with regard to jurisdictional claims in published maps and institutional affiliations.