
Double-Differenced dNBR: Combining MODIS and Landsat Imagery to Map Fine-Grained Fire MOSAICS in Lowland Eucalyptus Savanna in Kakadu National Park, Northern Australia


Abstract
:1. Introduction
2. Methods
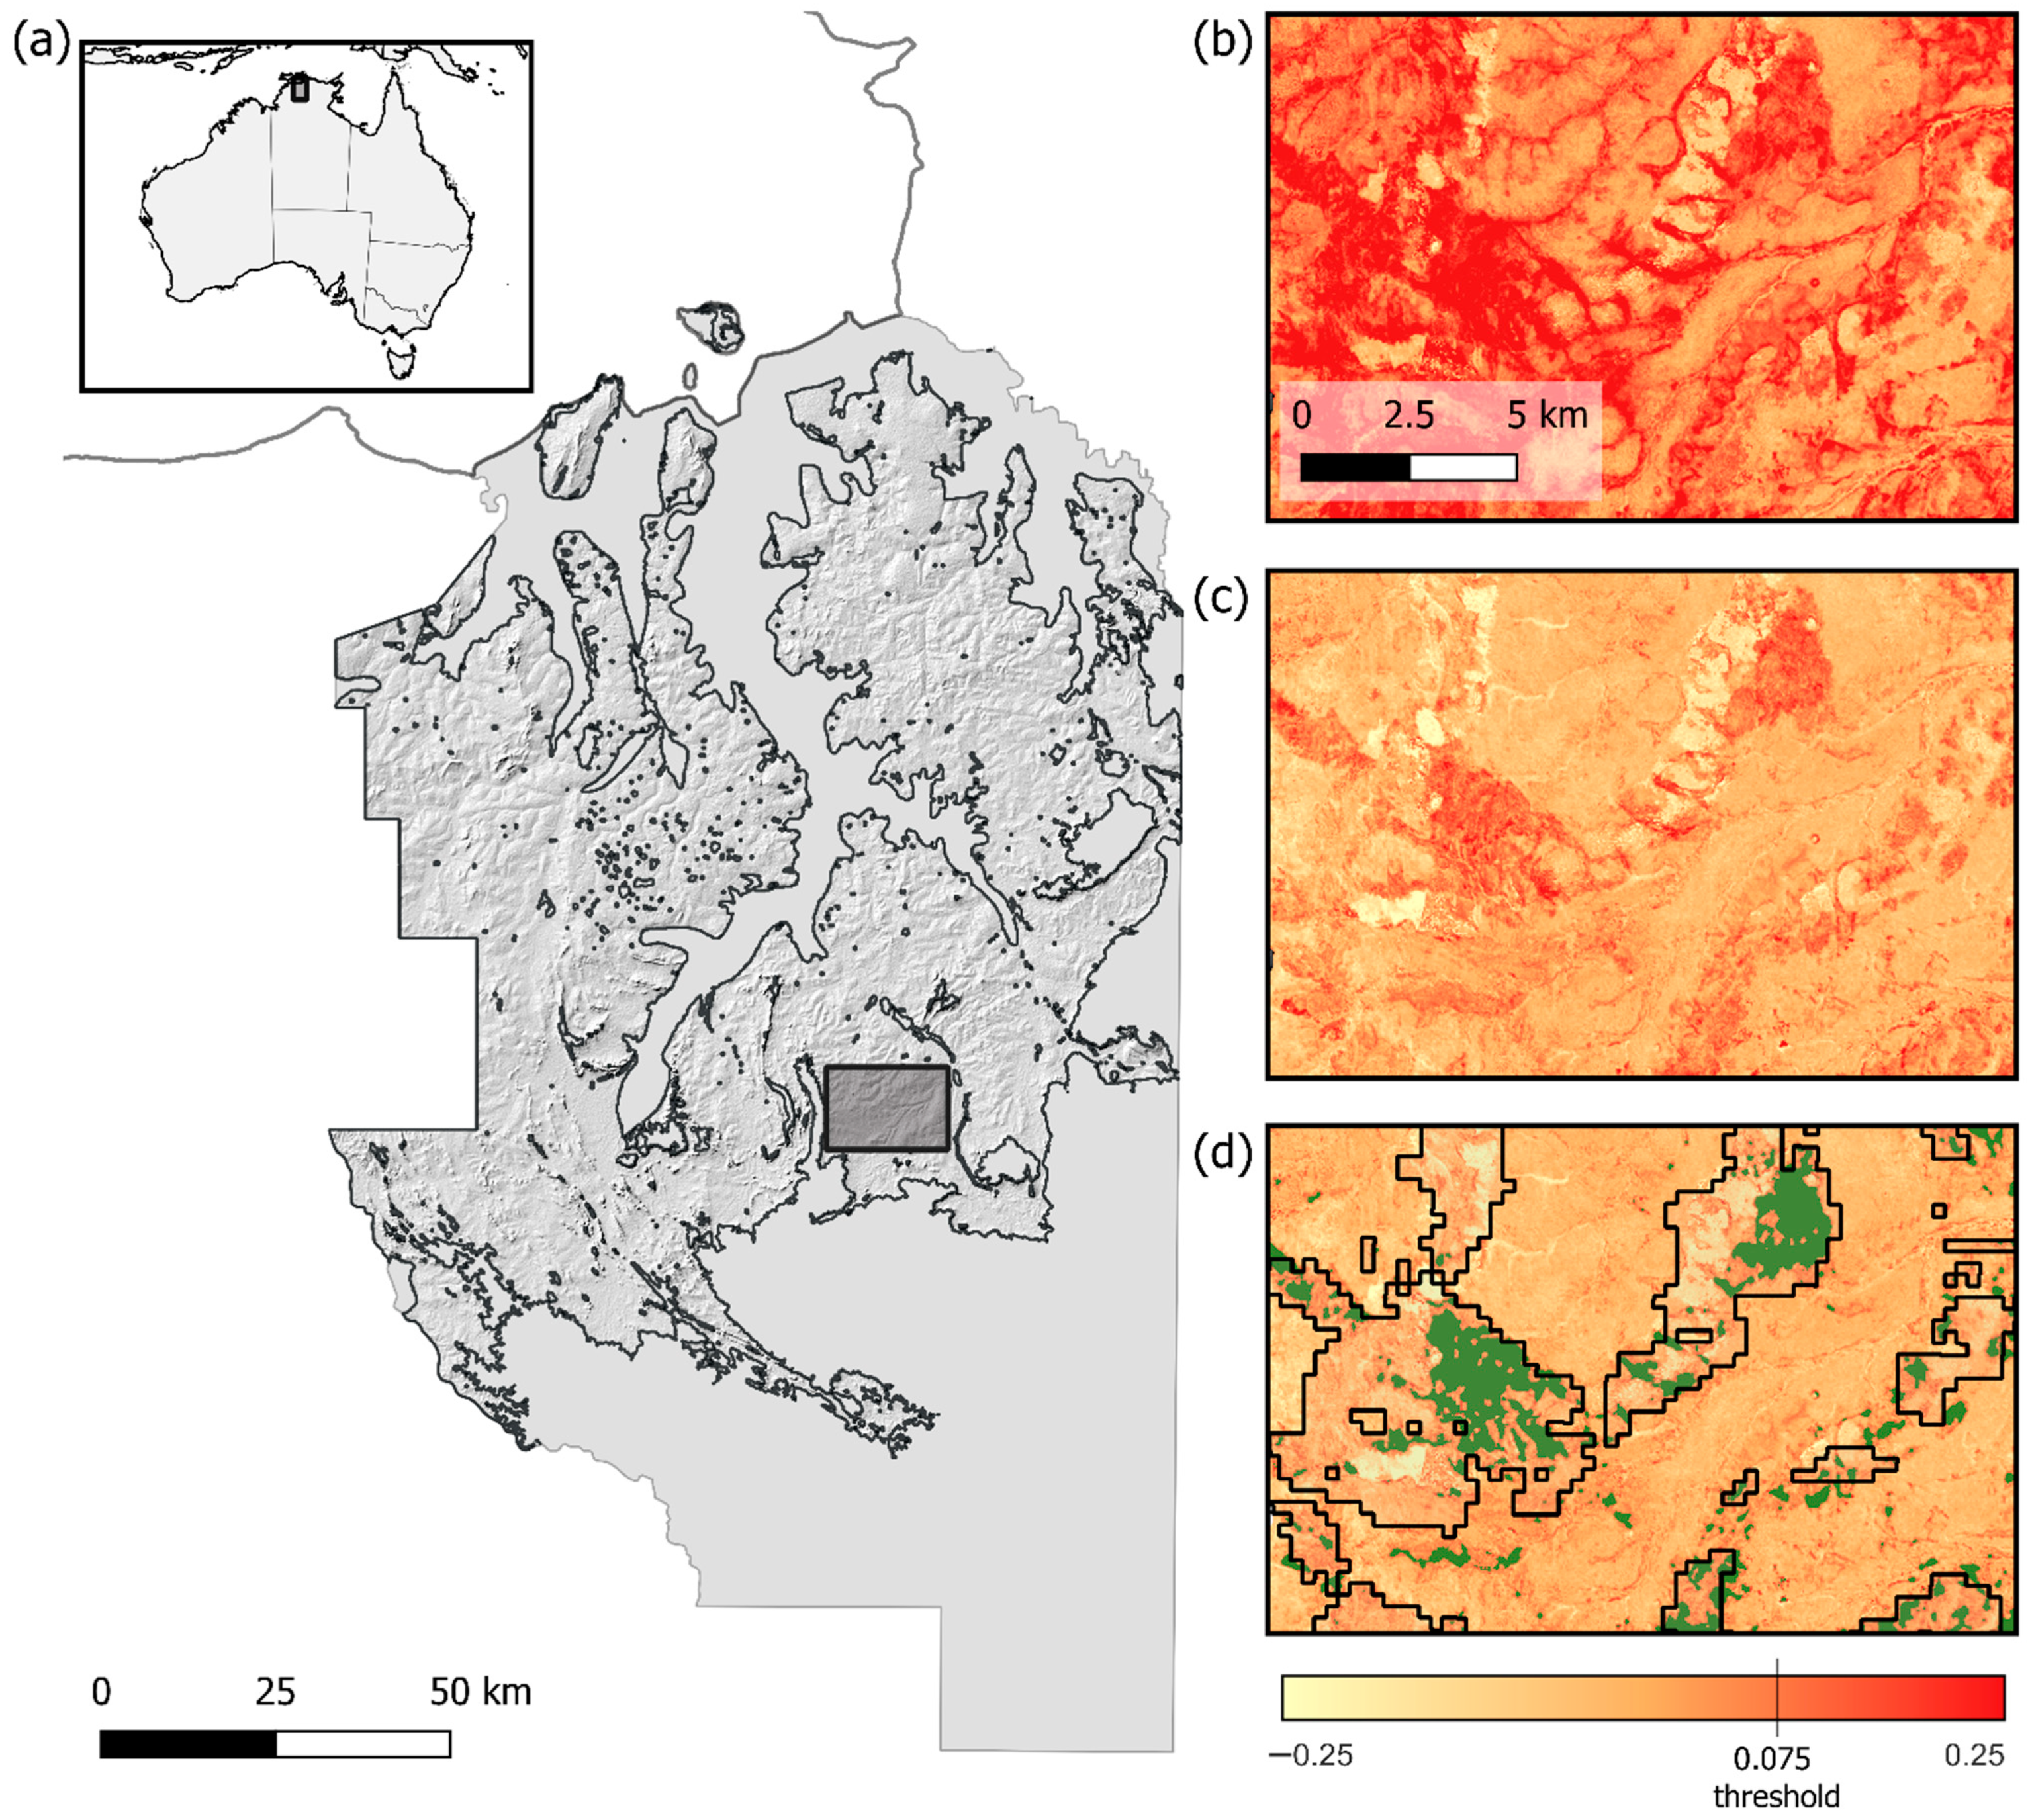
2.1. Study Area
2.2. Double-Differenced dNBR Methodology That Combines MODIS/VIIRS and Landsat
- Using seasonal Landsat composites, calculate dNBR for early and late dry season periods, and calculate the median over the shared MODIS/VIIRS fire scars (2000–2021).
- Subtract these seasonal averages from each year’s individual seasonal dNBR.
- Classify burned and unburned areas using an experimentally determined double dNBR threshold.
2.3. Statistical Analysis
3. Results and Discussion
4. Conclusions
Author Contributions
Funding
Data Availability Statement
Conflicts of Interest
References
- Krebs, P.; Pezzatti, G.B.; Mazzoleni, S.; Talbot, L.M.; Conedera, M. Fire regime: History and definition of a key concept in disturbance ecology. Theory Biosci. 2010, 129, 53–69. [Google Scholar] [CrossRef] [PubMed] [Green Version]
- Archibald, S.; Lehmann, C.E.R.; Gómez-Dans, J.L.; Bradstock, R.A. Defining pyromes and global syndromes of fire regimes. Proc. Natl. Acad. Sci. USA 2013, 110, 6442–6447. [Google Scholar] [CrossRef] [PubMed] [Green Version]
- Bowman, D.M.J.S.; Zhang, Y.; Walsh, A.; Williams, R.J. Experimental comparison of four remote sensing techniques to map tropical savanna fire-scars using Landsat-TM imagery. Int. J. Wildland Fire 2003, 12, 341–348. [Google Scholar] [CrossRef]
- Russell-Smith, J.; Ryan, P.G.; Durieu, R. A LANDSAT MSS-Derived Fire History of Kakadu National Park, Monsoonal Northern Australia, 1980-94: Seasonal Extent, Frequency and Patchiness. J. Appl. Ecol. 1997, 34, 748. [Google Scholar] [CrossRef]
- Gill, A.M.; Allan, G.; Yates, C. Fire-created patchiness in Australian savannas. Int. J. Wildland Fire 2003, 12, 323–331. [Google Scholar] [CrossRef]
- Yates, C.P.; Edwards, A.C.; Russell-Smith, J. Big fires and their ecological impacts in Australian savannas: Size and frequency matters. Int. J. Wildland Fire 2008, 17, 768–781. [Google Scholar] [CrossRef]
- Evans, J.; Russell-Smith, J. Delivering effective savanna fire management for defined biodiversity conservation outcomes: An Arnhem Land case study. Int. J. Wildland Fire 2020, 29, 386–400. [Google Scholar] [CrossRef] [Green Version]
- Edwards, A.; Archer, R.; de Bruyn, P.; Evans, J.; Lewis, B.; Vigilante, T.; Whyte, S.; Russell-Smith, J. Transforming fire management in northern Australia through successful implementation of savanna burning emissions reductions Projects. J. Environ. Manag. 2021, 290, 112568. [Google Scholar] [CrossRef]
- Bowman, D.M.J.S. The impact of Aboriginal landscape burning on the Australian biota. New Phytol. 1998, 140, 385–410. [Google Scholar] [CrossRef]
- Trauernicht, C.; Brook, B.W.; Murphy, B.P.; Williamson, G.J.; Bowman, D.M.J.S. Local and global pyrogeographic evidence that indigenous fire management creates pyrodiversity. Ecol. Evol. 2015, 5, 1908–1918. [Google Scholar] [CrossRef]
- Russell-Smith, J.; Cook, G.D.; Cooke, P.M.; Edwards, A.C.; Lendrum, M.; Meyer, C.P.; Whitehead, P.J. Managing fire regimes in north Australian savannas: Applying Aboriginal approaches to contemporary global problems. Front. Ecol. Environ. 2013, 11, e55–e63. [Google Scholar] [CrossRef] [Green Version]
- Lipsett-Moore, G.J.; Wolff, N.H.; Game, E.T. Emissions mitigation opportunities for savanna countries from early dry season fire management. Nat. Commun. 2018, 9, 2247. [Google Scholar] [CrossRef] [PubMed] [Green Version]
- Corey, B.; Andersen, A.N.; Legge, S.; Woinarski, J.C.; Radford, I.J.; Perry, J.J. Better biodiversity accounting is needed to prevent bioperversity and maximize co-benefits from savanna burning. Conserv. Lett. 2020, 13, e12685. [Google Scholar] [CrossRef]
- Department of Environment and Science, Queensland Government. Seasonal Surface Reflectance—Landsat, JRSRP Algorithm, Australia Coverage. Version 1.0.0. Terrestrial Ecosystem Research Network. (Dataset). Available online: https://portal.tern.org.au/seasonal-surface-reflectance-australia-coverage/22021 (accessed on 8 March 2022).
- Griffiths, A.D.; Garnett, S.T.; Brook, B.W. Fire frequency matters more than fire size: Testing the pyrodiversity–biodiversity paradigm for at-risk small mammals in an Australian tropical savanna. Biol. Conserv. 2015, 186, 337–346. [Google Scholar] [CrossRef]
- Lawes, M.J.; Murphy, B.P.; Fisher, A.; Woinarski, J.C.Z.; Edwards, A.C.; Russell-Smith, J. Small mammals decline with increasing fire extent in northern Australia: Evidence from long-term monitoring in Kakadu National Park. Int. J. Wildland Fire 2015, 24, 712–722. [Google Scholar] [CrossRef]
- Fisher, R.; Edwards, A.C. Fire extent and mapping: Procedures, validation and website application. In Carbon Accounting and Savanna Fire Management; Murphy, B.P., Edwards, A.C., Meyer, M., Russell-Smith, J., Eds.; CSIRO Publishing: Clayton South, Victoria, Australia, 2015; pp. 57–72. [Google Scholar]
- Cocke, A.E.; Fulé, P.Z.; Crouse, J.E. Comparison of burn severity assessments using Differenced Normalized Burn Ratio and ground data. Int. J. Wildland Fire 2005, 14, 189–198. [Google Scholar] [CrossRef] [Green Version]
- R Core Team. R: A Language and Environment for Statistical Computing; R Foundation for Statistical Computing: Vienna, Austria; Available online: https://www.R-project.org/ (accessed on 5 April 2022).
- Hijmans, R. Raster: Geographic Data Analysis and Modeling. R Package Version 3.5-21. Available online: https://CRAN.R-project.org/package=raster (accessed on 7 April 2022).
- Kuhn, M. Caret: Classification and Regression Training_. R Package Version 6.0-92. Available online: https://CRAN.R-project.org/package=caret (accessed on 7 April 2022).
- Hesselbarth, M.H.K.; Sciaini, M.; With, K.A.; Wiegand, K.; Nowosad, J. Landscapemetrics: An open-source R tool to calculate landscape metrics. Ecography 2019, 42, 1648–1657. [Google Scholar] [CrossRef] [Green Version]
- Hothorn, T.; Bretz, F.; Westfall, P. Simultaneous Inference in General Parametric Models. Biom. J. 2008, 50, 346–363. [Google Scholar] [CrossRef] [Green Version]
- Laris, P.S. Spatiotemporal problems with detecting and mapping mosaic fire regimes with coarse-resolution satellite data in savanna environments. Remote Sens. Environ. 2005, 99, 412–424. [Google Scholar] [CrossRef]
- Bowman, D.M.J.S.; Williamson, G.J.; Johnston, F.H.; Bowman, C.J.W.; Murphy, B.P.; Roos, C.I.; Trauernicht, C.; Rostron, J.; Prior, L.D. Population collapse of a Gondwanan conifer follows the loss of Indigenous fire regimes in a northern Australian savanna. Sci. Rep. 2022, 12, 9081. [Google Scholar] [CrossRef]
- White, J.; Ryan, K.; Key, C.; Running, S. Remote Sensing of Forest Fire Severity and Vegetation Recovery. Int. J. Wildland Fire 1996, 6, 125–136. [Google Scholar] [CrossRef] [Green Version]
- Veraverbeke, S.; Verstraeten, W.W.; Lhermitte, S.; Goossens, R. Evaluating Landsat Thematic Mapper spectral indices for estimating burn severity of the 2007 Peloponnese wildfires in Greece. Int. J. Wildland Fire 2010, 19, 558–569. [Google Scholar] [CrossRef]


| MODIS/VIIRS | Landsat | Combined | |
|---|---|---|---|
| Mean Patch Area (ha) | 165 (2810) | 5.48 (96.3) | 6.23 (93.6) |
| Mean Long Unburned (>5 years) Patch Area (ha) | 38.6 (137) | 13.0 (247) | 17.4 (394) |
| Number of Patches | 6098 | 182,538 | 158,539 |
| Number of Long Unburned (>5 years) Patches | 822 | 21,735 | 19,345 |
| Contagion Index | 76.6 | 54.3 | 53.4 |
| Mean Time Since Fire | 2.0 (1.5) | 4.24 (3.2) | 4.78 (3.6) |
Publisher’s Note: MDPI stays neutral with regard to jurisdictional claims in published maps and institutional affiliations. |
© 2022 by the authors. Licensee MDPI, Basel, Switzerland. This article is an open access article distributed under the terms and conditions of the Creative Commons Attribution (CC BY) license (https://creativecommons.org/licenses/by/4.0/).
Share and Cite
Williamson, G.J.; Ellis, T.M.; Bowman, D.M.J.S. Double-Differenced dNBR: Combining MODIS and Landsat Imagery to Map Fine-Grained Fire MOSAICS in Lowland Eucalyptus Savanna in Kakadu National Park, Northern Australia. Fire 2022, 5, 160. https://doi.org/10.3390/fire5050160
Williamson GJ, Ellis TM, Bowman DMJS. Double-Differenced dNBR: Combining MODIS and Landsat Imagery to Map Fine-Grained Fire MOSAICS in Lowland Eucalyptus Savanna in Kakadu National Park, Northern Australia. Fire. 2022; 5(5):160. https://doi.org/10.3390/fire5050160
Chicago/Turabian StyleWilliamson, Grant J., Todd M. Ellis, and David M. J. S. Bowman. 2022. "Double-Differenced dNBR: Combining MODIS and Landsat Imagery to Map Fine-Grained Fire MOSAICS in Lowland Eucalyptus Savanna in Kakadu National Park, Northern Australia" Fire 5, no. 5: 160. https://doi.org/10.3390/fire5050160
APA StyleWilliamson, G. J., Ellis, T. M., & Bowman, D. M. J. S. (2022). Double-Differenced dNBR: Combining MODIS and Landsat Imagery to Map Fine-Grained Fire MOSAICS in Lowland Eucalyptus Savanna in Kakadu National Park, Northern Australia. Fire, 5(5), 160. https://doi.org/10.3390/fire5050160