Article

Numerical Investigations on the Influencing Factors of Rapid Fire Spread of Flammable Cladding in a High-Rise Building

School of Engineering, Design and Built Environment, Western Sydney University, Penrith, NSW 2751, Australia
*
Author to whom correspondence should be addressed.
Fire 2022, 5(5), 149; https://doi.org/10.3390/fire5050149
Submission received: 21 August 2022 / Revised: 14 September 2022 / Accepted: 20 September 2022 / Published: 26 September 2022

Abstract

:
This paper investigates aluminium composite panels (ACPs) to understand the fire behaviour of combustible cladding systems under different fire scenarios. A fire dynamics simulator (FDS) is used to develop the numerical model of full-scale fire tests of combustible cladding systems using the procedures of the British BS 8414.1 standards. The results obtained from the FDS models are verified with test data. Seven test scenarios are investigated with four distinct parameters, i.e., cavity barrier, air-cavity gap, panel mounting (with and without joining gaps between the panels), and material combustibility qualities. A critical air-cavity gap (50–100 mm) is established at which maximum fire spread is noticed. Furthermore, variations in the cavity barrier, panel mounting, and material combustibility significantly impact the rapid fire spread of ACP cladding systems and the internal failure criterion. The results from the present study can serve as a basis for future research on the full-scale fire-test development of combustible ACPs.

1. Introduction

Recent fires involving flammable cladding systems and rapid fire spread in high-rise buildings throughout the world have prompted concerns about fire risk mitigation and rescue strategies. Following the 2017 Grenfell Tower fire catastrophe, the fire behaviour of ventilated cladding systems made of aluminium composite panels (ACPs) has become a topic of concern [1,2]. However, understanding these fires is extremely difficult because these flammable cladding systems include a combination of materials and system characteristics. The performance of the entire exterior cladding system, rather than the performance of each component, determines how this system will behave in the event of a fire. The fire performance of a cladding system comprises not only the cladding panel and the insulant but also air cavities, cavity barriers, mounting and fastening elements, and substrates [1,2,3,4,5,6]. In a real fire, all of these components interact significantly.
A disparity in installation details and cavity barrier placement was noticed following major ventilated cladding fires. For example, the Knowsley Heights fire (UK, 1991) had no fire barriers in the air cavity below the cladding [3]. Barriers were not placed in the TVCC tower (China, 2009) and the insulation and cladding were both flammable [4]. Aluminium composite panels with a polyethylene core were installed on the balcony walls at the Lacrosse building (Australia, 2014), and the final report of the investigation concluded that barriers were not employed [7]. Another example is the Grenfell Tower fire in 2017 (UK, 2017), where there were installed barriers; however, the installation geometry of the cladding system developed an interconnected network of cladding cavities, allowing the fire to spread rapidly [8]. Because of recent fires in high-rise buildings throughout the world, regulatory agencies from many countries are currently establishing full-scale fire test methodologies, such as NFPA 285 [9], ISO 13785 [10], BS 8414.1 [11], and AS 5113 [12], to study the fire performance of claddings [1]. Since the majority of these standards are based on binary pass/fail criteria, a scientific approach with quantitative research could enhance the assessment criterion of these standards. The BS 8414.1 test, for example, requires the use of a cladding barrier. However, the location of the barrier in the test system is not specified [13]. Recent research has been carried out on the effect of horizontal and vertical barriers on the fire spreading of non-combustible ACP cladding systems [14]. The study found that horizontal and vertical barriers have a positive impact on the prevention of fire spread. The placement and quantity helped to delay fire propagation during fire exposure under the BS 8414.1 tests [14]. The present study examines the effectiveness of cavity barriers both in the horizontal and vertical directions of combustible cladding systems.
Like the cavity barrier, the gap of the air cavity in a ventilated cladding system can be another prominent factor for rapid fire spread in a high-rise building [15]. The gap of this cavity varies between 25 mm and 100 mm to ensure good thermal insulation [16]. This gap supports vertical fire spread via the “Chimney effect”. When a fire enters the cavity, the fire can stretch up to 5 to 10 times the flame length to find oxygen for combustion [4]. This phenomenon occurs regardless of the materials used and enables a fire to spread rapidly unseen within a cladding system. It is hazardous to firefighters as it creates hidden fires within the panels and sudden flashover. Different studies have been used to analyse the effects of air cavities in rapid fire spread. A study on the effects of air cavities suggested that a critical gap of an air cavity between 13 and 50 mm allows a fire to spread rapidly [15]. However, the study is based on a modified scaled-down BS 8414 test setup. So, it is important to analyse this effect in a full-scale test rig. Another study was carried out on a two-storey building with combustible ventilated cladding using different air-cavity values. The values ranged from 50 mm to 200 mm [4]. The study found a positive correlation between the fire spread and the air-cavity gap. It is therefore important to analyse the effects of the air cavity in a real test rig using the BS 8414.1 standards to establish a better scientific and regulatory framework for testing flammable cladding. In addition, the installation of panels in the test rig, i.e., joint gaps without joints in the cladding panels, has not been studied extensively. This can also be helpful for understanding the fire-spread properties of combustible cladding, which helps to establish full-scale test protocols more scientifically. Moreover, these full-scale tests are pass/fail-oriented and thus provide very little quantitative information for further interpretations of the fire behaviour of the tested system and come with high laboratory costs. On the other hand, numerical modelling allows researchers to investigate a variety of aspects of fire spread without having to expend a lot of money on laboratory studies.
This study aims to develop a set of models to simulate an ACP cladding test, which was carried out in accordance with BS8414.1 in a full-scale test rig, and analyse the effects of the cavity barrier, air cavity, mounting of panels (with and without a gap in panel joints), and the combustibility properties of the panels. In addition, the study aims to validate the Fire Dynamic Simulator (FDS) model using full-scale BS 8414.1 test data [17]. Finally, a verified FDS model is used for further analysis to understand the effects of the different parameters of ACP cladding systems based on the BS 8414.1 full-scale test standard.

2. Numerical Model Development and Verification

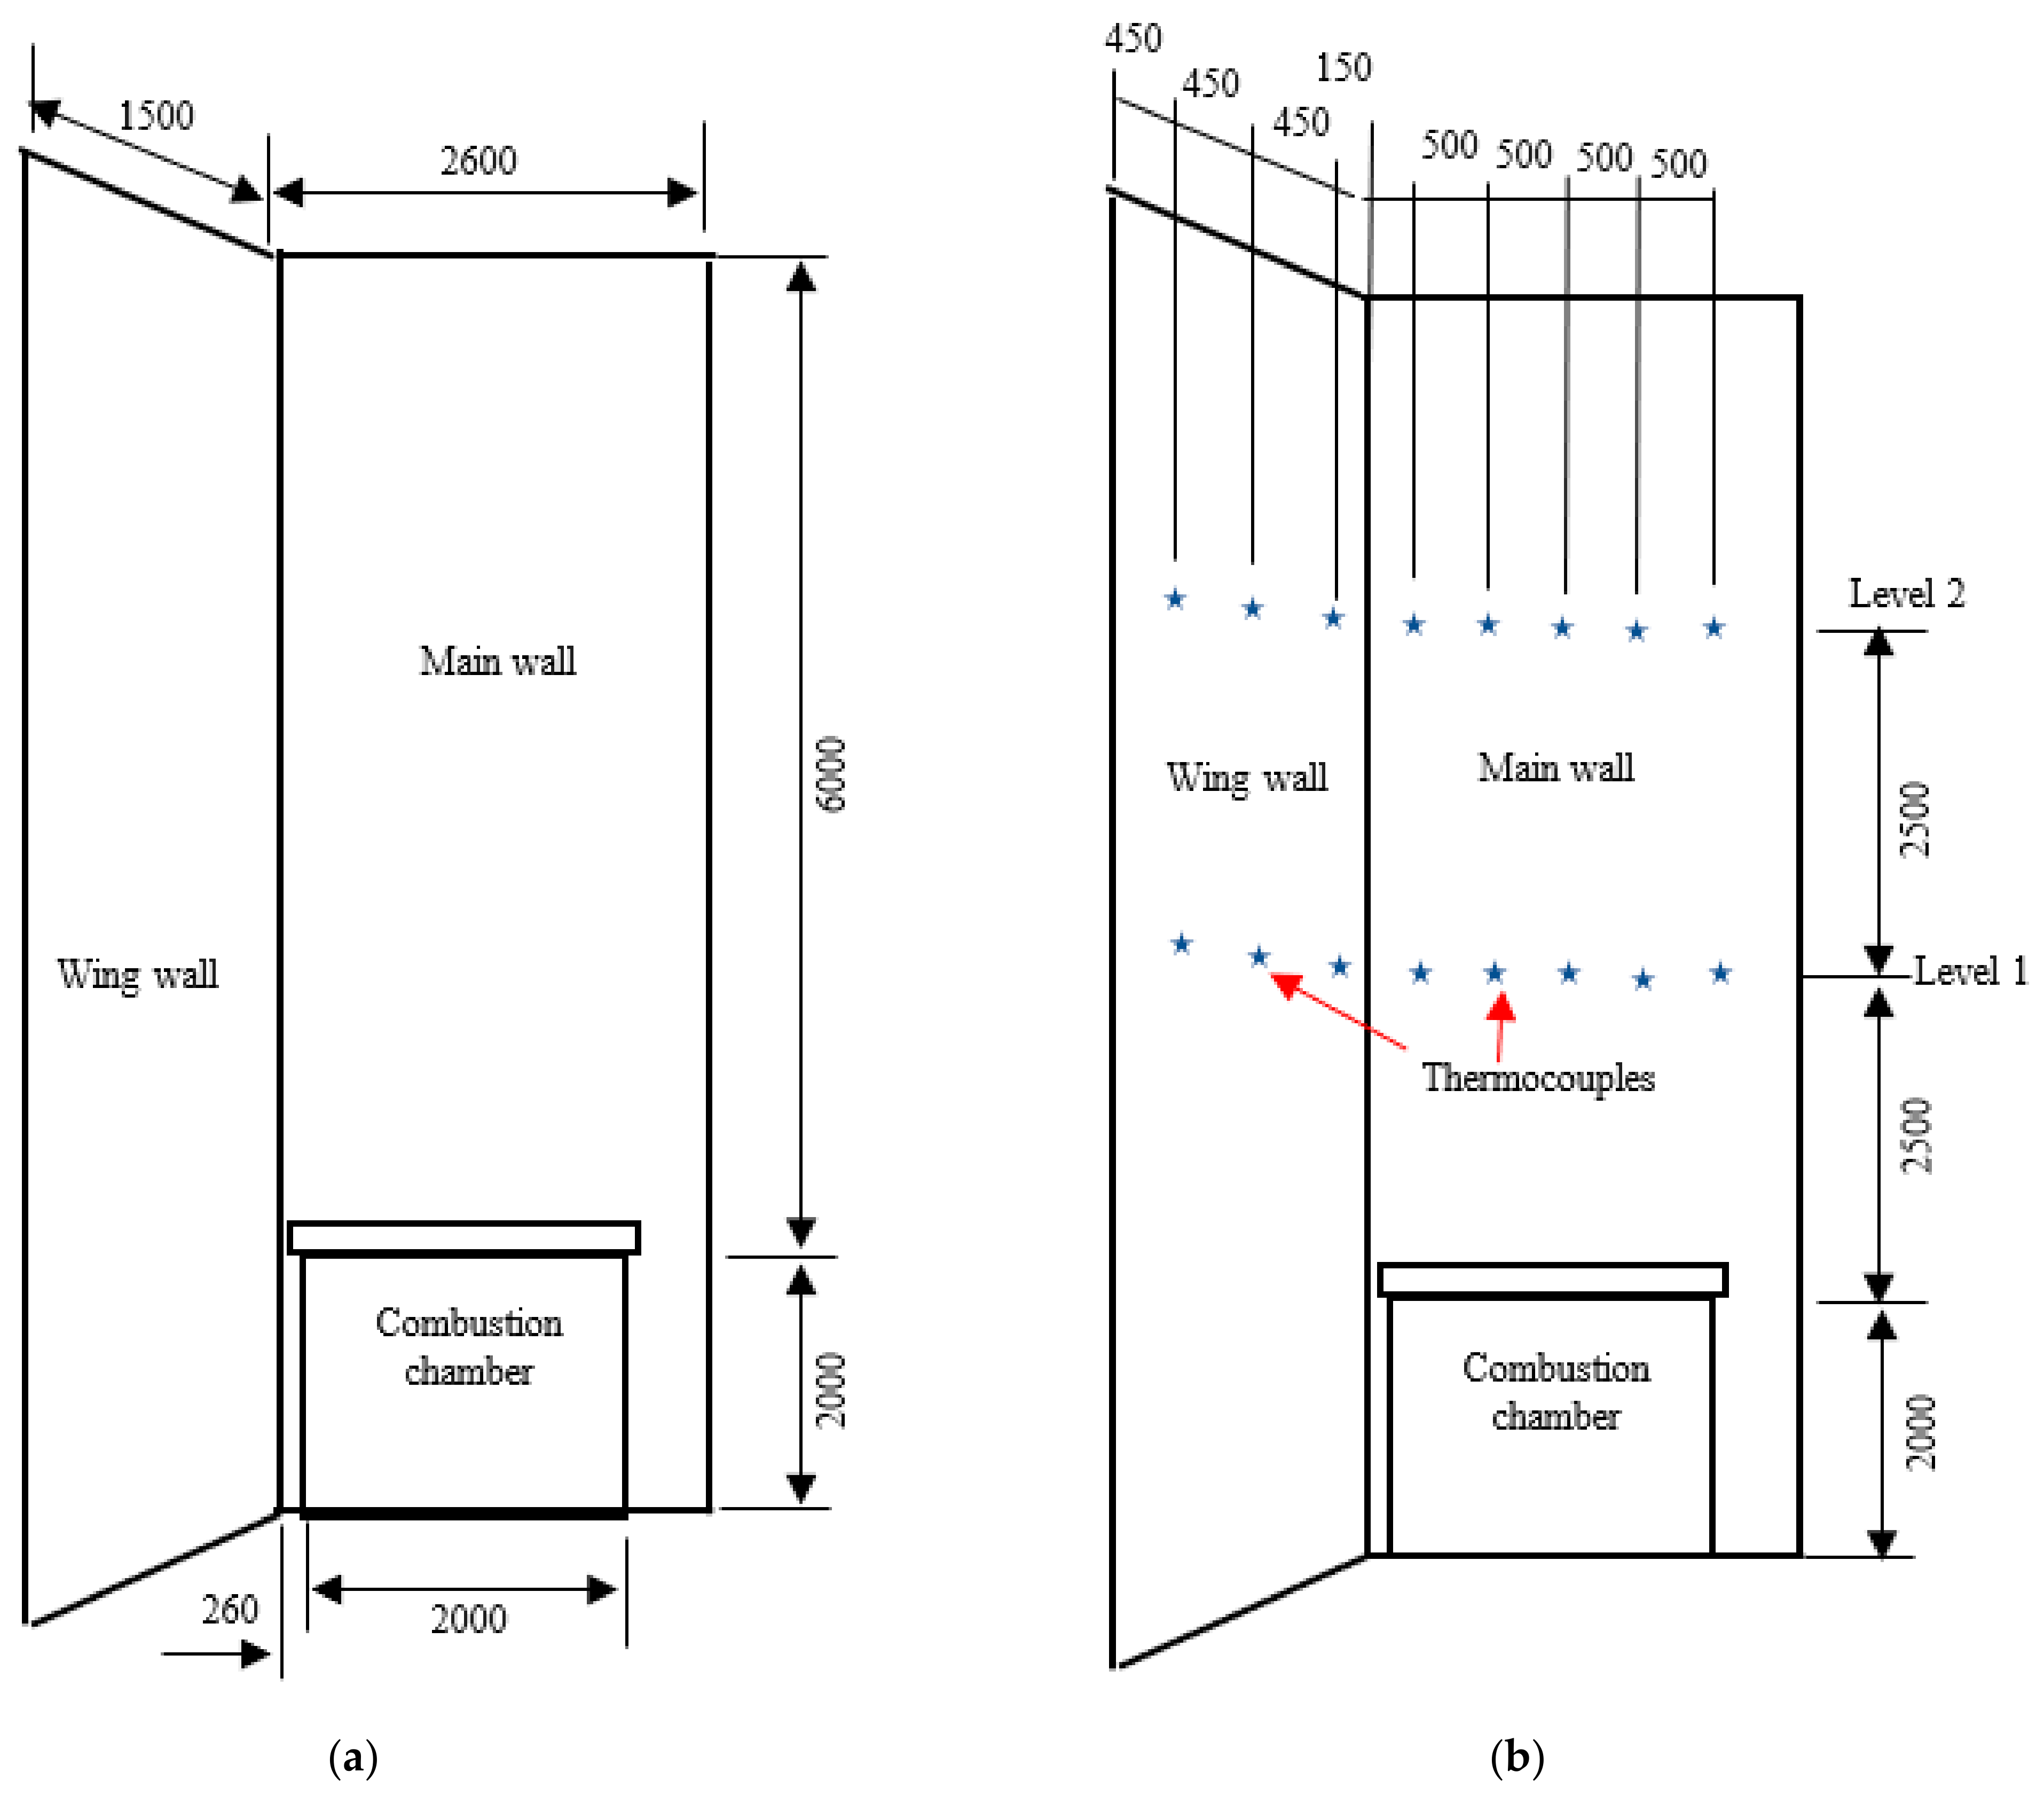
2.1. Test Data Collection

Experimental data was collected from a reliable test [17] conducted based on the full-scale ACP cladding system by the Department for Communities and Local Government (DCLG). The DCLG full-scale fire test [17] based on the BS 8414.1 standards was used to validate the proposed numerical model. Figure 1 presents the experimental setup used for the test of a full-scale ACP cladding system according to the BS 8414.1 test standards. It comprises two frames with back-wall (main wall) dimensions of 2600 mm × 8000 mm and side-wall (wing wall) dimensions of 1500 mm × 8000 mm, with calcium silicate boards as a support for the tested system and on which the system is mounted, as shown in Figure 1a. For the external heat source, a wood crib with an HRR near 3.0 ±   0.5 MW was used in the combustion chamber with dimensions of 1500 mm × 1000 mm × 1000 mm. The DCLG experimental setup, including its k-type thermocouple location details, is shown in Figure 1b and the experimental setup can be found in the DCLG test 1 report [17].

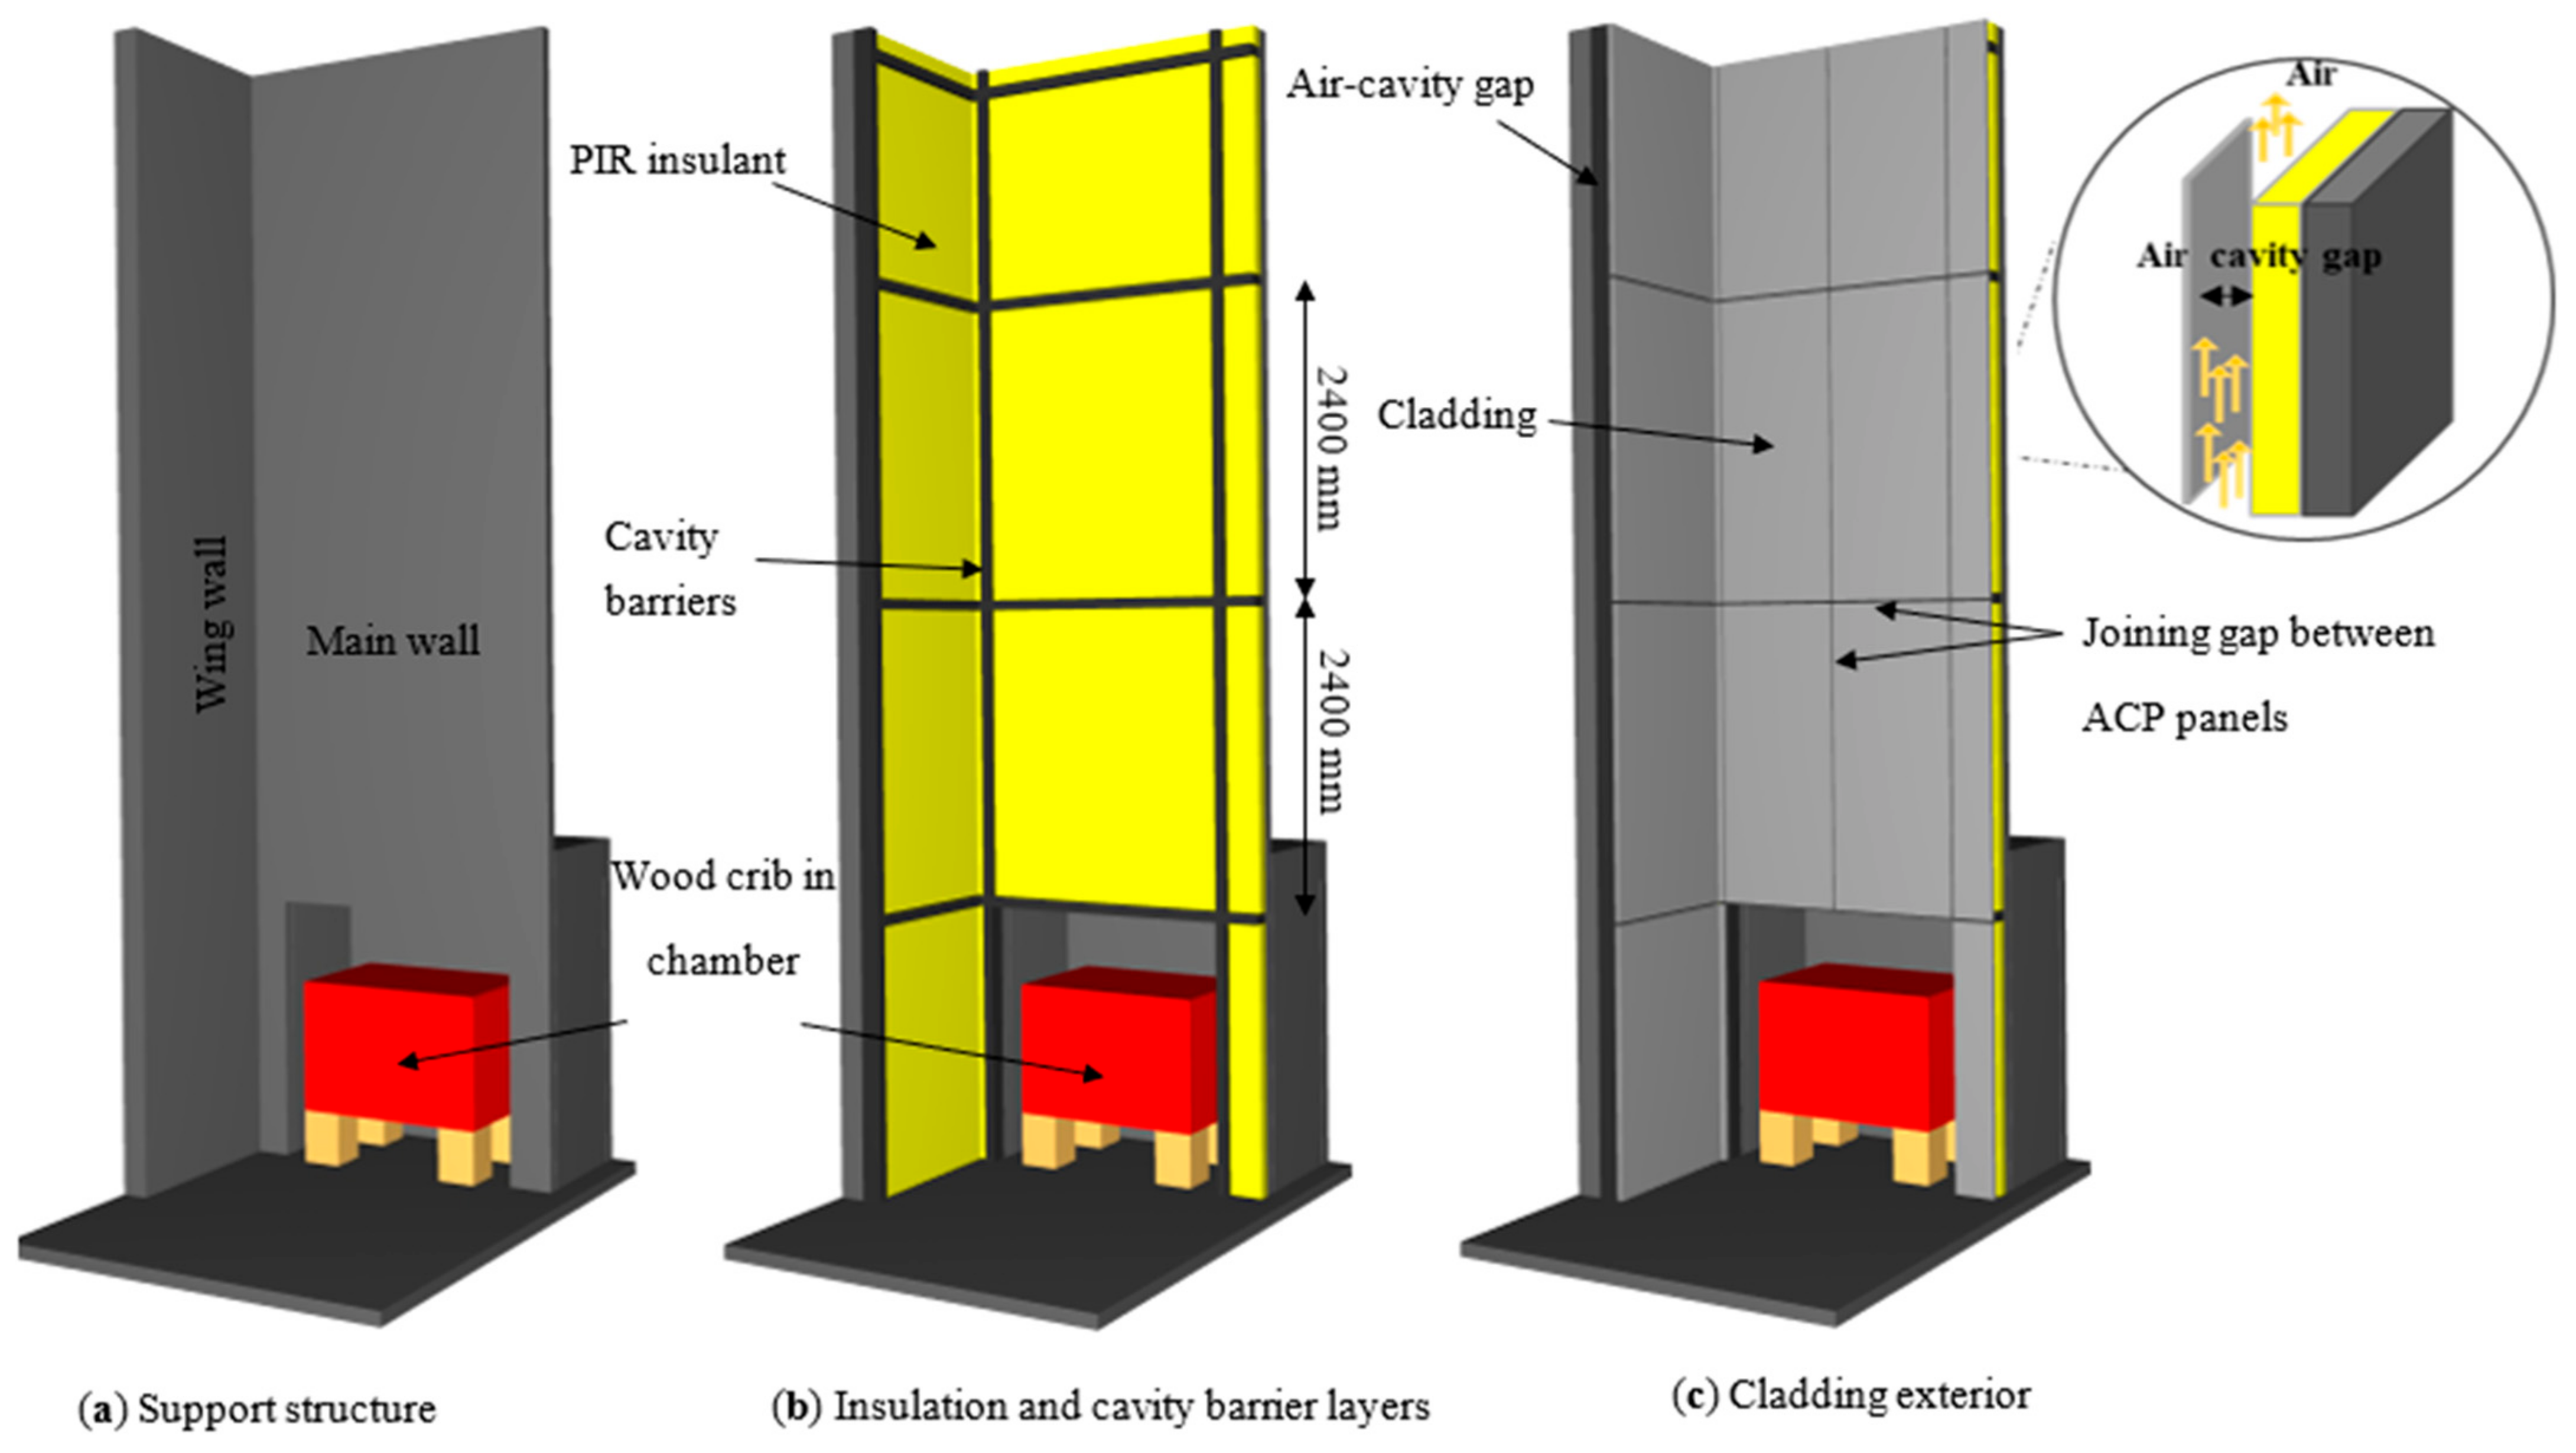
2.2. Numerical Model Development

According to the test details reported in [17], a numerical model was developed using FDS software (version 6.7.9, USA) and the model results were compared with their test results to verify the FDS model. The verified FDS model was then used to investigate the impact of the various parameters of the ACP cladding system on its overall system performance when tested according to the BS 8414.1 standards. The parametric analysis results are summarised in Section 4. FDS version 6.7.4 was developed based on a large-eddy simulation (LES) code for low-speed flows, with an emphasis on smoke and heat transport from fires, relevant to the current study. The BS 8414.1 standards permit the use of pine wood cribs as an external fuel source within the combustion chamber. The fuel reaction parameter values, C = 1.0, H = 1.7, O = 0.83, and CO Yield = 5.0 × 10⁻³, were used in the FDS model development. The material properties were assigned in the FDS model according to the tested properties reported in the BRE DCLG tests [17]. In the FDS model, the cladding was modelled as a layered surface in which the exact thicknesses and material composition for each internal layer were specified. The FDS used these parameters to calculate the heat transfer within the overall cladding obstruction. For the purposes of heat transfer, the SURF parameters in the input defined the heat transfer within the ACP internal layers. The obstruction thickness (which is limited by the grid size) was not used to calculate the heat transfer through the panel. The present study assumed one-dimensional heat conduction into the surfaces of the solid obstructions [18]. It coupled the front and back face temperatures of an obstruction for heat flowing through the obstruction. Some typical parameters used in the FDS model are summarised in Table 1. In this study, a one-step decomposition reaction was used of LDPE, and Char + Pyrolyzate with multiple reactions were used according to the data reported in [19] for PIR. The BURN_AWAY option was used for aluminium when the temperature reached 600 °C.

2.2.1. Geometry Modelling

The geometry of the full-scale fire test of the ACP cladding system was simulated using the PyroSim (version 6.7.6, Manhattan, KS, USA) simulation tool. The testing rig structure consisted of concrete support walls in an L-shape configuration (Figure 2a) covered in a layer of Polyisocyanurate (PIR foam) insulation, with stone wool cavity barriers (Figure 2b) and an outer ACP layer. is used as The cladding panel core material used was 100% low-density polyethylene, which was sandwiched between two thin layers of aluminium sheeting (Figure 2c). The main concrete frame was 8000 mm in height and 2600 mm in width and the wing wall frame was the same height at 8000 mm with a width of 1500 mm. The heat source of the test was a wood crib with dimensions of 1500 mm × 1000 mm × 1000 mm for the length, width, and height, respectively. The developed model included internal and external thermocouples at the general locations required by the BS 8414.1 standards, as shown in Figure 3. Thermocouples were located at the level 1 and level 2 positions just below the horizontal cavity barriers, where they could provide more accurate internal temperature data without being protected by the cavity barrier.

2.2.2. Material Properties Used in Modelling

Three materials (concrete, insulation, and ACP panels) were used in the test rig. ACP panels typically consist of a 3 mm polyethylene core sandwiched between two 0.5 mm aluminium skins. In the model, the surface option was used with individual material layers and related thicknesses of the materials to ensure accurate heat transfer calculation of the whole panel. The thermal properties used in the FDS model development with polyethylene (PE) as the core material for the ACP panels and the aluminium, insulation material (PIR foam or stone wool), and concrete used in the test are presented in Table 2. To simulate the experiment in the FDS, the material properties were first defined. This included the specific heat, thermal conductivity, density, heat of combustion, and emissivity.
The input thermal properties of the PE were selected from validated experimental data from different research works [20,21,22,23]. Density and thermal conductivity were taken as 1360 kg/m3 and 0.38 W/m.K, respectively [20,21]. The heat of decomposition used was 2300 kJ/kg [23]. The typical ignition temperature value of 380 °C was used in this study [24]. Assuming a mass loss rate (MLR) of 0.04 kg/m2/s, the value of 43.5 MJ/kg of the heat of combustion was selected in this study [21,22]. The value of the CO yields used was 0.024 g/g to represent well-ventilated regimes [24]. The density value of the PIR insulation was taken as 36 kg/m3 [21]. Due to the char tendency of PIR, the emissivity was taken as 1 [21]. The common value for the specific heat of the PIR was around 1.1 kJ/kg.K [25]. According to the literature, the heat of combustion was taken as 26.3 MJ/kg, with CO and HCN yields of 0.038 and 0.01 g/g, respectively [21]. The value of CO represents the well-ventilated regime [23]. The ignition temperature commonly found was around 370 °C, and the heat of decomposition was around 1750 J/g [24]. The thermal properties of aluminium were used according to the Eurocode 9 standards [26]. The density value was taken as 2700 kg/m3 and 0.7 as the conservative value of the emissivity [21]. In the case of the thermal properties of the concrete, the specific heat was taken as 1.04 kJ/kg.K. The density was assumed as 2280 kg/m3, and the conductivity was taken as 1.8 W/m.K [21]. The thermal properties of the cavity barrier, including intumescent, were extracted from different literature databases [21,22]. The input density and thermal conductivity values were 360 kg/m3 and 0.2 W/m.K. The value of specific heat was assumed as 1.0 J/g/K. The emissivity of the cavity barrier was taken as 1.

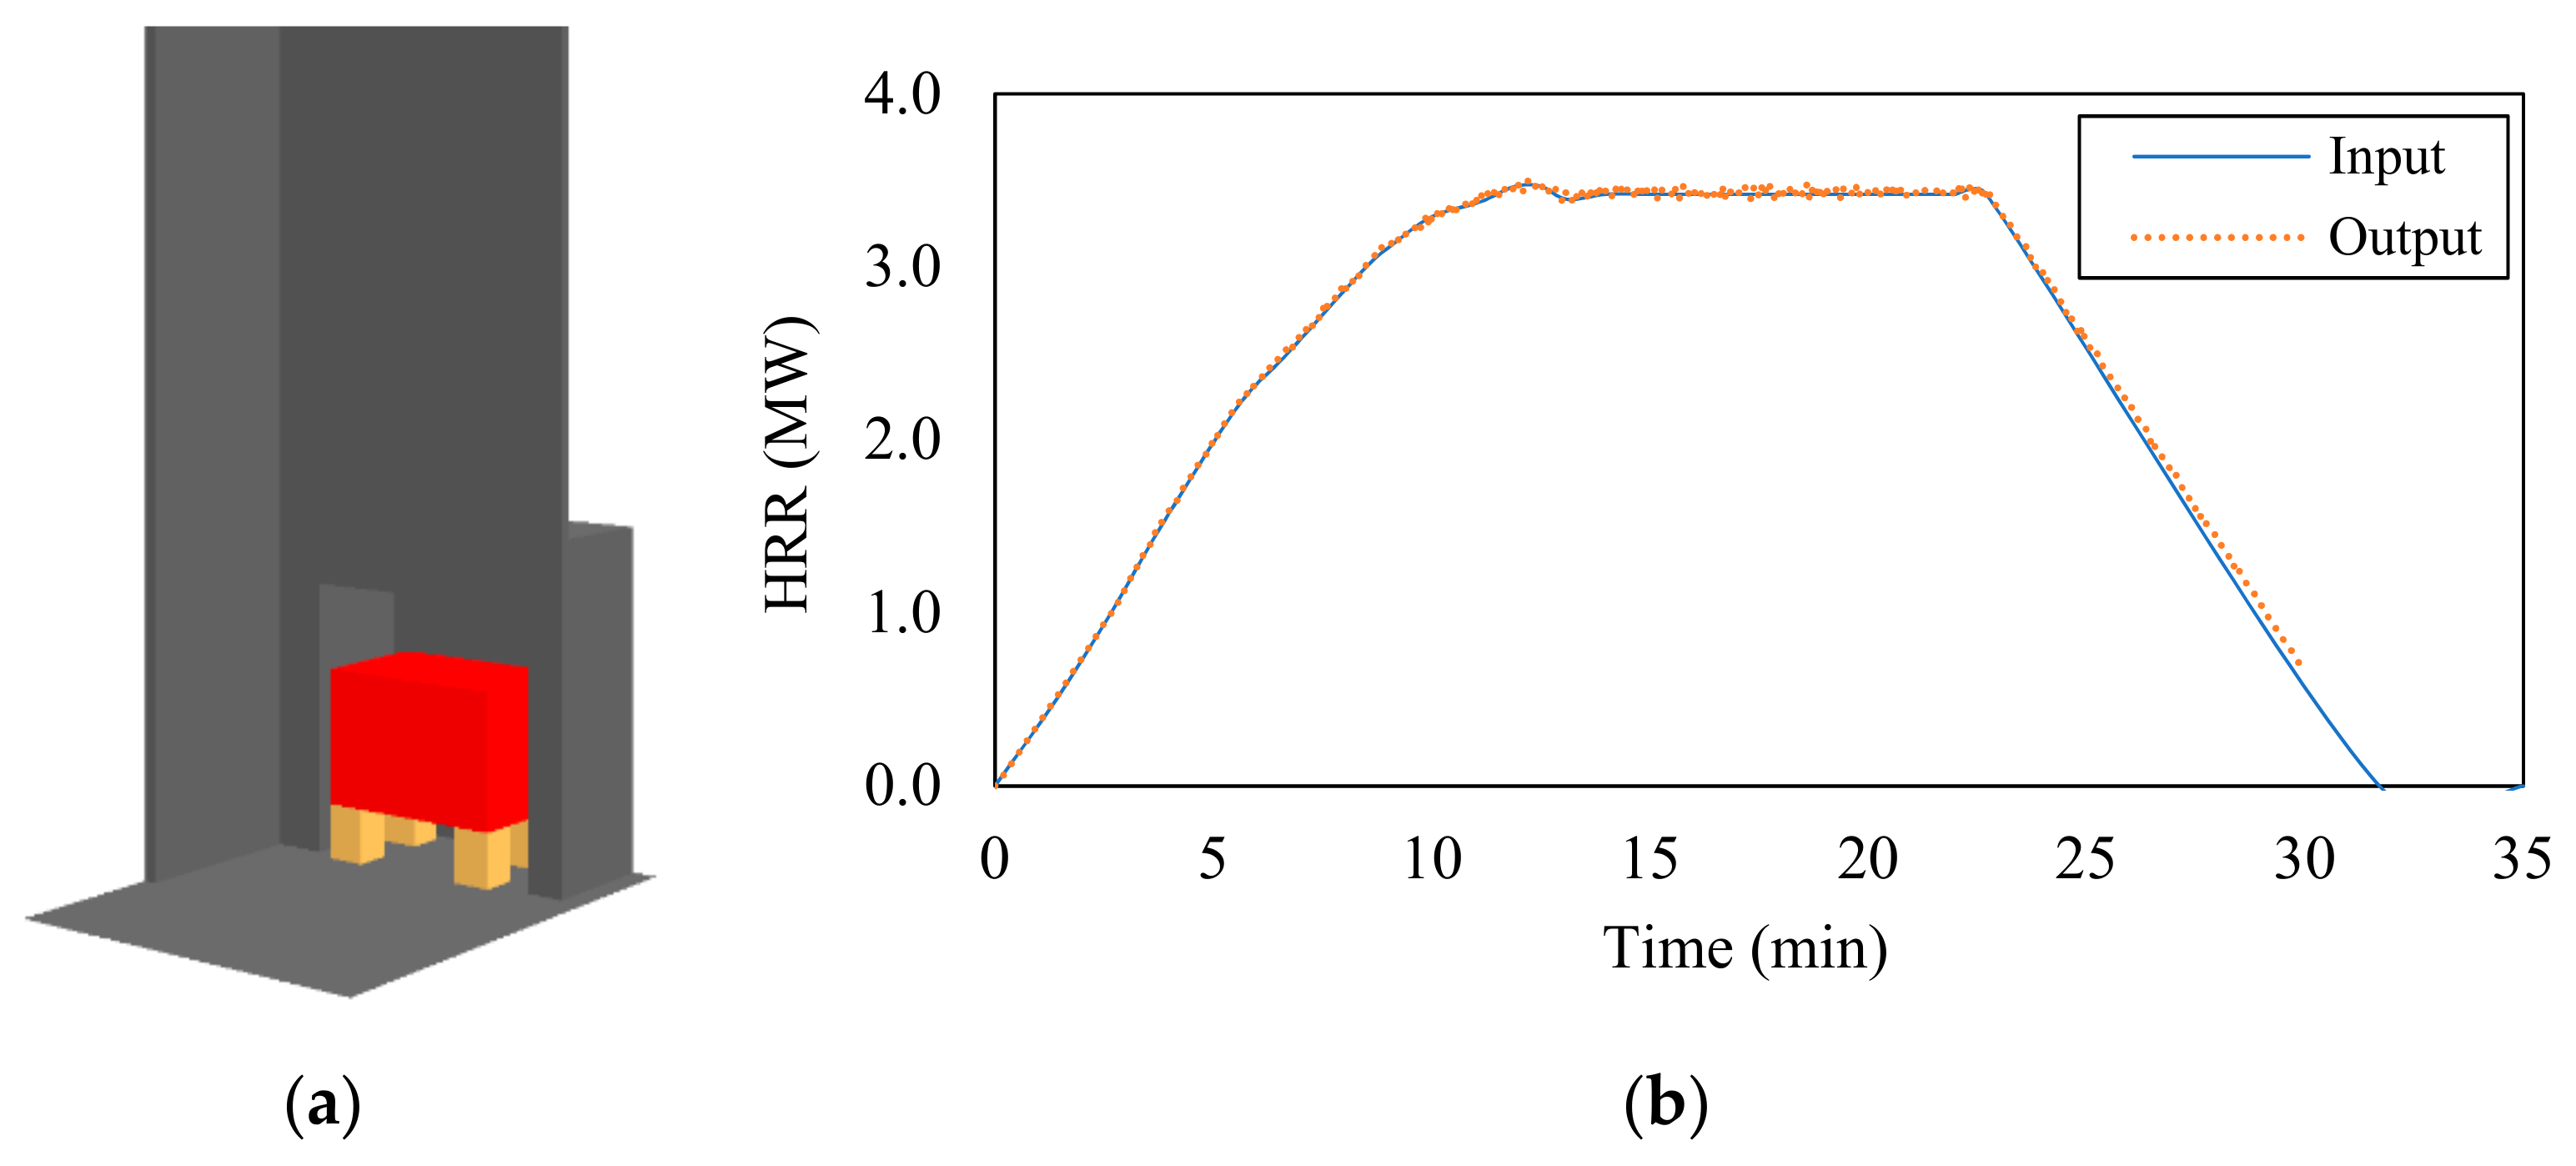
2.2.3. Fire Load Used in Modelling

The model for the fire source was developed based on the BS 8414.1 test standard requirements. Based on previous studies, the best way to simulate the wood crib fire is by using the heat release rate (HRR) [21,22,23]. The HRR used in the FDS model for the wood crib combustion is shown in Figure 4. The combustion chamber was ignited and allowed to burn for 30 min. This produced a total heat release of 4500 MJ over 30 min at a peak rate of 3 MW with a tolerance of 0.5 MW. After this time, the crib was extinguished.

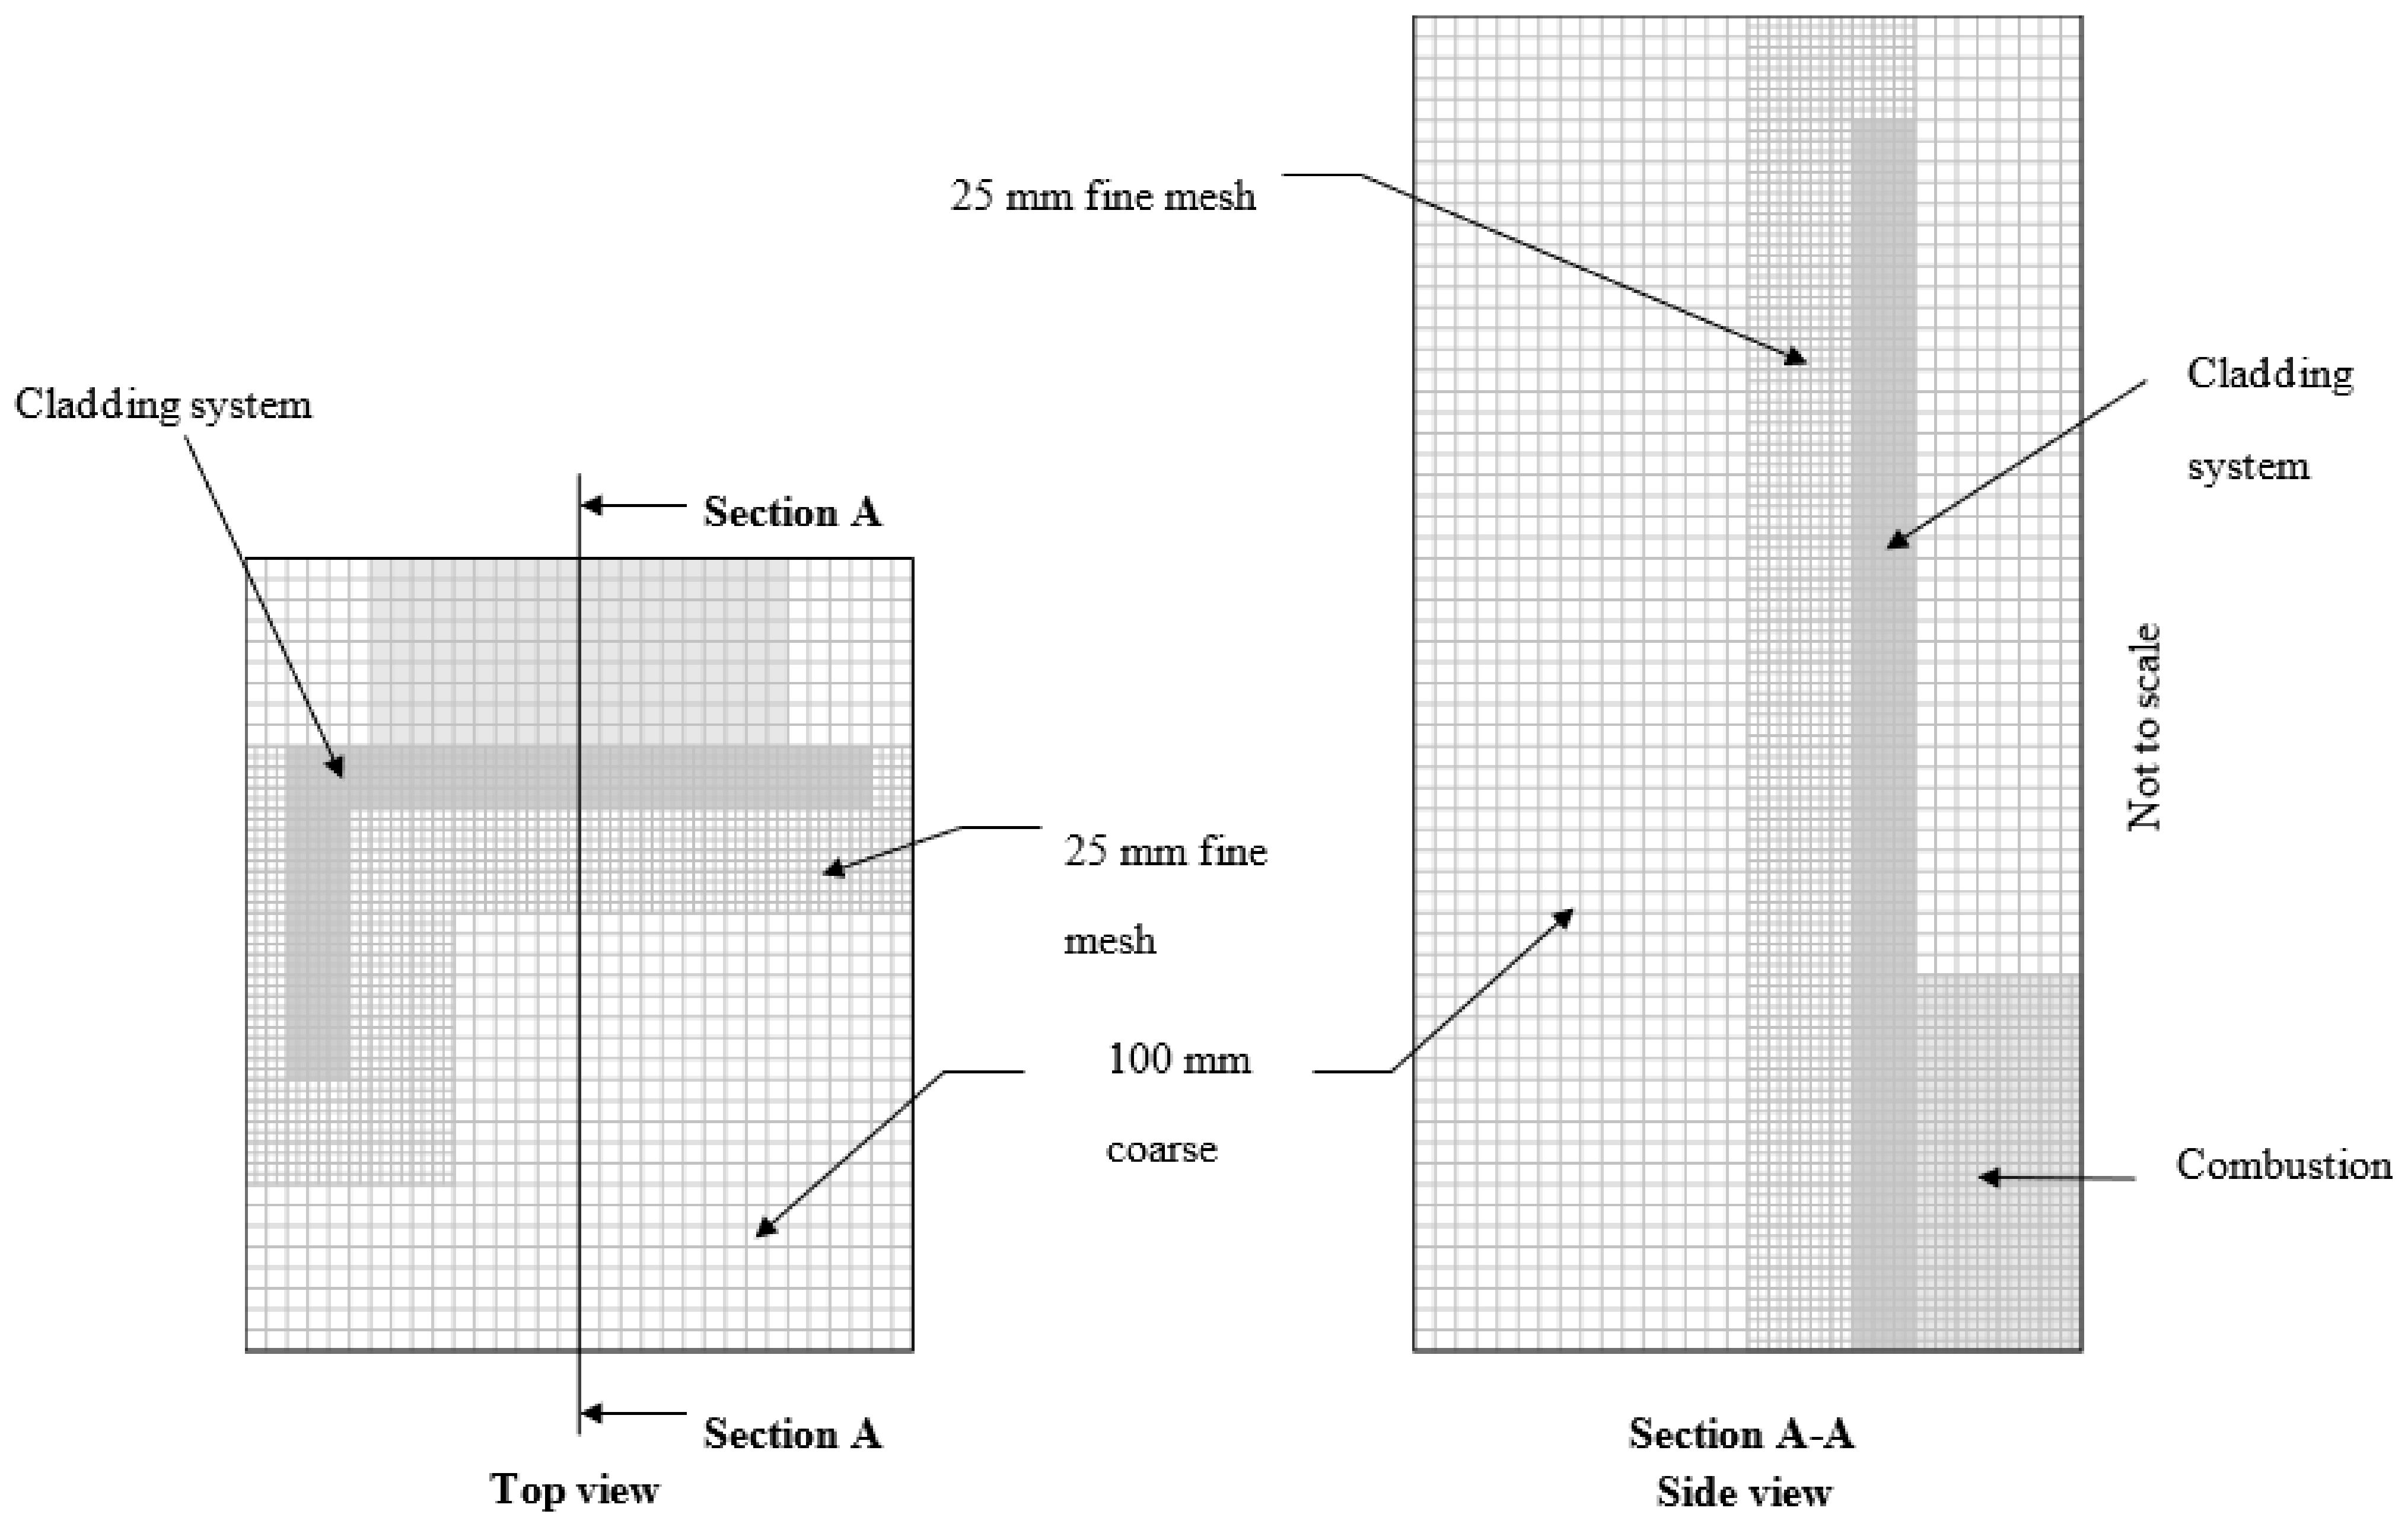
2.2.4. Grid Sensitivity

FDS validation research undertaken by the University of Canterbury determined that the nominated grid size in an FDS model can significantly impact the results depending on the modelled geometry [27]. Generally, fire and plume temperatures can be observed to become unreliable unless a fine grid is used in the immediate fire region. This finding is most relevant inside the proposed cladding system’s combustion chamber, where more accurate chamber temperatures can be expected to result in a more reasonable representation of the fire spread across the system. However, further away from the immediate fire location, a coarser grid size can be employed if necessary, as the results are less sensitive to the grid size in these areas [27]. Based on this understanding, the study recommends that the cell size within the immediate fire region should be approximately 1/10th of the characteristic fire diameter ( D * ) calculated using Equation (1).
D *   = Q ρ T c p g 2 / 5
where D * is the characteristic fire diameter (m), Q is the heat release rate of the fire (kW), ρ is the ambient air density (1.2 kg/m3), Cp is the specific heat capacity of air (1.0 kJ/kg.K), T is the ambient air temperature (293 K), and g is the gravitational acceleration (9.81 m/s2).
Using this equation, for a peak fire HRR of 3.5 MW, as required by the BS 8414.1 standards, a grid size of approximately 100 mm is considered appropriate in the fire region. However, as the reference system includes an important cavity gap size of a 50 mm depth, a 100 mm grid size would preclude the accurate analysis of such system parameters. On the other hand, utilising a fine grid size throughout would increase the computation time required to complete the necessary analysis. To reduce the computational requirements associated with finer grid models, the BS 8414.1 model developed included an optimised mesh approach that used a fine 25 mm grid size in the areas of interest, i.e., the internal layers within the cladding system and immediate surrounding space. In addition, a maximum grid size of 100 mm was adopted in the combustion chamber, which was expected to produce reasonable fire and plume temperatures in the surrounding outer regions away from the cladding system. It is worth mentioning that a 20 mm mesh size was also used in a previous study [22], although the thickness of the cladding was 4 mm.
As fire spread and heat transfer were measured only across and within a cladding system according to the testing standards, inaccuracies in the heat transfer between the cladding system boundaries and the outside space as a result of the grid-size resolution were not considered to negatively impact the results. Any loss of information between the fine and coarse grid cells was expected to be negligible, provided the immediate fire region was no larger than 1/10th of the characteristic diameter. The optimised mesh method is illustrated in Figure 5.

2.3. Numerical Model Validation with Test Data

A comparison was made between the temperature values of the numerical model and the experimental reference data. Overall, the numerical outputs produced comparable findings. The external thermocouples had a temperature threshold of 600 °C, whereas the internal thermocouples had a temperature threshold of 250 °C in the BS 8414 test. The test failed due to the central thermocouples (TC) of the main wall failing to reach their threshold temperature. As a result, the current sections mostly contrasted the central thermocouples’ (TC1028 and TC1029) output data for the numerical validation and subsequent parametric analysis. The comparative temperature values of the centrally positioned thermocouples of level 1 are shown in Figure 6a–d. The temperature data for level 2 are shown in Figure 7a–d. Finally, the visual observations obtained from the current model and the Dréan et al. [22] model are compared in Figure 8.

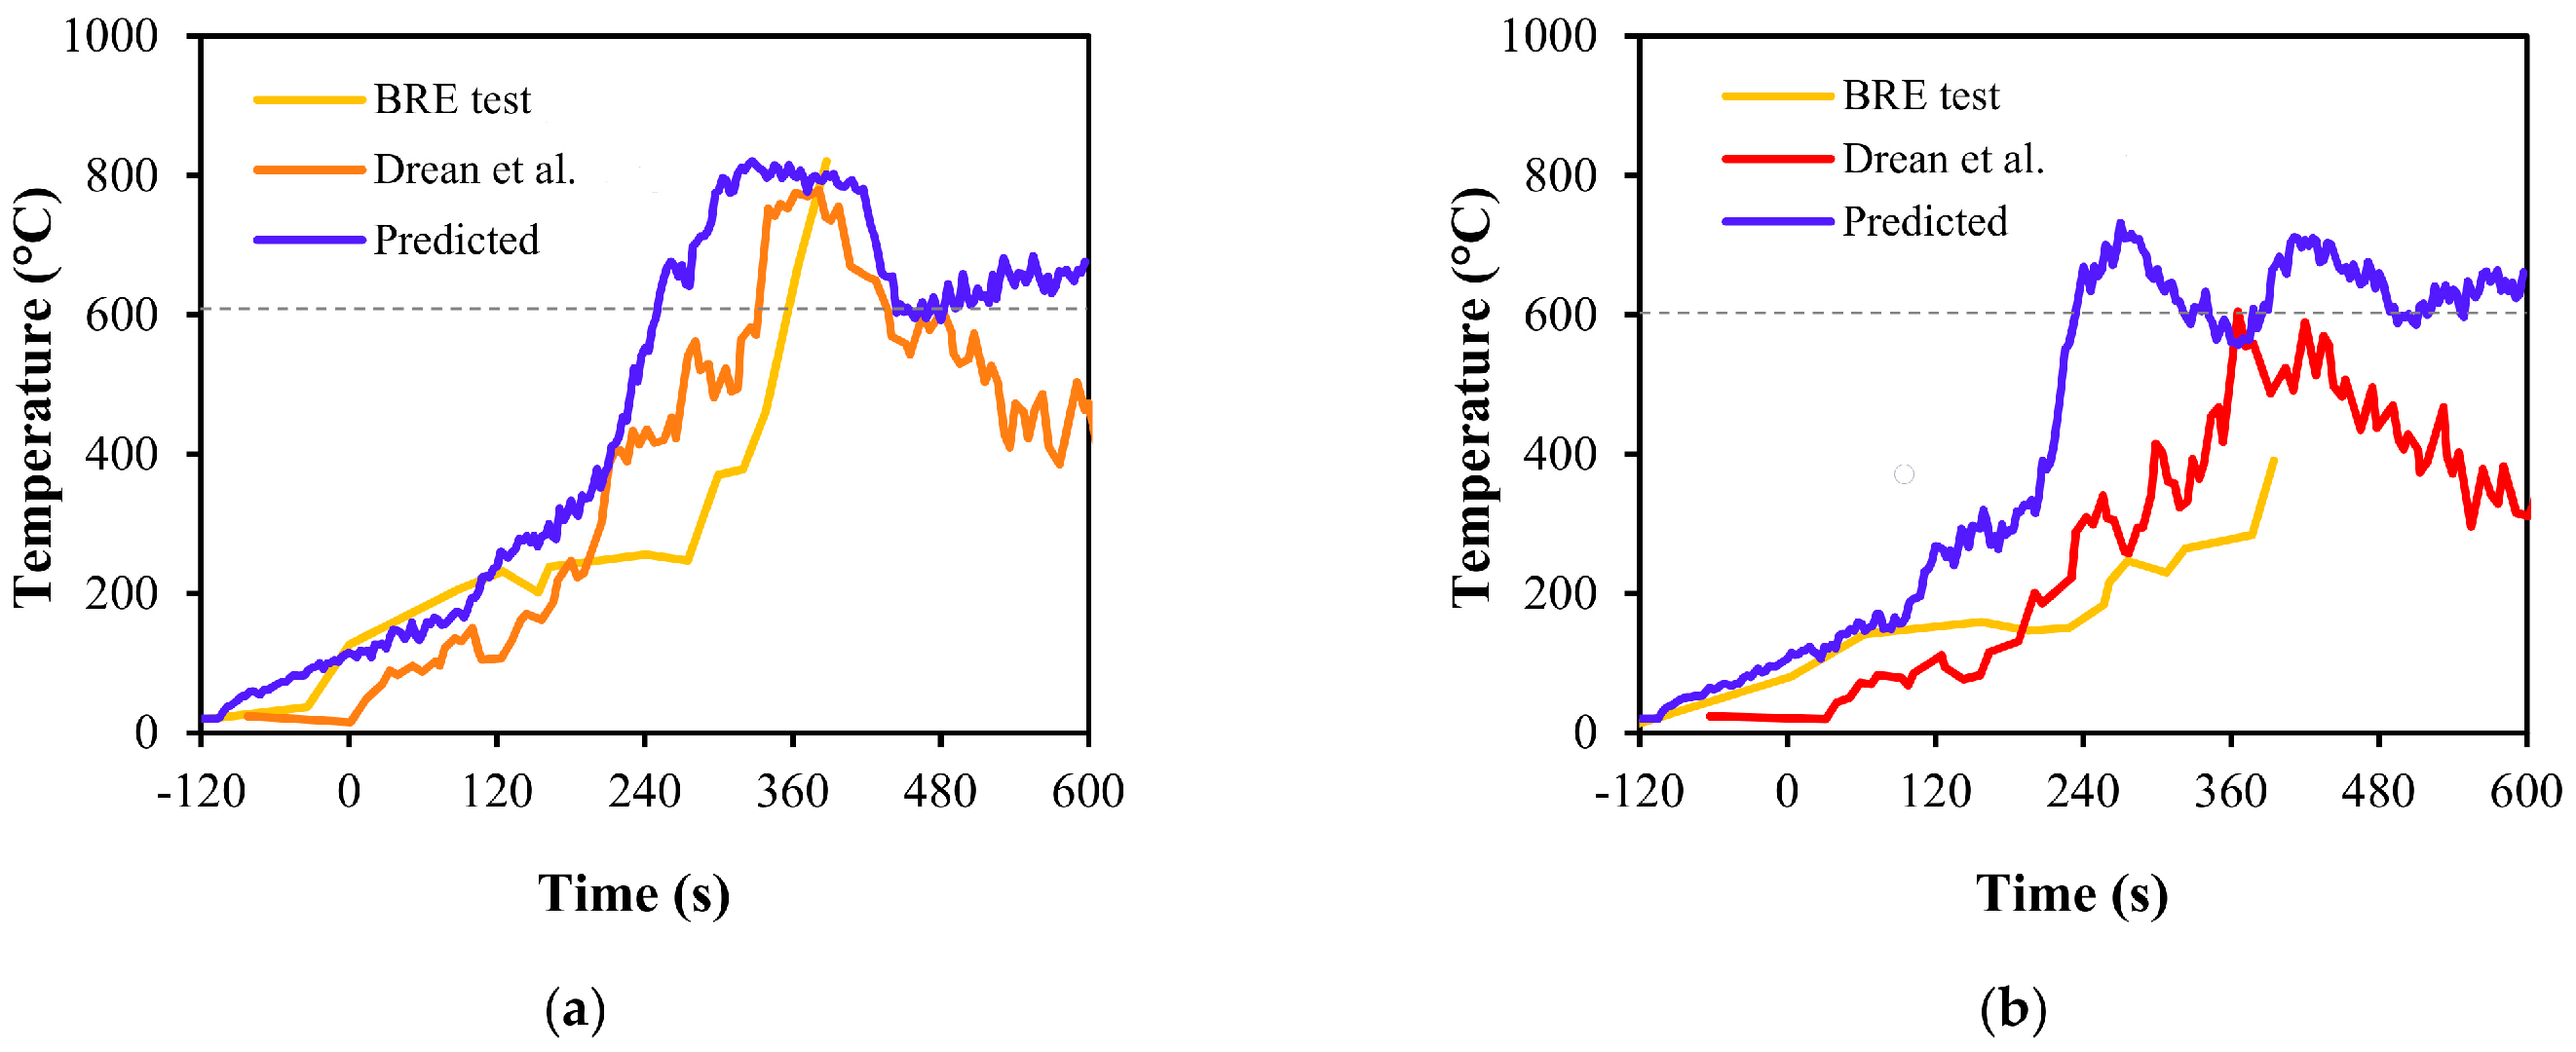
2.3.1. External Thermocouples at Level 1

The temperature curves of the four external thermocouples (TC1001, TC1003, TC1005, and TC1007) located at level 1 are reported in Figure 6a–d. The temperature curves obtained from the current study were compared with the BRE test results and the Dréan et al. [22] model results. Generally, a good correspondence was observed in the detectors closer to the centre of the main wall (TC 1003), with some deviations observed towards the edges of the system walls where the detectors were located, very close to the vertical cavity barriers, potentially resulting in some heat occlusion. The temperature reading for the TC1003 detector exceeded 600 °C between 162 and 228 s (2:42 to 3:48 min) in all three cases.

2.3.2. External Thermocouples at Level 2

Similar to level 1, a comparison of the temperature results of the four external thermocouples (TC1029, TC1035, TC1038, and TC2001) located at level 2 are shown in Figure 7a–d. The specimen was considered to have exceeded the failure criteria when the temperature exceeded the dotted grey line marked on the output graphs. As with the lower level, good correspondence was found in the detector closer to the centre line of the main wall (TC1029). It can be seen that the maximum temperature obtained from the current FDS model was similar to the BRE test data and the Drean et al. [22] model data. Although there was a difference for the other detectors, the trends were almost the same. It indicates that the developed FDS model can be used for further analysis and produce reasonably accurate results.

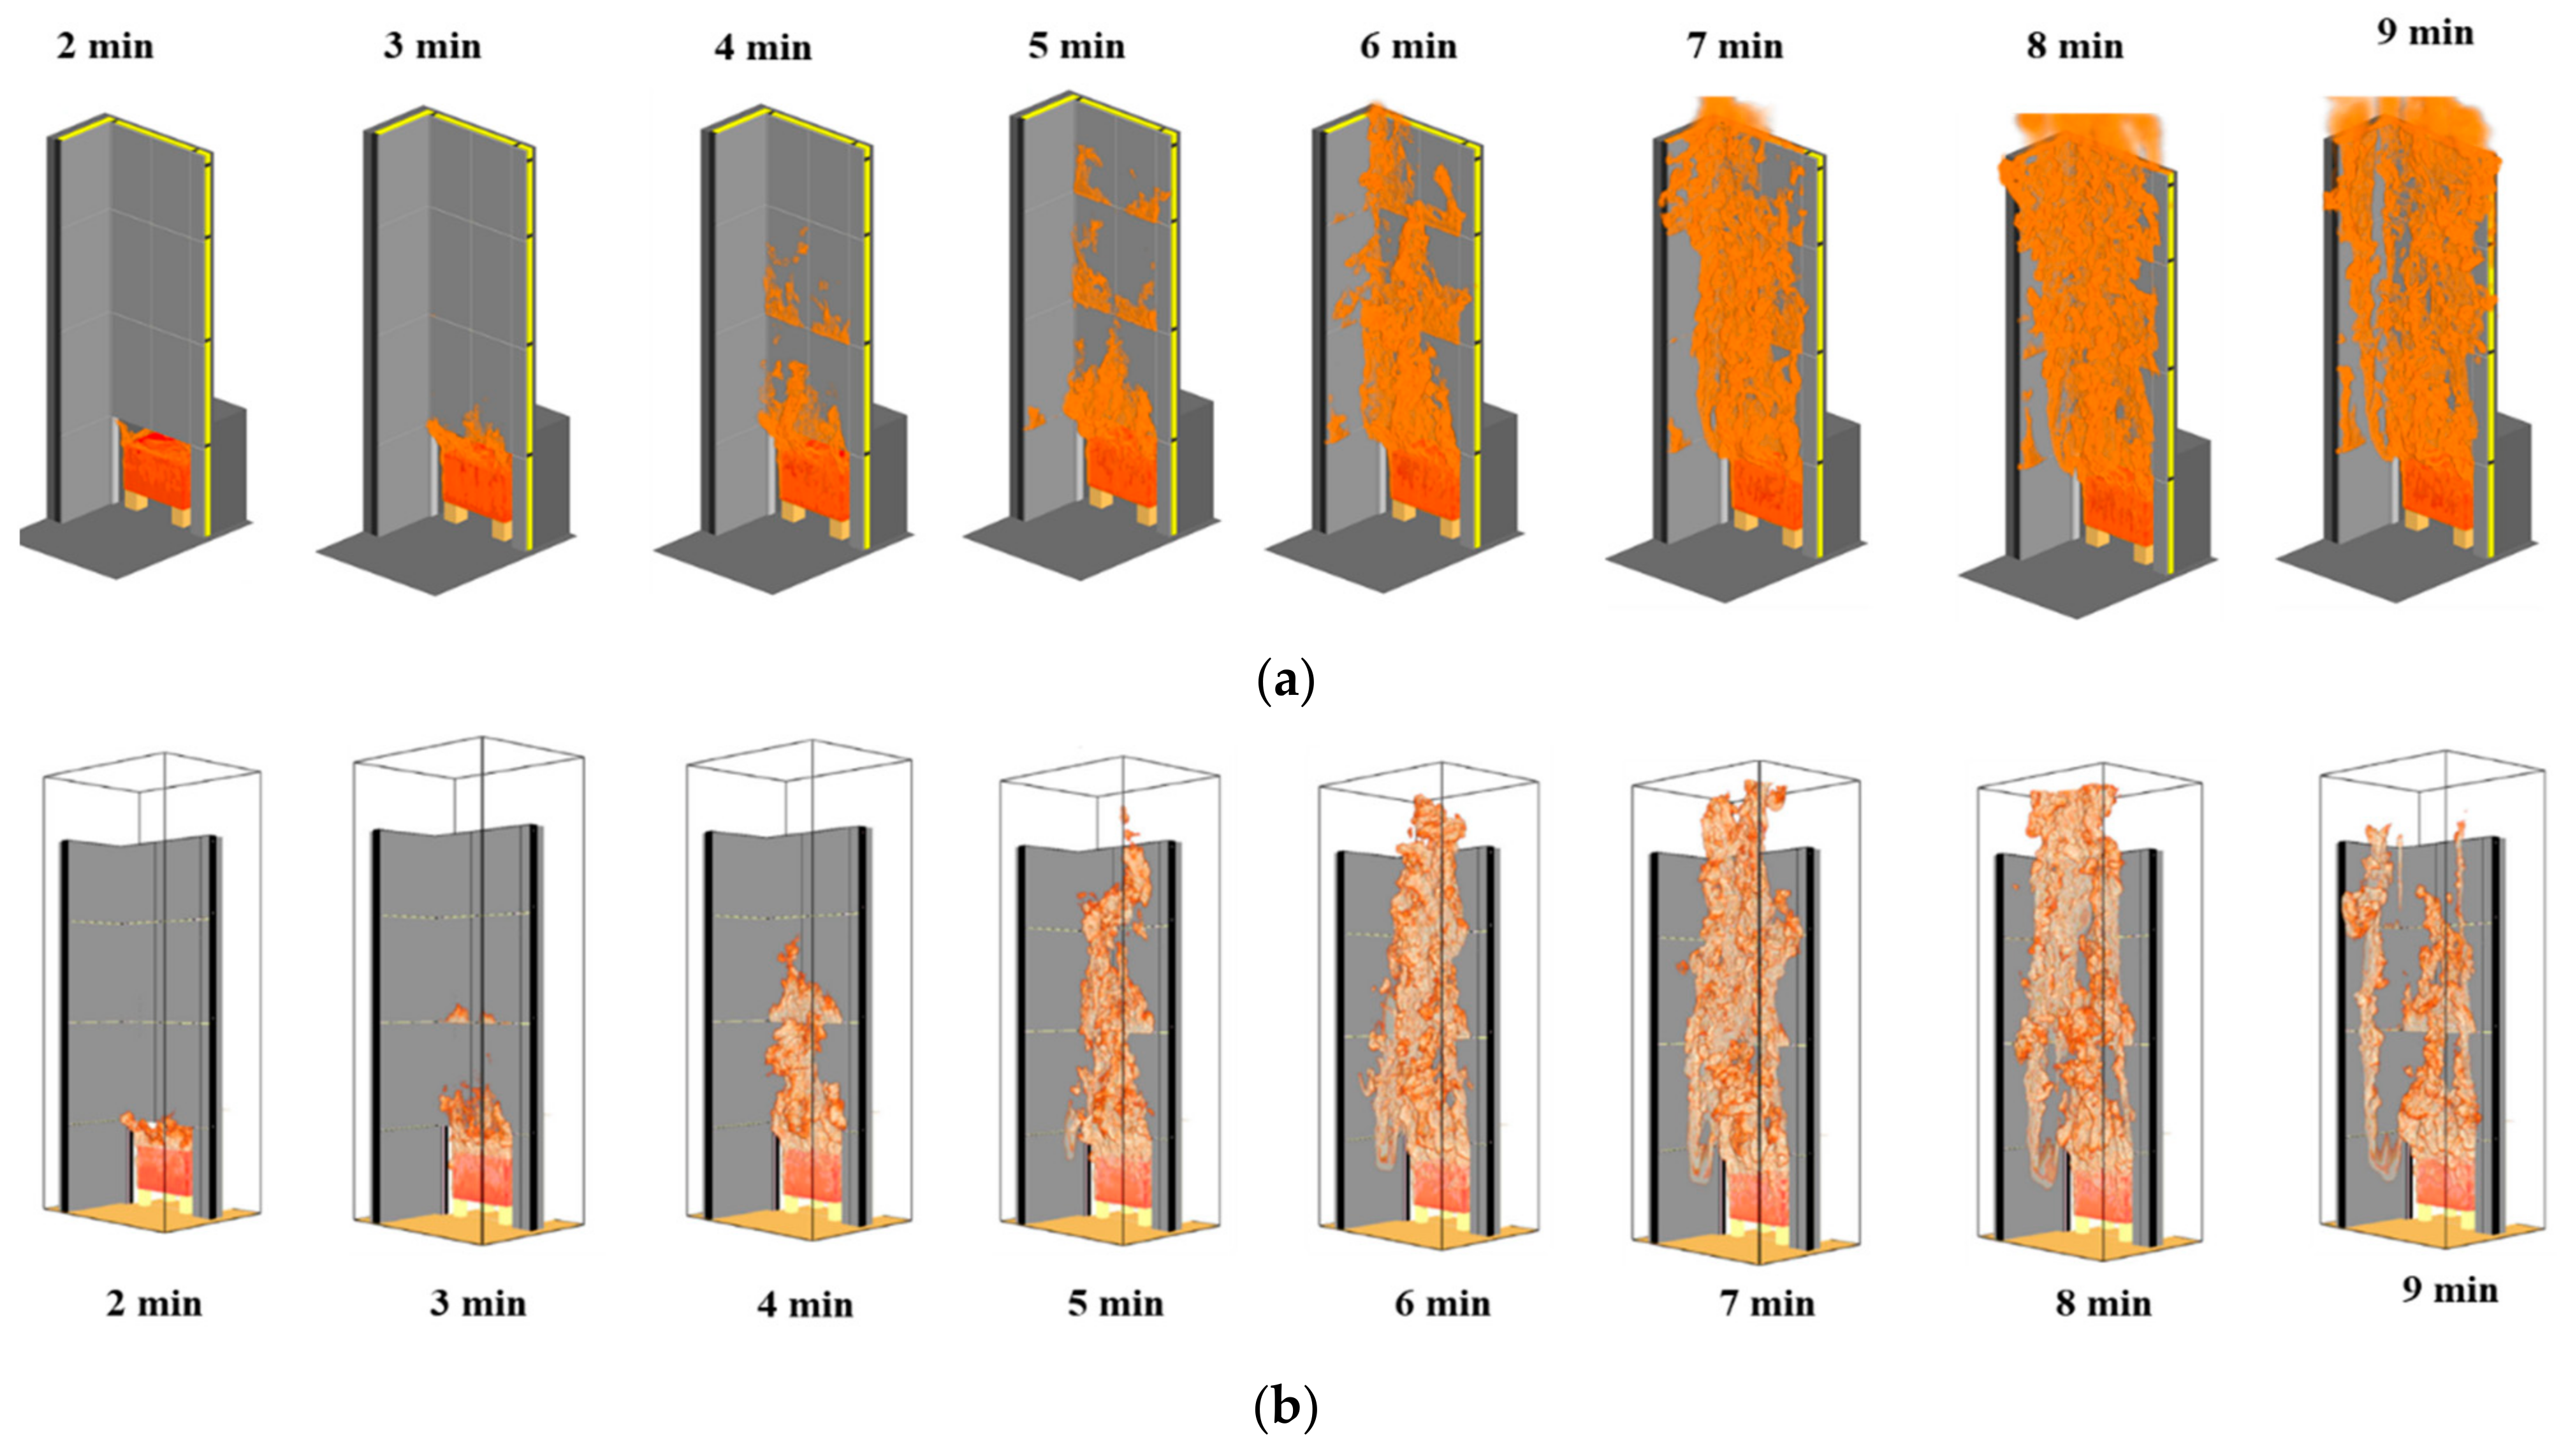
2.3.3. Visual Observation

The visual observation is presented in Figure 8 for the current FDS model and the Dréan et al. [22] model. The fire behaviour for the current FDS model can be seen in the minute intervals in Figure 8a. These results correspond well with those in Figure 8b for the Drean et al. [22] model. In both cases, fire began to spread vertically outside the chamber at 2 min, and the flames reached level 1 within 3 to 4 min. As the combustible ACP cladding was burning continuously in the vertical and horizontal directions, the flame reached level 2 and began to spread horizontally within 5 min. It can be seen that the flame spread beyond the testing rig, resulting in an automatic failure, and the flame continued to spread horizontally at 6 min and then intensified at level 2 at 7 min. After 8 min, the flames spread across the majority of the cladding system.

2.4. Parametric Analysis

The verified numerical model was used to conduct a parametric study to investigate the effects of the different parameters of ACP cladding systems. The main parameters that were considered in this study were the cavity barrier, size of the air-cavity gap, joining gap between the panels, and combustibility. Table 3 summarises the details of each model scenario used for the parametric study. The first model scenario (S1) was considered the base model, mainly considering the horizontal and vertical barriers with a 50 mm air-cavity gap. The second model scenario (S2) was the same as the S1 model but without cavity barriers in the horizontal and vertical directions. Three different sizes (25, 50, and 100 mm) of the air-cavity gap were investigated in model scenarios S3, S1, and S4, respectively. Model scenario S5 mainly presented a no-gap scenario between the panels. The S6 model scenario represented a non-combustible ACP panel. The effects of each parameter on the fire behaviour of the ACP cladding system are discussed in Section 3.

3. Results and Discussion

3.1. Effect of Cavity Barrier

Cavity barriers are introduced into external wall systems to limit fire spread within the internal space of the system in the event fire ignites or spreads into the system cavity. External fire spread across the face of the wall system is typically dependent on the combustibility of the outer façade material—in contrast, the geometry of the inner air-cavity void can potentially contribute to developing a passage with a chimney effect between the wall and the cladding, which can influence the vertical flame spread beyond what may be achieved via external flame spread alone. The impact of the cavity barrier on the vertical flame spread was analysed using the measured temperature value of the outer surface and inner cavity in the cladding system. The modelling results for the study are shown in Figure 9a,b. The findings demonstrate that the inner cavity temperature requires 300 s less to reach its peak when the cavity barriers are not considered in the cladding system (S2 scenario). The instant fuel supply from the flammable PIR insulation can be responsible for this earlier peak time and faster burnout time. However, as the internal fuel source was the same for the S1 and S2 scenarios, it showed nearly similar peak temperatures.
Figure 10a,b provide other evidence to support the reasons for these results. For the S1 scenario, only the external surface of the cladding system was exposed to the whole fire plume. In contrast, in scenario S2, the plume split and simultaneously spread into the internal cavity and onto the external surface. The splitting process caused a fractionation of the total heat output from the fire plume, which then spread to both parts of the test system (exterior and inner cavities). As a result, the time-to-peak temperature deviated significantly for these two scenarios (S1 and S2).

3.2. Effect of Air-Cavity Gap

The air-cavity layer forms the void inside the system between the insulation and the inner face of the ACP. Generally, it is understood that the greater the air-cavity gap, the greater the potential for a chimney effect should fire spread into a cladding system. The impact of a particular air-cavity size between the cladding systems was investigated using 25 mm, 50 mm, and 100 mm air-cavity gaps. Figure 11 illustrates the impact of air-cavity size on the external and internal temperatures in the S1, S3, and S4 scenarios. The air-cavity gaps ranging in size from 50 mm to 100 mm in scenarios S1 and S4 failed much quicker than the air cavity gap in scenario S3 with a size of 25 mm. Scenarios S1 and S4 failed for the internal temperature at 260 s. On the other hand, S3 took 305 s to fail. So, it can be seen that an air-cavity gap with a size between 50 and 100 mm was riskier than the other scenario with an air-cavity gap of 25 mm. The reason behind this could be that, as in S3, the air-cavity gap was narrow, and the presence of oxygen to burn up the fuel effectively may have been less. It can be assumed that the ‘equivalence ratio’ ( ) contained a lean situation ( < 1 ) . On the other hand, test scenario S4 had a higher cavity width so it created less pressure for the fire plume to stretch up and spread further. In the case of the HRR, the same trend can be seen in Figure 12, where the HRR was nearly 9.6 MW/m2 for the air cavity ranging from 50 to 100 mm. However, an HRR value below 8 MW/m2 was found for a 25 mm air-cavity gap size. As the HRR is related to the complete combustion and presence of oxygen, as well as the pressure from the fire plume stretching upwards, different HRR values were found for the different test scenarios.

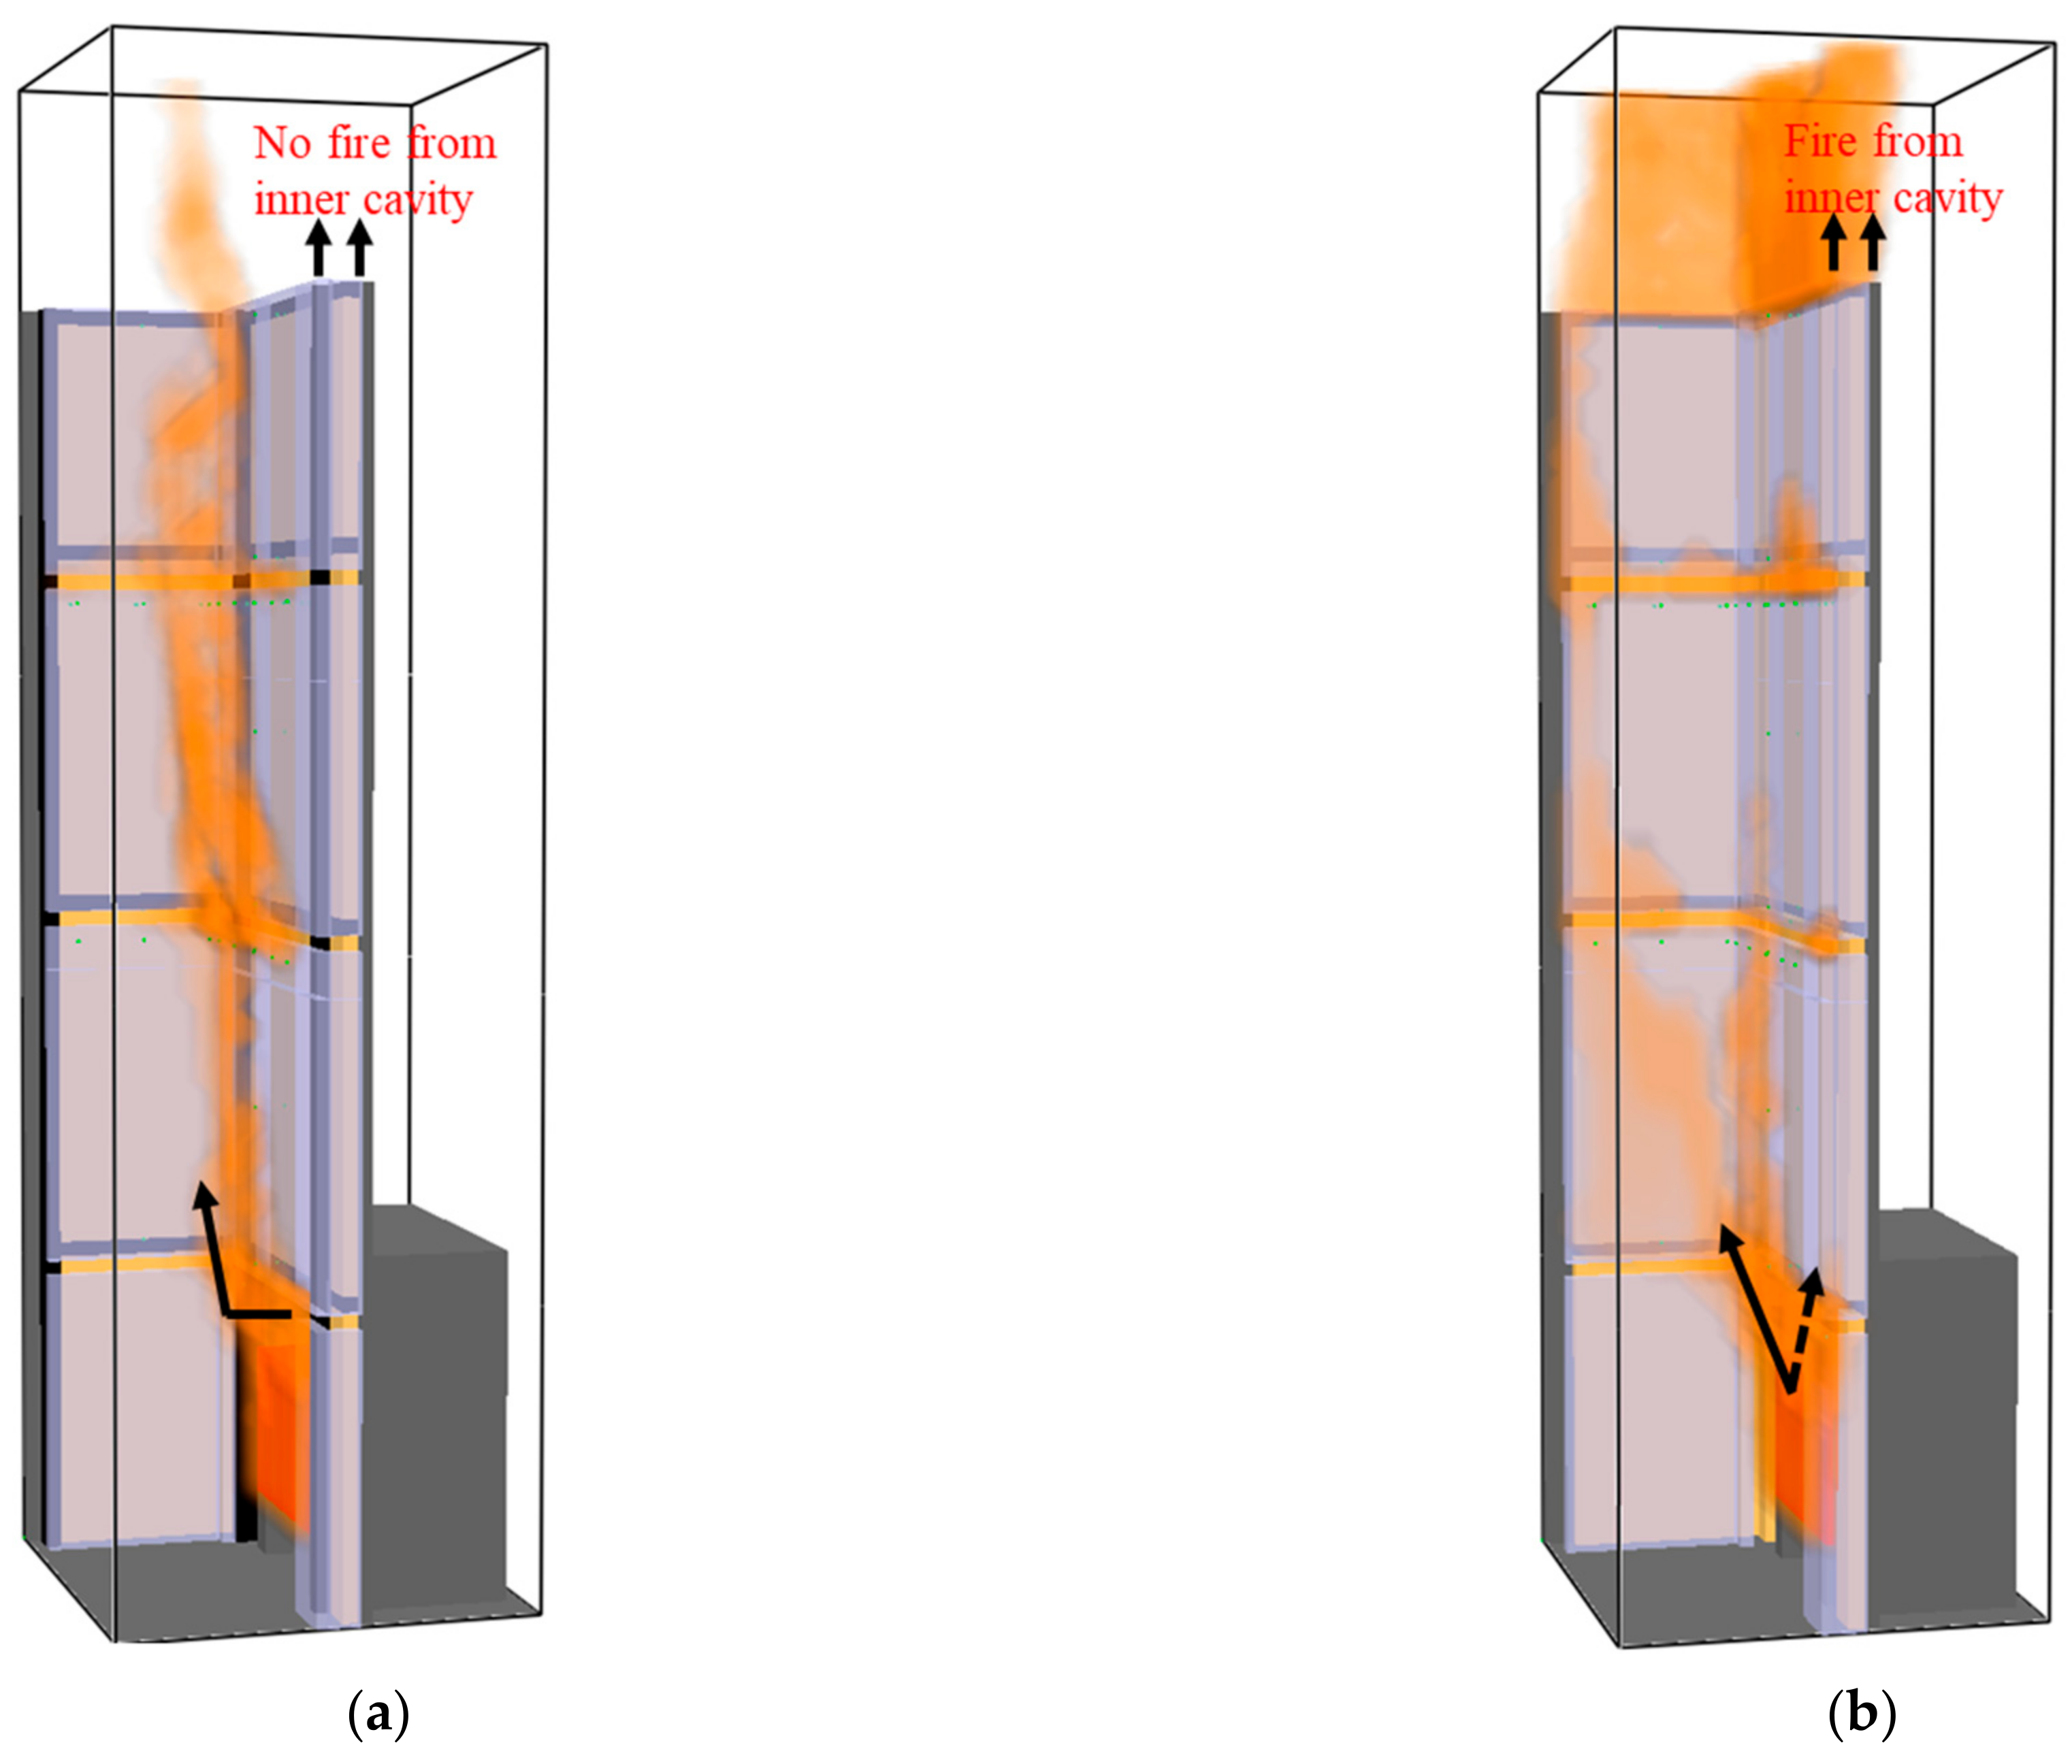
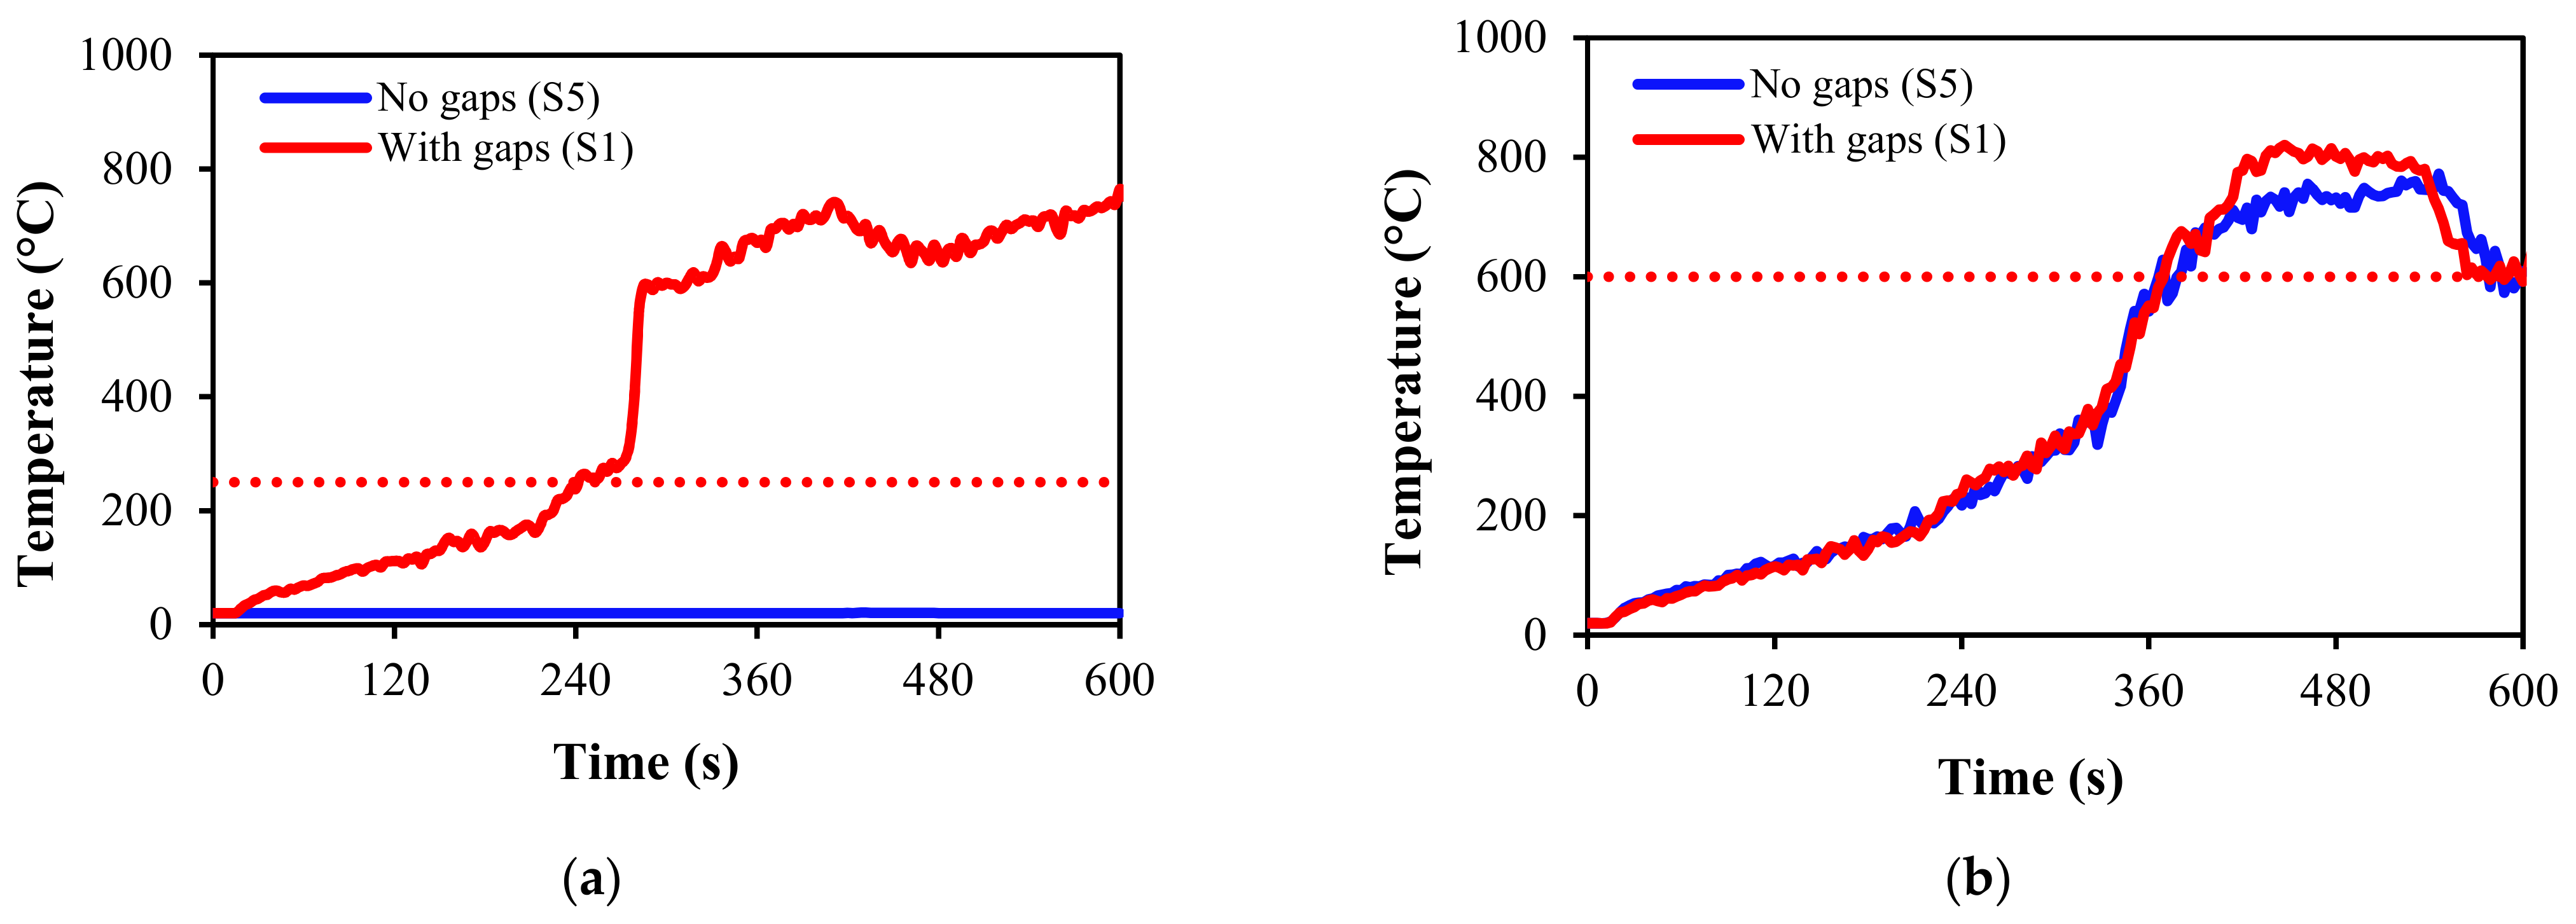
3.3. Effect of Joining Gaps between ACP Panels

Real-world cladding systems include gaps between the ACP panels to allow flexibility and moisture out of the system. These gaps can also be sealed with a caulk or sealant product to allow weatherproofing. The BRE-tested system incorporated 20 mm gaps between the ACP panels. It seemed that weatherproofing sealant was omitted in the BRE test during the construction of the ACP panels, which created a joining gap between the ACP panels. To understand the effects of the joining gaps, two scenarios (S1 and S5) were investigated. Figure 13 shows the results demonstrating the effect of the joining gaps of the panels on the internal and external temperatures. The internal cavity temperature showed significant differences between the S1 and S5 scenarios. The peak temperature value was greater than 700 °C for the S1 scenario compared to the S5 scenario, showing the system’s ambient temperature. However, minor differences in the peak temperature were found in the case of the external surface temperature for the S1 and S5 scenarios (Figure 13b). In both these scenarios, system failure occurred at nearly the same time at 370 s according to the testing standard criteria.
A significant variance was observed in the internal air cavity mid-depth temperatures, as shown in Figure 13a, which shows that the S1 scenario exceeded 250 °C by 243 s, whereas the no-gap variation never approached this limit within the 600 s simulation time (Figure 13a). A sectional slice of the air cavity mid-depth is shown in Figure 14a for the S1 scenario and in Figure 14b for the S5 scenario. It can be seen that for the S5 scenario with no ACP gap, temperatures within the cavity remained at ambient conditions. This phenomenon reflects that no flame or hot gasses were able to penetrate through the air cavity in the S5 system with no panel gaps, where internal temperatures remained relatively constant (ambient conditions) for the full duration of the test (Figure 14b). On the other hand, the base case scenario (S1), where the air cavity mid-depth temperatures rose at a similar rate to those of the external surface once flames began to spread vertically across the system (Figure 14a). Based on these results, it can be concluded that a cladding system with no gaps between the ACP panels is unlikely to exceed the internal temperature performance criteria of 250 °C.
This is a predictable conclusion as the model represented an idealised system where heat spread can only occur via the gaps (Figure 15a) or through conduction (Figure 15b) that form as the various layers combust and delaminate. Considering the excellent thermal insulation properties of the PE, it is not entirely unexpected for the conditions in the inner layer to remain close to ambient. A logical assumption can be made that the combustibility of the ACP itself primarily impacts the flame spread across the external face of the cladding system. This assumption is considered as part of the combustibility investigation in the following section.

3.4. Effect of Combustible Cladding

A comparative analysis was undertaken of the 100% combustible ACP cladding materials (100% PE core) in scenario S1 and the 100% non-combustible ACP cladding materials (aluminium only) in scenario S6. It can be seen that the external temperature criteria were exceeded for scenario S1 after approximately 360 s, as shown in Figure 16b. This can potentially be attributed to the unprotected cladding air gaps and the combustible nature of the cladding panels. In comparison, the S6 scenario demonstrates that the non-combustible system does not fail at the external temperature criteria within the 600 s test time. This is possibly due to the non-combustible nature of the cladding. The primary flame spread over the exterior of the samples was a result of the fire load in the chamber. However, the internal cavity temperature was demonstrated to reach the failure criterion for both systems at 240 s and 350 s for the S1 and S6 scenarios, respectively, as shown in Figure 16a. This could be because of the heat feedback from the fire and the high thermal conductivity of the aluminium sheets.
The fire spread in minute intervals is shown in Figure 17a for the combustible ACP cladding (S1) and in Figure 17b for the non-combustible ACP cladding (S6). It can be seen that the flame reached out at level 1 within 4 min for the combustible ACP cladding, which similarly occurred for the non-combustible ACP cladding at around 6 min. For S1, the flame reached level 2 and began to spread horizontally within 6 min. Significantly less flame spread occurred at 6 min for the non-combustible ACP cladding.

4. Conclusions

This study investigated the influencing factors of the rapid fire spread of ACPs. A computational fluid dynamics (CFD) model was constructed in the fire dynamics simulator (FDS) model and validated with experimental data from the BRE cladding fire test. A set of seven parametric scenarios with four distinct parameters, i.e., cavity barrier, air-cavity gap, panel mounting (with and without joining gaps between the panels), and material combustibility qualities, were created. The main conclusions from this study are summarised as follows:
  • In order to acquire a conservative fire risk estimate during full-scale testing, cavity barriers need to be installed. The exterior temperature test output displayed fewer conservative values without a cavity barrier than it did with a barrier.
  • Due to the effective chimney effect, air cavities between 50 and 100 mm demonstrated a greater potential for rapid fire propagation. Therefore, these parameters can be used as a conservative assembly setup for testing purposes.
  • The joining between the cladding panels can act as a vehicle for rapid fire spread, especially through the internal cavity.
  • The external temperature criteria for accessing the failure criterion of the ACPs were found to be more consistent with different parametric variables so this needs to be given more importance during fire test assessments.

Author Contributions

Conceptualisation, M.K.H.; Formal analysis, M.K.H. and M.G.; Investigation, M.G.; Methodology, M.K.H., M.D.H. and S.S.; Resources, M.K.H. and P.R.; Supervision, M.K.H., M.D.H. and S.S.; Visualization, M.D.H.; Writing—original draft, M.K.H. and M.D.H.; Writing—review and editing, M.G., P.R., G.D., S.P. and S.S. All authors have read and agreed to the published version of the manuscript.

Funding

This research received no external funding.

Conflicts of Interest

There are no conflict of interest.

References

  1. Hossain, M.D.; Hassan, M.K.; Yuen, A.C.Y.; He, Y.; Saha, S.; Hittini, W. Flame behaviour, fire hazard and fire testing approach for lightweight composite claddings—A review. J. Struct. Fire Eng. 2021, 12, 257–292. [Google Scholar] [CrossRef]
  2. Hossain, M.D.; Saha, S.; Hassan, M.K.; Yuen, A.C.Y.; Wang, C.; Hittini, W.; George, L.; Wuhrer, R. Testing of aluminium composite panels in a cone calorimeter: A new specimen preparation method. Polym. Test. 2022, 106, 107454. [Google Scholar] [CrossRef]
  3. White, N.; Delichatsios, M. Fire Hazards of Exterior Wall Assemblies Containing Combustible Components; Springer: Cham, Switzerland, 2015. [Google Scholar]
  4. Chen, T.; Yuen, A.; Yeoh, G.; Yang, W.; Chan, Q. Fire risk assessment of combustible exterior cladding using a collective numerical database. Fire 2019, 2, 11. [Google Scholar] [CrossRef]
  5. Hossain, M.D.; Hassan, M.K.; Akl, M.; Pathirana, S.; Rahnamayiezekavat, P.; Douglas, G.; Bhat, T.; Saha, S. Fire Behaviour of Insulation Panels Commonly Used in High-Rise Buildings. Fire 2022, 5, 81. [Google Scholar] [CrossRef]
  6. Hossain, M.D.; Saha, S.; Hassan, M.K.; Yuen, A.C.Y.; Wang, C.; Hittini, W. Influencing factors in small-scale fire testing of aluminium composite panels. In Proceedings of the 12th Asia-Oceania Symposium on Fire Science and Technology (AOSFST), Brisbane, Australia, 7–9 December 2021. [Google Scholar]
  7. Genco, G. Lacrosse Building Fire Report, 2015. Available online: https://www.melbourne.vic.gov.au/sitecollectiondocuments/mbs-report-lacrosse-fire.pdf (accessed on 22 May 2022).
  8. Bisby, L.A. Grenfell Tower Inquiry: Phase 1—Final Expert Report; Grenfell Tower Enquiry: London, UK, 2018. [Google Scholar]
  9. NFPA 285; Standard Fire Test Method for Evaluation of Fire Propagation Characteristics of Exterior Non-Load-Bearing Wall Assemblies Containing Combustible Components. National Fire Protection Association: Quincy, MA, USA, 2019.
  10. ISO 13785-2:2002; Reaction-to-Fire Tests for Façades—Part 2: Large-Scale Test. ESA: Addis Abeba, Ethiopia, 2002.
  11. BS 8414-1; Fire Performance of External Cladding Systems. Test Methods for Non-Loadbearing External Cladding Systems Applied to the Face of a Building. British Standard: London, UK, 2002.
  12. AS 5113:2016; Fire Propagation Testing and Classification of External Walls of Buildings. Standards Australia: Sydney, Australia, 2016.
  13. Schulz, J.; Kent, D.; Crimi, T.; Glockling, J.L.; Hull, T.R. A Critical Appraisal of the UK’s regulatory regime for combustible façades. Fire Technol. 2021, 57, 261–290. [Google Scholar] [CrossRef]
  14. Čolić, A.; Pečur, I.B. Influence of Horizontal and Vertical Barriers on Fire Development for Ventilated Façades. Fire Technol. 2020, 56, 1725–1754. [Google Scholar] [CrossRef]
  15. Sharma, A.; Mishra, K.B. Experimental investigations on the influence of ‘chimney-effect’on fire response of rainscreen façades in high-rise buildings. J. Build. Eng. 2021, 44, 103257. [Google Scholar] [CrossRef]
  16. Agarwal, G. Research Technical Report: Evaluation of the Fire Performance of Aluminum Composite Material (ACM) Assemblies Using ANSI/FM 4880; FM Global: Norwood, MA, USA, 2017. [Google Scholar]
  17. DCLG. DCLG, BS 8414-1:2015 + A1:2017 Test Referred to as DCLG Test 1, BRE Global, 2017. Available online: https://www.nfpa.org/-/media/Files/News-and-Research/Publications-and-media/NFPA-Journal/2017/September-October-2017/BRE-test.ashx (accessed on 22 June 2022).
  18. Heat Conduction in Pyrosim. Available online: https://support.thunderheadeng.com/tutorials/pyrosim/heat-conduction/ (accessed on 20 July 2022).
  19. Chaudhari, D.M.; Stoliarov, S.I.; Beach, M.W.; Suryadevara, K.A. Polyisocyanurate Foam Pyrolysis and Flame Spread Modeling. Appl. Sci. 2021, 11, 3463. [Google Scholar] [CrossRef]
  20. Bonner, M.; Rein, G. Flammability and multi-objective performance of building façades: Towards optimum design. Int. J. High-Rise Build. 2018, 7, 363–374. [Google Scholar]
  21. Dréan, V.; Girardin, B.; Guillaume, E.; Fateh, T. Numerical simulation of the fire behaviour of facade equipped with aluminium Composite material-based claddings—Model validation at intermediate scale. Fire Mater. 2019, 43, 839–856. [Google Scholar] [CrossRef]
  22. Dréan, V.; Girardin, B.; Guillaume, E.; Fateh, T. Numerical simulation of the fire behaviour of facade equipped with aluminium composite material-based claddings—Model validation at large scale. Fire Mater. 2019, 43, 981–1002. [Google Scholar] [CrossRef] [Green Version]
  23. Lyon, R.; Janssens, M. DOT/FAA/AR-05/14; Polymer Flammability. National Technical Information Service: Springfield, VA, USA, 2005.
  24. Purser, D.A. Toxic combustion product yields as a function of equivalence ratio and flame retardants in under-ventilated fires: Bench-large-scale comparisons. Polymers 2016, 8, 330. [Google Scholar] [CrossRef] [PubMed]
  25. Marquis, D.M.; Hermouet, F.; Guillaume, É. Effects of reduced oxygen environment on the reaction to fire of a poly (urethane-isocyanurate) foam. Fire Mater. 2017, 41, 245–274. [Google Scholar] [CrossRef]
  26. EN 1999-1-2; Eurocode 9—Design of Aluminium Structures—Part 1–2: Structural Fire Design. European Committee for Standardization: Brussels, Belgium, 2007.
  27. Petterson, N.M. Assessing the Feasibility of Reducing the Grid Resolution in FDS Field Modelling; University of Cantenbury: Christchurch, New Zealand, 2002. [Google Scholar]
Figure 1. Experimental setup using BS 8414.1 standards for the test of the full-scale ACP cladding system [3,17]. (a) Test rig, (b) Location of thermocouples.
Fire 05 00149 g001
Figure 2. Configuration details of FDS model developed in accordance with BS 8414-1 standard.
Fire 05 00149 g002
Figure 3. (a,b) Levels and locations of thermocouples used in the FDS model.
Fire 05 00149 g003
Figure 4. (a) Test setup with non-combustible wall (grey), wood crib (red), and (b) HRR verification for the BS 8414-1 wood crib.
Fire 05 00149 g004
Figure 5. Optimised mesh approach for modelling—indicative only.
Fire 05 00149 g005
Figure 6. Comparison of test and predicted temperatures of centrally positioned thermocouples at level 1. (a) TC 1001 at level 1, (b) TC 1003 at level 1, (c) TC 1005 at level 1, (d) TC 1007 at level 1 [17,22].
Fire 05 00149 g006
Figure 7. Comparison of test and predicted temperatures of centrally positioned thermocouples at level 2. (a) TC 1029 at level 2, (b) TC 1035 at level 2, (c) TC 1038 at level 2, (d) TC 2001 at level 2 [17,22].
Fire 05 00149 g007aFire 05 00149 g007b
Figure 8. Visual observations of numerical simulation of full-scale cladding test. (a) Results obtained from the current FDS model. (b) Results obtained from the Drean et al. [22] model.
Fire 05 00149 g008
Figure 9. Effect of cavity barrier (a) internal temperature; (b) external temperature.
Fire 05 00149 g009
Figure 10. Effect of cavity barrier under full-scale test (BS 8414-1) fire simulation. (a) With cavity barrier at 400 s (scenario S1), (b) Without cavity barrier at 400 s (scenario S2).
Fire 05 00149 g010
Figure 11. Air-cavity effect on (a) internal temperature and (b) external temperature.
Fire 05 00149 g011
Figure 12. Effect of air cavity on HRR.
Fire 05 00149 g012
Figure 13. Effect of joining gaps of the panels on (a) internal temperature and (b) external temperature.
Fire 05 00149 g013
Figure 14. Air-cavity temperature distribution for gap and no-gap scenarios. (a) S1 model with ACP gaps, (b) S5 model with no ACP gaps.
Fire 05 00149 g014
Figure 15. Flame spread after 6 min for gap and no-gap scenarios. (a) S1 model with ACP gaps, (b) S5 model with no ACP gaps.
Fire 05 00149 g015
Figure 16. Effect of combustibility on (a) Internal temperature (b) External temperature.
Fire 05 00149 g016
Figure 17. Fire spread of the cladding system (a) combustible cladding (S1) (b) non-combustible cladding (S6).
Fire 05 00149 g017
Table 1. Different sub-models and meshes used in the FDS of the ACP cladding system.
ItemDescription
Pyrolysis modelOne-step decomposition reaction (Arrhenius equation)
Virgin Char + Pyrolyzate
Combustion modelEddy dissipation concept model (EDC)
Infinitely fast chemical reaction
For global combustion reaction
Radiation modelFinite volume method (FVM), 100 discrete angles
Xrad, burner = 0.3
Turbulence modelDeardorff model
Convection model q ˙ c = h T g T w
h = max C T g T w 1 3 , k L Nu , k δ n 2
Meshing25 mm (material zones) and 50–100 mm (remote zones)
Table 2. Thermal properties used in the FDS model.
MaterialsInput PropertiesRef.
Cp
(kJ/kg.K)
k
(W/m.K)
ρ
(Kg/m3)
ΔHc
(kJ/kg)
ε
Polyethylene3.00.381360.04.35 × 1040.92[20,21,22,23]
PIR1.10.04836.02.63 × 1041[19,20,21,22,23]
Aluminium0.9299196.32700-0.7[21,24]
Concrete1.041.82280-0.9[21,22]
Note: Specific heat = Cp; Conductivity = K; Density = ρ; Heat of combustion = ΔHc; Emissivity = ε.
Table 3. Numerical simulation scenarios and parametric configurations.
Scenario NoJoining Gap between PanelsCavity BarrierAir CavityMaterial CombustibilityFire Load
VerticalHorizontal
S125 mmYesYes50 mm100%3.5 MW
S225 mmNoNo50 mm100%3.5 MW
S325 mmYesYes25 mm100%3.5 MW
S425 mmYesYes100 mm100%3.5 MW
S5No *YesYes50 mm100%3.5 MW
S625 mmYesYes50 mm0%3.5 MW
Note: * no joints between panels.
Publisher’s Note: MDPI stays neutral with regard to jurisdictional claims in published maps and institutional affiliations.

