Article

Meteorological Conditions Associated with Lightning Ignited Fires and Long-Continuing-Current Lightning in Arizona, New Mexico and Florida

by
Francisco J. Pérez-Invernón
1,*,†,
Heidi Huntrieser
1 and
Jose V. Moris
2
1
Deutsches Zentrum für Luft- und Raumfahrt, Institut für Physik der Atmosphäre, Oberpfaffenhofen, 51147 Weßling, Germany
2
Department of Agricultural, Forest and Food Sciences (DISAFA), University of Torino, Largo Paolo Braccini 2, 10095 Grugliasco, Italy
*
Author to whom correspondence should be addressed.
Current address: Instituto de Astrofísica de Andalucía (IAA-CSIC), Glorieta de la Astronomía, s/n, 18008 Granada, Spain.
Submission received: 24 May 2022 / Revised: 5 July 2022 / Accepted: 6 July 2022 / Published: 11 July 2022
(This article belongs to the Section Fire Science Models, Remote Sensing, and Data)

Abstract

:
Lightning is the main precursor of wildfires in Arizona, New Mexico, and Florida during the fire season. Forecasting the occurrence of Lightning-Ignited Wildfires (LIW) is an essential tool to reduce their impacts on the environment and society. Long-Continuing-Current (LCC) lightning is proposed to be the main precursor of LIW. The long-lasting continuing current phase of LCC lightning is that which is more likely to ignite vegetation. We investigated the meteorological conditions and vegetation type associated with LIW and LCC lightning flashes in Arizona, New Mexico, and Florida. We analyzed LIW between 2009 and 2013 and LCC lightning between 1998 and 2014 and combined lightning and meteorological data from a reanalysis data set. According to our results, LIW tend to occur during dry thunderstorms with a high surface temperature and a high temperature gradient between the 700 hPa and the 450 hPa vertical levels for high-based clouds. In turn, we obtained a high lightning-ignition efficiency in coniferous forests, such as the ponderosa pine in Arizona and New Mexico and the slash pine in Florida. We found that the meteorological conditions that favor fire ignition and spread are more significant in Florida than in Arizona and New Mexico, while the meteorological conditions that favor the occurrence of LIW in Arizona and New Mexico are closely related with the meteorological conditions that favor high lightning activity. In turn, our results indicate high atmospheric instability during the occurrence of LIW. Our findings suggest that LCC (>18 ms) lightning tends to occur in thunderstorms with high relative humidity and ice content in the clouds, and with low temperature in the entire troposphere. Additionally, a weak updraft in the lower troposphere and a strong one in the upper troposphere favor the occurrence of LCC (>18 ms) lightning. We found that the meteorological conditions that favor the occurrence of LCC (>18 ms) lightning are not necessarily the preferential meteorological conditions for LIW.

1. Introduction

Lightning is the main precursor of natural wildfires in the Continental United States (CONUS), while human-caused fires represent 80% of the total burned area [1]. Lightning dominated as the cause of ignition in Arizona, New Mexico, and Florida (the areas studied in this work) in spring and in summer, between 1992 and 2012 [1]. Investigating the characteristics of thunderstorms and lightning that produce fires is essential to the improvement of fire forecasting methods. The National Interagency Coordination Center (NICC) at the National Interagency Fire Center provides daily to seasonal fire forecasting reports. Their predictive services include fire and weather forecasting, fuel and fire danger, and fire activity and firefighting asset intelligence. A lightning forecast is provided by the National Severe Storms Laboratory with the use of machine learning and a 3D cloud model called the Collaborative Model for Multiscale Atmospheric Simulation (COMMAS) [2] in order to investigate the full life cycle of thunderstorms. However, there are still important questions about the conditions that favor the occurrence of Lightning-Ignited Wildfires (LIW) in the mentioned areas.
The relationship between lightning and LIW has been widely investigated by several studies (e.g., [3,4,5,6,7,8,9,10,11,12,13,14,15,16,17]). It is currently accepted that the process involved in the formation of LIW is composed of three phases, i.e., ignition (fire triggering), survival (smoldering), and arrival (flaming combustion) [4]. The ignition phase is supposed to be influenced by the characteristics of the lightning discharge and the vegetation. Long-Continuing-Current (LCC) lightning with a duration between 40 ms and 282 ms have been proposed as the main precursors of LIW [18,19,20,21]. LCC lightning flashes transport a significant amount of electrical charge between the cloud and the attachment point. The evolution of the survival and arrival phases are determined by fuel type and availability as well as by meteorological conditions such as precipitation and wind speed [15,22,23,24,25]. Thunderstorms with a total precipitation a little below 2.5 mm, commonly called dry thunderstorms, may be significant precursors of LIW [22]. Regarding the type of vegetation that favors the occurrence of LIW, themajority of wildfires tend to occur in forests of coniferous tree species [23,26,27,28,29]. For example, Müller et al. (2013) [28] reported that about 80% of all the LIW in the Alps occurred in pure coniferous stands, while Pineda et al. (2022) [30] reported that the ignition efficiency of lightning is higher for coniferous forests than for other forest types. Flannigan and Wotton (1991) [31] proposed that the duff layer of needles sheltered under coniferous forests can favor the onset of a fire, which is in agreement with Ogilvie (1989) [32], who reported that LIW tend to start at the base of trees.
Analyses of the meteorological conditions of fire-producing thunderstorms are commonly focused on weather at the ground level and in the lower troposphere. However, previous studies demonstrated that the meteorological conditions of fire-igniting thunderstorms near the upper troposphere can also influence the occurrence of LIW. For example, Rorig et al. (2007) [22] investigated the role of mid-level (850–500 hPa) moisture instability and content during the occurrence of dry lightning, while Wallmann (2004) [33] and Nauslar et al. (2013) [15] analyzed the dynamics of the upper troposphere and the tropopause in the forecasting of dry thunderstorms over the United States. According to these authors, high temperature at altitudes above the 850 hPa pressure level favors the occurrence of dry lightning and LIW. Recently, Pérez-Invernón et al. (2021) [20] showed that the updraft and the Cloud Base Height (CBH) can play an important role in the occurrence of LIW and LCC lightning flashes in the European Mediterranean Basin. They used meteorological data from the fifth generation reanalysis (ERA5) of the European Center for Medium-Range Weather Forecasts (ECMWF) [34]. Meteorological data from reanalyses are commonly employed to implement forecasting methods (e.g., [35]) and, in turn, to initialize and nudge towards meteorological parameter simulations performed with chemistry–climate models (e.g., [36,37]). Therefore, searching for relationships between meteorological data from reanalyses and LIW is useful for the improvement of the coupling between atmospheric processes and wildfires in numerical atmospheric models.
In this work, we extended the analysis of Pérez-Invernón et al. (2021) [20] of the Mediterranean Basin to the regions of Arizona and New Mexico (ANM) and Florida (FL) in order to corroborate the role of LCC lightning in the production of LIW, and to provide new tools to improve the parameterization of wildfires in atmospheric models. The fire season in Arizona and New Mexico is mostly distributed over summer (June–September), peaking in late July and early August [12]. This period coincides with the highest annual lightning occurrence in the region. Hall and Brown (2007) [12] analyzed the precipitation associated with LIW in Arizona and New Mexico between 1990 and 1998, showing that daily and hourly precipitation before, during, and after the occurrence of LIW is lower than that for non-igniting lightning. Hall and Brown (2007) [12] reported that 75% of the LIW were associated with zero precipitation during the hour of the ignition. The total area burned by LIW in Florida peaks in late May and early June, while most of the LIW occur between late May and September (e.g., [38,39,40]). The maximum lightning frequency in Florida occurs during the wet season, i.e., between May and September. Previous studies, such as that by Duncan et al. (2010) [40], reported a negative correlation between the monthly occurrence of LIW and precipitation in Florida. Large wildfires (>1000 ha) are more common in Arizona and New Mexico than in Florida. According to [24], there are about 1.81 large wildfires per year and square kilometer in the Southwest (including Arizona and New Mexico). The total number of large wildfires per year and square kilometer in the southern region (including Florida) is 0.66, which is significantly lower than that in the Southwest. The climates in Arizona and New Mexico (arid and semi-arid) are also different from the climate in Florida (humid subtropical and tropical). The ratio of dry lightning to total lightning in the Southwest is 15, while it is 5.3 in the southern region [24]. However, the role of dry lightning in the ignition of wildfires is not similar in these two regions. Dry flashes produce about 9.5% and 19.1% of LIW in the Southwest and in the southern region [24], respectively. According to the information on the ecological regions of North America provided by the Commission for Environmental Cooperation Working Group, the ecological regions that are present in Florida are tropical wet forests and eastern tropical forests, with the latter being a representative ecological region of the eastern states. On the contrary, the ecological regions of Arizona and New Mexico are North American desserts and temperate sierras as well as northwestern forested mountains, which are representative of the western and central parts of the CONUS.
We therefore present an analysis of the characteristics of lightning and thunderstorms that produce LIW in the regions of Arizona and New Mexico as well as Florida during the fire season (June–September for Arizona and New Mexico and May–September for Florida) between 2009 and 2013, as well as the meteorological conditions of thunderstorms producing LCC lightning and their possible relationships with LIW-producing thunderstorms. We combine fire data, lightning measurements, and meteorological data from reanalyses in order to provide new insights into the occurrence of LIW and Long-Continuing-Current LCC lightning and the differences between the meteorological conditions involved in cloud electrification processes that produce normal lightning and LIW. This analysis allows us to propose the preferential meteorological conditions based on reanalyses that are useful for parameterizing the occurrence of LIW in the regions of Arizona and New Mexico as well as Florida.

2. Data and Methodology

2.1. Lightning Data

We used lightning data provided by the National Lightning Detection Network (NLDN) [41,42], which is operated by Vaisala over two different regions of the CONUS. In particular, we analyzed Cloud-to-Ground (CG) stroke data from Arizona and New Mexico (103 W–115 W longitude and 32 N–37 N latitude) and Florida (80 W–83 W longitude and 25 N–30 N latitude) between May and September 2009–2013. The NLDN is composed of 113 Very Low Frequency (VLF) sensors distributed over the CONUS that provide the position, time of occurrence, polarity, and peak current of lightning strokes. NLDN has a Detection Efficiency (DE) of about 90–95% for CG strokes and 18–34% for Intra-Cloud (IC) strokes over the CONUS [43]. In turn, the median location error of NLDN before 2013 was 198 m [44]. The DE of NLDN over CONUS can be considered high and suitable for the present study, as the DE of the World Wide Lightning Location Network (WWLLN) in the investigated area during 2009 and 2012 ranged between 5% and 15% [45].
In addition, we used optical observations reported by the space-based instrument Lightning Imaging Sensor (LIS) [46] onboard the Tropical Rainfall Measuring Mission (TRMM) satellite to investigate the continuing current phase of lightning discharges over the CONUS between 1998 and 2014. TRMM-LIS detects optical emissions from all lightning (both IC and CG) with a frame integration time of 1.79 ms and a spatial resolution of 4 km. The total DE of TRMM-LIS ranges between 73 ± 11% (noon) and 93 ± 4% (night), covering latitudes between 35 N and 35 S. The clustering algorithm of TRMM-LIS assorts contiguous events into groups and clusters groups into flashes, with a temporal criteria of 330 ms and a spatial criteria of 5.5 km. The details of the sensor and the reported climatology of lightning and LCC lightning between 1998 and 2014 can be found in [46,47,48,49,50,51]. We used the method globally developed by [51] and recently employed by Pérez-Invernón et al. (2021) [20] (over the Mediterranean Basin) and Pérez-Invernón et al. (2022) [21] (globally) to classify lightning flashes reported by TRMM-LIS according to the duration of the continuing phase. The duration of the continuing phase detected by TRMM-LIS should be considered a minimum. For instance, Bitzer (2017) [51] combined optical signals of LCC lightning reported by TRMM-LIS and electric field waveforms at the ground level to establish a relationship between the optical and the true duration of the continuing current. He compared the duration of the optical signal of a flash (7–9 ms) with the duration of the continuing current reported by the Huntsville Alabama Marx Meter Array (HAMMA) of 22 ms. Therefore, we consider that a flash has an LCC phase if its optical emission is detected in twenty or more consecutive frames (i.e., LCC (>18 ms) lightning flashes). According to the comparison of the continuing phase duration between the optical signal (7–9 ms) and the radio signal measured by HAMMA (22 ms) and reported by Bitzer (2017) [51], LCC (>18 ms) lightning flashes could have a continuing current lasting for about 44–57 ms. This is consistent with the minimum duration of 40 ms for flashes that ignited fires, reported by McEachron and Hagenguth (1942) [18] and Fuquay et al. (1967) [19].

2.2. Forest Fire Databases

The fire data were provided by the U.S. Department of Agriculture [52,53]. The database includes wildfires for the entire CONUS between 1992 and 2018. The causes of the fires were reported when known, including lightning-caused fires as well as their coordinates, date, and time. The fire coordinates represent the location point of ignition of the fire, with a minimum spatial accuracy of 1 square mile (2.6 km 2 ). We limited our analysis to the period of 2009–2013, for which we had access to NLDN lightning data. The total number of LIW in this database between 2009 and 2013 in Arizona and New Mexico (June–September) and in Florida (May–September) were 7107 and 3249, respectively.

2.3. Vegetation Type Database

We used a 250 m resolution map of the United States forest types [54] (https://data.fs.usda.gov/geodata/rastergateway/forest_type/ (accessed on 10 June 2022)) to investigate the Lightning Ignition Efficiency (LIE; i.e., the number of fires ignited per lightning) in the main forest types of Arizona and New Mexico as well as Florida [55]. The forest type map was generated from MODIS imagery and Forest Inventory and Analysis (FIA) plot data, which classified the forest area into discrete classes based on the dominant tree species [54]. We assigned a forest type to each fire and lightning event using their coordinates. We explored whether the use of the most common forest types in a 9-pixel window would offer different results within a sub-sample of fires, but we did not obtain significant differences.

2.4. Meteorological Data and Satellite Measurements

Following the approach proposed by [20], we used hourly meteorological data from the European Center for Medium-Range Weather Forecasts’ (ECMWF) fifth-generation reanalysis (ERA5) [34] to analyze the preferential meteorological conditions of thunderstorms producing fires or LCC lightning. ERA5 uses a 4D-var assimilation scheme at 139 pressure levels with a horizontal resolution of 0.25 , while the product ERA5-Land provides meteorological data over land by replaying the land component of the ECMWF ERA5 climate reanalysis with a horizontal resolution of 0.1 [56]. ERA5 data and other similar reanalysis products are usually employed to nudge atmospheric model simulations towards meteorological reanalysis (e.g., [36,37]). Therefore, using ERA5 meteorological data to investigate the characteristics of fire-producing and LCC lightning-producing thunderstorms is particularly convenient for the eventual improvement of the parameterization of LIW in atmospheric models.
We analyzed hourly ERA5 meteorological data for particular cells and time steps containing lightning flashes, reported by NLDN in the regions of Arizona and New Mexico as well as Florida, for the periods between May and September 2009–2013. In particular, we included ERA5 meteorological data for 325,944 and 159,734 cells/hour over Arizona and New Mexico and over Florida, respectively. Since LCC lightning is rare, we extended the regions where we analyzed the meteorological conditions of LCC lightning-producing thunderstorms: the Western Mountains and the Arid West (WMAW) (93.5 W–114 W longitude and 31.5 N–38 N latitude) and the Atlantic and Gulf Coastal Plain (AGCP) (79.2 W–93.5 W longitude and 25 N–31.5 N latitude). Long-continuing-current lightning data were reported by the ISS-LIS from a Low Earth Orbit. Therefore, ISS-LIS did not provide continuous measurements over the investigated area. On the contrary, the ISS-LIS provided measurements only when the passage of the ISS over the area coincided with the occurrence of a thunderstorm. Therefore, the total number of LCC lightnings observed by the ISS-LIS during a short period of time over a particular area (e.g., 2009–2013) was too small to produce significant statistics. We therefore expanded the area and period where the meteorological conditions of LCC were to be investigated in order to obtain the particular meteorological conditions of thunderstorms producing LCC lightning. We had to make sure that the expansion of the areas would not mix different climatic areas.
The selected meteorological variables were (1) the maximum Total Totals Index (TT), between 850 hPa and 500 hPa, up to 3 h before the flash occurrence (the Total Totals Index is a commonly used stability index calculated as the sum of the Vertical Totals Index (temperature at 850 mb minus temperature at 500 mb) and the Cross Totals Index (dew point at 850 mb minus temperature at 500 mb) during the development of instability); (2) the wind shear between 500 hPa and the surface, up to 3 h before the flash occurrence (the wind shear is a change in wind speed and direction during the development of instability); (3) the CBH; (4) the horizontal wind components; (5) the hourly accumulated precipitation; (6) the specific humidity at 450 hPa; (7) the vertical profiles between the ground and a pressure level of 200 hPa for the temperature; (8) the relative humidity; (9) the vertical velocity; (10) the specific cloud ice water content, and (11) the specific rain water content.

2.5. Search of Lightning-Candidates for the Fires

The search for an ignition lightning candidate for a natural fire is not a trivial problem [29]. We searched the most probable CG lightning stroke candidate for each fire using the proximity index A proposed by Larjavaara et al. (2005) [57]:
A = 1 T T m a x × 1 D D m a x ,
where D is the distance between the reported fire location and the lightning discharge, and T is the delay between them, also known as holdover (i.e., the time between fire ignition and detection) [6]. The parameters ( T m a x ) and ( D m a x ) correspond to the maximum holdover and distance between a fire and a lightning discharge, considering the latter as a potential cause of ignition. We set T m a x = 7 days and D m a x = 10 km [57]. A distance of 10 km is often applied in the literature to account for possible large location errors in fire and lightning data [6,20,29,57,58]. According to Schultz et al. (2019) [58], 95% of fires were detected within 7 days after an ignition caused by the lightning candidate. Using T m a x = 7 days is a conservative approach that allowed us to include a representative sample of LIW by discarding fires with long (>7 days) holdover durations that might have been erroneously labeled as natural fires. Therefore, in our subsequent analyses, we did not include fires for which no CG lightning discharges were detected within the proposed spatio-temporal window. In total, we assigned a lightning ignition candidate to 6301 and 2693 fires in Arizona and New Mexico as well as in Florida, respectively.

2.6. Analysis of Meteorological Conditions

We compared the meteorological variables associated with LIW to those of typical CG lightning flashes (all the CG flashes relative to LIW flashes) over the forest types that gather most of the LIW during the fire season to identify the characteristics of LIW in Arizona & New Mexico and Florida. In addition, we compared the meteorological conditions associated with LCC(>18 ms)-lightning flashes reported by TRMM-LIS over land in the regions WMAW and AGCP between May and September 1998–2014 to the meteorological conditions of typical lightning flashes to search for relationships between meteorology and the occurrence of LCC lightning flashes. We followed the approach of Pérez-Invernón et al. (2021) [20] to compare meteorological variables, although applied a different statistical design to identify the statistical significance of the results when dealing with samples of different sizes. In summary, (1) we collected the 1-hourly or 3-hourly values of the meteorological variables of every ERA5 grid cell containing lightning flashes, (2) we calculated the median values of the meteorological parameters for typical, LIW and LCC(>18 ms)-lightning, (3) we performed a Kruskal-Wallis H-test (alpha = 5%) [59] to check if the median value differs significantly across samples and (4) we calculated the 95% confidence interval (CI) of the median for each meteorological variable by using a bootstrap method with 5000 resamples [29,60]. The procedure of the used bootstrap method is described in the documentation of the function bootstrap implemented in the Python package scipy [60]:
  • Resample the data with replacement of the same size as the original by taking random samples.
  • Compute the bootstrap distribution of the statistic.
  • Determine the confidence interval.
  • Compare the 95% CIs of the medians of the meteorological parameters of LIW with the 95% CIs of the meteorological medians of typical CG to look for overlaps between CIs.
We compared the meteorological variables associated with LIW to those of typical CG lightning flashes (all the CG flashes relative to LIW flashes) over the forest types that gather most of the LIW during the fire season in order to identify the characteristics of LIW in Arizona and New Mexico as well as in Florida. In addition, we compared the meteorological conditions associated with LCC (>18 ms) lightning flashes, as reported by TRMM-LIS over land in the regions of WMAW and AGCP between May and September 1998–2014, to the meteorological conditions of typical lightning flashes in order to search for relationships between meteorology and the occurrence of LCC lightning flashes. We followed the approach of Pérez-Invernón et al. (2021) [20] for comparing meteorological variables, although we applied a different statistical design to identify the statistical significance of the results when dealing with samples of different sizes. In summary, (1) we collected the hourly or 3-hourly values of the meteorological variables of every ERA5 grid cell containing lightning flashes, (2) we calculated the median values of the meteorological parameters for typical LIW and LCC (>18 ms) lightning, (3) we performed a Kruskal–Wallis H-test (alpha = 5%) [59] to check if the median value differs significantly across samples, and (4) we calculated the 95% confidence interval (CI) of the median for each meteorological variable by using a bootstrap method with 5000 resamples [29,60]. The following procedure of the used bootstrap method is described in the documentation of the function bootstrap, which is implemented in the Python package scipy [60]:
  • Resample the data with a replacement of the same size as the original by taking random samples.
  • Compute the bootstrap distribution of the statistic.
  • Determine the confidence interval.
  • Compare the 95% CIs of the medians of the meteorological parameters of LIW with the 95% CIs of the meteorological medians of typical CG to look for overlaps between CIs.

3. Results

In this section, we show the main results of our study. Firstly, the characteristics of the lightning candidates for the analyzed LIW over Arizona and New Mexico as well as over Florida are presented. Secondly, we analyze the preferential meteorological conditions for LIW. Finally, we present the identification of the LCC (>18 ms) lightning over the CONUS and their possible relationships with LIW. A discussion of the obtained results is presented in Section 4.

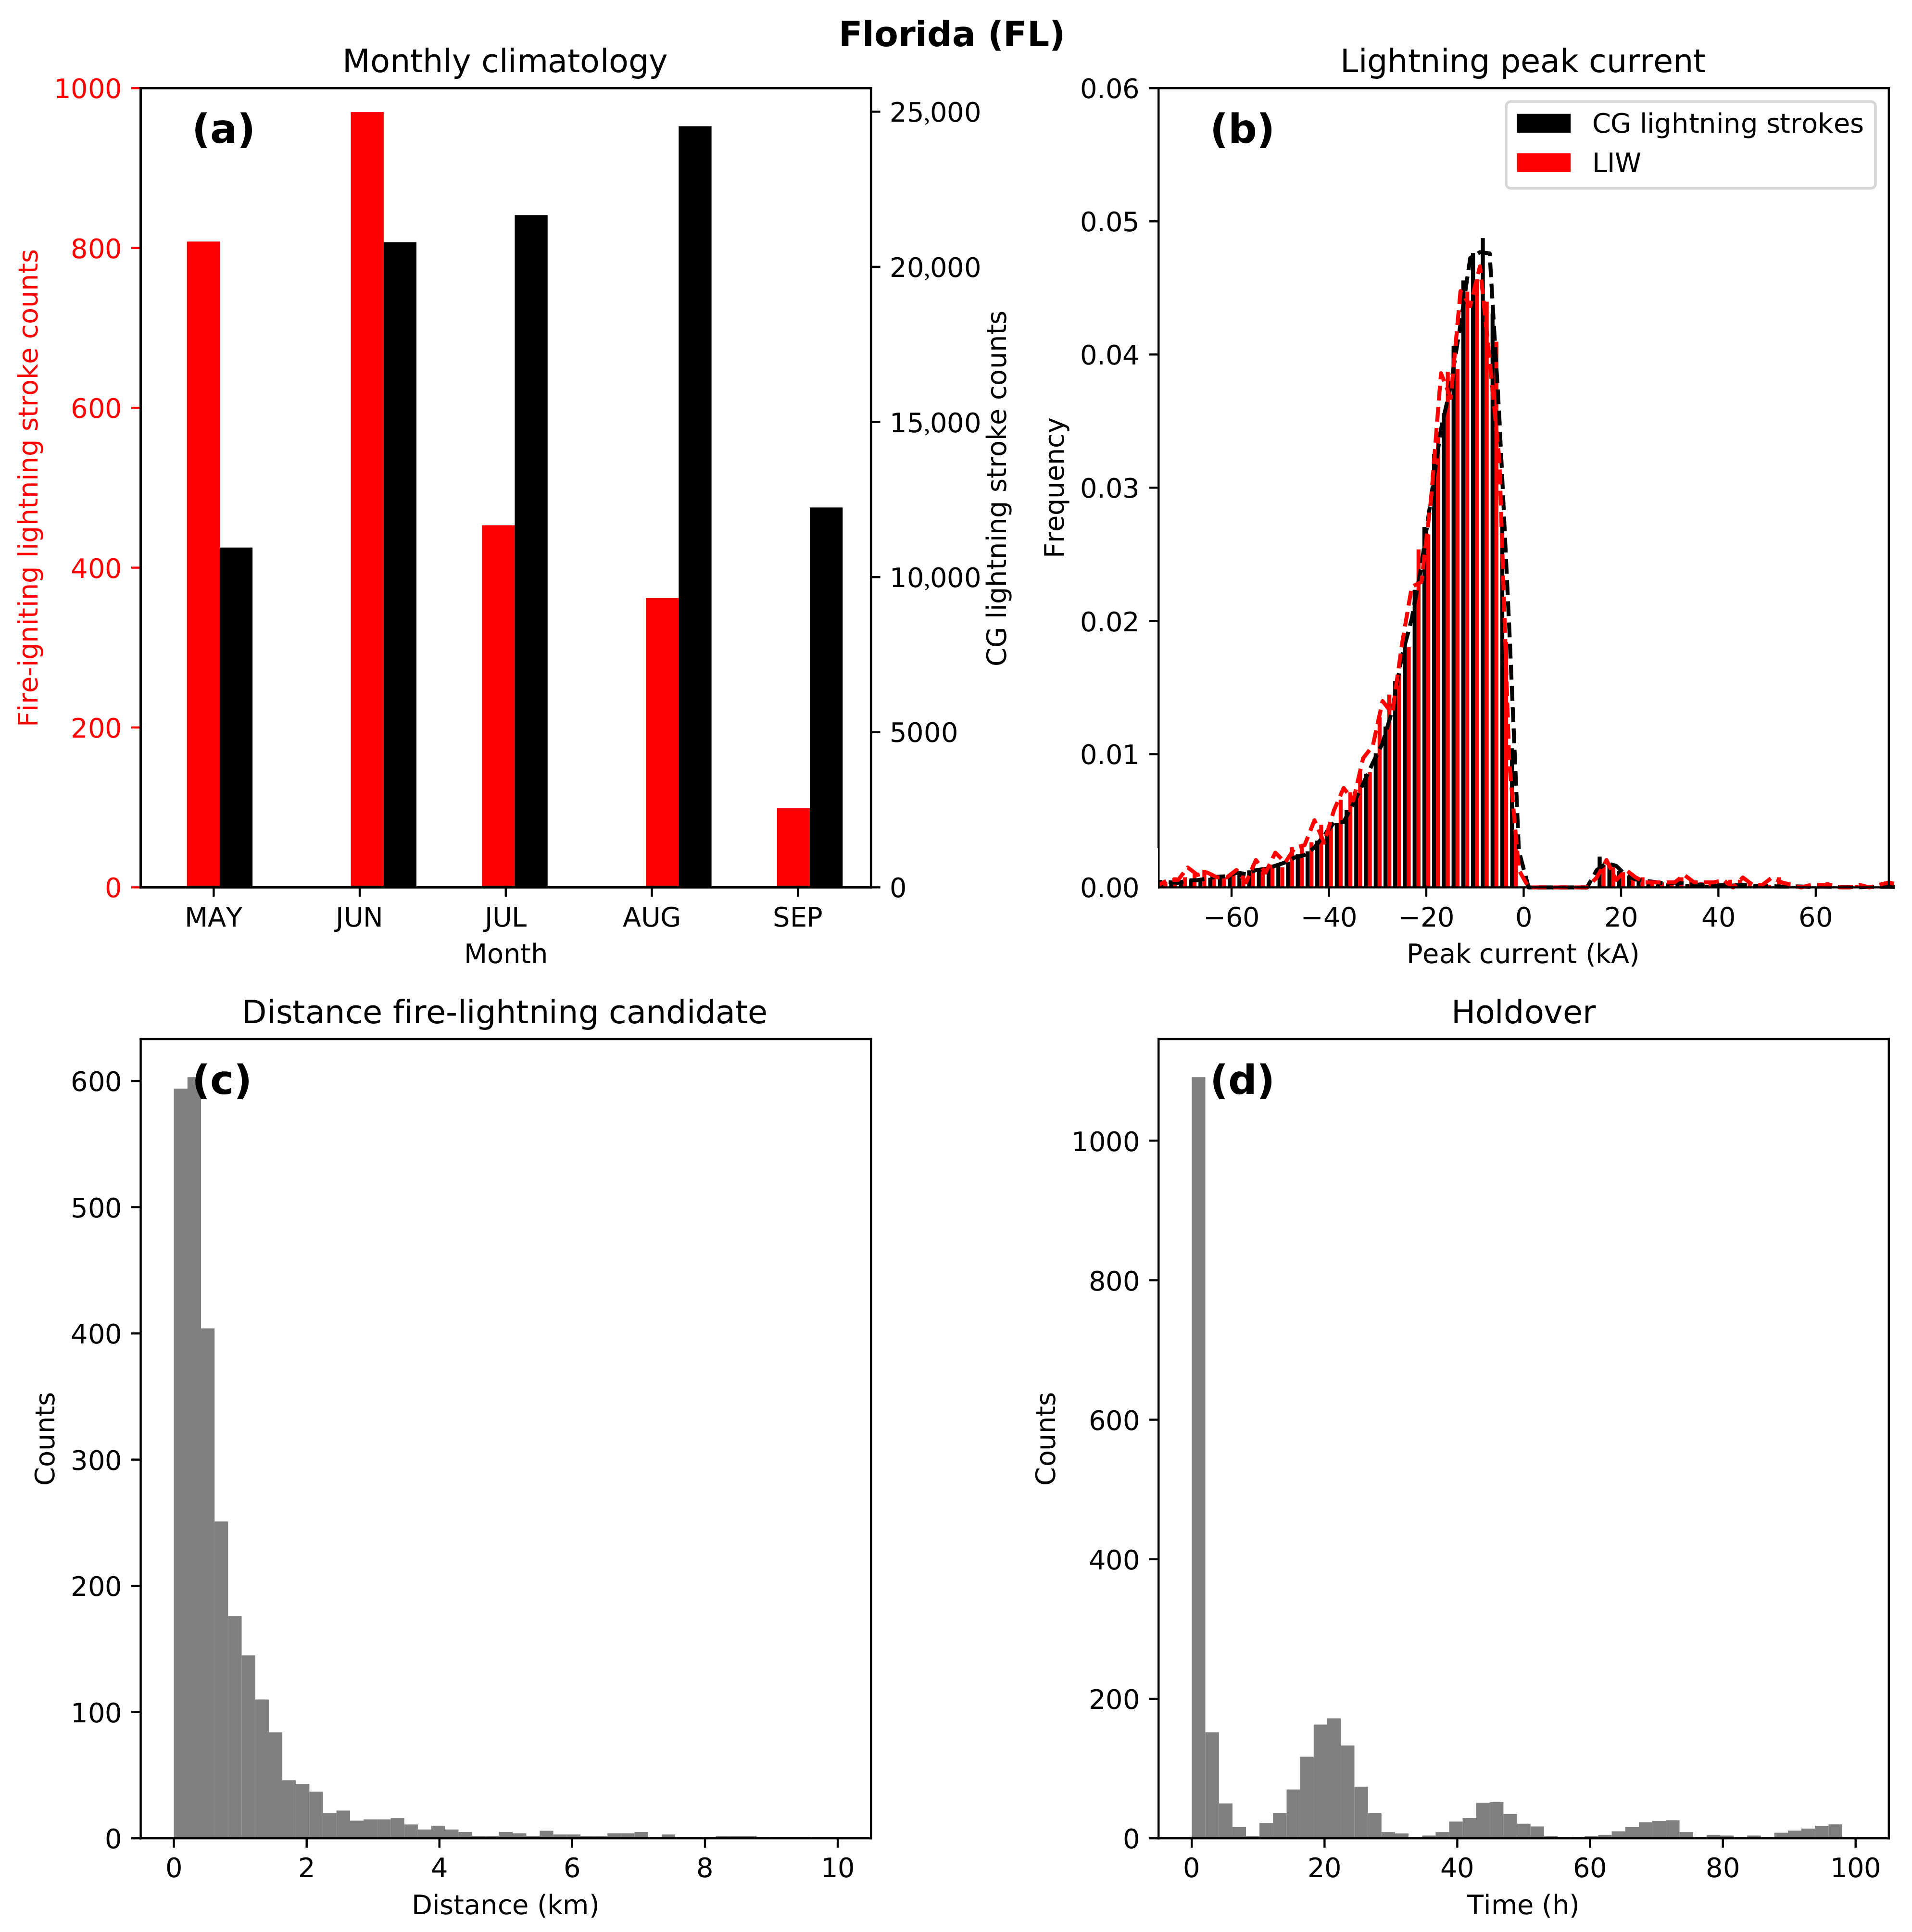
3.1. Lightning Candidates for Fires

Figure 1 shows the distribution of the LIW events included in Arizona and New Mexico as well as in Florida. In Arizona and New Mexico, most of the LIW are distributed within temperate sierras and the southern Rocky Mountains, while in Florida, most of the LIW are located in temperate forests of the coastal plain. Table 1 shows the distribution of LIW, CG strokes, and LIE values in the forest types of Arizona and New Mexico and in those of Florida. A non-forest area corresponds to lakes, ocean, pastures, bushes, cities, industrial zones, and other land cover types; consequently, they were not studied here. Most of the LIW in Arizona and New Mexico started in non-forest areas, ponderosa pine forests, and pinyon-juniper woodlands. In the case of FL, most of the LIW started in non-forests areas, slash pine forests, baldcypress, and water tupelo swamps. Among the forest types with more LIW, in Arizona and New Mexico, the highest LIE was observed in ponderosa pine (Pinus ponderosa) forests, while in the case of Florida, the highest LIW corresponded to the slash pine (Pinus elliottii) forest. In order to select flashes on forest areas with a greater number of LIW and to minimize the potential influence of vegetation type on the results [20], we focus our analysis of Section 3.2 on LIW and CG strokes taking place exclusively in ponderosa pine and pinyon-juniper woodlands within Arizona and New Mexico, and in slash pine and baldcypress–water tupelo swamps within Florida.
The monthly distribution of LIW and CG lightning strokes are shown in Figure 2a and Figure 3a, respectively. In Arizona and New Mexico (Figure 2a), both the LIW and the lightning stroke peak in July. The LIE is at its maximum in June and decreases progressively from July to September. In Florida (Figure 3a), the ratio of fire-igniting lightning strokes to total strokes is at its maximum in May and slowly decreases in the following months. In turn, LIW peak in June, whereas lightning strokes peak in August, suggesting that meteorological conditions, not only lightning occurrence, play an important role in LIW occurrence. In fact, LIE in Florida is at its maximum in May and decreases progressively in the following months.
In Table 2, we collected the main characteristics of LIW in the investigated regions. We obtained the average proximity indices (A) of 0.87 and 0.86 for Arizona and New Mexico and for Florida, respectively. High values of A (close to 1) suggest a high probability of a correct assignment between LIW and lightning candidates. We found that the median elevation of LIW in Arizona and New Mexico is 1912 m, while the median elevation for CG strokes is 1801 m. In FL, the median elevation of LIW is 7 m, while the median elevation of CG strokes is 10 m.
Figure 2b shows the frequency distribution of the lightning stroke peak current of all the CG strokes and the CG strokes causing LIW in Arizona and New Mexico. The lack of positive lightning strokes reported by NLDN with peak currents below 15 kA are a consequence of the data set (positive flashes with peak currents nearly below 15 kA are classified as IC [43]). The absolute value of the peak currents tend to be slightly lower in typical CG strokes than in LIW. Differences in the median peak currents of typical CG and LIW are statistically significant both in Arizona and New Mexico (p-value = 10 87 ) and in Florida (p-value = 4 × 10 5 ).
In Figure 3b, we plotted the frequency distribution of the lightning stroke peak current of all the CG strokes and fire-igniting lightning in Florida. It can be observed that the peak current of positive fire-producing strokes is higher than in typical +CG. On the contrary, we obtained a lower absolute value of the peak current for negative fire-producing strokes than for typical -CG strokes.
Figure 2c and Figure 3c show the distance between the reported fire-starting position and the lightning candidates for Arizona and New Mexico and for Florida, respectively. In both regions, the estimated position of most of the fire-producing lightning strokes are within 2 km of the reported position of the fire. Regarding the holdover fires, Figure 2d and Figure 3d show that most of the LIW have a holdover time <24 h, and a daily cycle that can be due to the diurnal cycle of temperature.

3.2. Meteorological Conditions of LIW

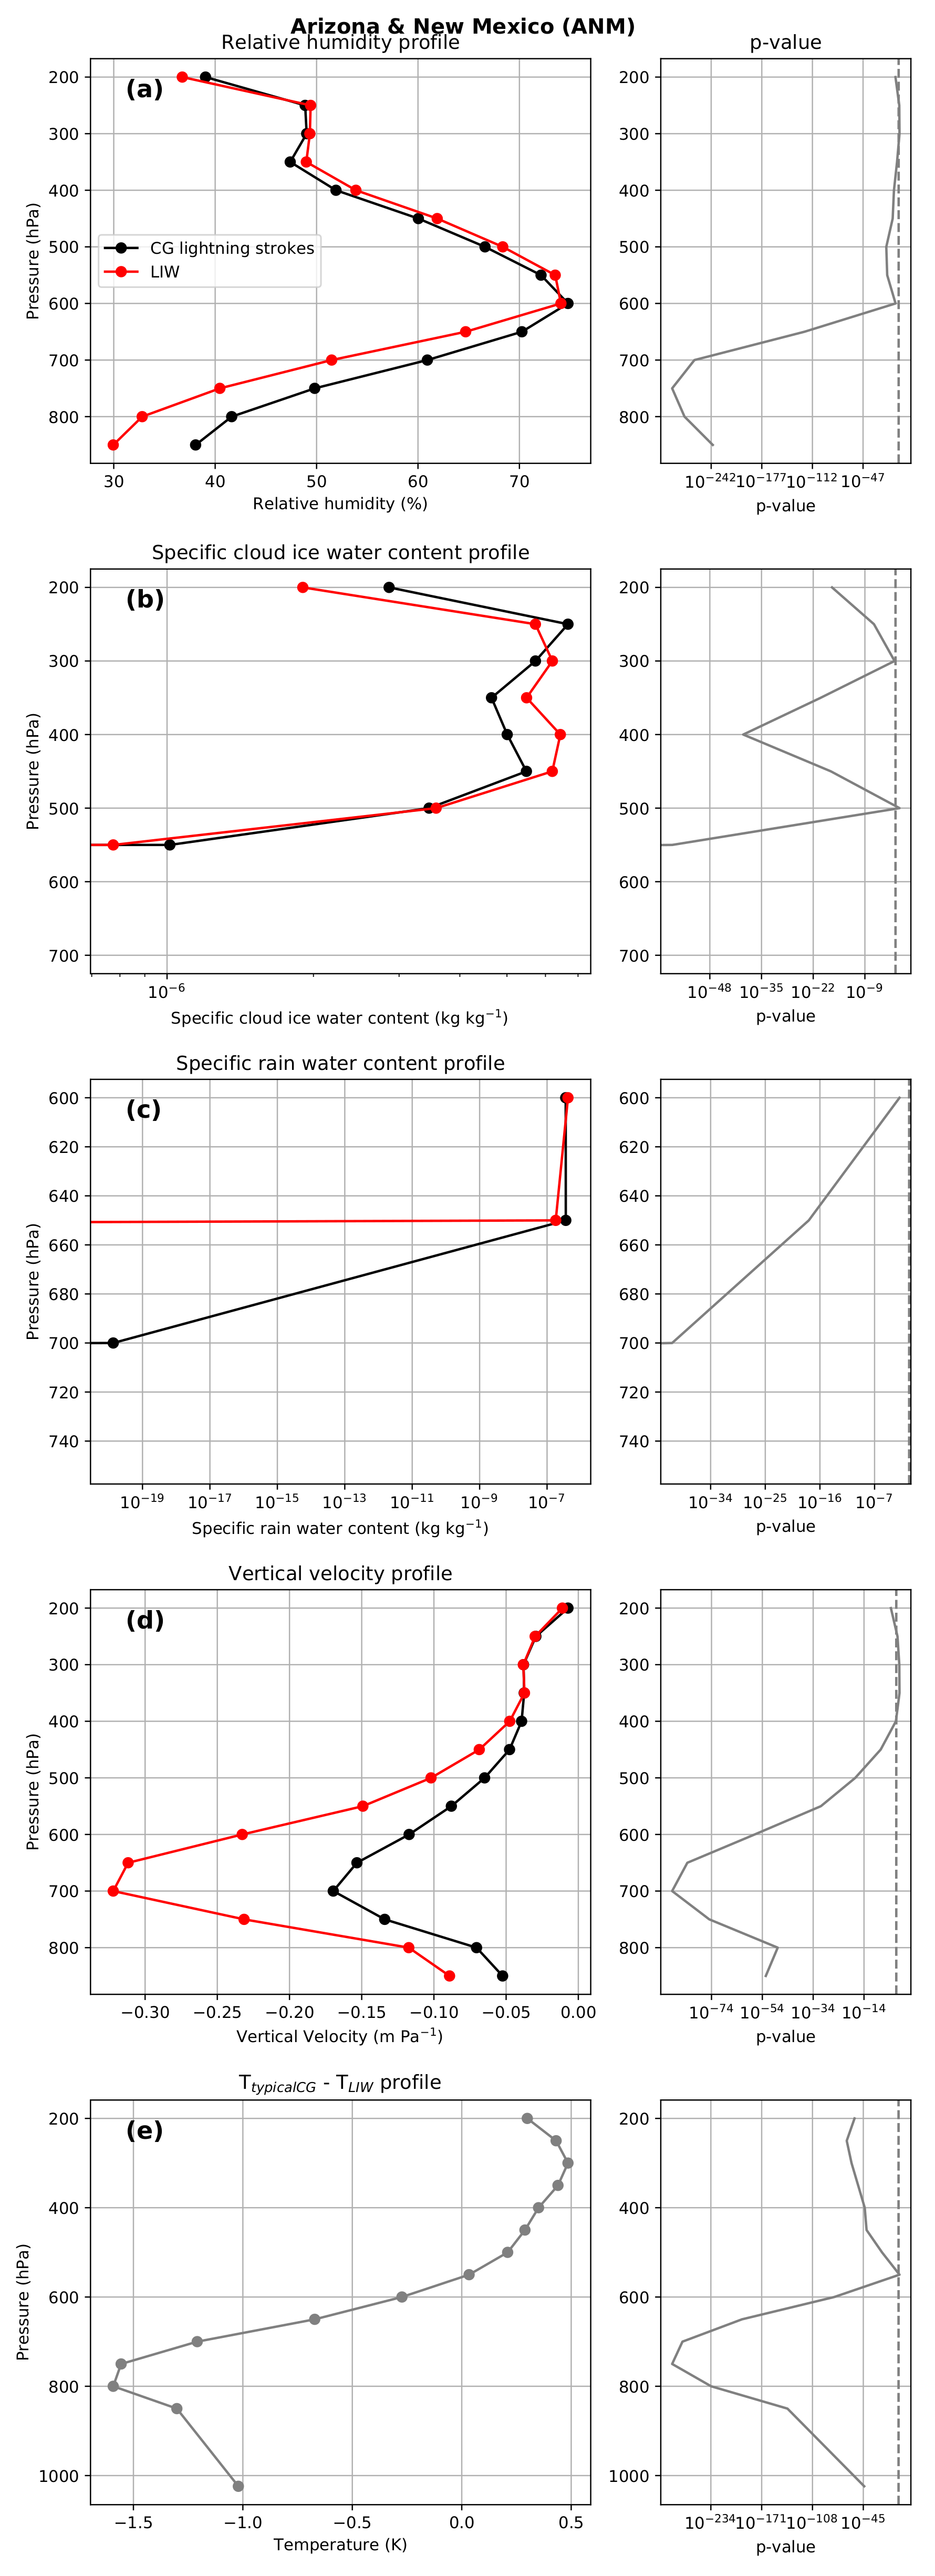
3.2.1. Arizona and New Mexico
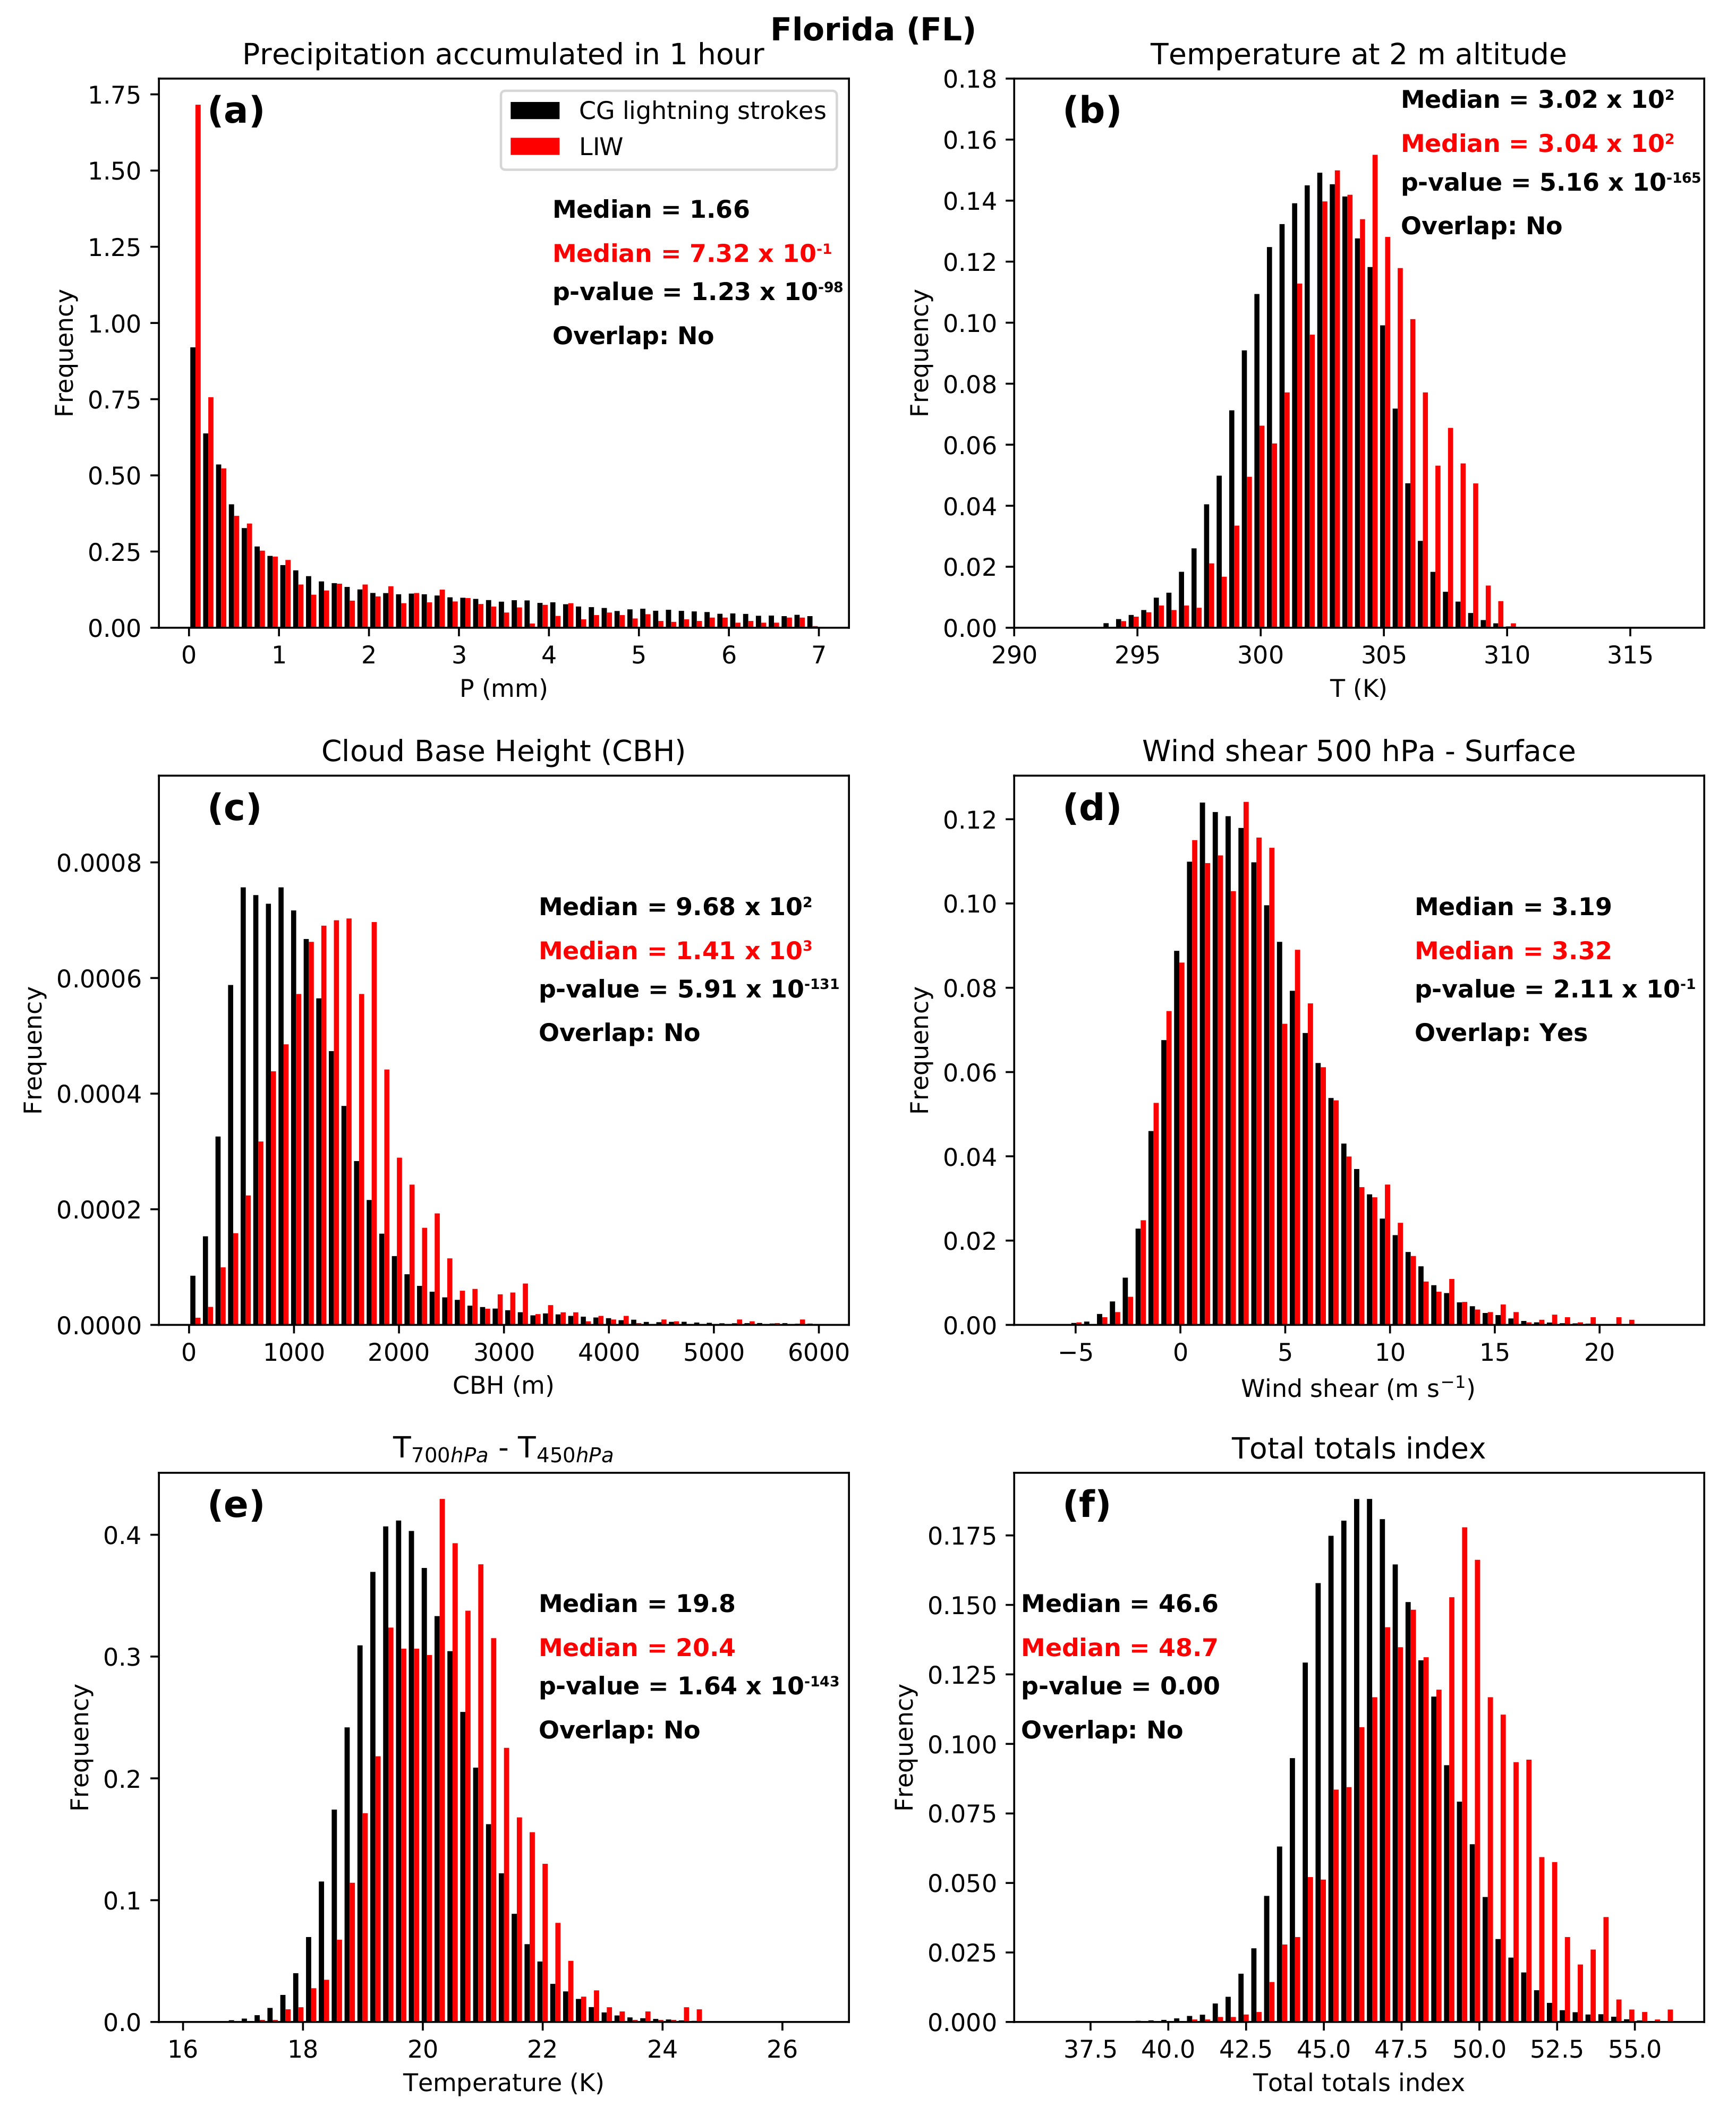
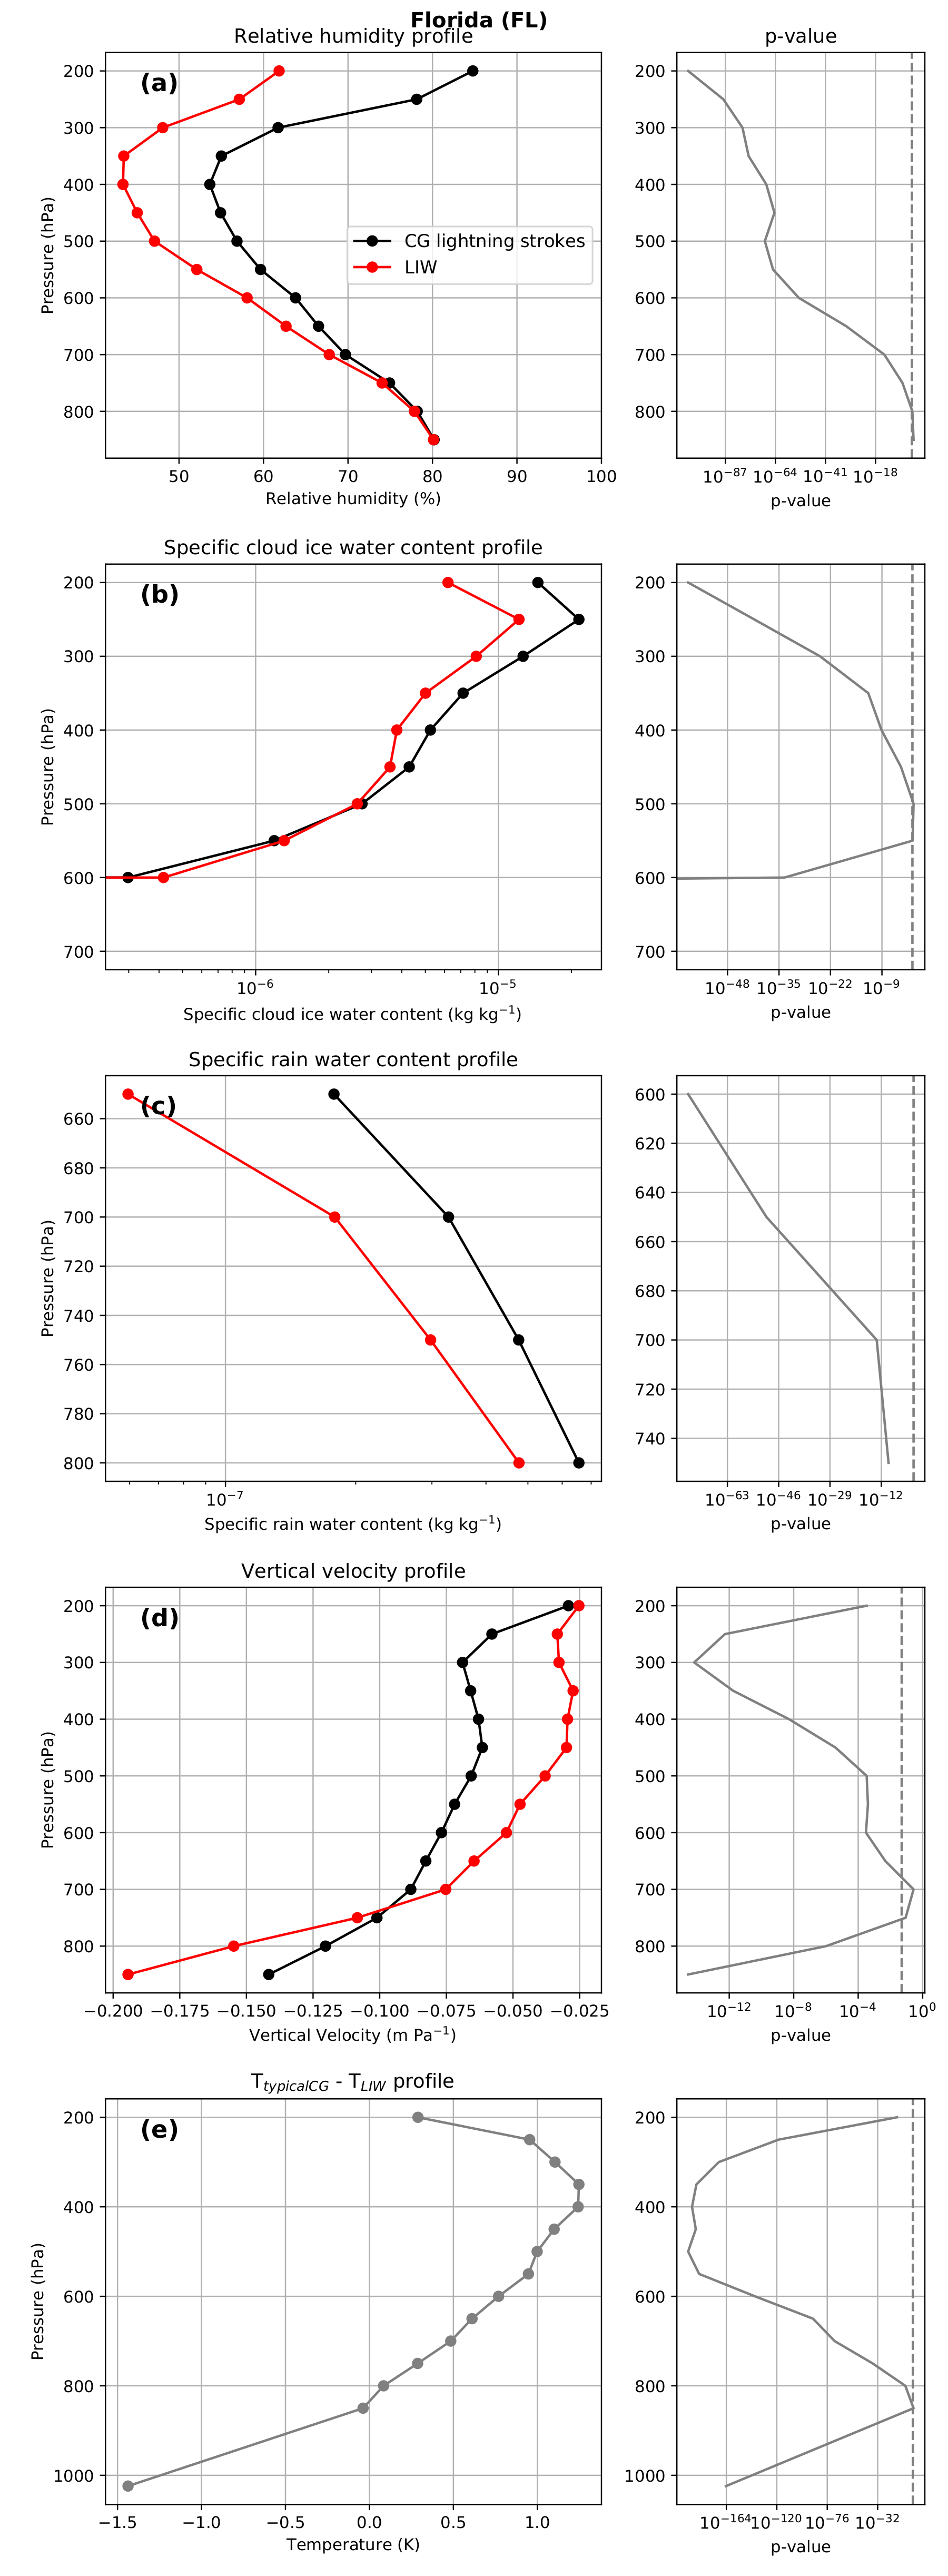
In this section, we investigate the meteorological conditions favoring LIW in Arizona and New Mexico and in Florida from hourly ERA5 reanalysis data. The median hourly precipitation accumulated during typical CG strokes (0.288 mm) is higher than during the occurrence of LIW (0.205 mm), as can be seen in Figure 4a. The difference in the median is statistically significant as the p-value < 0.05, and there is no overlap of the 95% bootstrap CI of the medians. The air temperature at an altitude of 2 m during the occurrence of LIW is statistically higher (by 2 K) than for typical CG strokes, as shown in Figure 4b. According to Figure 4c, the median CBH value is higher in the case of LIW than in typical CG strokes (2.55 km vs. 2.29 km, p-value < 0.05, and no overlap of the CI of the medians). High-based clouds are often associated with low precipitation rates as they favor the evaporation of water droplets before reaching the surface. Low precipitation rates during lightning occurrence increases the probability of survival and arrival of LIW.
The stability of the atmosphere during the occurrence of LIW can be evaluated using Figure 4d–f. The wind shear between the 500 hPa pressure level and the surface (Figure 4d) and the temperature difference between the 700 hPa and the 500 hPa pressure levels (plotted in Figure 4e) are statistically higher for LIW than for typical CG strokes, suggesting a higher atmospheric instability (p-value < 0.05). However, the Total Totals Index is slightly lower for LIW than that for typical CG, suggesting a similar degree of atmospheric instability. This apparent contradiction may be due to a different moisture content in the atmosphere for LIW and for typical CG strokes. At a given vertical profile of the temperature, a lower relative humidity causes a lower dew point temperature, which contributes to a lower Total Totals Index.
Figure 5 shows the median value of other meteorological parameters during the occurrence of LIW and typical CG strokes. The median relative humidity for LIW is lower than that for typical CG strokes at an altitude below the pressure level of 600 hPa (p-value < 0.05), as can be seen in Figure 5a, suggesting that drier conditions favor LIW. The lower relative humidity of below 600 hPa explains why the Total Totals Index is lower than the median during all CG strokes in the case of LIW. Figure 5b shows the vertical content of cloud ice water for LIW and typical CG strokes, indicating that clouds producing LIW have a higher content of ice between the levels of 600 hPa and 250 hPa (p-value < 0.05), which is in agreement with the observed higher relative humidity.
The vertical rain water content of LIW and typical CG strokes in Arizona and New Mexico is plotted in Figure 5c. The median rain water content for LIW from the surface to the 650 hPa pressure level is lower than the median for all the CG strokes (p-value < 0.05), indicating again that dry conditions favor the survival and arrival phases. However, the rain water content is higher than the median during all the CG strokes at the 650 hPa level (p-value < 0.05).
Figure 5d shows the vertical profile of the vertical velocity for LIW and for typical CG strokes in Arizona and New Mexico, indicating a stronger updraft in thunderstorms producing LIW than in typical thunderstorms (p-value lower than 0.05). The higher vertical velocity for LIW is in agreement with the higher wind shear and temperature difference between vertical levels, shown in Figure 5. This result is different from [20] in the Mediterranean Basin, suggesting that fire-producing thunderstorms are not similar in both regions.
Figure 5e shows the vertical profile of the difference in temperature between LIW and typical CG strokes in Arizona and New Mexico. For LIW, the temperature is higher than in CG strokes at altitudes below the 600 hPa pressure level (p-value < 0.05), while the opposite was found above the 600 hPa pressure level (p-value < 0.05). An exception was found at the 500 hPa pressure level, where the p-value < 0.05 indicates similar median values.

3.2.2. Florida

The median accumulated precipitation during CG strokes is 1.66 mm, while it is significantly lower (p-value < 0.05) (0.73 mm) during the occurrence of LIW (Figure 6a). Differences in the air temperature at an altitude of 2 m are also statistically significant (Figure 6b). These results suggest that lower precipitation and higher temperature favor LIW.
For LIW, the median CBH value is higher (p-value < 0.05) than the median during all the CG strokes (Figure 6c). As in the case of Arizona and New Mexico, high-based clouds can increase the evaporation rate of precipitation, contributing to drier conditions on the surface.
Figure 6d–f respectively show the wind shear, the difference between the 700 hPa and 450 hPa pressure levels, and the Total Totals Index for LIW and typical CG strokes in Florida. For all the three variables, the median values for LIW are higher than those during all the CG strokes, indicating higher atmospheric instability during the occurrence of LIW, although differences in the median values of the wind shear are not statistically significant.
According to Figure 7a,b, the median relative humidity and cloud ice water content are statistically lower in LIW than in typical CG strokes at all the vertical levels, indicating a lower moisture content. Figure 7c also shows that the specific rain water content is significantly lower for LIW than for typical CG strokes, which is in agreement with the lower precipitation rate shown in Figure 6a. Differences in the vertical profile of the vertical velocity are more complex. According to Figure 7d, the updraft is statistically stronger for LIW than for all the CG strokes close to the ground (below the 800 hPa pressure level), similar at the 750 hPa pressure level, and higher at intermediate and high altitudes (above the 800 hPa pressure level). Convection near the surface is triggered by high temperature at an altitude of 2 m (see Figure 6b). However, the updraft becomes weaker at higher altitudes. The weakness of the updraft above the 800 hPa pressure level can be explained by the vertical profile of the difference in temperature between typical CG strokes and LIW, shown in Figure 7e. The temperature is significantly higher (up to 1.2 K, p-value < 0.05) in the intermediate and the upper troposphere for typical CG strokes than for LIW, which causes a stronger updraft in the case of typical CG strokes. The low vertical velocity (weak convection) and low ice content of fire-producing thunderstorms in Florida coincide with the thunderstorms reported by Barth et al. (2015) [61] in Alabama and by Pérez-Invernón et al. (2021) [20] in the Mediterranean Basin. Weak-convection thunderstorms are characterized by low ightning-flash densities, which coincides with the fire-producing thunderstorms reported by Soler et al. (2021) [62] in Catalonia.

3.3. Identification of LCC (>18 ms) Lightning

Following the method developed by [51], we identified all the LCC (>18 ms) lightning flashes detected by TRMM-LIS over the CONUS and Northern Mexico during the fire season between 1998 and 2014 (Figure 8). The maximum lightning activity takes place over land, while the occurrence of LCC (>18 ms) lightning reaches its maximum over the ocean, which is in agreement with [51].
The total amount of lightning flashes detected by TRMM-LIS over the WMAW (containing Arizona and New Mexico) area were 319,385, among which 3688 (1.2%) were LCC (>18 ms) lightning flashes, whereas 150,487 lightning flashes were detected in AGCP (containing FL), among which 1457 (1.0%) were LCC (>18 ms) lightning flashes.

3.4. Shared Meteorological Conditions of Thunderstorms Producing LIW and LCC Lightning

We compared the relationships between thunderstorms producing LIW and a high rate of LCC (>18 ms) lightning. The value distribution and the median vertical profiles of some meteorological parameters during the occurrence of typical and LCC (>18 ms) lightning flashes over WMAW and AGCP regions are shown in the Supplementary Materials (Figures S1–S4). Figure 9 shows the percent of variation in the medians of several meteorological variables for LIW and LCC (>18 ms) lightning produced by thunderstorms with respect to the climatology.
In Arizona and New Mexico, the temperature at 600 hPa, the ice content at 600 hPa, the wind shear between 700 hPa and 500 hPa, and the temperature difference between the 700 hPa and 500 hPa pressure levels are higher than the median value for both thunderstorms producing LIW and LCC (>18 ms) lightning. In Florida, the shared preferential meteorological conditions of thunderstorms producing LIW and LCC (>18 ms) lightning include hourly, accumulated precipitation that is lower than the median during all the CG strokes, higher values of the temperature difference between the 700 hPa and 500 hPa pressure levels, and a higher Total Totals Index. Finally, thunderstorms producing LIW and LCC (>18 ms) lightning share a temperature higher than the median during all the CG strokes above the 800 hPa pressure level. In the two regions, the temperature above the 600 hPa pressure level is higher than the median for both thunderstorms producing LIW and thunderstorms producing LCC (>18 ms) lightning.

4. Discussion

4.1. Preferential Meteorological Conditions for LIW Occurrence in Arizona and New Mexico and Florida

The role of dry thunderstorms in the occurrence of LIW in the U.S. has been previously investigated (e.g., [15,22,24,33]). These studies reported a positive correlation between the occurrence of dry lightning and LIW. Nauslar et al. (2013) [15] demonstrated that the high temperature in the troposphere contributes to the evaporation of rain before reaching the ground, favoring the occurrence of dry lightning and LIW. Vant-Hull et al. (2018) [24] reported differences in the definition of dry lightning that has the potential to produce LIW in the CONUS.
The occurrence of LIW is usually associated with low precipitation rates, high temperature between the surface and 800 hPa, and high-based clouds [15,20]. Our results confirm that these meteorological conditions also seem to favor the occurrence of LIW in both Arizona and New Mexico and Florida (Figure 4 and Figure 6). Furthermore, the daily cycles found for the holdover distribution (Figure 2d and Figure 3d) may be the result of daily cycles in meteorological conditions. At noon, the higher temperature and lower relative humidity favor a rapid arrival after ignition, while ignitions before or after noontime occur under meteorological conditions less favorable for a favor rapid arrival [23,63]. The reported daily cycles are similar to the ones observed by Pineda et al. (2017) [23], Soler et al. (2021) [62], and Pérez-Invernón et al. (2021) [20] for LIW over Catalonia and the Mediterranean Basin. Despite the similar trends, we also detected differences in the preferential meteorological conditions of LIW for the investigated regions. For instance, the precipitation rate of typical thunderstorms taking place in Arizona and New Mexico is lower than that in Florida (0.29 vs. 1.66 mm), which means that the deviation of the median precipitation rate with respect to the climatology may be a better proxy for LIW occurrence in Florida (Figure 4 and Figure 6). Similarly, the differences in CBH were more significant in Florida. High-based clouds and low moisture content at the low- or mid-level are the typical meteorological conditions of dry thunderstorms in the western United States, as demonstrated by Wallman (2004) [33] and Nauslar et al. (2013) [15].
For LIW in Arizona and New Mexico, the temperature was higher than that for CG strokes at altitudes below the 600 hPa pressure level (p-value < 0.05), while the opposite was found above the 600 hPa pressure level (p-value < 0.05). An exception was found at the 500 hPa pressure level, where a p-value < 0.05 indicates similar median values. High temperature at lower levels can favor air convection and LIW, while low temperature at high levels can favor the occurrence of lightning by promoting ice content, an essential ingredient for electrification [64]. For typical thunderstorms, rain and moisture are higher between the ground and the 650 hPa level, while vertical velocity is lower. As a consequence, the condensation point is reached earlier, and rain falls from a lower cloud base. For storms causing fire ignition, the moisture is located higher up (between 450 hPa and 250 hPa), where it is colder, and therefore creates more ice. The moisture located higher up is related to the stronger vertical velocity at around 700 hPa, causing the higher cloud base. The characteristics of fire-igniting thunderstorms in Arizona and New Mexico are connected to the meteorological conditions of low precipitation supercells, formed in environments with low atmospheric moisture content and strong mid-level storm-relative winds [65].
The low vertical velocity (weak convection) and low ice content of fire-producing thunderstorms in Florida coincides with the thunderstorms reported by Barth et al. (2015) [61] in Alabama and by Pérez-Invernón et al. (2021) [20] in the Mediterranean Basin. Weak-convection thunderstorms are characterized by low lightning-flash densities, which coincides with fire-producing thunderstorms reported by Soler et al. (2021) [62] in Catalonia.
We also found remarkable differences in the vertical velocity and the moisture and ice content of the upper troposphere for thunderstorms producing LIW in Arizona and New Mexico as well as in Florida (Figure 5 and Figure 7). In the first region, the preferential meteorological conditions for LIW occurrence are compatible with low precipitation supercells. The moisture and ice content of the upper atmosphere is higher than the median during all the CG strokes, while the updraft is weaker. We found, however, the opposite in Florida. High updraft, moisture, and ice in the upper troposphere are necessary conditions for lightning activity [64] in both regions. Therefore, we can conclude that the most favorable meteorological conditions for LIW in Arizona and New Mexico seem to be those that favor the occurrence of high lightning activity (strong updraft, high ice content in the upper troposphere), while in Florida, the occurrence of LIW may be more influenced by meteorological conditions that favor the spread of LIW (low precipitation, high CBH, and high surface temperature). These findings are useful for the implementation of LIW occurrence in atmospheric models that use meteorological parameters as a proxy.
The reported higher elevation of LIW as compared to total CG strokes in Arizona and New Mexico is consistent with Conedera et al. (2006) [66], who reported that LIW in the Alps tend to occur at high elevations and on a steeper relief. Steeper slopes can favor the survival and arrival phases of LIW and also the attachment of lightning strikes to trees.

4.2. Relationship between LIW and LCC (>18 ms) Lightning Occurrence

McEachron and Hagenguth (1942) [18] and Fuquay et al. (1967) [19] proposed that LCC lightning discharges are the main precursors of LIW. Nevertheless, in our study regions, the results reveal that in general, the meteorological conditions that favor the occurrence of LCC (>18 ms) lightning in Arizona and New Mexico and in Florida are not necessarily the preferential meteorological conditions for the occurrence of LIW Figure 9, as previously reported by Pérez-Invernón et al. (2021) [20]. However, we did find some similarities.
In the case of Arizona and New Mexico, thunderstorms producing LIW and thunderstorms producing LCC (>18 ms) lightning exhibited higher updraft during a typical lightning occurrence in the upper troposphere. Thunderstorms producing LIW and thunderstorms producing LCC (>18 ms) lightning also had higher ice content in the clouds during the occurrence of typical lightning (lightning that is not LCC (>18 ms)). The characteristics of these thunderstorms coincide with those of supercells [67].
In the case of LIW in FL, the ice content of thunderstorms producing LIW was lower for typical CG strokes, while the opposite was found for thunderstorms producing LCC (>18 ms) lightning. The precipitation for thunderstorms producing both LIW and LCC (>18 ms) lightning was lower than the precipitation associated with typical CG strokes. However, the deviation of the updraft with respect to the median during typical lightning in thunderstorms producing LIW and thunderstorms producing LCC (>18 ms) lightning was the opposite.
Both LIW and LCC (>18 ms) lightning are rare with respect to typical lightning. Long-term efforts to develop a solid database of wildfires in the CONUS have significantly contributed to the identification of preferential meteorological conditions of LIW (e.g., [31,68,69,70]). However, the detection of LCC (>18 ms) lightning by the typical Lightning Location Systems (LLS) is difficult due to the weak radiation emitted by the continuing phase of the discharge. As a consequence, the total number of reported LCC (>18 ms) lightning flashes over any particular region is scarce, and a large uncertainty is still present in the analysis of their preferential meteorological conditions, as we obtained here.
In summary, the analysis of the preferential meteorological conditions for LIW and LCC (>18 ms) lightning shown in Figure 9 indicates that LIW and LCC (>18 ms) lightning can occur over a wide range of meteorological conditions even if there are some of them that favor their occurrence. More research and a larger data set are needed to investigate the particular role of LCC (>18 ms) lightning in the ignition of LIW.

5. Summary and Conclusions

In this work, we analyzed the meteorological conditions that favor the occurrence of LIW and LCC (>18 ms) lightning in Arizona and New Mexico and in Florida. We found that the meteorological conditions characterized by low precipitation rates and high-based clouds seem to favor the occurrence of LIW. We also observed that the meteorological conditions in the upper troposphere may be associated with the occurrence of LIW, indicating that the influence from the upper troposphere is important. In addition, we found some shared meteorological conditions related to both LCC (>18 ms) lightning and LIW (such as high-based clouds and low precipitation rates), although our analysis suggests that LCC (>18 ms) lightning can occur under a wide variety of weather conditions. The main conclusions of this work are the following:
  • The lightning-ignition efficiency in coniferous forests such as ponderosa pine in Arizona and New Mexico and slash pine in Florida is higher than in other forest types of these regions.
  • High temperature between the ground and the 800 hPa level, low precipitation rates, and high-based clouds favor the occurrence of LIW in Arizona and New Mexico and in Florida.
  • The meteorological conditions that favor the occurrence of LIW in Arizona and New Mexico are closely related with the meteorological conditions that favor high lightning activity (strong updraft, high ice content in clouds) and are compatible with low precipitation supercells. In FL, the preferential meteorological conditions for LIW are similar, although more shifted towards the conditions that favor the ignition and spread of fire (low precipitation rate, high surface temperature, high-based clouds).
  • In Arizona and New Mexico and in FL, LCC (>18 ms) lightning tends to occur during thunderstorms that have higher values for relative humidity than the lightning climatology and lower values for temperature in the entire troposphere. In addition, the ice content of clouds tends to be lower and the updraft weaker in the lower troposphere for thunderstorms producing LCC (>18 ms) lightning.
  • The meteorological conditions associated with the occurrence of LCC (>18 ms) lightning in Arizona and New Mexico and in Florida are not necessarily the same meteorological conditions that favor the occurrence of LIW.
The Geostationary Operational Environmental Satellite-16 (GOES-16) can significantly contribute to the explanation of the role of LCC lightning in the occurrence of LIW in the United States. GOES-16, which has been operating since 2017, is equipped with a Geostationary Lightning Mapper (GLM) that reports continuous data on lightning occurrence and optical-flash duration over North America and the Pacific [71,72,73]. In addition, the Advanced Baseline Imager (ABI) aboard GOES-16 is a multi-channel passive imaging radiometer that can detect the occurrence of wildfires [74]. The current and future scientific exploitation of GLM and ABI will contribute to the clarification of the preferential meteorological conditions for LIW and LCC lightning and can serve to develop better parameterizations of LIW in atmospheric models. However, developing such a parameterization is out of the scope of this work and will be explored in future studies.

Supplementary Materials

The following supporting information can be downloaded at: https://www.mdpi.com/article/10.3390/fire5040096/s1, Figures S1–S4: Meteorological conditions that favor the occurrence of LCC (>18 ms)-lightning in the Western Mountains and Arid West (WMAR) and in the Atlantic and Gulf Coastal Plain (AGCP).

Author Contributions

Conceptualization, F.J.P.-I. and H.H.; methodology, F.J.P.-I. and J.V.M.; software, F.J.P.-I.; validation, F.J.P.-I., H.H. and J.V.M.; formal analysis, F.J.P.-I., H.H. and J.V.M.; investigation, F.J.P.-I., H.H. and J.V.M.; resources, F.J.P.-I.; data curation, F.J.P.-I. and J.V.M.; writing—original draft preparation, F.J.P.-I., H.H. and J.V.M.; writing—review and editing, F.J.P.-I., H.H. and J.V.M.; project administration, F.J.P.-I.; funding acquisition, F.J.P.-I. All authors have read and agreed to the published version of the manuscript.

Funding

This research was supported by the Federal Ministry for Education and Research of Germany through the Alexander von Humboldt Foundation. The APC was funded by the Deutsches Zentrum für Luft- und Raumfahrt, Institut für Physik der Atmosphäre.

Institutional Review Board Statement

Not applicable.

Informed Consent Statement

Not applicable.

Data Availability Statement

TRMM-LIS data can be freely downloaded from https://ghrc.nsstc.nasa.gov/lightning/data/data_lis_trmm.html (accessed on 10 June 2022). NLDN data can be obtained upon request from Vaisala. The ERA5 meteorological data are freely accessible through Copernicus Climate Change Service (C3S) (2017): ERA5: Fifth generation of ECMWF atmospheric reanalyses of the global climate. Copernicus Climate Change Service Climate Data Store (CDS) https://cds.climate.copernicus.eu/cdsapp (accessed on 10 June 2022). Fire data can be freely downloaded from https://www.fs.usda.gov/rds/archive/Catalog/RDS-2013-0009.5 (accessed on 10 June 2022). Forest type data can be freely downloaded from https://data.fs.usda.gov/geodata/rastergateway/forest_type/ (accessed on 10 June 2022).

Acknowledgments

The authors would like to thank NASA for providing TRMM-LIS lightning data, Vaisala for providing NLDN lightning data, and ECMWF for providing the data from ERA5 forecasting models. FJPI acknowledges the sponsorship provided by the Federal Ministry for Education and Research of Germany through the Alexander von Humboldt Foundation. J.V.M. acknowledges the support from a postdoctoral fellowship funded by the Government of Asturias (Spain) through FICYT (AYUD/2021/58534).

Conflicts of Interest

The authors declare no conflict of interest. The funders had no role in the design of the study; in the collection, analyses, or interpretation of data; in the writing of the manuscript, or in the decision to publish the results.

Abbreviations

The following abbreviations are used in this manuscript:
ABIAdvanced Baseline Imager
AGCPAtlantic and Gulf Coastal Plain
ANMArizona and New Mexico
CBHCloud Base Height
CGCloud-to-Ground
CTHCloud Top Height
COMMASCollaborative Model for Multiscale Atmospheric Simulation
CONUSContinental United States
ERA5European Centre for Medium-Range Weather Forecasts (ECMWF) fifth-generation reanalysis
FLFlorida
GLMGeostationary Lightning Mapper
GOES-16Geostationary Operational Environmental Satellite-16
HAMMAHuntsville Alabama Marx Meter Array
ICIntra-cloud
ISSInternational Space Station
LCCLong-Continuing-Current
LIELightning Ignition Efficiency
LISLightning Imaging Sensor
LIWLightning-Ignited Wildfires
LLSLightning Location Systems
NICCNational Interagency Coordination Center
NLDNNational Lightning Detection Network
OTDOptical Transient Detector
TTTotal Totals Index
VLFVery Low Frequency
WMAWWestern Mountains and the Arid West

References

  1. Balch, J.K.; Bradley, B.A.; Abatzoglou, J.T.; Nagy, R.C.; Fusco, E.J.; Mahood, A.L. Human-started wildfires expand the fire niche across the United States. Proc. Natl. Acad. Sci. USA 2017, 114, 2946–2951. [Google Scholar] [CrossRef] [Green Version]
  2. Coniglio, M.C.; Stensrud, D.J.; Wicker, L.J. Effects of upper-level shear on the structure and maintenance of strong quasi-linear mesoscale convective systems. J. Atmos. Sci. 2006, 63, 1231–1252. [Google Scholar] [CrossRef] [Green Version]
  3. Lyons, W.A.; Nelson, T.E.; Williams, E.R.; Cramer, J.A.; Turner, T.R. Enhanced Positive Cloud-to-Ground Lightning in Thunderstorms Ingesting Smoke from Fires. Science 1998, 282, 77. [Google Scholar] [CrossRef] [PubMed]
  4. Anderson, K. A model to predict lightning-caused fire occurrences. Int. J. Wildland Fire 2002, 11, 163–172. [Google Scholar] [CrossRef]
  5. Stocks, B.; Mason, J.; Todd, J.; Bosch, E.; Wotton, B.; Amiro, B.; Flannigan, M.; Hirsch, K.; Logan, K.; Martell, D.; et al. Large forest fires in Canada, 1959–1997. J. Geophys. Res. Atmos. 2002, 107, FFR–5. [Google Scholar] [CrossRef]
  6. Wotton, B.; Martell, D.L. A lightning fire occurrence model for Ontario. Can. J. For. Res. 2005, 35, 1389–1401. [Google Scholar] [CrossRef]
  7. Hall, B.L.; Brown, T.J. Climatology of positive polarity flashes and multiplicity and their relation to natural wildfire ignitions. In Proceedings of the International Lightning Detection Conference, Tucson, AZ, USA, 24–25 April 2006; pp. 24–25. [Google Scholar]
  8. Fernandes, W.A.; Pinto, I.R.; Pinto, O., Jr.; Longo, K.M.; Freitas, S.R. New findings about the influence of smoke from fires on the cloud-to-ground lightning characteristics in the Amazon region. Geophys. Res. Lett. 2006, 33, L20810. [Google Scholar] [CrossRef] [Green Version]
  9. Kochtubajda, B.; Flannigan, M.; Gyakum, J.; Stewart, R.; Logan, K.; Nguyen, T.V. Lightning and fires in the Northwest Territories and responses to future climate change. Arctic 2006, 59, 211–221. [Google Scholar] [CrossRef] [Green Version]
  10. Lang, T.J.; Rutledge, S.A. Cloud-to-ground lightning downwind of the 2002 Hayman forest fire in Colorado. Geophys. Res. Lett. 2006, 33, L07801. [Google Scholar] [CrossRef] [Green Version]
  11. Rosenfeld, D.; Fromm, M.; Trentmann, J.; Luderer, G.; Andreae, M.; Servranckx, R. The Chisholm firestorm: Observed microstructure, precipitation and lightning activity of a pyro-cumulonimbus. Atmos. Chem. Phys. 2007, 7, 645–659. [Google Scholar] [CrossRef] [Green Version]
  12. Hall, B.L. Precipitation associated with lightning-ignited wildfires in Arizona and New Mexico. Int. J. Wildland Fire 2007, 16, 242–254. [Google Scholar] [CrossRef]
  13. Altaratz, O.; Koren, I.; Yair, Y.; Price, C. Lightning response to smoke from Amazonian fires. Geophys. Res. Lett. 2010, 37, L03804. [Google Scholar] [CrossRef] [Green Version]
  14. Dowdy, A.J.; Mills, G.A. Atmospheric and fuel moisture characteristics associated with lightning-attributed fires. J. Appl. Meteorol. Climatol. 2012, 51, 2025–2037. [Google Scholar] [CrossRef]
  15. Nauslar, N.J.; Kaplan, M.L.; Wallmann, J.; Brown, T.J. A Forecast Procedure for Dry Thunderstorms. J. Oper. Meteorol. 2013, 1. [Google Scholar] [CrossRef]
  16. Lang, T.J.; Rutledge, S.A.; Dolan, B.; Krehbiel, P.; Rison, W.; Lindsey, D.T. Lightning in wildfire smoke plumes observed in Colorado during summer 2012. Mon. Weather Rev. 2014, 142, 489–507. [Google Scholar] [CrossRef] [Green Version]
  17. Veraverbeke, S.; Rogers, B.M.; Goulden, M.L.; Jandt, R.R.; Miller, C.E.; Wiggins, E.B.; Randerson, J.T. Lightning as a major driver of recent large fire years in North American boreal forests. Nat. Clim. Chang. 2017, 7, 529. [Google Scholar] [CrossRef]
  18. McEachron, K.; Hagenguth, J. Effect of lightning on thin metal surfaces. IEEE Trans. Commun. 1942, 61, 559–564. [Google Scholar]
  19. Fuquay, D.M.; Baughman, R.; Taylor, A.; Hawe, R. Characteristics of seven lightning discharges that caused forest fires. J. Geophys. Res. 1967, 72, 6371–6373. [Google Scholar] [CrossRef]
  20. Pérez-Invernón, F.J.; Huntrieser, H.; Soler, S.; Gordillo-Vázquez, F.J.; Pineda, N.; Navarro-González, J.; Reglero, V.; Montanyà, J.; van der Velde, O.; Koutsias, N. Lightning-ignited wildfires and long-continuing-current lightning in the Mediterranean Basin: Preferential meteorological conditions. Atmos. Chem. Phys. Discuss. 2021, 21, 17529–17557. [Google Scholar] [CrossRef]
  21. Pérez-Invernón, F.J.; Huntrieser, H.; Jöckel, P.; Gordillo-Vázquez, F.J. A parameterization of long-continuing-current (LCC) lightning in the lightning submodel LNOX (version 3.0) of the Modular Earth Submodel System (MESSy, version 2.54). Geosci. Model Dev. 2022, 15, 1545–1565. [Google Scholar] [CrossRef]
  22. Rorig, M.L.; McKay, S.J.; Ferguson, S.A.; Werth, P. Model-generated predictions of dry thunderstorm potential. J. Appl. Meteorol. Climatol. 2007, 46, 605–614. [Google Scholar] [CrossRef] [Green Version]
  23. Pineda, N.; Rigo, T. The rainfall factor in lightning-ignited wildfires in Catalonia. Agric. Forest Meteorol. 2017, 239, 249–263. [Google Scholar] [CrossRef]
  24. Vant-Hull, B.; Thompson, T.; Koshak, W. Optimizing precipitation thresholds for best correlation between dry lightning and wildfires. J. Geophys. Res. Atmos. 2018, 123, 2628–2639. [Google Scholar] [CrossRef]
  25. MacNamara, B.R.; Schultz, C.J.; Fuelberg, H.E. Flash characteristics and precipitation metrics of Western US lightning-initiated wildfires from 2017. Fire 2020, 3, 5. [Google Scholar] [CrossRef] [Green Version]
  26. Krawchuk, M.; Cumming, S.; Flannigan, M.D.; Wein, R. Biotic and abiotic regulation of lightning fire initiation in the mixedwood boreal forest. Ecology 2006, 87, 458–468. [Google Scholar] [CrossRef]
  27. Reineking, B.; Weibel, P.; Conedera, M.; Bugmann, H. Environmental determinants of lightning-v. human-induced forest fire ignitions differ in a temperate mountain region of Switzerland. Int. J. Wildland Fire 2010, 19, 541–557. [Google Scholar] [CrossRef]
  28. Müller, M.M.; Vacik, H.; Diendorfer, G.; Arpaci, A.; Formayer, H.; Gossow, H. Analysis of lightning-induced forest fires in Austria. Theor. Appl. Climatol. 2013, 111, 183–193. [Google Scholar] [CrossRef] [Green Version]
  29. Moris, J.V.; Conedera, M.; Nisi, L.; Bernardi, M.; Cesti, G.; Pezzatti, G.B. Lightning-caused fires in the Alps: Identifying the igniting strokes. Agric. For Meteorol. 2020, 290, 107990. [Google Scholar] [CrossRef]
  30. Pineda, N.; Altube, P.; Alcasena, F.J.; Casellas, E.; San Segundo, H.; Montanyà, J. Characterizing the holdover phase of lightning-ignited wildfires in Catalonia. SSRN 2022. [Google Scholar] [CrossRef]
  31. Flannigan, M.; Wotton, B. Lightning-ignited forest fires in northwestern Ontario. Can. J. For. Res. 1991, 21, 277–287. [Google Scholar] [CrossRef]
  32. Ogilvie, C. Lightning Fires in Saskatchewan Forests; Fire Management Notes-US Department of Agriculture, Forest Service (USA): Singapore, 1989.
  33. Wallmann, J. A procedure for forecasting dry thunderstorms in the Great Basin using the dynamic tropopause and alternate tools for assessing instability. NOAA/NWS WR Tech. Attach 2004, 4–8. [Google Scholar]
  34. Hersbach, H.; Bell, B.; Berrisford, P.; Hirahara, S.; Horányi, A.; Muñoz-Sabater, J.; Nicolas, J.; Peubey, C.; Radu, R.; Schepers, D.; et al. The ERA5 global reanalysis. Q. J. R. Meteorol. Soc. 2020, 146, 1999–2049. [Google Scholar] [CrossRef]
  35. Thépaut, J.N.; Dee, D.; Engelen, R.; Pinty, B. The Copernicus programme and its climate change service. In Proceedings of the IGARSS 2018 IEEE International Geoscience and Remote Sensing Symposium, Valencia, Spain, 22–27 July 2018; pp. 1591–1593. [Google Scholar]
  36. Marsh, D.R.; Mills, M.J.; Kinnison, D.E.; Lamarque, J.F.; Calvo, N.; Polvani, L.M. Climate change from 1850 to 2005 simulated in CESM1 (WACCM). J. Clim. 2013, 26, 7372–7391. [Google Scholar] [CrossRef] [Green Version]
  37. Jöckel, P.; Tost, H.; Pozzer, A.; Kunze, M.; Kirner, O.; Brenninkmeijer, C.A.; Brinkop, S.; Cai, D.S.; Dyroff, C.; Eckstein, J.; et al. Earth system chemistry integrated modelling (ESCiMo) with the modular Earth submodel system (MESSy) version 2.51. Geosci. Model. Dev. 2016, 9, 1153–1200. [Google Scholar] [CrossRef] [Green Version]
  38. Mitchener, L.J.; Parker, A.J. Climate, lightning, and wildfire in the national forests of the southeastern United States: 1989–1998. Phys. Geogr. 2005, 26, 147–162. [Google Scholar] [CrossRef]
  39. Slocum, M.G.; Platt, W.J.; Beckage, B.; Panko, B.; Lushine, J.B. Decoupling natural and anthropogenic fire regimes: A case study in Everglades National Park, Florida. Nat. Areas J. 2007, 27, 41–55. [Google Scholar] [CrossRef]
  40. Duncan, B.W.; Adrian, F.W.; Stolen, E.D. Isolating the lightning ignition regime from a contemporary background fire regime in east-central Florida, USA. Can. J. For. Res. 2010, 40, 286–297. [Google Scholar] [CrossRef]
  41. Nag, A.; Murphy, M.J.; Schulz, W.; Cummins, K.L. Lightning locating systems: Insights on characteristics and validation techniques. Earth Space Sci. 2015, 2, 65–93. [Google Scholar] [CrossRef]
  42. Medici, G.; Cummins, K.L.; Cecil, D.J.; Koshak, W.J.; Rudlosky, S.D. The intracloud lightning fraction in the contiguous United States. Mon. Weather Rev. 2017, 145, 4481–4499. [Google Scholar] [CrossRef] [Green Version]
  43. Cummins, K.L.; Murphy, M.J. An overview of lightning locating systems: History, techniques, and data uses, with an in-depth look at the US NLDN. IEEE Trans. Electromagn. Compat. 2009, 51, 499–518. [Google Scholar] [CrossRef]
  44. Zhu, Y.; Lyu, W.; Cramer, J.; Rakov, V.; Bitzer, P.; Ding, Z. Analysis of location errors of the US National Lightning Detection Network using lightning strikes to towers. J. Geophys. Res. Atm. 2020, 125, e2020JD032530. [Google Scholar]
  45. Rudlosky, S.D.; Shea, D.T. Evaluating WWLLN performance relative to TRMM/LIS. Geophys. Res. Lett. 2013, 40, 2344–2348. [Google Scholar] [CrossRef]
  46. Christian, H.J.; Blakeslee, R.J.; Boccippio, D.J.; Boeck, W.L.; Buechler, D.E.; Driscoll, K.T.; Goodman, S.J.; Hall, J.M.; Koshak, J.M.; Mach, D.M.; et al. Global frequency and distribution of lightning as observed from space by the Optical Transient Detector. J. Geophys. Res. 2003, 108, ACL 4-1–ACL 4-15. [Google Scholar] [CrossRef]
  47. Boccippio, D.J.; Koshak, W.J.; Blakeslee, R.J. Performance assessment of the optical transient detector and lightning imaging sensor. Part I: Predicted diurnal variability. J. Atmos. Ocean Technol. 2002, 19, 1318–1332. [Google Scholar] [CrossRef]
  48. Mach, D.M.; Christian, H.J.; Blakeslee, R.J.; Boccippio, D.J.; Goodman, S.J.; Boeck, W.L. Performance assessment of the Optical Transient Detector and Lightning Imaging Sensor. J. Geophys. Res. Atm. 2007, 112. [Google Scholar] [CrossRef]
  49. Cecil, D.J.; Buechler, D.E.; Blakeslee, R.J. Gridded lightning climatology from TRMM-LIS and OTD: Dataset description. Atmos. Res. 2014, 135, 404–414. [Google Scholar] [CrossRef] [Green Version]
  50. Bitzer, P.M.; Christian, H.J. Timing uncertainty of the Lightning Imaging Sensor. J. Atmos. Ocean Technol. 2015, 32, 453–460. [Google Scholar] [CrossRef]
  51. Bitzer, P.M. Global distribution and properties of continuing current in lightning. J. Geophys. Res. Atm. 2017, 122, 1033–1041. [Google Scholar] [CrossRef]
  52. Wright, D.K.; Glasgow, L.S.; McCaughey, W.W.; Sutherland, E.K. Coram Experimental Forest 15 Minute Streamflow Data; U.S. Department of Agriculture, Forest Service, Rocky Mountain Research Station: Fort Collins, CO, USA, 2011. [CrossRef]
  53. Short, K.C. Spatial Wildfire Occurrence Data for the United States, 1992–2018 [FPA_FOD_20210617], 5th ed.; Forest Service Research Data Archive: Fort Collins, CO, USA, 2021.
  54. Ruefenacht, B.; Finco, M.; Nelson, M.; Czaplewski, R.; Helmer, E.; Blackard, J.; Holden, G.; Lister, A.; Salajanu, D.; Weyermann, D.; et al. Conterminous US and Alaska forest type mapping using forest inventory and analysis data. Photogramm. Eng. Remote Sens. 2008, 74, 1379–1388. [Google Scholar] [CrossRef]
  55. Podur, J.; Martell, D.L.; Csillag, F. Spatial patterns of lightning-caused forest fires in Ontario, 1976–1998. Ecol. Modell. 2003, 164, 1–20. [Google Scholar] [CrossRef]
  56. Poli, P.; Hersbach, H.; Dee, D.P.; Berrisford, P.; Simmons, A.J.; Vitart, F.; Laloyaux, P.; Tan, D.G.; Peubey, C.; Thépaut, J.N.; et al. ERA-20C: An atmospheric reanalysis of the twentieth century. J. Clim. 2016, 29, 4083–4097. [Google Scholar] [CrossRef]
  57. Larjavaara, M.; Pennanen, J.; Tuomi, T. Lightning that ignites forest fires in Finland. Agric. Forest Meteorol. 2005, 132, 171–180. [Google Scholar] [CrossRef]
  58. Schultz, C.J.; Nauslar, N.J.; Wachter, J.B.; Hain, C.R.; Bell, J.R. Spatial, Temporal and Electrical Characteristics of Lightning in Reported Lightning-Initiated Wildfire Events. Fire 2019, 2, 18. [Google Scholar] [CrossRef] [PubMed] [Green Version]
  59. Kruskal, W.H.; Wallis, W.A. Use of ranks in one-criterion variance analysis. J. Am. Stat. Assoc. 1952, 47, 583–621. [Google Scholar] [CrossRef]
  60. Efron, B.; Tibshirani, R.J. An Introduction to the Bootstrap; CRC Press: Boca Raton, FL, USA, 1994. [Google Scholar]
  61. Barth, M.C.; Cantrell, C.A.; Brune, W.H.; Rutledge, S.A.; Crawford, J.H.; Huntrieser, H.; Carey, L.D.; MacGorman, D.; Weisman, M.; Pickering, K.E.; et al. The deep convective clouds and chemistry (DC3) field campaign. Bull. Am. Meteorol. Soc. 2015, 96, 1281–1309. [Google Scholar] [CrossRef] [Green Version]
  62. Soler, A.; Pineda, N.; San Segundo, H.; Bech, J.; Montanyà, J. Characterisation of thunderstorms that caused lightning-ignited wildfires. Int. J. Wildland Fire 2021, 30, 954–970. [Google Scholar] [CrossRef]
  63. Pineda, N.; Montanyà, J.; Van der Velde, O.A. Characteristics of lightning related to wildfire ignitions in Catalonia. Atmos. Res. 2014, 135, 380–387. [Google Scholar] [CrossRef]
  64. Finney, D.; Doherty, R.; Wild, O.; Huntrieser, H.; Pumphrey, H.; Blyth, A. Using cloud ice flux to parametrise large-scale lightning. Atmos. Chem. Phys. 2014, 14, 12665–12682. [Google Scholar] [CrossRef] [Green Version]
  65. Grant, L.D.; Van Den Heever, S.C. Microphysical and dynamical characteristics of low-precipitation and classic supercells. J. Atmos. Sci. 2014, 71, 2604–2624. [Google Scholar] [CrossRef]
  66. Conedera, M.; Cesti, G.; Pezzatti, G.; Zumbrunnen, T.; Spinedi, F. Lightning-induced fires in the Alpine region: An increasing problem. For. Ecol. Manag. 2006, 234, S68. [Google Scholar] [CrossRef]
  67. Markowski, P.; Hannon, C.; Frame, J.; Lancaster, E.; Pietrycha, A.; Edwards, R.; Thompson, R.L. Characteristics of vertical wind profiles near supercells obtained from the Rapid Update Cycle. Weather Forecast. 2003, 18, 1262–1272. [Google Scholar] [CrossRef]
  68. Fuquay, D.M. A model for predicting lightning fire ignition in wildland fuels. In Intermountain Forest and Range Experiment Station, Forest Service, US; Facsimile Publisher: New Delhi, India, 1979; Volume 217. [Google Scholar]
  69. Krause, A.; Kloster, S.; Wilkenskjeld, S.; Paeth, H. The sensitivity of global wildfires to simulated past, present, and future lightning frequency. J. Geophys. Res. Biogeosci. 2014, 119, 312–322. [Google Scholar] [CrossRef] [Green Version]
  70. Coughlan, R.; Di Giuseppe, F.; Vitolo, C.; Barnard, C.; Lopez, P.; Drusch, M. Using machine learning to predict fire-ignition occurrences from lightning forecasts. Meteorol. Appl. 2021, 28, e1973. [Google Scholar] [CrossRef]
  71. Goodman, S.J.; Blakeslee, R.J.; Koshak, J.M.; Mach, D.; Bailey, J.; Buechler, D.; Carey, L.; Schultz, C.; Bateman, M.; McCaul, E.; et al. The GOES-R geostationary lightning mapper (GLM). Atmos. Res. 2013, 125, 34–49. [Google Scholar] [CrossRef] [Green Version]
  72. Rudlosky, S.D.; Goodman, S.J.; Virts, K.S.; Bruning, E.C. Initial geostationary lightning mapper observations. Geophys. Res. Lett. 2019, 46, 1097–1104. [Google Scholar] [CrossRef]
  73. Fairman, S.I.; Bitzer, P.M. The Detection of Continuing Current in Lightning Using the Geostationary Lightning Mapper. J. Geophys. Res. Atmos. 2022, 127, e2020JD033451. [Google Scholar] [CrossRef]
  74. Schmidt, C. Monitoring fires with the GOES-R series. In The GOES-R Series; Elsevier: Amsterdam, The Netherlands, 2020; pp. 145–163. [Google Scholar]
Figure 1. Lightning-ignited Wildfires (LIW) (red dots) between 2009 and 2013 included in this study for Arizona and New Mexico (left) and for Florida (right).
Fire 05 00096 g001
Figure 2. LIW in Arizona and New Mexico between 2009 and 2013: (a) Monthly distribution of the occurrence of total LIW and CG strokes over ponderosa pine and pinyon-juniper woodlands. (b) Frequency distribution of the peak currents of all CG strokes taking place over ponderosa and pinyon-juniper woodland forests in June and September (black) and of all fire-igniting lightning flashes (red) detected with NLDN. (c) Distribution of the distance between the reported position of ignition and the lightning candidate. (d) Distribution of the holdover.
Fire 05 00096 g002
Figure 3. LIW in Florida between 2009 and 2013: (a) Monthly distribution of the occurrence of total LIW and CG strokes over slash pine and baldcypress. (b) Frequency distribution of the peak currents of all CG strokes taking place over slash pine and baldcypress forests in June and September (black) and of all fire-igniting lightning flashes (red) detected with NLDN. (c) Distribution of the distance between the reported position of ignition and the lightning candidate. (d) Distribution of the holdover.
Fire 05 00096 g003
Figure 4. Frequency distribution of hourly accumulated precipitation (a), air temperature at 2 m altitude (b), CBH value (c), wind shear between the pressure level of 500 hPa and the surface (d), temperature difference between the 700 hPa and 450 hPa pressure levels (e), and Total Totals Index (f) for CG lightning strokes (black) and LIW (red) over ponderosa and pinyon-juniper woodland forests in Arizona and New Mexico during the fire season between 2009 and 2013. The p-values were obtained from the Kruskal–Wallis H-tests [59]. The analysis results for the overlap of the 95% bootstrap CI of the medians are included.
Fire 05 00096 g004
Figure 5. Vertical profiles of the most important meteorological conditions for LIW (red) and typical CG (black) in Arizona and New Mexico. The first column shows the vertical profiles of the median relative humidity (a), specific cloud ice water content (b), specific rain water content (c), vertical velocity (d), and temperature difference (e) for the CG stroke and LIW climatologies during the fire season in Arizona and New Mexico between 2009 and 2013. The second column shows the p-value (solid line) for each vertical level, which represents the probability of equal medians between both distributions (the dashed line shows the significance limit at 0.05). The p-values were obtained from the Kruskal–Wallis H-tests [59].
Fire 05 00096 g005
Figure 6. Frequency distribution of hourly accumulated precipitation (a), air temperature at an altitude of 2 m (b), CBH value (c), wind shear between the 500 hPa pressure level and the surface (d), temperature difference between the 700 hPa and 450 hPa pressure levels (e), and the Total Totals Index (f) for CG lightning strokes (black) and LIW (red) over the ponderosa and pinyon-juniper woodland forests in Florida during the fire season between 2009 and 2013. The p-values were obtained from the Kruskal–Wallis H-tests [59]. The analysis results of the overlap of the 95% bootstrap CI of the medians.
Fire 05 00096 g006
Figure 7. Vertical profiles of the most important meteorological conditions for LIW (red) and typical CG (black) in Florida.The first column shows the vertical profiles of the median relative humidity (a), specific cloud ice water content (b), specific rain water content (c), vertical velocity (d), and temperature difference (e) for the CG stroke and LIW climatologies during the fire season in Florida between 2009 and 2013. The second column shows the p-value (solid line) for each vertical level, representing the probability of equal medians for both distributions (the dashed line shows the significance limit at 0.05). The p-values were obtained from the Kruskal–Wallis H-tests [59].
Fire 05 00096 g007
Figure 8. Flash densities for lightning (top panel) and LCC (>18 ms) lightning (bottom panel) between May and September 1998–2014, obtained from TRMM-LIS lightning data.
Fire 05 00096 g008
Figure 9. Variation with respect to the median of all the CG strokes of some meteorological parameters for thunderstorms producing LIW and LCC (>18 ms) lightning. Note that LIW were analyzed over the regions of Arizona and New Mexico and over Florida, while LCC (>18 ms) lightning were examined in the WMAW and AGCP regions.
Fire 05 00096 g009
Table 1. LIE in forest types of Arizona and New Mexico as well as Florida. Only forest types with >2% of the total LIW are included here. The lightning-ignition efficiency (LIE) for each forest type was calculated as the ratio of total LIW over a given forest type to total CG strokes over the same forest type. Note that the LIW and CG strokes come from 4 months (June–September) and 5 months (May–September) for Arizona and New Mexico and for Florida, respectively.
RegionForest TypeArea (km 2 )CG Strokes         LIW         LIE
Non forest465,167 (76%)9,356,452 (66%)1484 (24%)1/6305 (0.02%)
Ponderosa pine30,130 (5%)1,159,701 (8%)2150 (34%)1/539 (0.19%)
Arizona and New MexicoPinyon-juniper woodlands84,232 (14%)2,649,113 (19%)1860 (30%)1/1424 (0.07%)
Juniper woodland10,690 (2%)289,006 (2%)178 (3%)1/1624 (0.06%)
Douglas-fir4373 (1%)157,241 (1%)173 (3%)1/909 (0.11%)
Evergreen oak woodland4270 (1%)187,593 (3%)158 (3%)1/1187 (0.08%)
Non forest130,319 (79%)9,096,387 (74%)1062 (39%)1/8565 (0.01%)
Slash pine14,194 (9%)1,345,438 (11%)987 (37%)1/1363 (0.07%)
FloridaBaldcypress-water tupelo8859 (5%)902,832 (7%)262 (10%)1/3446 (0.03%)
Sand pine1948 (1%)180,059 (1%)83 (3%)1/2169 (0.05%)
Mixed upland hardwoods3024 (2%)275,862 (2%)63 (2%)1/4379 (0.02%)
Table 2. Main characteristics of LIW in Arizona and New Mexico as well as in Florida.
RegionArizona and New MexicoFlorida
Total number of LIW63012693
Average index A0.870.86
Median elevation of CG strokes1801 m10 m
Median elevation of LIW1912 m7 m
Median distance between fires and flash candidates0.4 km0.5 km
Median holdover12 h13 h
Average peak current of +CG in typical thunderstorms33.0 kA26.7 kA
Average peak current of +CG in LIW41.3 kA40.3 kA
Average peak current of −CG in typical thunderstorms−18.6 kA−19.8 kA
Average peak current of −CG in LIW−20.6 kA−19.2 kA
Publisher’s Note: MDPI stays neutral with regard to jurisdictional claims in published maps and institutional affiliations.

