
A Framework for Burnt Area Mapping and Evacuation Problem Using Aerial Imagery Analysis


Abstract
:1. Introduction
1.1. Queensland Bushfires
1.2. Government Policies and Frameworks
1.3. Advanced Approaches for Disaster Risk Management
2. Problem Statement
3. Methodology
3.1. Case Study
3.2. Proposed Approach
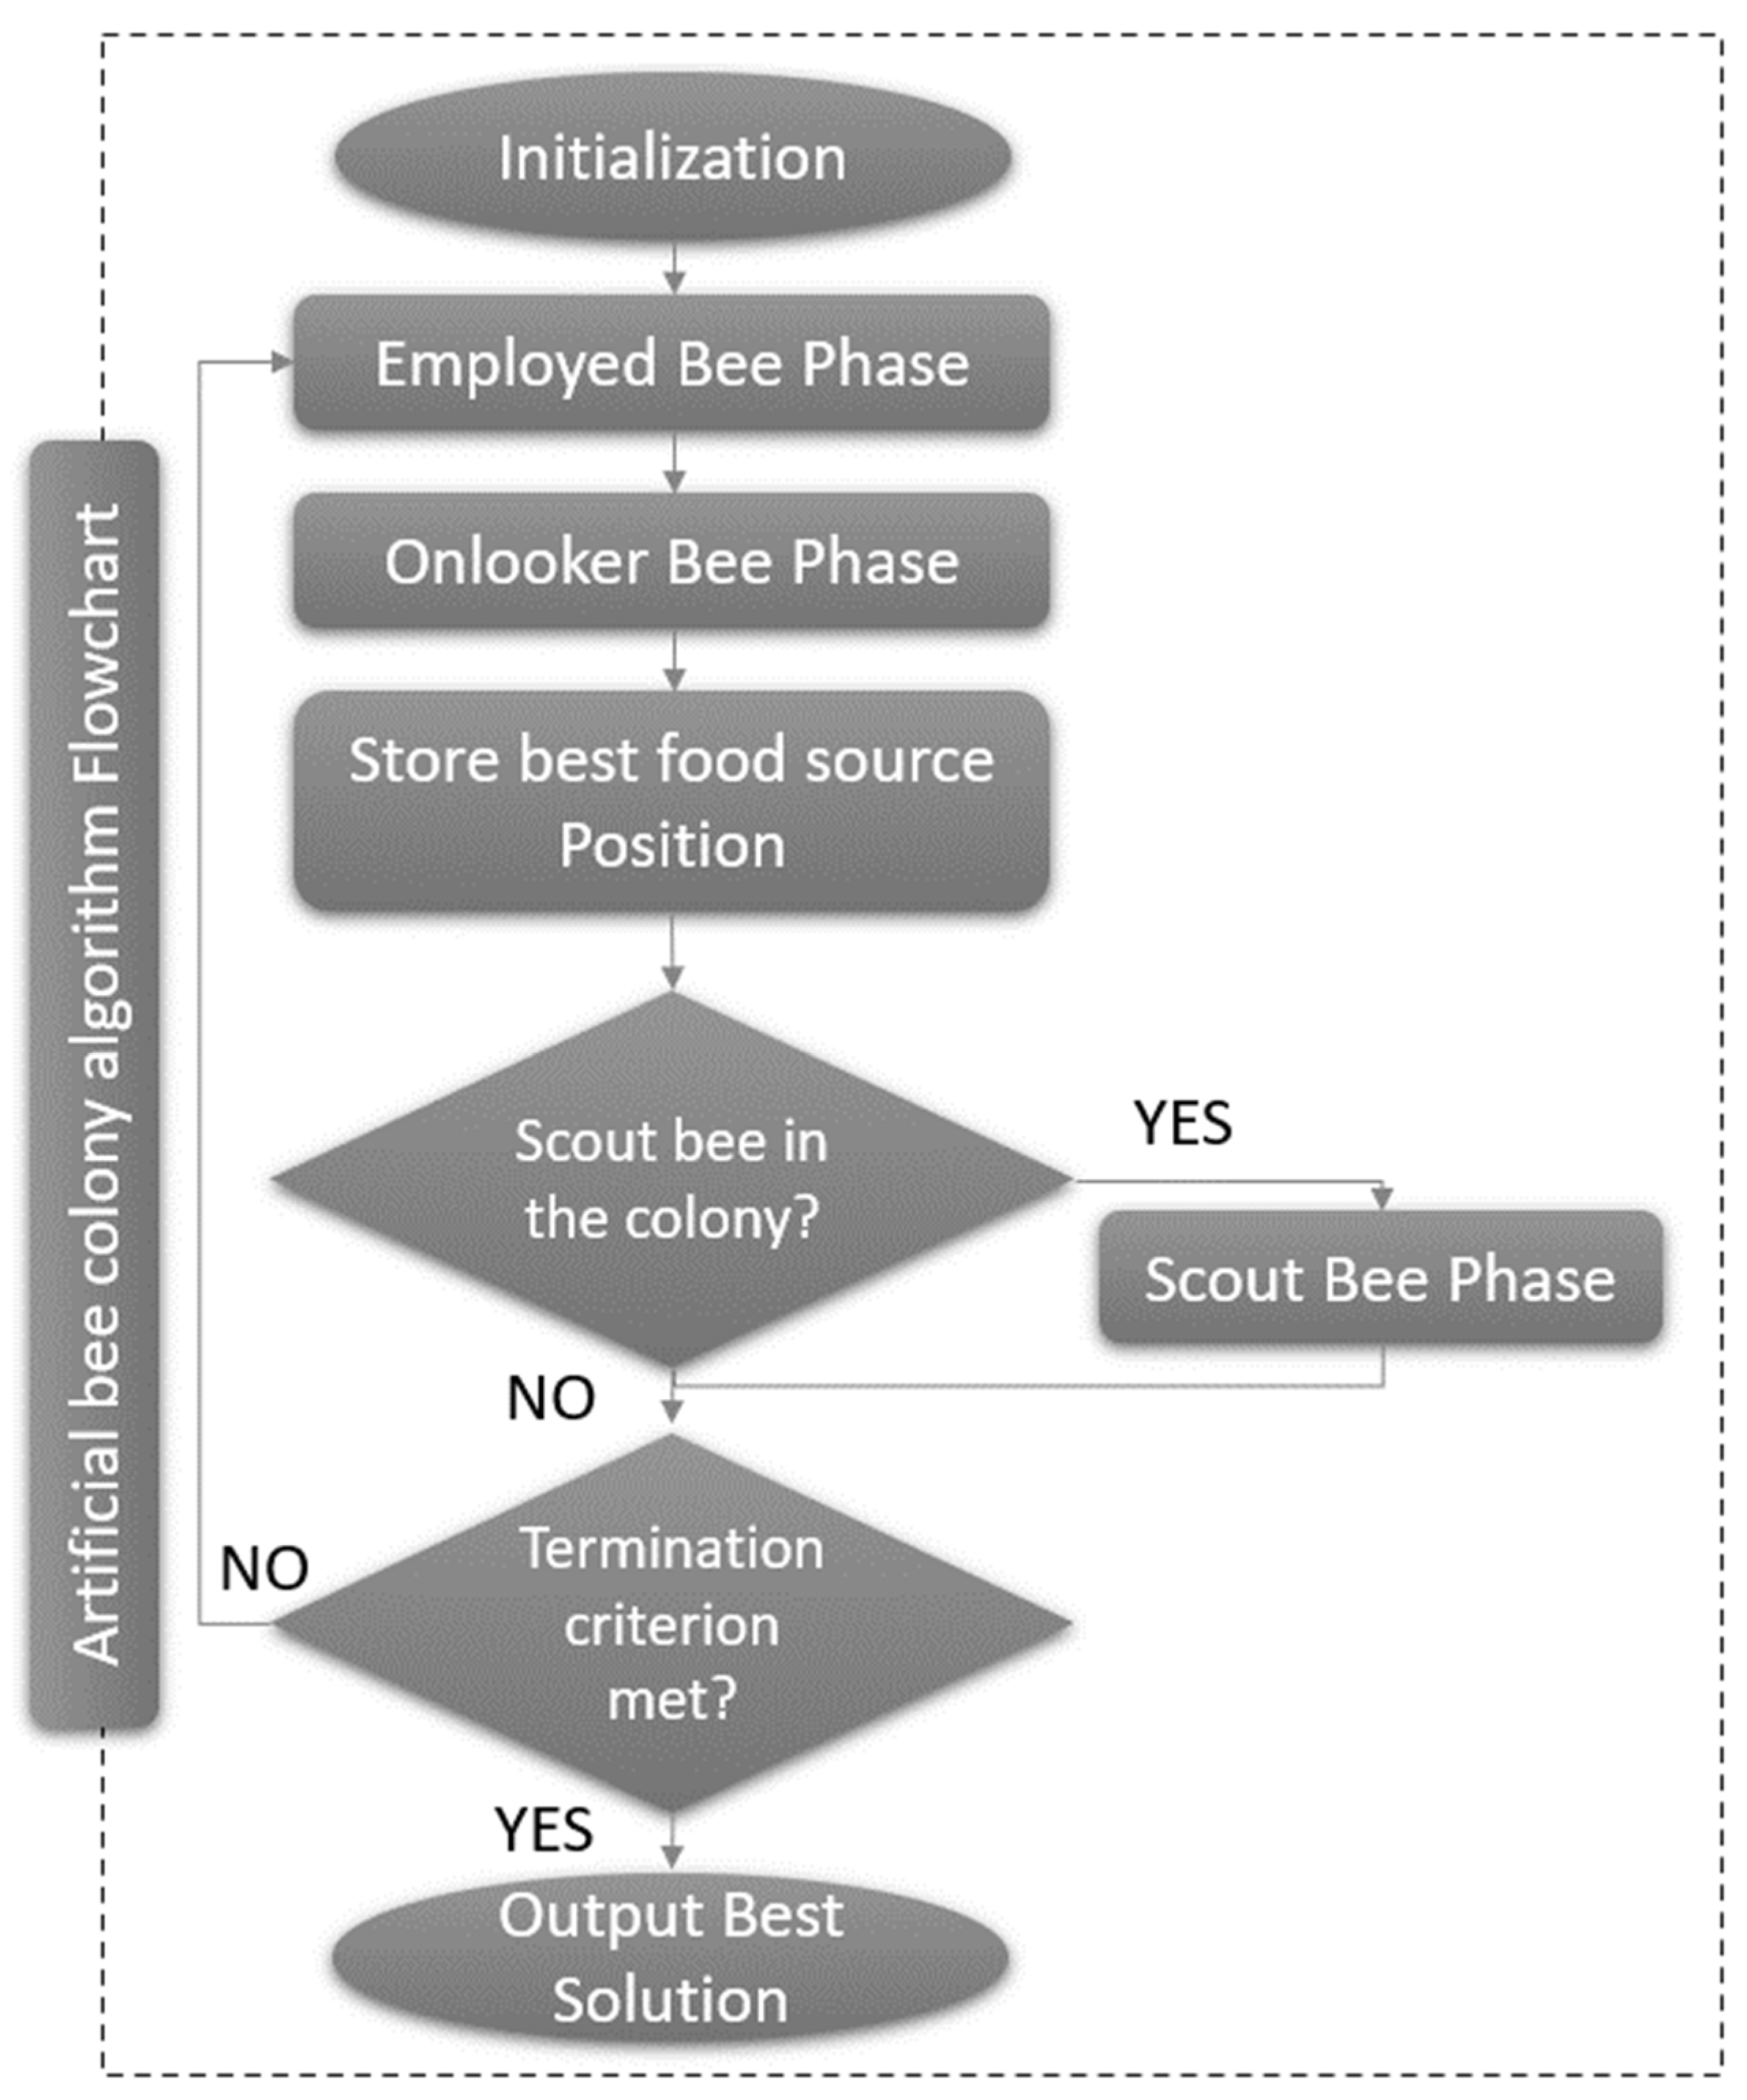
| Algorithm 1: ABC algorithm for UAV path planning |
| 1: Initialization: 2: Initialize the population and evaluate the fitness function; 3: Calculate the value for initial cost function; 4: Set best solution, Solbest ← Sol; 5: Set the maximum number of iterations; 6: Set population size = PS; 7: PS = Onlookerbee = EmployeedBee; 8: Iteration ← 0; 9: Improvement: 10: while iteration < NumOflte do 11: for i = 1: EmployeedBee do 12: Select a random solution and apply random neighborhood structure; 13: Sort solutions in ascending order based on penalty; 14: Determine probability for each solution using: 16: for i = 1: OnlookerBee do 18: Sol* ← Apply random number on Sol*; 19: Sol* ← select the solution who has the higher probability; 20: if Sol ∗ ∗ S olbest then 21: Solbest = Sol**; 22: end if 23: end for 24: Scoutbee determines the abandoned patient’s location and replace it with the new patient’s location; 25: Iteration + + 26: end while. |
3.2.1. Global Optimization Problem
3.2.2. Initiation Phase
3.2.3. Employed Bees
3.2.4. Onlooker Bees Phase
3.2.5. Scout Bees Phase
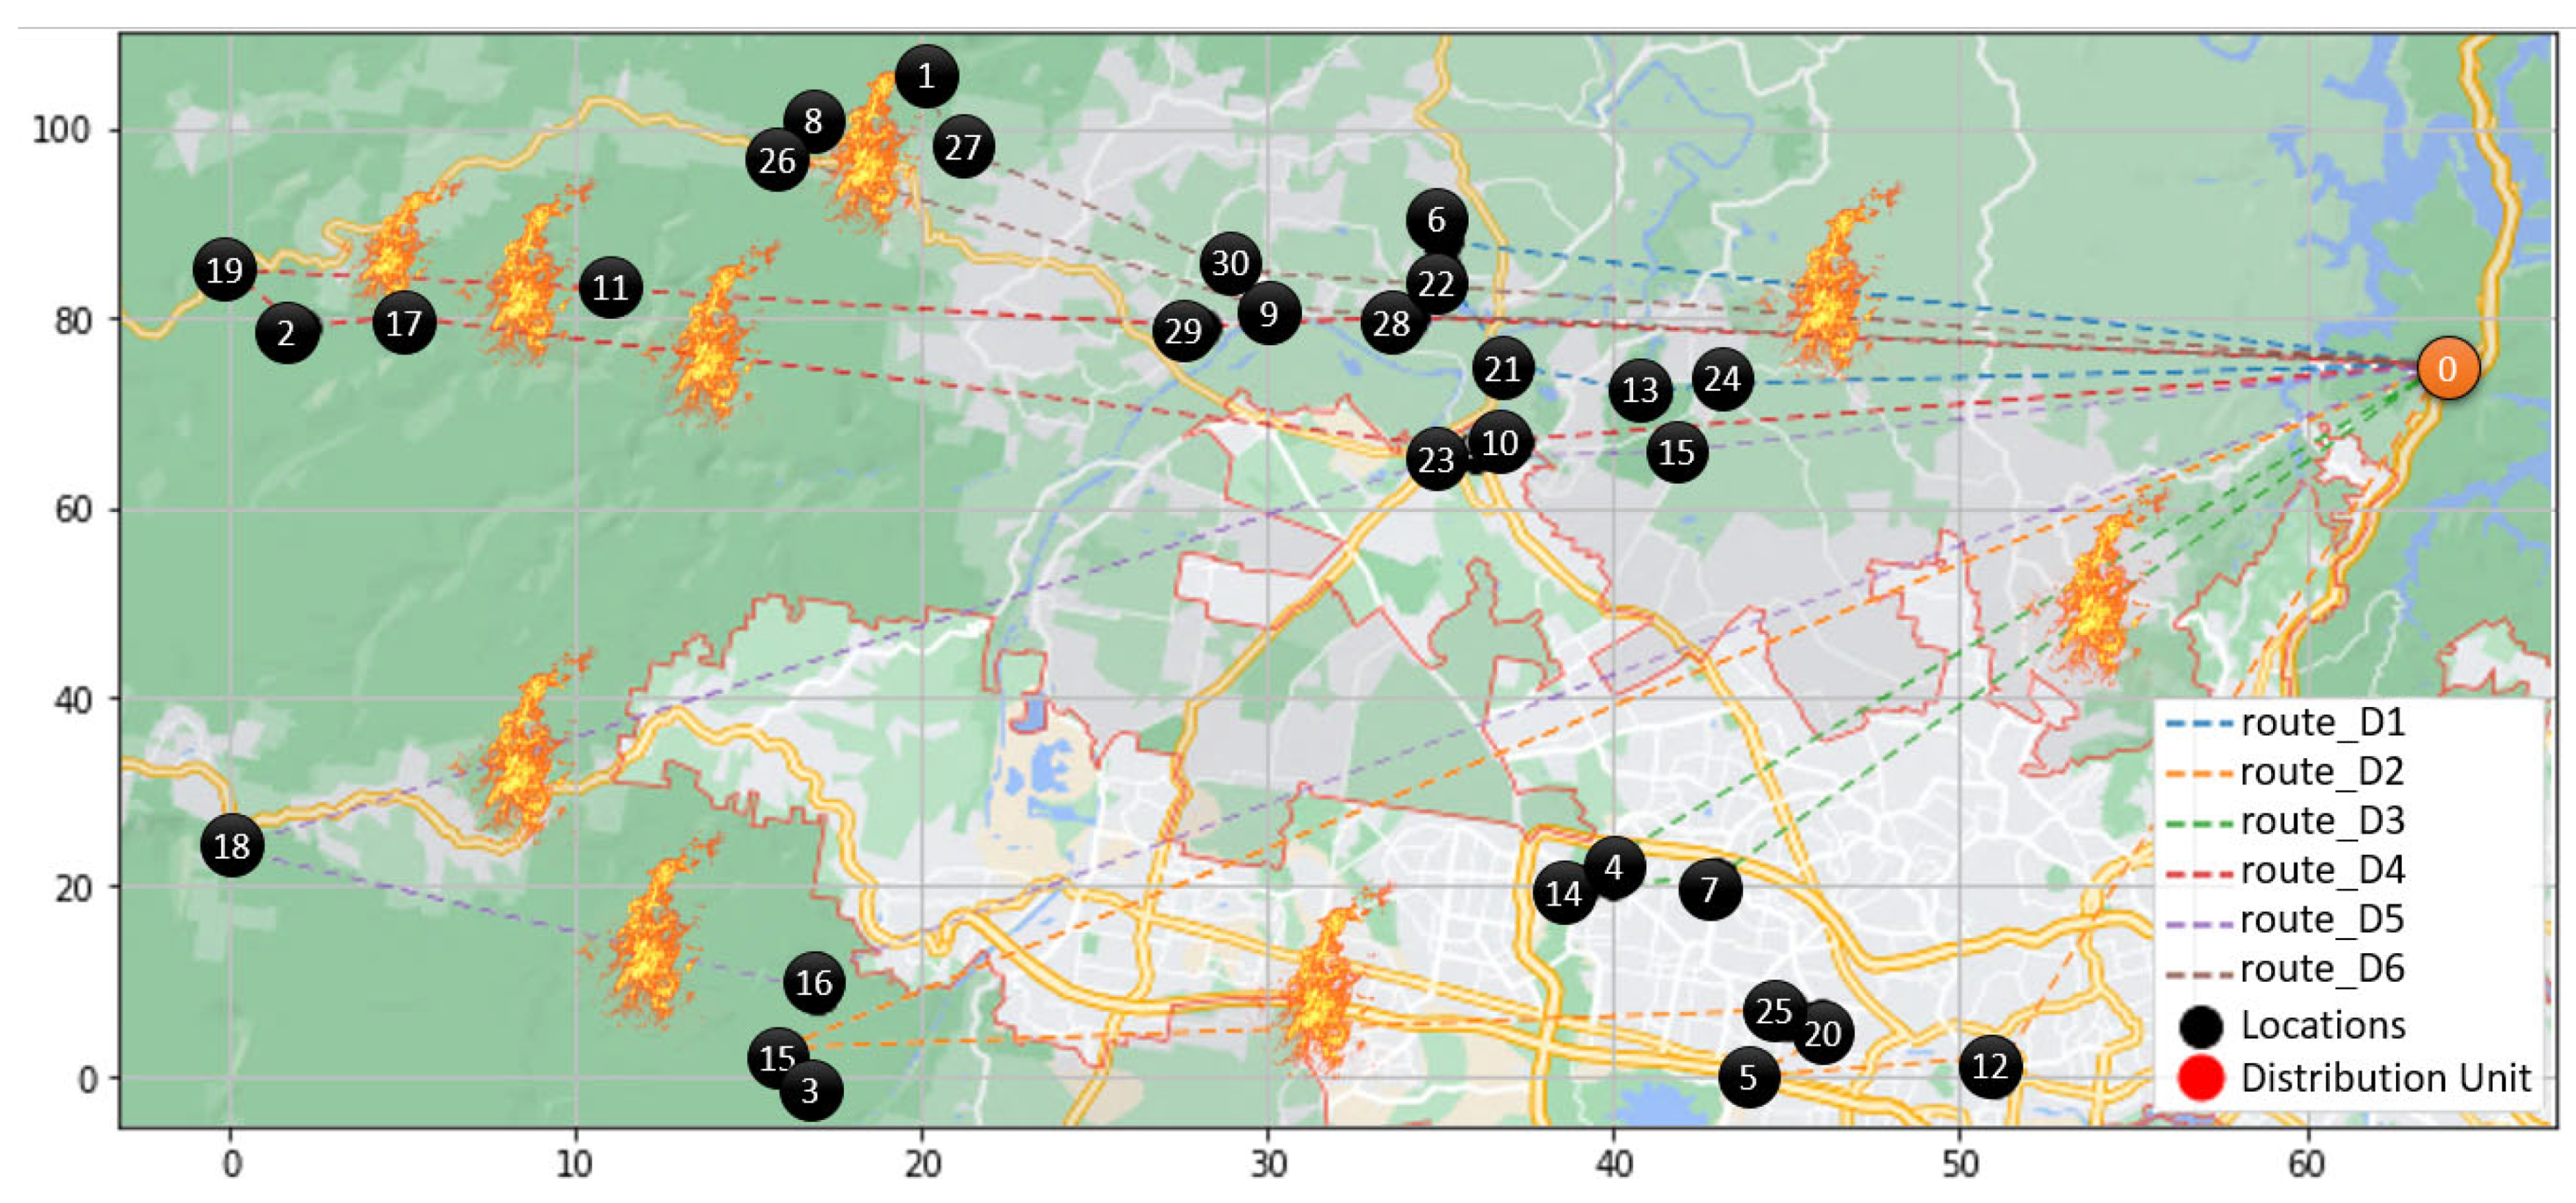
3.3. Drone Coverage
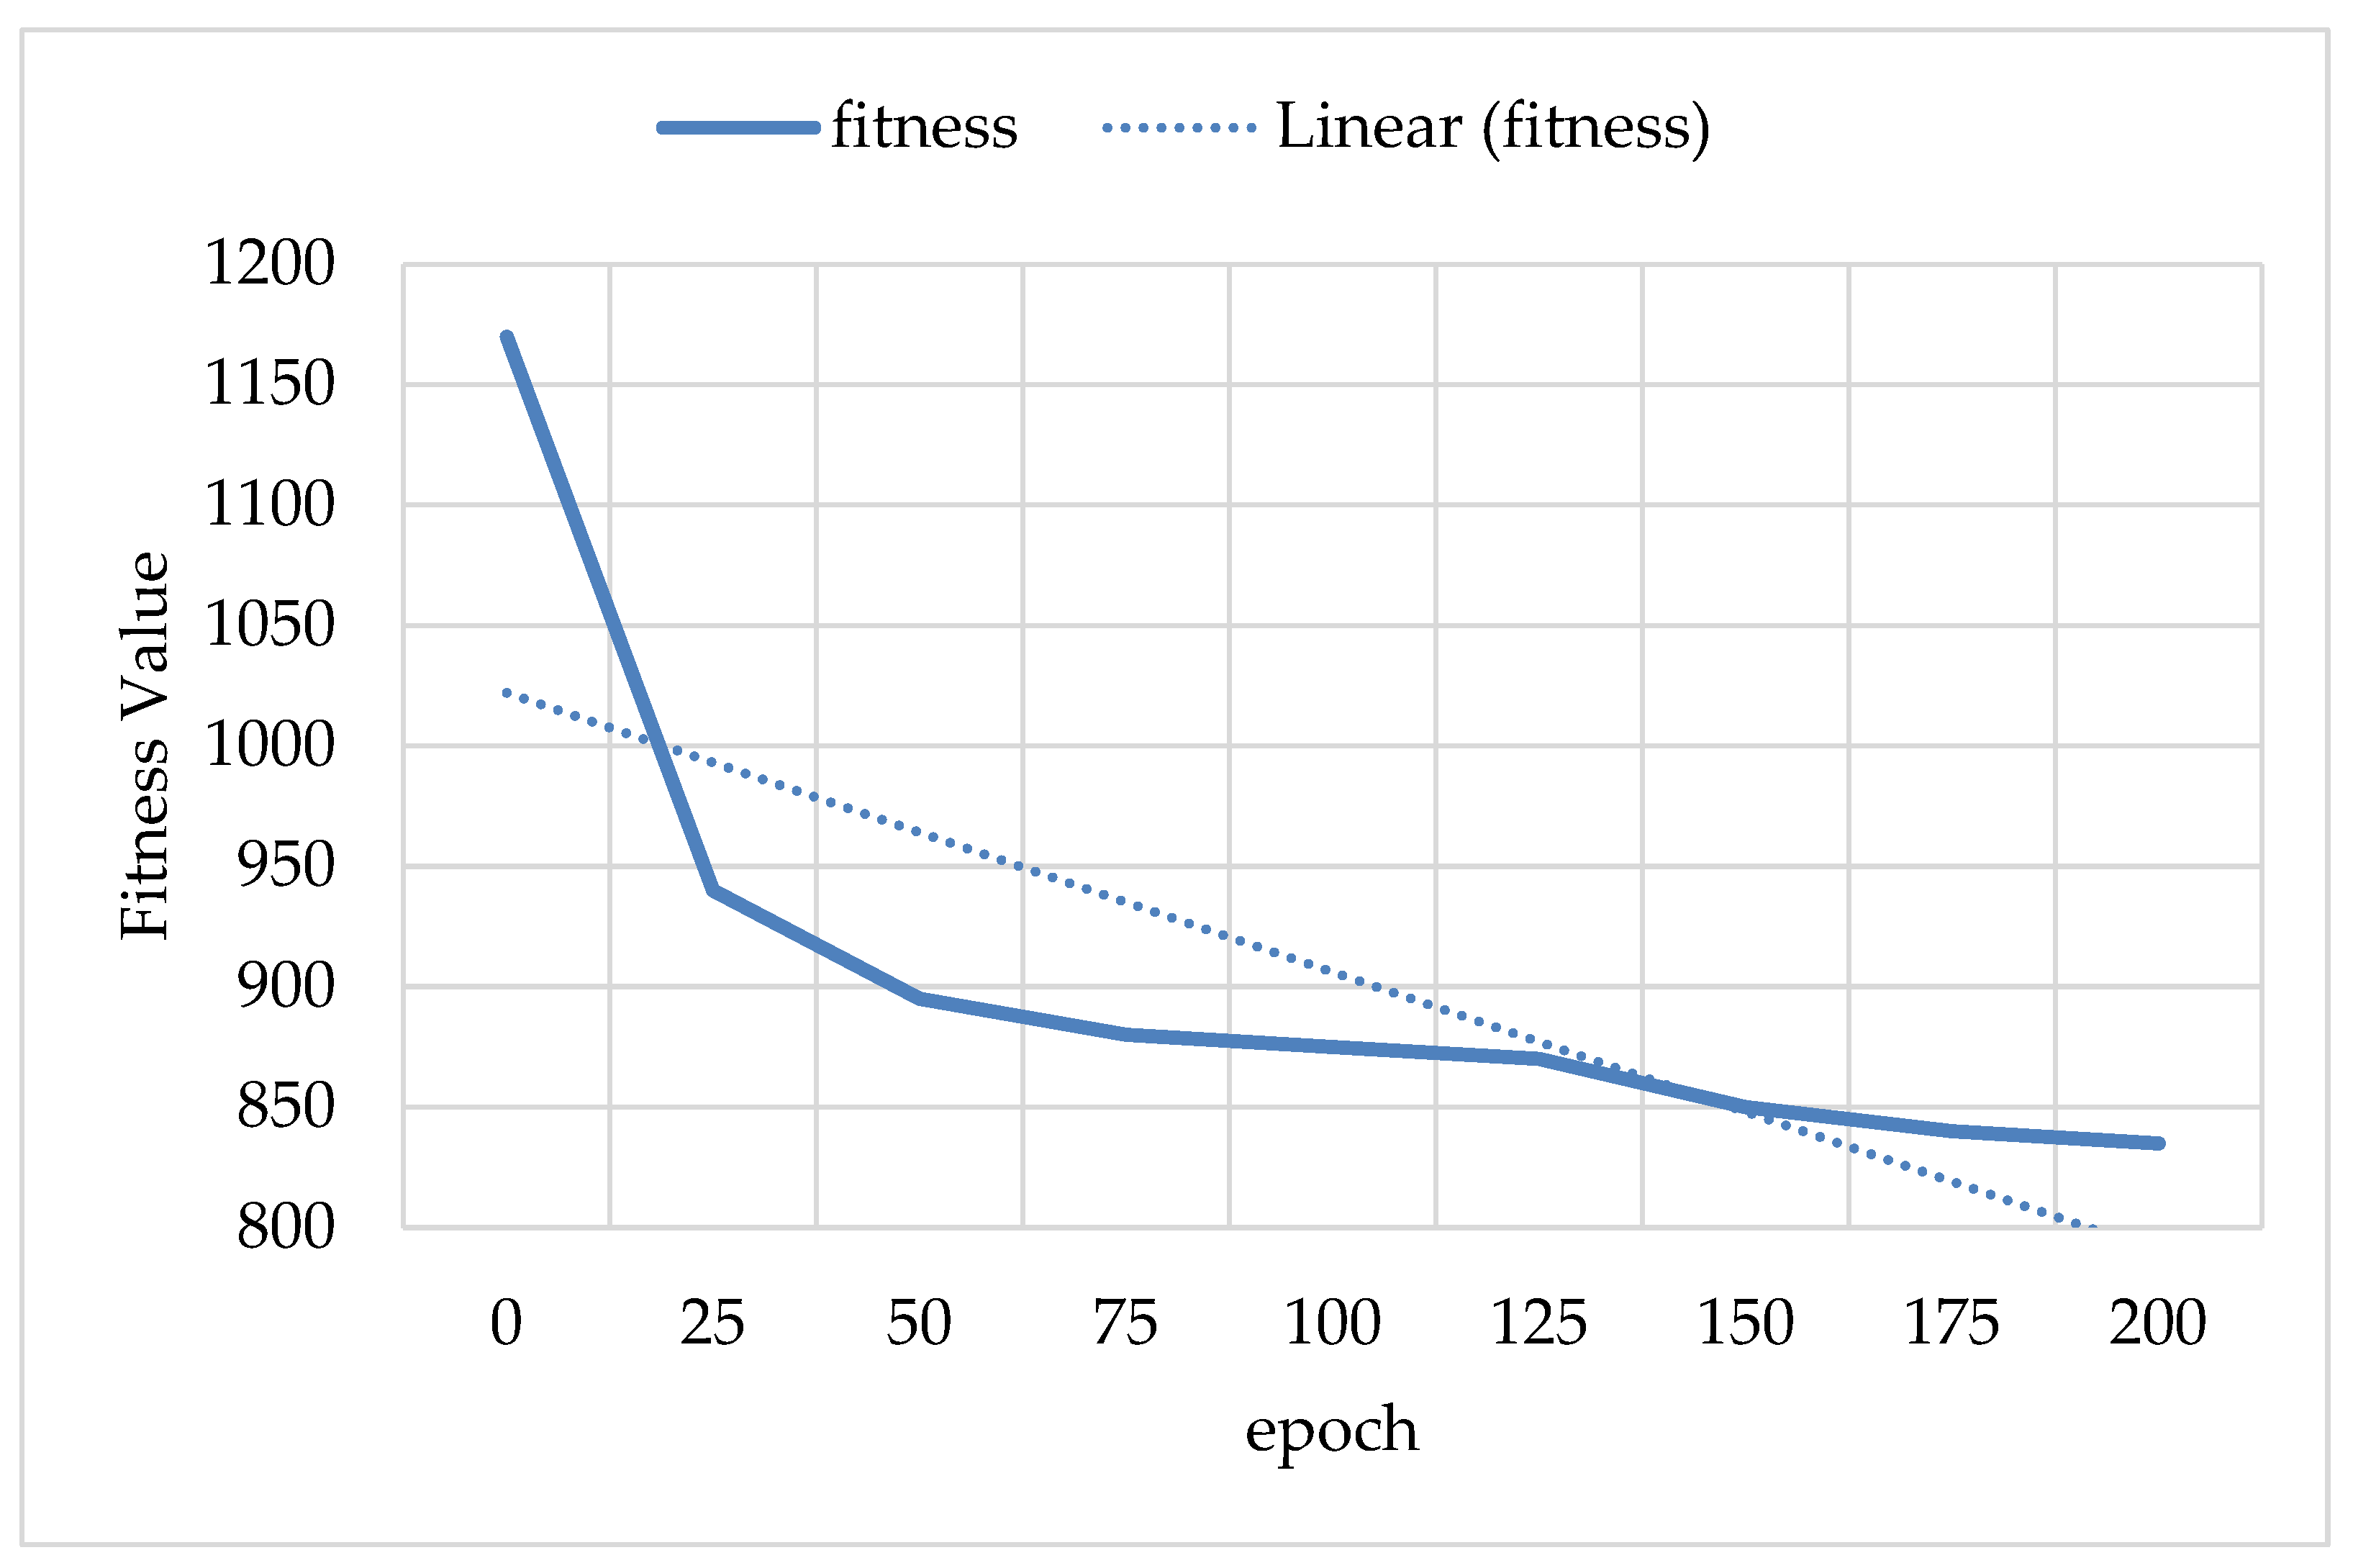
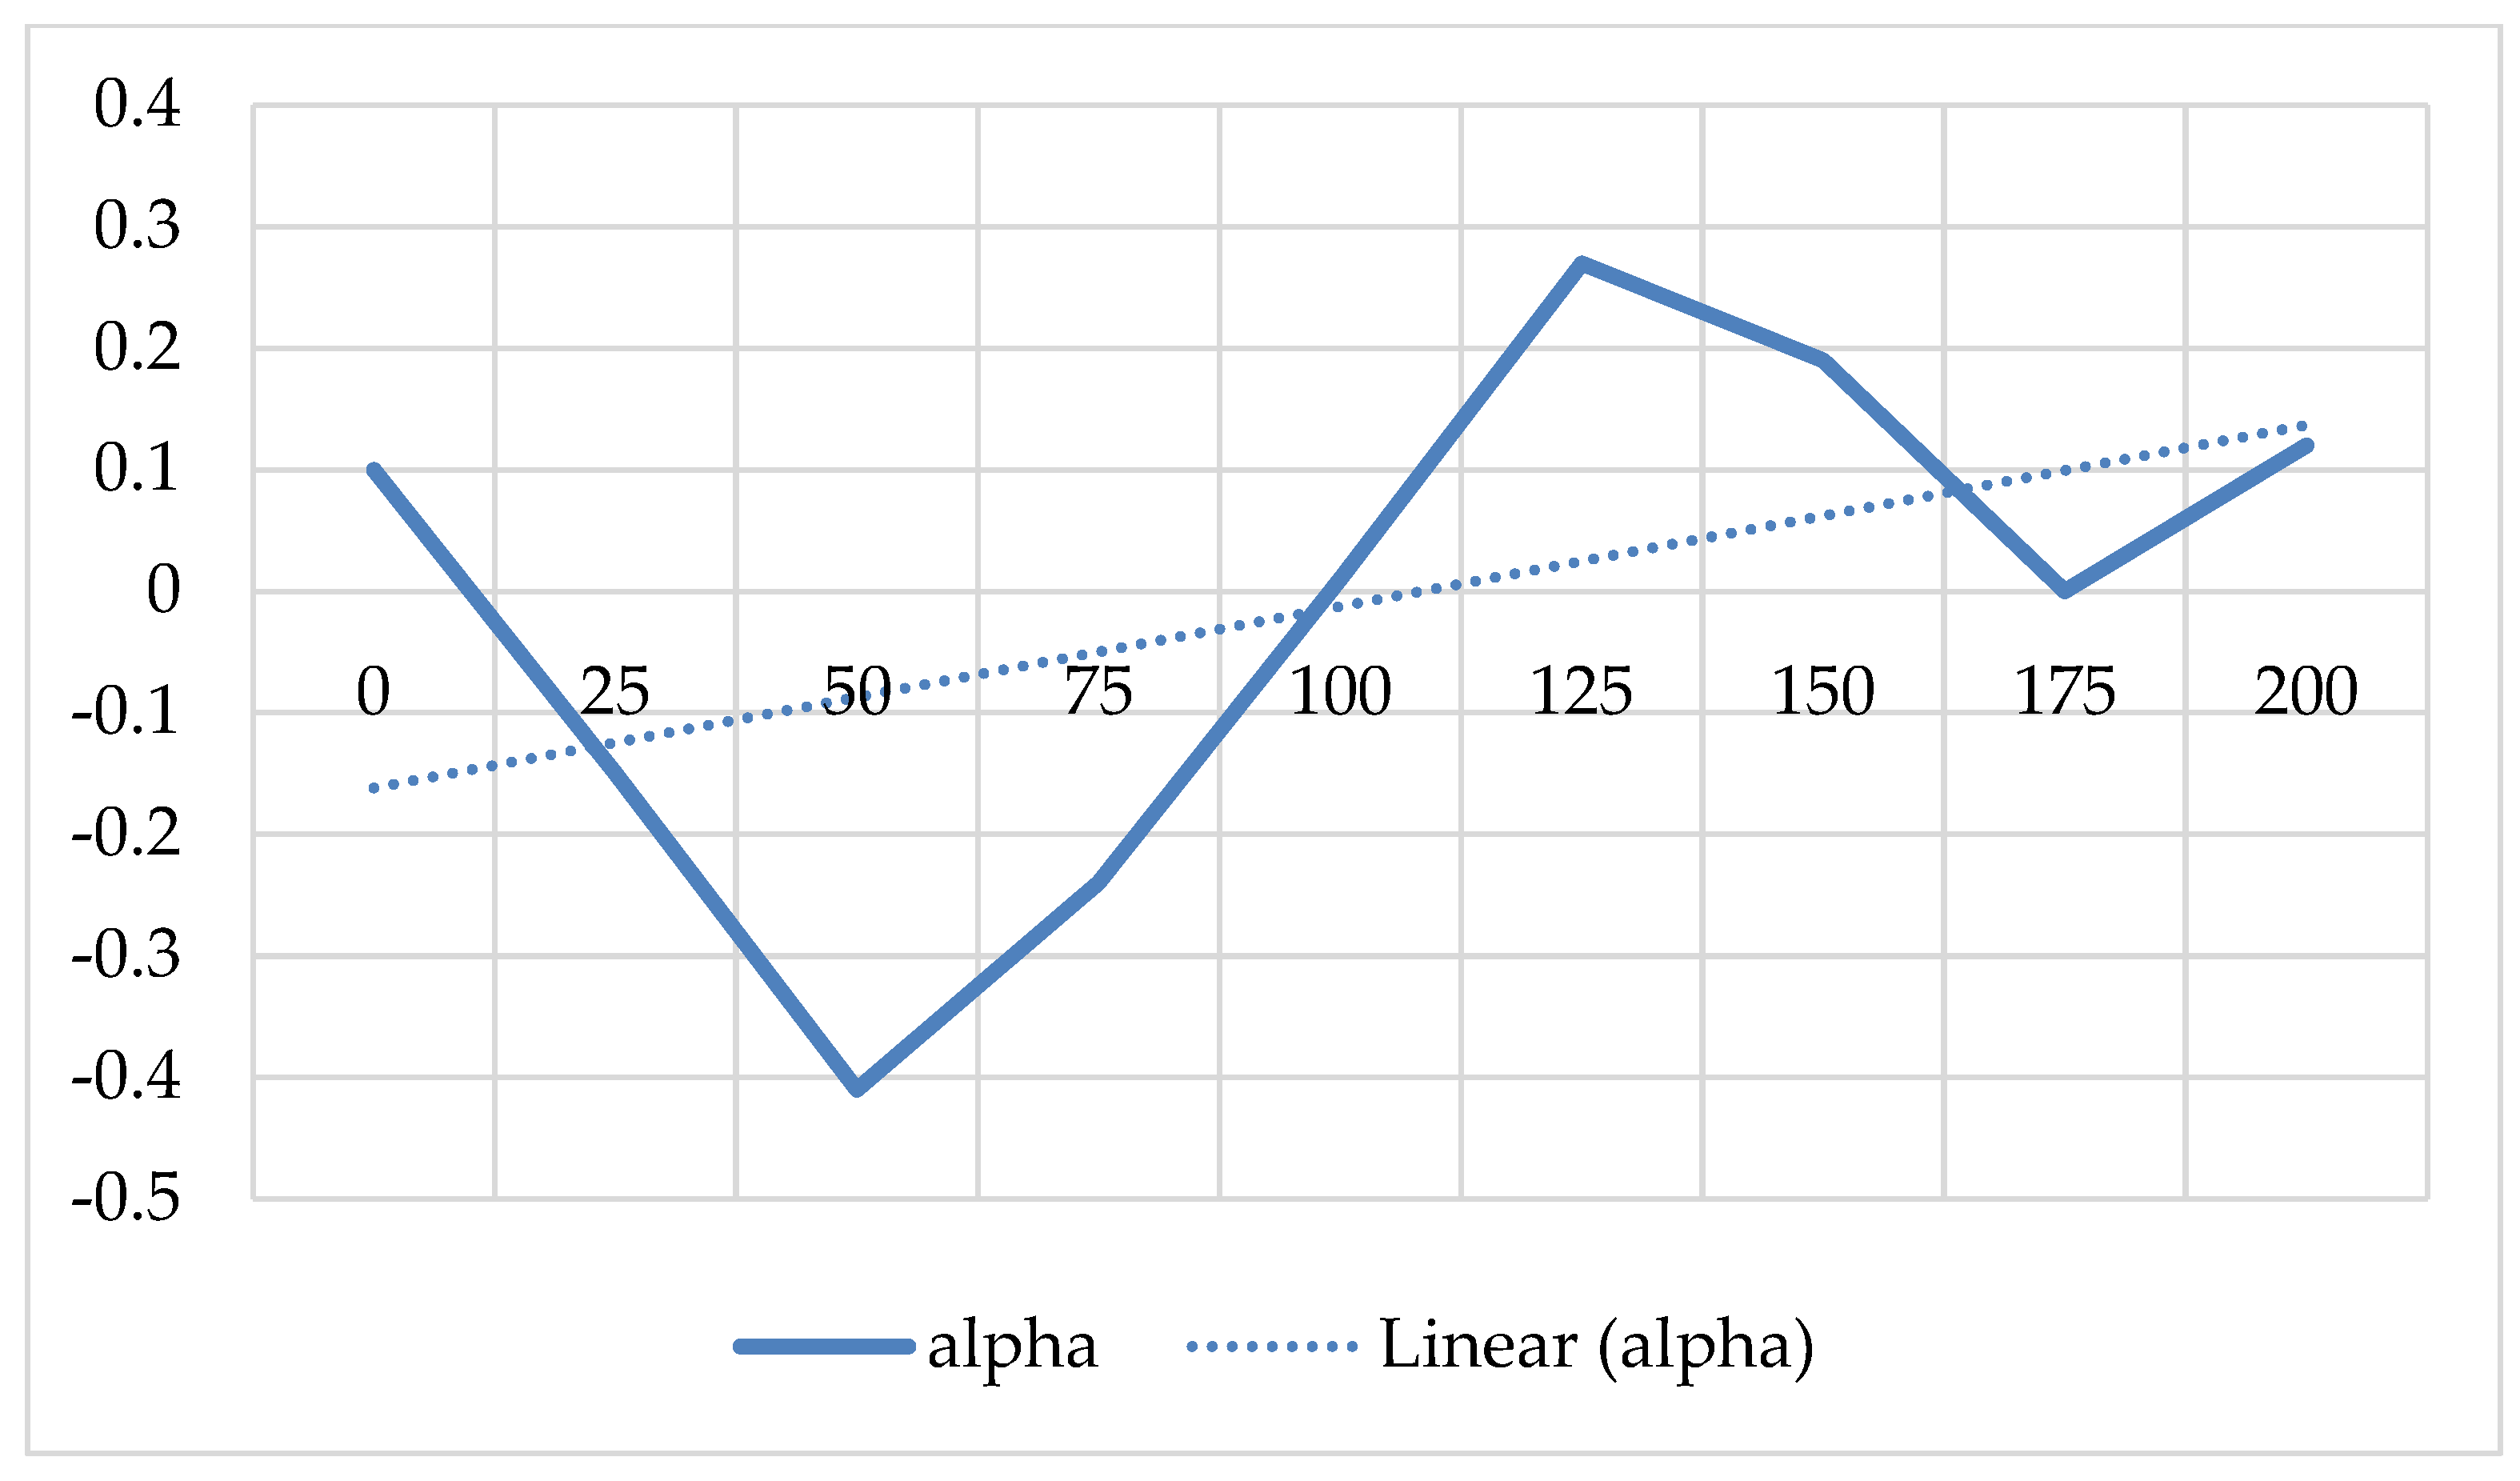
4. Results
Drone Coverage Outcomes
5. Discussion
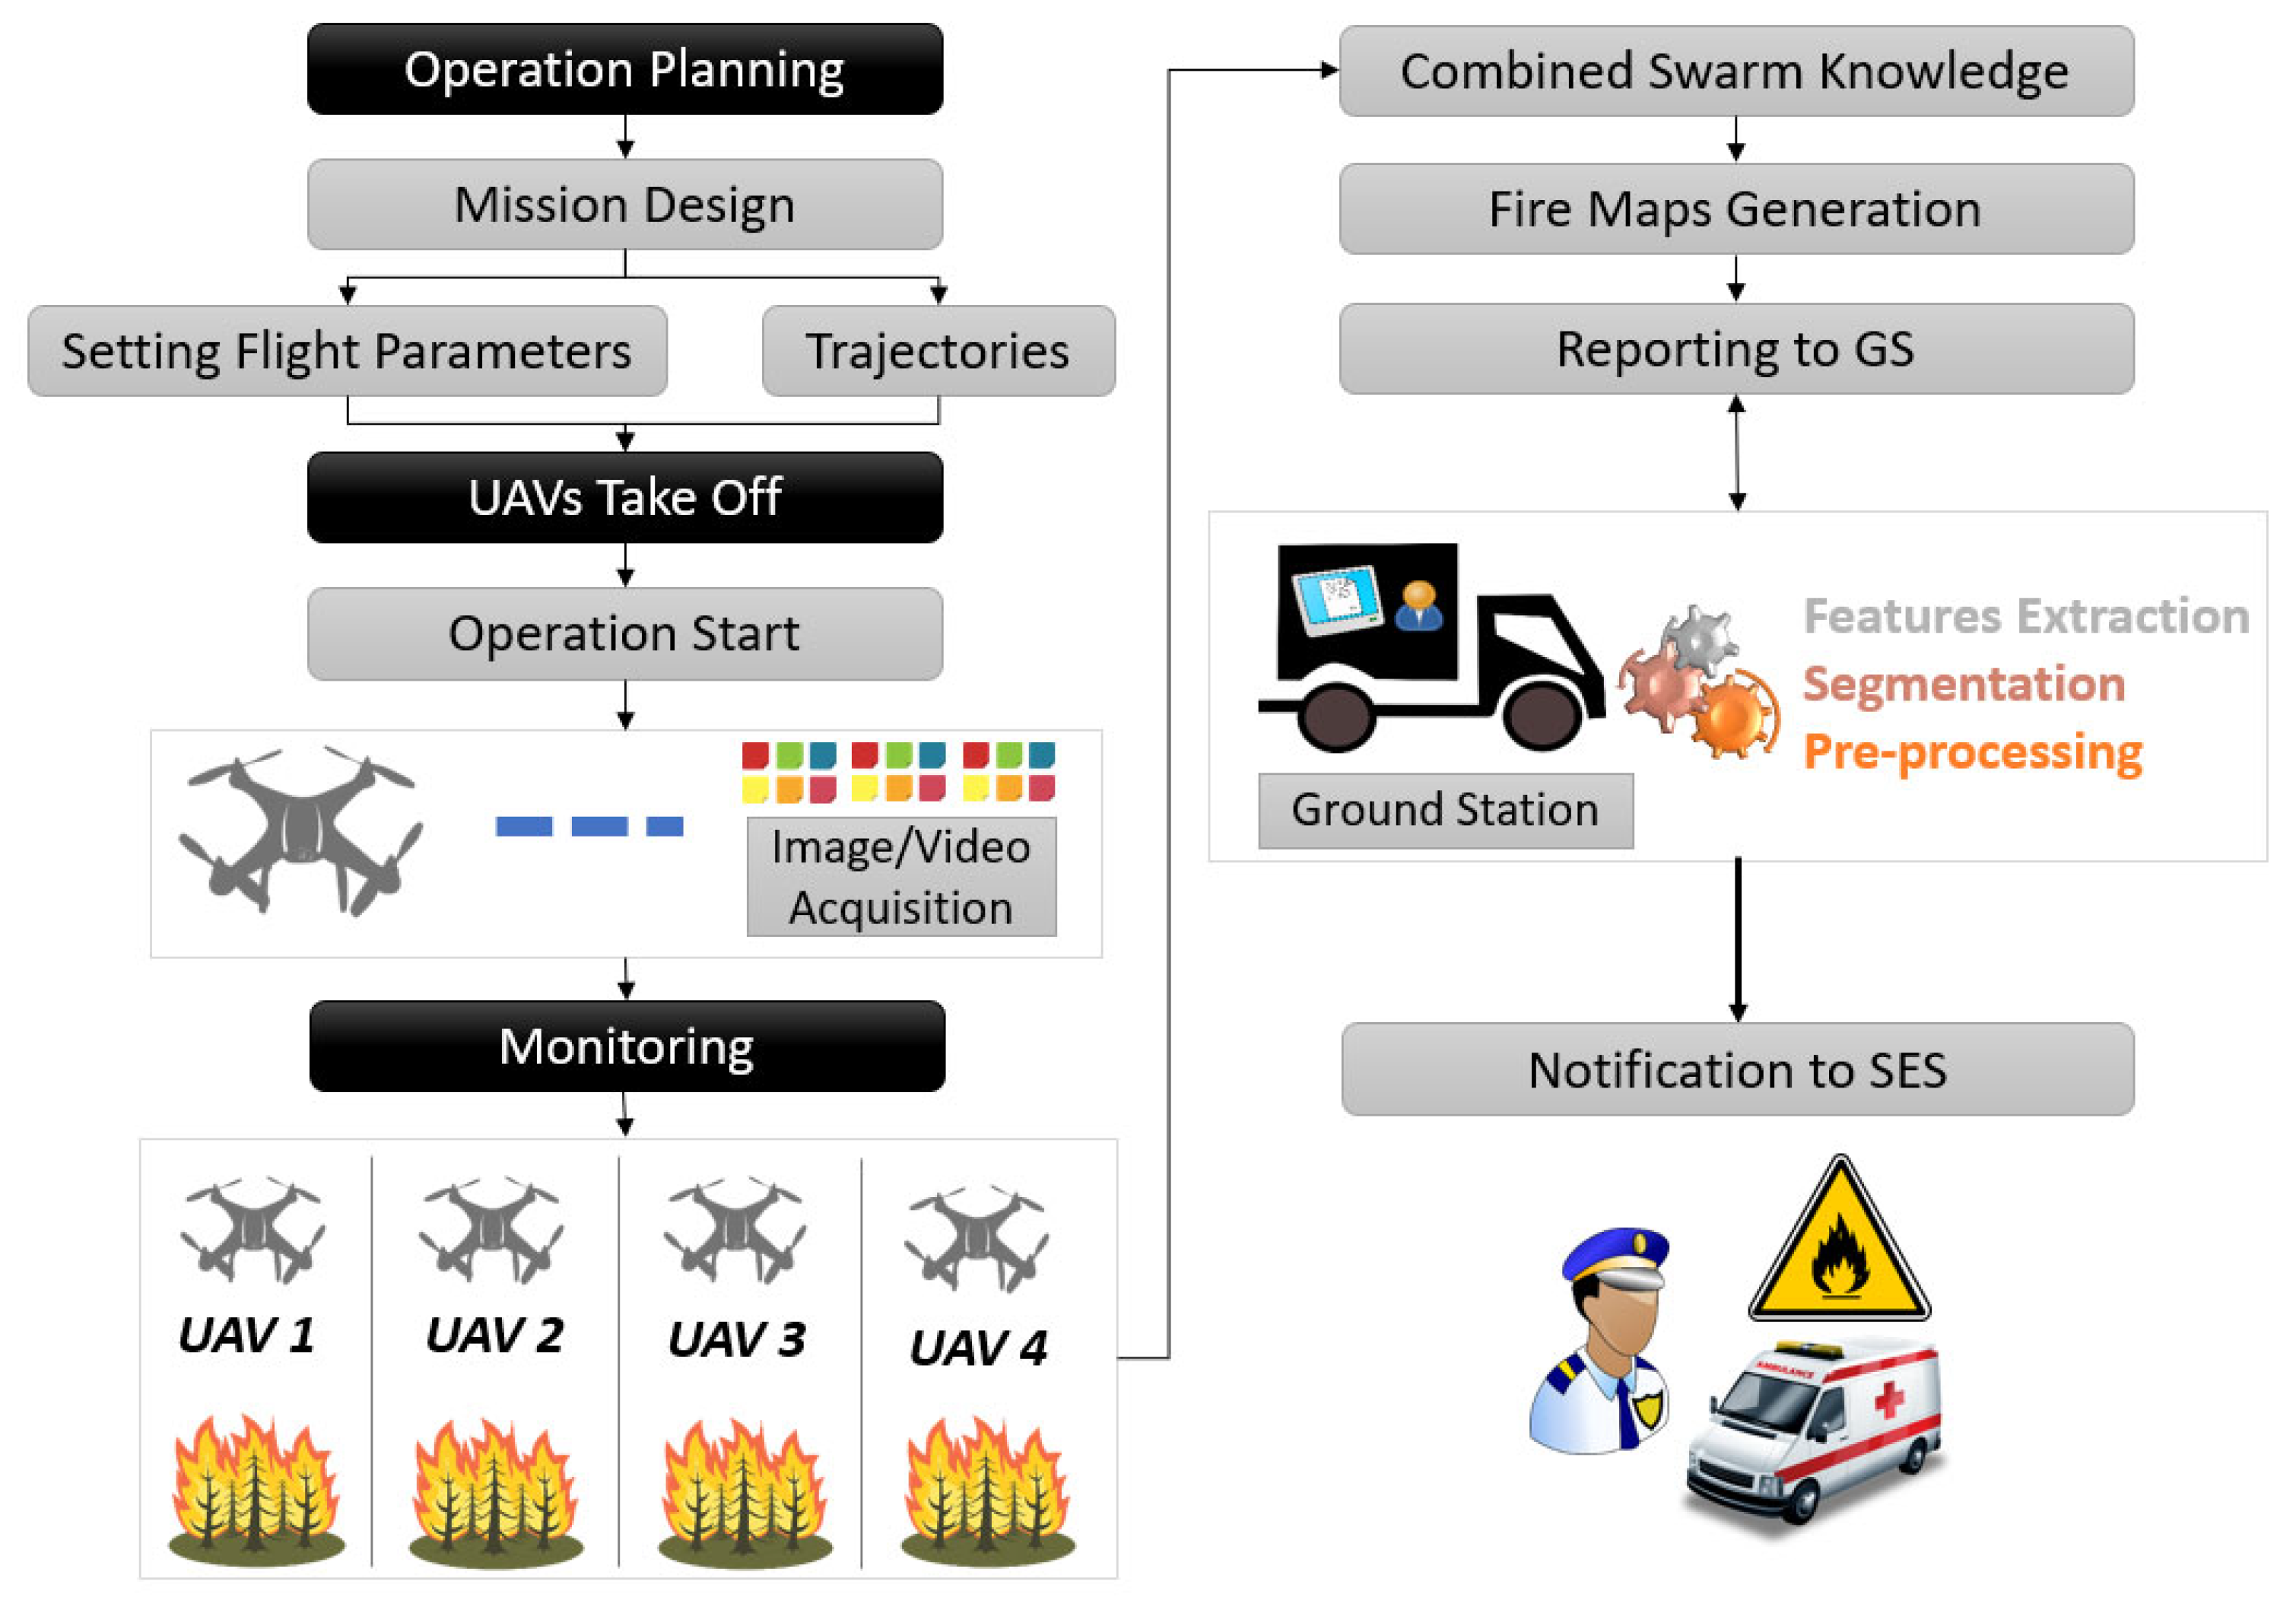
Proposed Framework for Emergency Response
6. Conclusions
Author Contributions
Funding
Institutional Review Board Statement
Informed Consent Statement
Data Availability Statement
Conflicts of Interest
References
- Dwyer, G.; Hardy, C. We have not lived long enough: Sensemaking and learning from bushfire in Australia. Manag. Learn. 2016, 47, 45–64. [Google Scholar] [CrossRef]
- Haque, M.K.; Azad, M.A.K.; Hossain, M.Y.; Ahmed, T.; Uddin, M.; Hossain, M.M. Wildfire in Australia during 2019–2020, Its Impact on Health, Biodiversity and Environment with Some Proposals for Risk Management: A Review. J. Environ. Prot. 2021, 12, 391–414. [Google Scholar] [CrossRef]
- Yu, P.; Xu, R.; Abramson, M.J.; Li, S.; Guo, Y. Bushfires in Australia: A serious health emergency under climate change. Lancet Planet. Health 2020, 4, e7–e8. [Google Scholar] [CrossRef]
- Ruane, S. Using a worldview lens to examine complex policy issues: A historical review of bushfire management in the South West of Australia. Local Environ. 2018, 23, 777–795. [Google Scholar] [CrossRef]
- Munawar, H.S.; Ullah, F.; Khan, S.I.; Qadir, Z.; Qayyum, S. UAV assisted spatiotemporal analysis and management of bushfires: A case study of the 2020 victorian bushfires. Fire 2021, 4, 40. [Google Scholar] [CrossRef]
- Blanchi, R.; Leonard, J.; Haynes, K.; Opie, K.; James, M.; de Oliveira, F.D. Environmental circumstances surrounding bushfire fatalities in Australia 1901–2011. Environ. Sci. Policy 2014, 37, 192–203. [Google Scholar] [CrossRef]
- Athukorala, W.; Martin, W.; Wilson, C.; Rajapaksa, D. Valuing bushfire risk to homeowners: Hedonic property values study in Queensland, Australia. Econ. Anal. Policy 2019, 63, 44–56. [Google Scholar] [CrossRef]
- Browne, E.; Minnery, J. Bushfires and land use planning in peri-urban South East Queensland. Aust. Plan. 2015, 52, 219–228. [Google Scholar] [CrossRef]
- Leonard, J.; Blanchi, R. Queensland Bushfire Risk Planning Project. Stage 1 Rep. Dep. Community Saf.–Strateg. Policy Div. Final Version–Approv. CSIRO 2012. [Google Scholar]
- Jetten, J.; Fielding, K.S.; Crimston, C.R.; Mols, F.; Haslam, S.A. Responding to climate change disaster: The case of the 2019/2020 bushfires in Australia. Eur. Psychol. 2021, 26, 161. [Google Scholar] [CrossRef]
- Forino, G.; von Meding, J.; Brewer, G.J. A conceptual governance framework for climate change adaptation and disaster risk reduction integration. Int. J. Disaster Risk Sci. 2015, 6, 372–384. [Google Scholar] [CrossRef]
- Bendito, A.; Barrios, E. Convergent agency: Encouraging transdisciplinary approaches for effective climate change adaptation and disaster risk reduction. Int. J. Disaster Risk Sci. 2016, 7, 430–435. [Google Scholar] [CrossRef]
- Jopp, R.; DeLacy, T.; Mair, J.; Fluker, M. Using a regional tourism adaptation framework to determine climate change adaptation options for Victoria’s Surf Coast. Asia Pac. J. Tour. Res. 2013, 18, 144–164. [Google Scholar] [CrossRef]
- Kelman, I.; Gaillard, J.-C.; Mercer, J. Climate change’s role in disaster risk reduction’s future: Beyond vulnerability and resilience. Int. J. Disaster Risk Sci. 2015, 6, 21–27. [Google Scholar] [CrossRef]
- Howes, M.; Tangney, P.; Reis, K.; Grant-Smith, D.; Heazle, M.; Bosomworth, K.; Burton, P. Towards networked governance: Improving interagency communication and collaboration for disaster risk management and climate change adaptation in Australia. J. Environ. Plan. Manag. 2015, 58, 757–776. [Google Scholar] [CrossRef]
- Heazle, M.; Tangney, P.; Burton, P.; Howes, M.; Grant-Smith, D.; Reis, K.; Bosomworth, K. Mainstreaming climate change adaptation: An incremental approach to disaster risk management in Australia. Environ. Sci. Policy 2013, 33, 162–170. [Google Scholar] [CrossRef]
- Brady, D.; Webb, N. Communicating bushfire safety in Australia: The challenge for government of increasing community participation. Asia Pac. Media Educ. 2013, 23, 351–365. [Google Scholar] [CrossRef]
- Akama, Y.; Cooper, V.; Mees, B. Beyond transmission: An analysis of communication frameworks in Australian bushfire preparedness. Int. J. Disaster Resil. Built Environ. 2016, 7, 49–62. [Google Scholar] [CrossRef]
- Perera, K.; Tateishi, R.; Akihiko, K.; Herath, S. A Combined Approach of Remote Sensing, GIS, and Social Media to Create and Disseminate Bushfire Warning Contents to Rural Australia. Earth 2021, 2, 715–730. [Google Scholar] [CrossRef]
- Christensen, B. Use of UAV or remotely piloted aircraft and forward-looking infrared in forest, rural and wildland fire management: Evaluation using simple economic analysis. N. Z. J. For. Sci. 2015, 45, 1–9. [Google Scholar] [CrossRef]
- Xiang, A.; Wang, L. Research on Path Planning of UAV Forest Fire Fighting Based on Improved Ant Colony Algorithm. In Proceedings of the 2021 7th International Conference on Computing and Artificial Intelligence, Tianjin, China, 24 September 2021; pp. 289–295. [Google Scholar]
- Peng, Z.; Zhu, G.; Li, M.; Zeng, R.; Cheng, S.; Wang, K. A mathematical model for balancing safety and economy of UAVs in forest firefighting. In Proceedings of the 2nd International Conference on Applied Mathematics, Modelling, and Intelligent Computing (CAMMIC 2022), Kunming, China, 17 May 2022; pp. 804–813. [Google Scholar]
- Stolfi, D.H.; Brust, M.R.; Danoy, G.; Bouvry, P. Competitive evolution of a UAV swarm for improving intruder detection rates. In Proceedings of the 2020 IEEE International Parallel and Distributed Processing Symposium Workshops (IPDPSW), New Orleans, LA, USA, 18–22 May 2020; pp. 528–535. [Google Scholar]
- Augerat, P.; Belenguer, J.M.; Benavent, E.; Corberin, A.; Naddef, D. Separating capacity constraints in the CVRP using tabu search. Eur. J. Oper. Res. 1998, 106, 546–557. [Google Scholar] [CrossRef]
- Karaboga, D.; Basturk, B. On the performance of artificial bee colony (ABC) algorithm. Appl. Soft Comput. 2008, 8, 687–697. [Google Scholar] [CrossRef]


| Sr. No. | Year | Number of Deaths | Region | Area (in Hectares) | Total Loss (in USD) |
|---|---|---|---|---|---|
| 1 | 2019–2020 | 75 | Victoria and NSW | 30 million | 5 billion |
| 2 | 2015–2016 | 9 | Western Australia and NSW | 299,000 | N/A |
| 3 | 2011–2012 | 4 | Southern Australia | 92,000 | N/A |
| 4 | 2008–2009 | 173 | Victoria, South Australia | 4.5 million | 942 million |
| Algorithms | Ant Colony Optimization (ACO) | Genetic Algorithm (GA) | Particle Swarm Optimization (PSO) | Artificial Bee Colony (ABC) |
|---|---|---|---|---|
| Purpose | Finding the shortest path | Locating the best path (or any item) among a selection | Approaching target in the shortest time | Numerical problem optimization. The purpose of the algorithm is to look for the best possible solution to a problem. |
| Advantages | Can work in diverse environment; quick in selecting suitable solutions | Faster than most other exhaustive searches; efficient in solving complex problems | Applicable in a number of engineering research; no overlap or mutation calculation. | Wide problem-solving range, can be applied to combinatorial and complex problems; has high flexibility and fast convergence |
| Disadvantages | Stagnation, low convergence speed, and local optimum | Time consuming and expensive | Low convergence speed and local optimum | Can have premature convergence in secondary search stages |
| Optimization | Metaheuristic Optimization | Discrete Optimization | Stochastic Optimization | Metaheuristic Optimization |
| Parameters | Symbol | Units | Value |
|---|---|---|---|
| Area Coverage | A | km2 | 145.04 |
| Maximum Elevation of drones | hmax | m | 121.97 |
| Elevation of drones in solution | n | m | 120 |
| Drone field of view X | FoVx | degree | 83.97 |
| Drone field of view Y | FoVy | degree | 61.93 |
| Total number of drones | n | - | 12 |
| Iteration | Critical Points | Drones | Storage Capacity (MB) | Optimal Cost (Using [25]) | Cost (Using ABC) | Time (Seconds) | Error |
|---|---|---|---|---|---|---|---|
| 0 | 31 | 5 | 100 | 672 | 706.66 | 21.0367 | 0.051577 |
| 1 | 34 | 5 | 100 | 788 | 809.074 | 23.5703 | 0.026744 |
| 2 | 35 | 5 | 100 | 955 | 996.295 | 24.6331 | 0.043241 |
| 3 | 38 | 6 | 100 | 805 | 820.314 | 28.3691 | 0.019024 |
| 4 | 39 | 5 | 100 | 549 | 567.367 | 26.8919 | 0.033455 |
| 5 | 41 | 6 | 100 | 829 | 947.106 | 30.5565 | 0.142468 |
| 6 | 43 | 6 | 100 | 742 | 777.851 | 33.6116 | 0.048317 |
| 7 | 44 | 7 | 100 | 909 | 986.059 | 36.7406 | 0.084773 |
| 8 | 45 | 5 | 100 | 751 | 796.908 | 32.6524 | 0.061129 |
| 9 | 45 | 6 | 100 | 678 | 768.924 | 37.4266 | 0.134106 |
| 10 | 50 | 7 | 100 | 741 | 763.955 | 41.7246 | 0.030978 |
| 11 | 50 | 8 | 100 | 1312 | 1354.94 | 44.8531 | 0.032729 |
| 12 | 51 | 7 | 100 | 1032 | 1124.71 | 43.0054 | 0.089835 |
| 13 | 52 | 7 | 100 | 747 | 818.93 | 43.3379 | 0.096292 |
| 14 | 56 | 7 | 100 | 707 | 792.406 | 47.5649 | 0.120801 |
| 15 | 57 | 7 | 100 | 1153 | 1555.3 | 66.1008 | 0.348916 |
| 16 | 57 | 9 | 100 | 1598 | 1740.75 | 57.7029 | 0.08933 |
| 17 | 63 | 10 | 100 | 1496 | 1776.06 | 75.7468 | 0.187206 |
| 18 | 64 | 9 | 100 | 861 | 1083.07 | 75.1847 | 0.257921 |
| 19 | 66 | 9 | 100 | 1316 | 1611.29 | 82.6786 | 0.224384 |
| 20 | 67 | 10 | 100 | 1032 | 1206.91 | 86.5646 | 0.169486 |
| Number of Drones | Area Coverage (km2) |
|---|---|
| 4 | 57.52 |
| 6 | 69.63 |
| 8 | 59.00 |
| 10 | 112.79 |
| 12 | 146.06 |
| Height (m) | Area Coverage (km2) |
|---|---|
| 5 | 0.38 |
| 20 | 6.10 |
| 40 | 20.43 |
| 60 | 38.22 |
| 80 | 78.38 |
| 100 | 119.64 |
| 121 | 182.62 |
Publisher’s Note: MDPI stays neutral with regard to jurisdictional claims in published maps and institutional affiliations. |
© 2022 by the authors. Licensee MDPI, Basel, Switzerland. This article is an open access article distributed under the terms and conditions of the Creative Commons Attribution (CC BY) license (https://creativecommons.org/licenses/by/4.0/).
Share and Cite
Munawar, H.S.; Gharineiat, Z.; Akram, J.; Imran Khan, S. A Framework for Burnt Area Mapping and Evacuation Problem Using Aerial Imagery Analysis. Fire 2022, 5, 122. https://doi.org/10.3390/fire5040122
Munawar HS, Gharineiat Z, Akram J, Imran Khan S. A Framework for Burnt Area Mapping and Evacuation Problem Using Aerial Imagery Analysis. Fire. 2022; 5(4):122. https://doi.org/10.3390/fire5040122
Chicago/Turabian StyleMunawar, Hafiz Suliman, Zahra Gharineiat, Junaid Akram, and Sara Imran Khan. 2022. "A Framework for Burnt Area Mapping and Evacuation Problem Using Aerial Imagery Analysis" Fire 5, no. 4: 122. https://doi.org/10.3390/fire5040122
APA StyleMunawar, H. S., Gharineiat, Z., Akram, J., & Imran Khan, S. (2022). A Framework for Burnt Area Mapping and Evacuation Problem Using Aerial Imagery Analysis. Fire, 5(4), 122. https://doi.org/10.3390/fire5040122