Article

Wildfires in the Siberian Arctic

by
Viacheslav I. Kharuk
1,2,*,
Maria L. Dvinskaya
2,
Sergei T. Im
1,2,3,
Alexei S. Golyukov
1,2 and
Kevin T. Smith
4
1
Institute of Space and Information Technologies, Institute of Ecology and Geography, Siberian Federal University, 79 Svobodny pr., 660041 Krasnoyarsk, Russia
2
Sukachev Institute of Forest, Krasnoyarsk Science Center of the SB RAS, Academgorodok St. 50/28, 660036 Krasnoyarsk, Russia
3
Institute of Space Research and High Technologies, Reshetnev Siberian State University of Science and Technology, Krasnoyarsky Rabochy Av. 31, 660037 Krasnoyarsk, Russia
4
USDA Forest Service, 271 Mast Road, Durham, NH 03824, USA
*
Author to whom correspondence should be addressed.
Fire 2022, 5(4), 106; https://doi.org/10.3390/fire5040106
Submission received: 25 June 2022 / Revised: 18 July 2022 / Accepted: 20 July 2022 / Published: 21 July 2022

Abstract

:
Wildfires are increasingly understood as an ecological driver within the entire Arctic biome. Arctic soils naturally store large quantities of C, as peat has formed throughout the Holocene. For the Siberian Arctic, we used observations from the MODIS remote sensing instrument to document changes in frequency, geographic extent, and seasonal timing of wildfires as well as vegetation productivity (GPP, NPP, EVI). We also used correlation and regression analysis to identify environmental factors of temperature, precipitation, and lightning occurrence associated with these changes. For the Siberian Arctic as a whole, we found that the decadal frequency of wildfire tripled from the 2001–2010 to the 2011–2020 periods. Increased decadal frequency was accompanied by the increased extent of the burnt area by a factor of 2.6. This increase in fire frequency and extent was not uniform, with the greatest increase in western Siberia with no marked increase for the Siberian Far East. These changes were accompanied by the northward migration of the northern limit of wildfire occurrence and an increase in duration of the wildfire season. We found that annual fire frequency and the extent of burnt areas were related to various combinations of seasonal air temperature, precipitation, ground moisture, and lightning frequency. After fires, vegetation productivity rapidly recovered to pre-fire levels. The northward spread of wildfire into the tundra will release carbon long-stored as peat. The enhanced vegetation productivity, rapid recovery of carbon fixation for burnt areas and the northward migration of boreal forest tree species may offset that release and maintain the current status of the Siberian Arctic as a C sink. Increased wildfire and loss of permafrost may threaten ongoing settlement and industrialization, particularly for western Siberia.

1. Introduction

Wildfire is an intrinsic component of the boreal biome that shapes tree evolution, forest community structure, and biogeochemistry (e.g., [1,2]). The fire regime is determined by the ‘triad’ of: (i) fuel availability, (ii) the readiness of the fuel to burn (i.e., fuel moisture), and (iii) a source of fire ignition. Fuel is readily available within the arctic forest-tundra as scattered standing and fallen trees, woody shrubs, herbaceous plants, and substantial deposits of peat. Fuel readiness depends on the thermal and moisture regimes within the territory. The dominant source of ignition at high latitudes are lightning strikes [3]. Since the onset of the current warming period, fire frequency and the extent of burnt areas continue to increase throughout the boreal biome and even into Greenland tundra [4]. Wildfire threatens to shift the status of the northern boreal forest from being a sink to a source of atmospheric carbon (C) (e.g., [5,6]).
In Siberia, fire has long been the primary source of disturbance in vast taiga landscapes. However, wildfire is a recent driver for tundra ecosystem dynamics. During the 21st century, wildfire frequency and the total area burnt have increased for northern forests and Arctic tundra. The fire return interval appears to have shortened from that reported earlier for northern areas (e.g., [7,8]). Arctic fires coupled with atmospheric warming tend to transform tundra to shrublands [9] and have a potential to accelerate the northward expansion of forest cover [10,11,12]. Increased fire frequency may also be supported by increased frequency of lightning strikes due to atmospheric warming [13,14,15]. At northern latitudes, lightning strikes cause about 90% of fire ignitions [3]. Increased frequency of lightning within the boreal zone has the potential to further increase fire frequency throughout the Siberian Arctic [13,14,15].
The Siberian Arctic, especially the West Siberian forest-tundra and tundra ecoregions, largely consists of lowland taiga forests and wetlands that have accumulated C throughout the Holocene. The increased frequency of fires causes more damage and releases long-stored carbon into the atmosphere, thereby threatening to transform the high latitude territory from a C sink to a net source of atmospheric C. Increased atmospheric C has the potential to fuel a positive feedback loop resulting in increased fire frequency and warming (e.g., [16]). Alternatively, increased atmospheric CO2 may provide a fertilization effect, increasing C fixation, and biomass production at high latitudes (e.g., [17,18,19,20,21]). Alongside that, warming promoted increased C fixation. Thus, tree ring analysis associated an increase in radial growth index for northern forests in Canada and Siberia attributed to atmospheric warming [22,23,24]. Potentially these effects, i.e., CO2 fertilization and warming, may offset C loss from increased wildfire.
Due to the remoteness and geographic scale of the Siberian boreal and arctic regions, wildfire analysis is based primarily on remote sensing data with a resolution of 250–1000 m as provided by MODIS (the Moderate Resolution Imaging Spectroradiometer) on the Terra and Aqua platforms. MODIS also provides near real-time data on the areas burnt and location of fire ignitions including localized thermal points (“hotspots”) [25]. Similar data is provided by the vegetation sensor on the PROBA-V platform [26] and the VIIRS instrument on the Suomi NPP satellite [27,28]. More detailed fire impact and post-fire vegetation succession analysis is based on medium (10–30 m) and high (1–2 m) resolution instruments such as Landsat (e.g., [29,30]), Sentinel (e.g., [31]), or Quickbird [32].
Here we report on wildfire dynamics within the Siberian Arctic in the 21st century. We propose to test the hypotheses that climate change in the Arctic has caused wildfire to increase in frequency and extent and that the northern limit of fire occurrence has migrated northward to the Arctic Ocean. We seek to answer the following questions for the Siberian Arctic:
(i)
What are the dynamics of wildfire parameters such as fire frequency, burned area extent, fire season duration, and the position of the northern boundary of fire occurrence?
(ii)
How are wildfire parameters related to air temperature, precipitation, ground cover moisture, and occurrence of lightning strikes?
(iii)
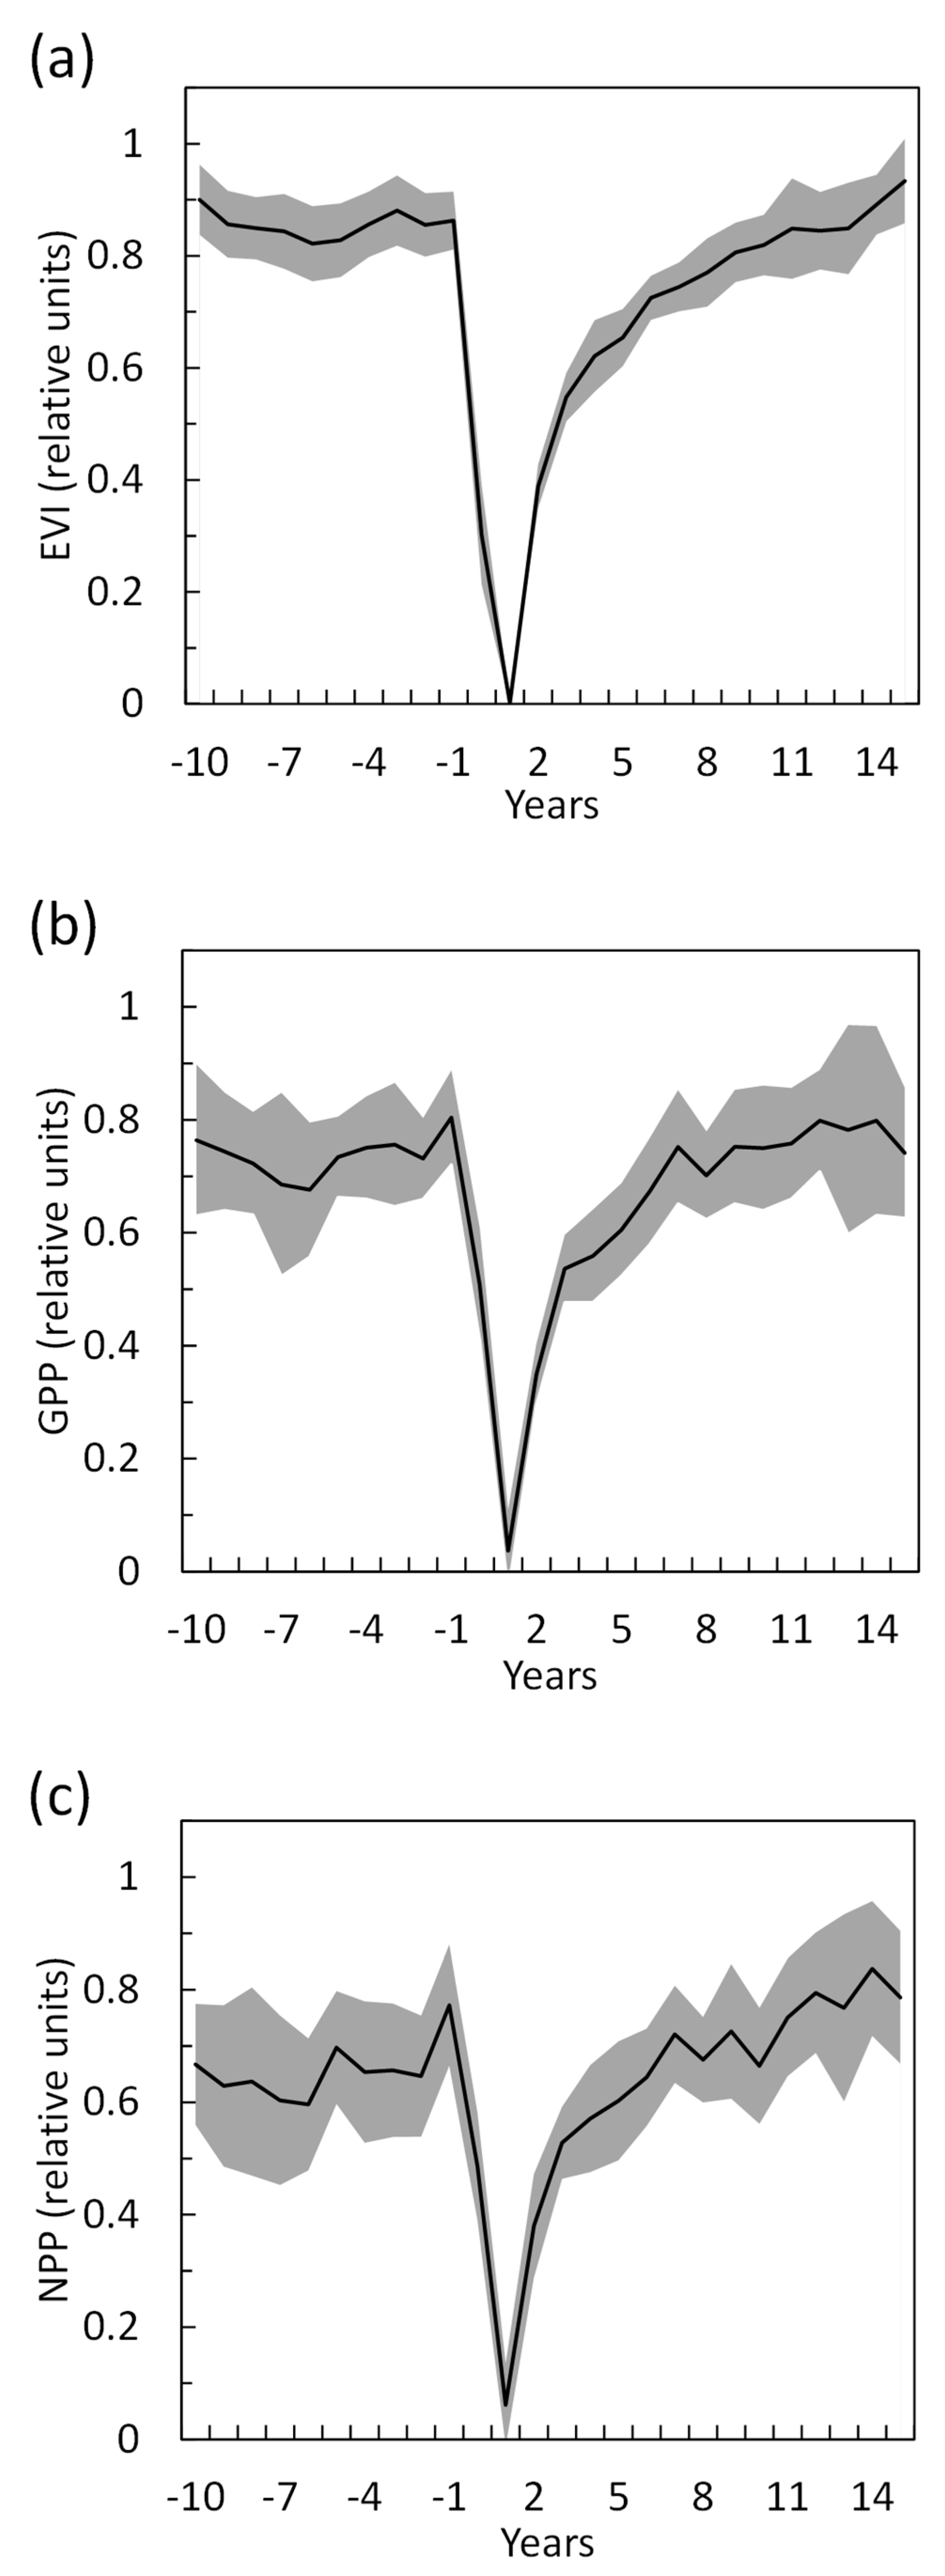
What the temporal patterns of post-fire recovery are of gross (GPP) and net (NPP) primary productivity?

2. Materials and Methods

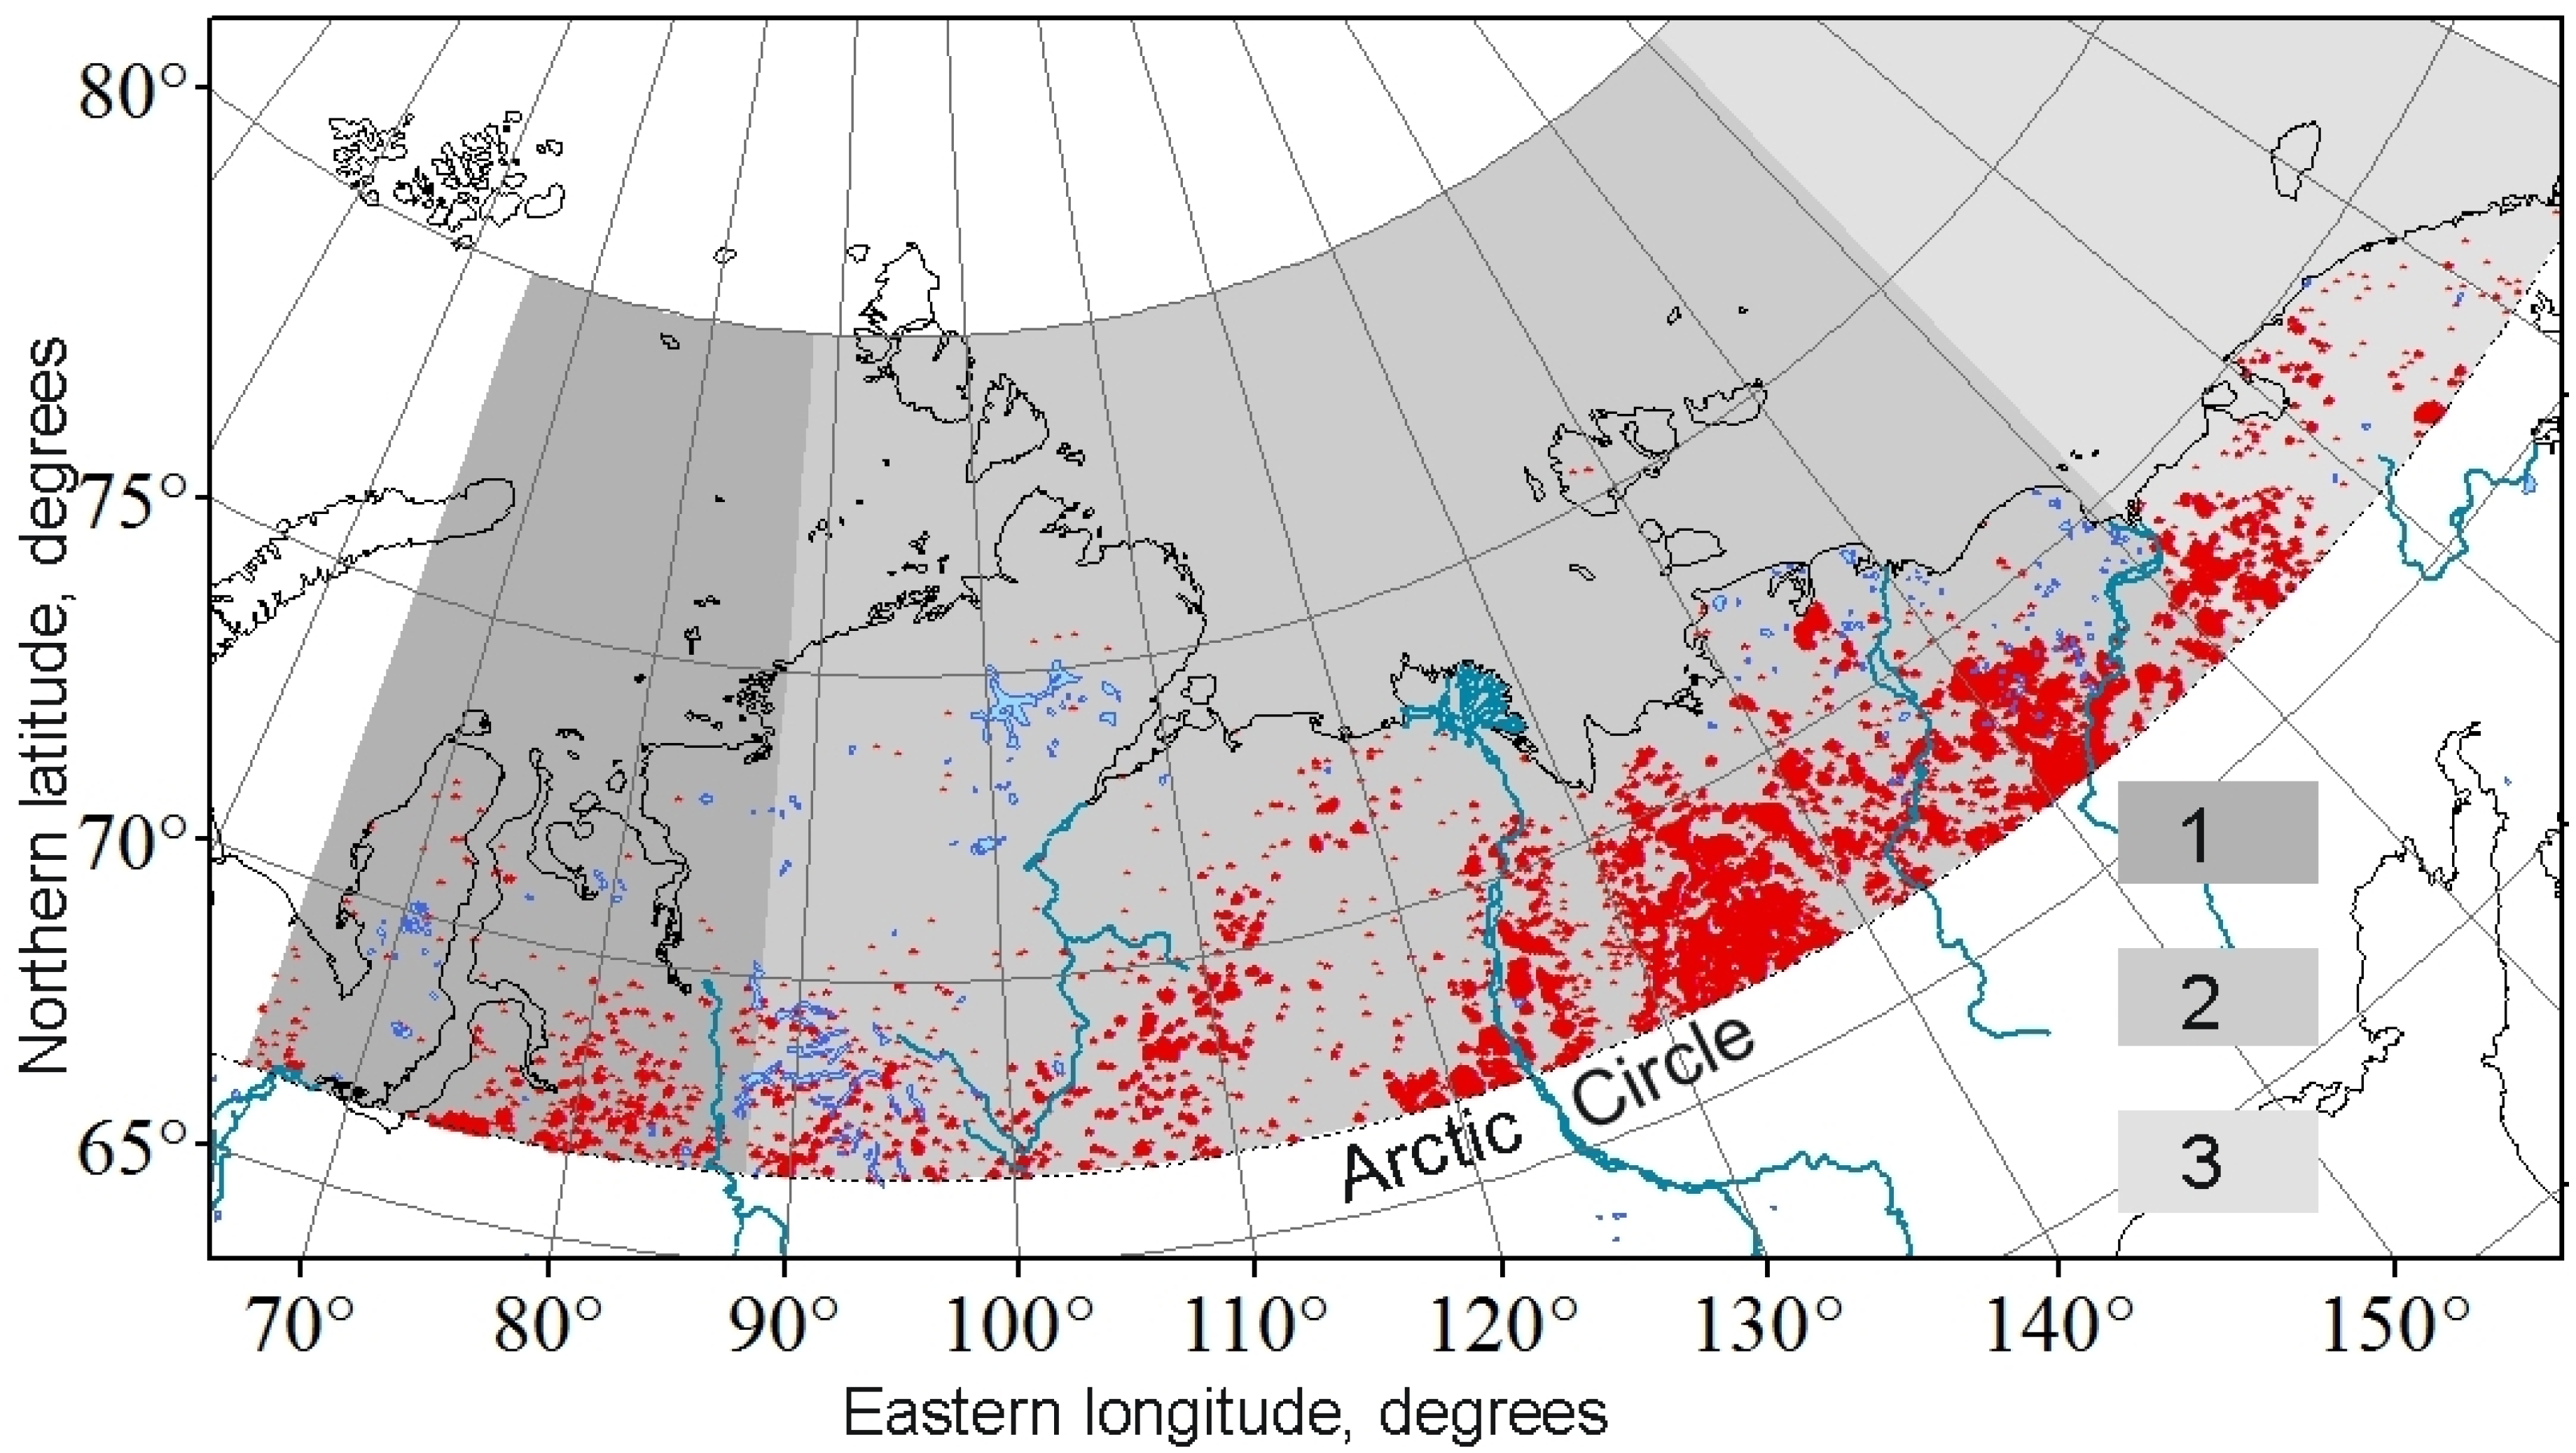
2.1. Geography and Floristics of the Study Area

The study area includes Siberian territory north of 65° N latitude, a commonly used proxy for the Arctic Circle (66°32′ N). The territory was divided into three sectors: Western Siberia (WS, from the Ural Mountains eastward to the Yenisei River), Eastern Siberia (ES, from the Yenisei River eastward to the Kolyma River), and Far East (FE, from the Kolyma River through to easternmost Siberia) (Figure 1). The WS sector is part of the Western Siberian Plain and is influenced by both Arctic and Atlantic Oceans. Trees are sparse in occurrence and include larch (Larix sibirica Ledeb.), Scot pine (Pinus sylvestris L.), Siberian pine (Pinus sibirica Du Tour), spruce (Picea obovata Ledeb.), and birch (Betula spp.). The shrubs and grasses are primarily Salix spp., Betula spp., Ledum palustre L., Vaccinium sp., Carex arctisibirica (Jurtzev) Czerep., Cassiope tetragona (L.) D. Don, Eriophorum vaginatum L., Equisetum arvense L., and some other species. Moss and lichen cover are primarily Dicranum acutifolium (Lindb. & Arnell) C.E.O.Jensen, Aulacomnium turgidum (Wahlenb.) Schwägr., Ptilidium ciliare (L.) Hampe, Hylocomium splendens (Hedw.) Schimp., Tomentypnum nitens (Hedw.) Loeske, and Cladonia spp.
Within the Siberian Arctic, we determined vegetation cover types based on the map from the VEGA-PRO information service (http://pro-vega.ru/maps (accessed on 5 May 2021); [33]). We excluded forested area (i.e., forest stands with trees crown closure > 20%) from the analysis. Thus, the study area included the following vegetation classes: tundra, shrub-tundra, and sparse tree stands (crown closure ≤ 20%).

2.2. Determination of Fire Frequency and Extent

We analyzed the temporal dynamics of wildfire parameters in the Siberian Arctic including fire frequency, the extent of burnt area, fire season onset, and duration, and the position of the northern boundary or limit of wildfire occurrence. Fire season onset and duration and limit of wildfire occurrence were calculated based on the annual mean of three observed maximum values for each variable. We correlated wildfire parameters to June-August and May-September mean air temperature (Tjja and Tmjjas), precipitation (Pjja and Pmjjas), drought index (SPEIjja and SPEImjjas), ground cover moisture content (Wjja, Wmjjas), and lightning strike index (LSI).
The annual fire frequency was calculated from analysis of thermal points (“hotspots”) with a spatial resolution of 1 × 1 km obtained from the MODIS Collection 6 database package MCD14DL of the Fire Information for Resource Management System (FIRMS). The area investigated included the latitudinal range of 65–80° N for the years 2001–2021, which included about 165,300 hotspots. We excluded false (non-fire) thermal points from the initial dataset (ca. 240,000) by the following procedures. (1) In light of the topographic maps, hotspots from settlements or industrial infrastructures (in the Western Siberia mostly) were excluded. (2) In addition, we used expert comparison with high-resolution satellite scenes from Google Earth (https://earth.google.com/web (accessed on 5 May 2022)), Bing Maps (https://www.bing.com/maps (accessed on 5 May 2022)), and Yandex Maps (https://yandex.ru/maps (accessed on 5 May 2022)). On-ground resolution of these satellite scenes enabled identification of hotspots from industrial infrastructure or settlements. (3) Then, we excluded mineralized stony surfaces that potentially could be the source of the false signals through comparison with Pro-Vega land cover maps (http://pro-vega.ru/maps (accessed on 5 May 2021); [33]).
The annual burnt area extent was calculated from the FIRMS dataset MCD64A1 (DOI: 10.5067/MODIS/MCD64A1.006; [25]). Available data covered the 65–70° N latitudes for the 2001–2021 period with spatial resolution of 0.5 × 0.5 km2. Decadal ratios of fire frequency and burned area extent for the first two decades of the 21st century were calculated as the quotient of cumulative annual values for the 2011–2021 period divided by the cumulative annual values for the 2001–2010 period.

2.3. Sources of Environmental Data

Air temperature, precipitation, and ground cover moisture content (0–7 cm depth) were obtained at a spatial resolution of 0.1° × 0.1° from the ERA5-Land dataset [34]. The standardized precipitation evapotranspiration index (SPEI) values were obtained from the Global Drought Monitor (https://spei.csic.es/map/maps.html (accessed on 21 February 2022)). SPEI is a measure of the air moisture content and is an estimation of drought intensity and is defined as the difference between total precipitation and potential evapotranspiration for the that month or year [35]. We calculated the lightning strike index (LSI) for the Siberian Arctic from the annual lightning frequency for the entire Arctic, provided by the World Wide Lightning Location Network for 2010–2020 [36]. Lightning frequency was not available for earlier periods. We assume that the frequency of lightning strikes was uniform throughout the Arctic. The LSI is a normalized unitless metric which varies between 0.0 (no lightning) and 1.0 (maximal number of strikes for the entire period. To estimate vegetation recovery after fire, we analyzed the temporal dynamics of the gross (GPP) and net (NPP) primary productivity and the enhanced vegetation index (EVI) for 13,940 distinct burnt areas within Siberian Arctic. We calculated GPP, NPP, and EVI temporal trends within each hotspot. The trend was determined as the tangent of the angle between the abscissa (i.e., time interval) and the regression line of the mean annual GPP or NPP values. We used a conservative approach and considered that vegetation recovery begins after the second year following the fire event. Thus, post-fire trends were calculated from the second year after the fire. In addition, we calculated GPP, NPP, and EVI temporal trends for the whole Siberian Arctic. GPP and NPP values were obtained from the Terra/MODIS product MOD17A2H at temporal and spatial resolutions of 8-days and 500 m2, respectively (https://search.earthdata.nasa.gov (accessed on 5 May 2022); [37]). EVI values were obtained as MODIS/Terra product MOD13Q1 at temporal and spatial resolutions of 16-days and 250 m2, respectively (https://search.earthdata.nasa.gov (accessed on 5 May 2022); [38]).

2.4. Statistical Analysis and Regression Modelling of Wildfire Parameters

Significant differences among sectors within the Siberian Arctic for decadal fire frequency and the extent of burnt areas, fire season duration, and the timing of the onset and conclusion of the fire season were identified using the Kruskal-Wallis ranked Analysis of Variance test (KW-ANOVA, p < 0.10 and 0.05). Differences in the underlying distribution for the wildfire parameters by sector were detected using the Mann-Whitney U test (p < 0.10 and 0.05). These tests were made with Statsoft Statistica (https://www.moonsoft.net/products/000649.aspx (accessed on 5 May 2022)).
The correlations of annual fire frequency, burnt area extent, fire season duration, and the position of the northern boundary of wildfire occurrence to the climate variables to the climate variables (Tjja, Tmjjas, Pjja, Pmjjas, SPEIjja, SPEImjjas, Wjja, Wmjjas), were tested using the Pearson correlation test for variables with a Gaussian distribution and the Spearman correlation tests for variables with a non-Gaussian distribution.
We used a multiple linear and hierarchical regression analysis realized in the R-project for statistical computing (R version 4.1.3, name “One Push-Up”; https://www.r-project.org/ (accessed on 5 May 2022)) and RStudio (version 2022.02.3+492, name “Prairie Trillium” https://www.rstudio.com (accessed on 5 May 2022)). R libraries gvlma v.1.0.0.3, AICcmodavg v.2.3-1, trafo v.1.0.1, readxl v1.4.0, writexl v.1.4.0 were used. A multiple model was used to estimate the dependence of hotspots and burned area on the climate variables. We used hierarchical linear regression to test the improvement of model relationships between wildfire parameters and individually added environmental variables for the 2001–2021 years [39]. Candidate selection was based on correlation analysis (Pearson r and non-parametric Spearman rho), guided by the corrected Akaike information coefficient (AICc) [40]. That analysis allowed us to determine dispersions intercepted by each independent variable.

3. Results

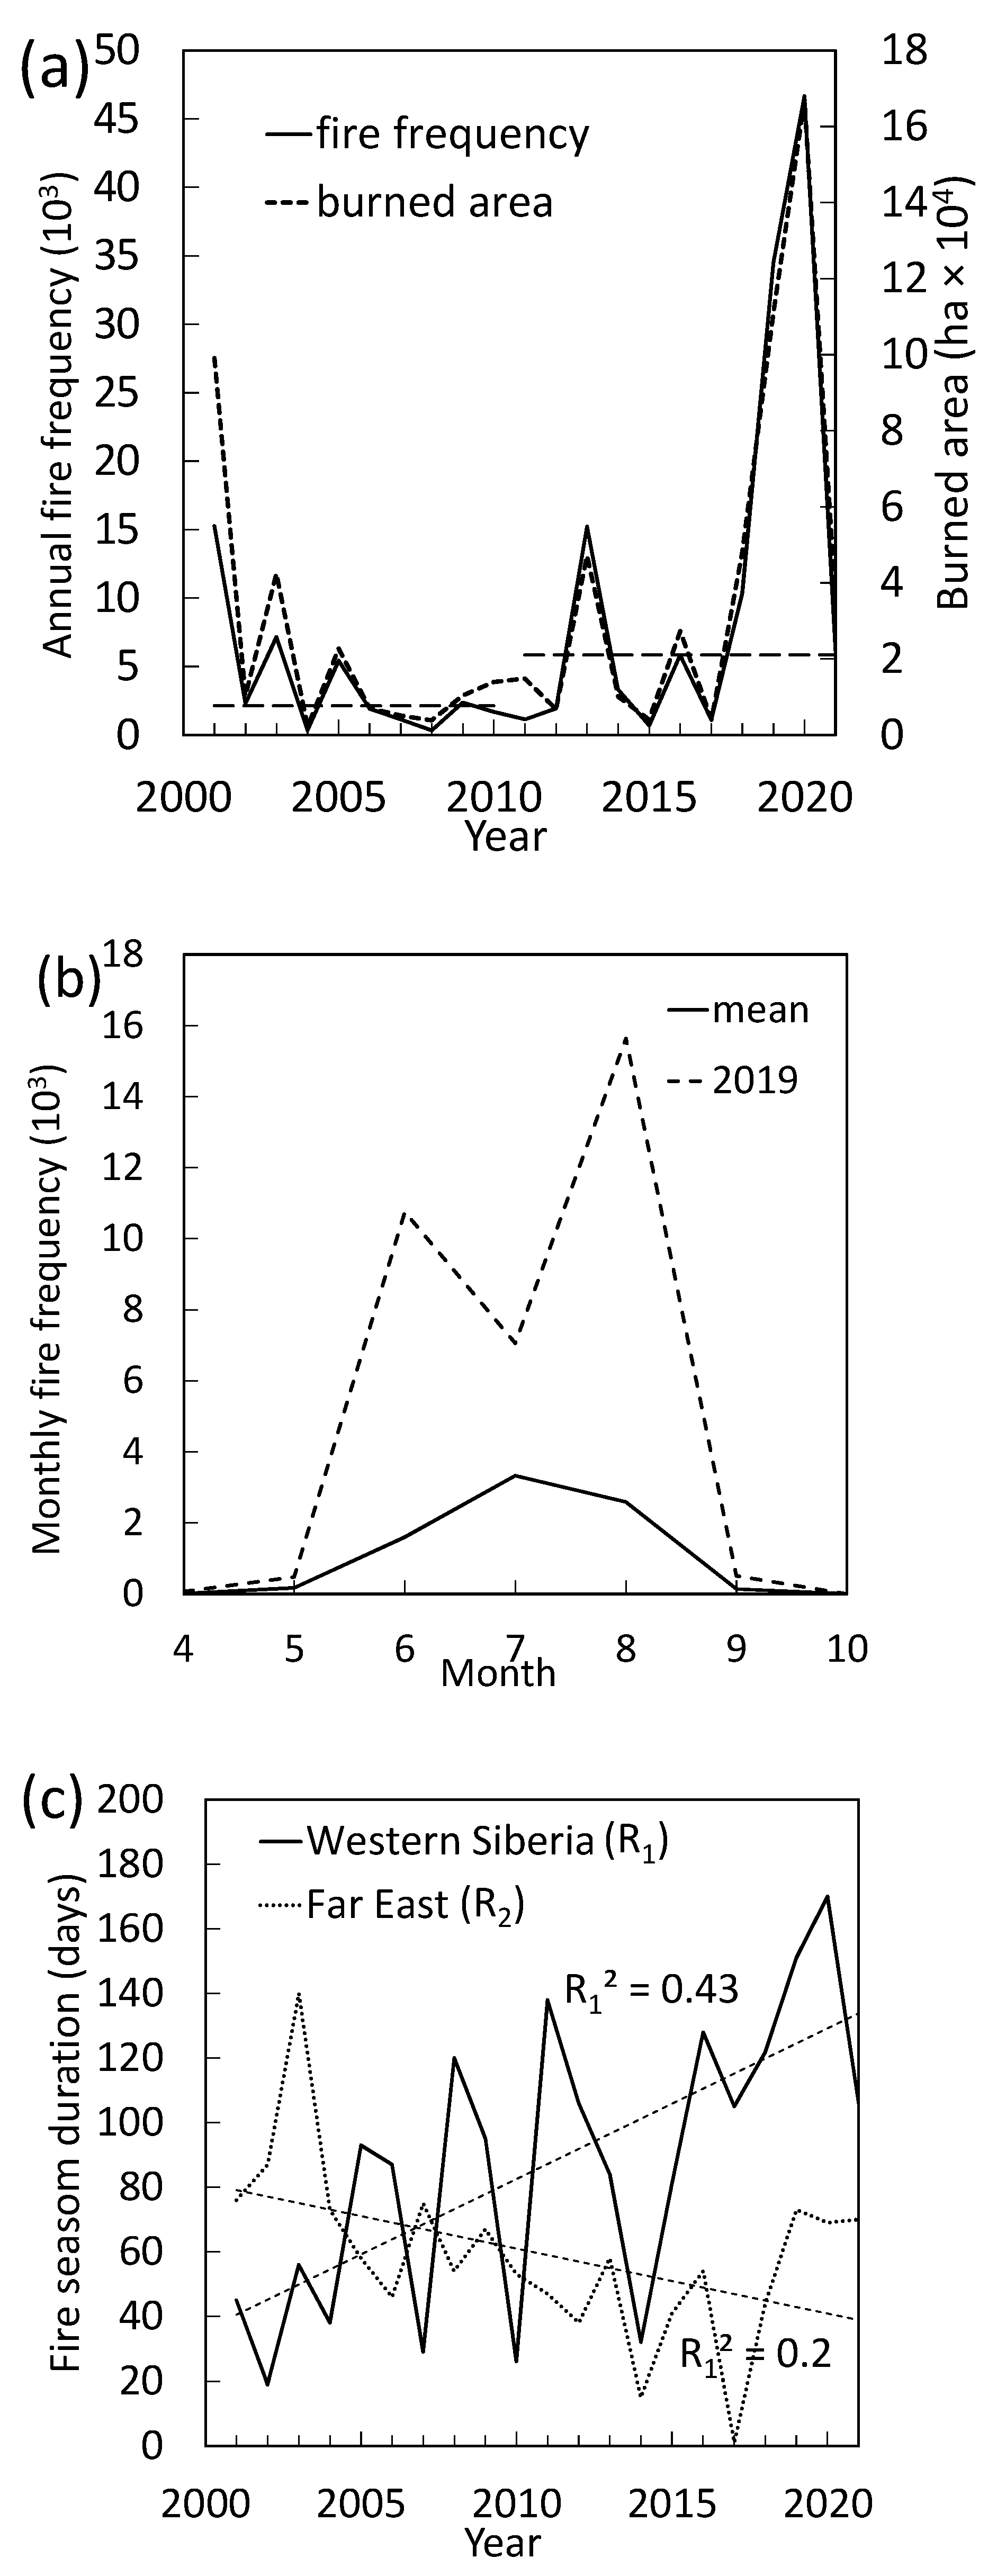
3.1. Changes in Fire Frequency and Burnt Area Extent

The total annual number of fires in the Siberian Arctic increased by a factor of 3.0 from the first (3792) to the second (11,547) decade of the 21st century (Figure 2a). This increase in decadal frequency was accompanied by a 2.6 times increase of the total area burnt (Table 1). Annual fire frequency and the extent of the burnt area for the whole Siberian Arctic were positively related to variation in summer air temperature and negatively related to variation in precipitation and ground cover moisture content (Table 2). The response of fire frequency and burnt area extent to climate was uneven within the Arctic. In the WS and ES, decadal fire frequency increased from the 2001–2010 to the 2011–2021 period by factors of 2.3 and 2.1, respectively. Burnt area increased in the WS and in the ES by factors of 3.5 and 2.5, respectively. No significant changes in fire frequency or burnt area extent were observed for the FE sector (Table 1).

3.2. Seasonality of Wildfire

Considered as a whole, the seasonal distribution of fire frequency was unimodal for the Siberian Arctic for the 2001–2021 period (Figure 2b). That pattern is typical at high latitudes [8]. However, for the severe 2019 fire year, the seasonal distribution was bimodal for the Siberian Arctic (Figure 2b).
The duration of the wildfire season in the Siberian Arctic increased by about 12 days during the 2001–2021 period, although changes varied by geographic sector. In WS, the fire season duration increased by 36 days, with no significant change in ES sector. For FE, fire season duration decreased by ca. 20 days (Figure 2c; Table 1). Similarly, the date of fire season onset trended earlier in WS and later in the FE (Table 1). Fire season duration in the WS sector was positively correlated to summer air temperatures, while the decrease in duration for the FE was related to precipitation, ground cover moisture, and SPEI drought index (Table 2). In WS, higher air temperature was associated with an earlier onset and longer duration of the fire season (Table 1).

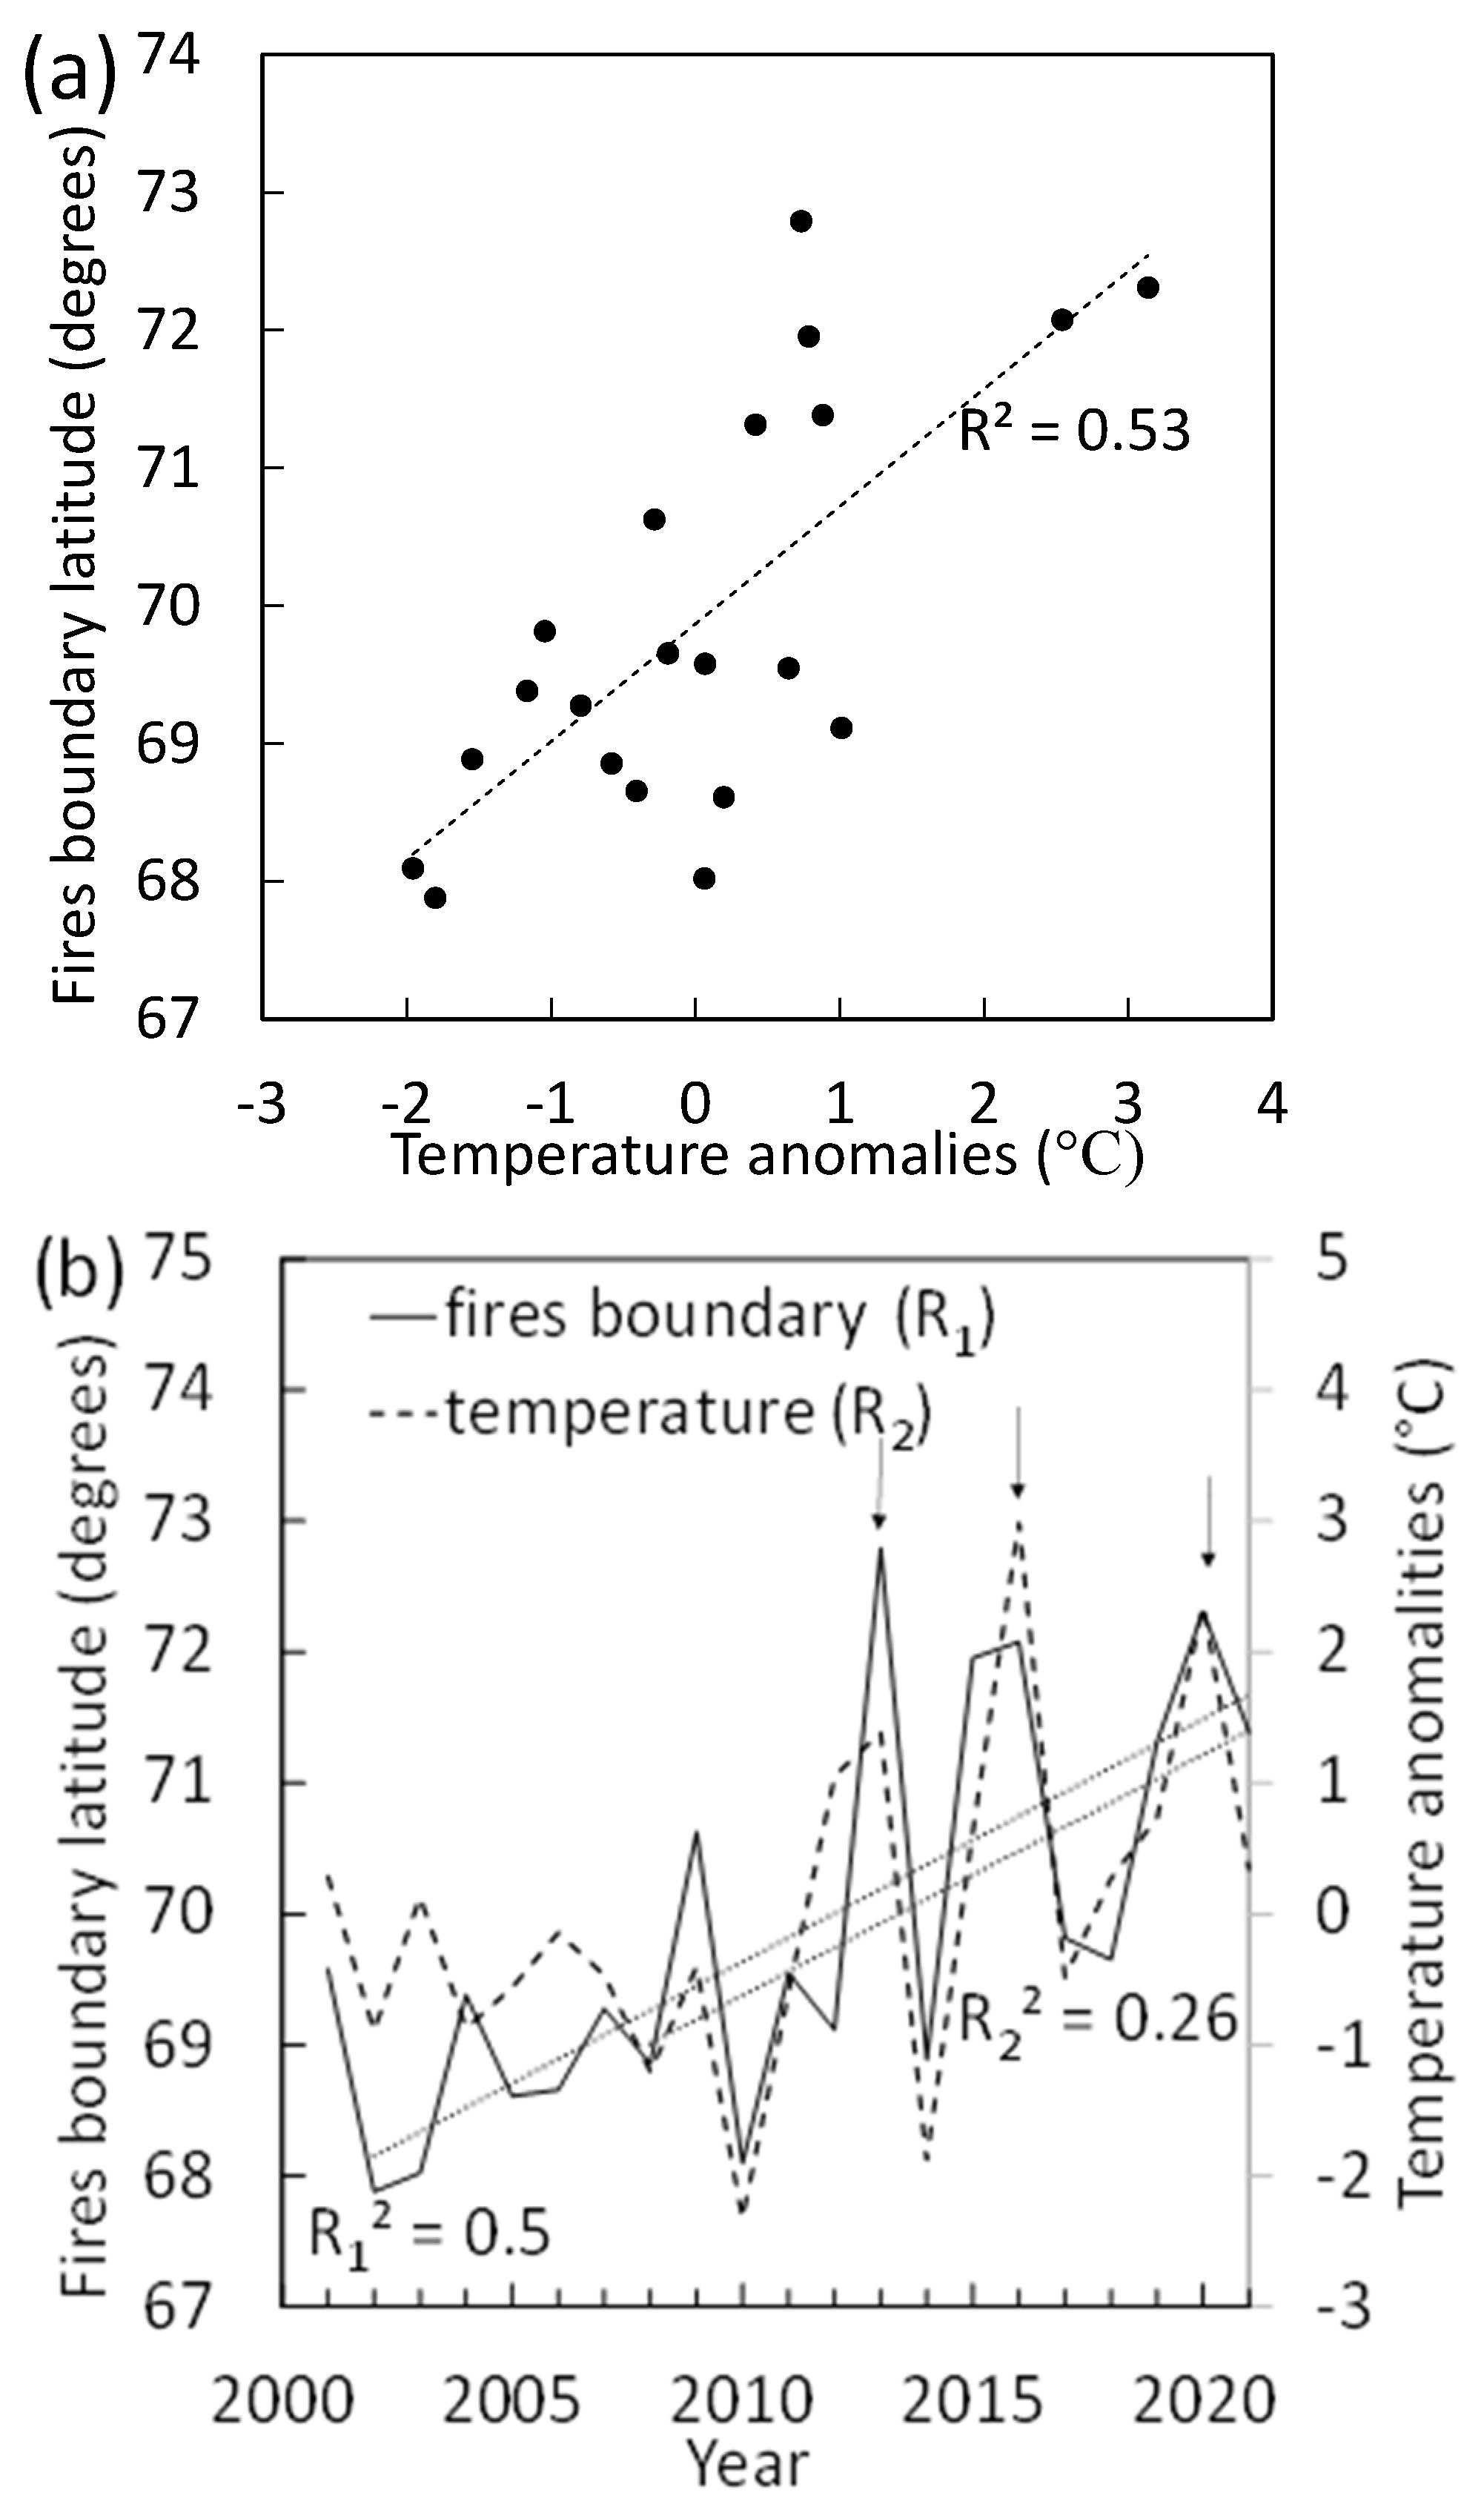
3.3. Northward Migration of the Wildfire Boundary

In ES, the northernmost wildfire boundary has already reached the Arctic Ocean coast (Figure 1). In WS, the wildfire boundary moved further northward in the 2001–2021 period (Figure 3a; Table 1). Boundary migration was correlated with the mean May–September air temperature (Figure 3b; Table 2). The extreme shift northward of fire occurrence (which was observed in 2013, 2015, 2016, and 2020 years) was synchronized with extremes of air temperature (“heatwaves”; Figure 3a).

3.4. Relationship of Wildfire to Climate including Lightning Frequency

Annual fire frequency and the extent of the burnt area for the whole Siberian Arctic were positively correlated to variation in summer air temperature and negatively correlated to variation in precipitation and ground cover moisture content (Table 2).
The potential effect of lightning strike frequency as well as more traditional measurements of climate was tested by hierarchical regression analysis for two time intervals: 2001–2021 and 2010–2021. The first, longer period includes all climate data except for lightning strike frequency, which was not available for the first half of the period. The second, shorter period added the available lightning strike frequency for the entire Siberian Arctic as a regressor variable.
(i)
Period 2001–2021
The annual fire frequency (Ff) was significantly related to climate:
Ff = 0.69 × Tjja − 0.40 × Pmjjas
in which Tjja is summer air temperature and Pmjjas is May-September precipitation. For the model, the adjusted R2 = 0.70 and the intercepted dispersion is 73%. The contribution of the variables to the intercepted dispersion included: Tjja = 57%, Pmjjas = 16%. In this and the following equations, all coefficients are significant at p < 0.05.
The burnt area (Ba) extent was described by the equation:
Ba = 0.46 × Tmjjas − 0.54 × Wmjjas
where Tmjjas and Wmjjas are the May-September air temperature and ground cover moisture content, respectively. Adjusted R2 = 0.69, intercepted dispersion is 72%. The variables input to the intercepted dispersion are following: Tjja = 49%, Wmjjas = 23%.
(ii)
Period 2010–2021
With the availability of lightning strike data, the dependence of fire frequency on climate was described by:
Ff = 0.60 × Tjja − 30 × SPEImjjas + 0.27 × LSI
in which Tjja and SPEImjjas are the summer air temperature and May-September drought index SPEI values, and LSI is the lightning strike index. Adjusted R2 = 0.88, intercepted dispersion is 92%. The variables input to the intercepted dispersion are following: Tjja = 77%, SPEImjjas = 9%, LSI = 6%.
The burnt area extent was described by the following equation:
Ba = 0.77 × Tmjjas + 0.33 × LSI
Adjusted R2 = 0.85, intercepted dispersion is 88%. The variables input to the intercepted dispersion are following: Tjja = 80%, LSI = 8%.

3.5. Wildfire Influence on the GPP, NPP and EVI

After fire, vegetation GPP, NPP, and EVI rapidly recovered to pre-fire levels (within about 10 years) (Figure 4). Positive GPP and NPP trends were observed for >96% of the hotspot locations (and >93% for EVI) (Figure 5). As for the whole Siberian Arctic, an increased GPP, NPP, and EVI trends were prevailed. Thus within the Siberian Arctic, we found positive trends for about 42% (GPP), 38% (NPP), and 36% (EVI) of the territory (Figure S1 in Supplementary). Whereas negative trends in GPP, NPP, and EVI were observed only for 1.2%, 1.3%, and 0.3% of the Siberian Arctic, respectively (p < 0.05, Figure S1).

4. Discussion

4.1. Changes in Wildfire Dynamics for the Siberian Arctic

Wildfire severity in the Siberian Arctic greatly increased in the first two decades of the 21st century. From the 2001–2010 to the 2011–2021 period, wildfire frequency increased by a factor of about 3, accompanied by a doubling of the extent of the area burnt. This increase in frequency and areal extent is consistent with the pattern of increased wildfire in the Siberian taiga since the 1990s [41] and in the tundra of Alaska and Canada [42,43].
We report here that annual fire frequency and extent of burnt area in the Siberian Arctic was more strongly correlated with ground moisture content (rho = −0.82 and −0.76, respectively) than with precipitation (rho = −0.56 and −0.49, respectively). In this region, ground moisture is gained through precipitation and stored as ice in the frozen permafrost. We suggest that this pattern of greater sensitivity may be due to release of soil water from thawing permafrost. Results presented here suggest that this increase in wildfire frequency and extent is likely due to the combination of a greater land area potentially subjected to fire due to dryer ground cover, i.e., a longer fire season, and increased sources of ignition. All of those factors are driven by present climate trends.
The positive correlation to growing season temperature is likely due to the indirect effects of temperature on fuel quality, particularly moisture content. Extreme shifts in the fire boundary were synchronized with air temperature and drought index SPEI anomalies (“heat waves’). Earlier fire boundary advance was noted on the Yamal Peninsula of Western Siberia [7]. We found that that the seasonal distribution of the wildfires in the extreme years turns from typical for high latitudes unimodal pattern to the bimodal pattern that is typical for the lower latitudes [41].
The increased frequency and extent of wildfire will likely accelerate the northward migration of the taiga-tundra boundary [10]. Burnt tundra reduces competition from fire-sensitive grass and moss/lichen communities and provides opportunities for shrub and tree settlement by pioneer trees species (e.g., larch, birch, and alder) [15]. Migration of bushy shrubs and larch into former tundra has been described for the Yamal peninsula (Western Siberia) and the Anabar Plateau (Eastern Siberia) [9,44,45].
The northward migration of the northern limit or boundary of wildfire occurrence in WS has both quantitative and qualitative effects. The additional land area apparently subject to fire would be expected to result in an increased number of fires. Meanwhile, previous research estimated that the fire return interval (the time period between consecutive stand-replacing fires) at the northernmost larch forest boundary in Siberia may reach 300 yrs. [46]. Additionally, the northward migration subjects a greater proportion of Arctic tundra as well as taiga to wildfire.
The duration of the fire season in the continental climate of WS increased by more than a month and was correlated to growing season temperature which in turn increased the flammability of potential fuel. The decreased duration of the fire season in FE was correlated to increased moisture in the ground cover, resulting in decreased flammability of potential fuel. Our analysis indicates that lightning strike frequency explained 6–8% of the year-to-year variation in wildfire frequency.
Lightning strikes are the primary source of wildfire ignition in this region [3]. Lightning is especially efficient in causing ignition during “dry thunderstorms” that yield little or no precipitation [47]. Low ground moisture content driven by warming conditions in the Arctic increase the likelihood that a given lightning strike will result in wildfire. In a synergistic fashion, warming conditions themselves are reported to increase the frequency of lightning strikes within the circumboreal Arctic (e.g., [15]). Research on lightning strikes in the continental USA projects that an increase in air temperature by 1 °C leads to an increase in lightning frequency of ~12% [13]. For Alaska and northern Canada, lightning ignition was estimated to increase by 90–230% by the end of this century [15]. Increased wildfire ignition by lightning was also reported for closed-canopy forests in North America [14]. Although such estimates have not been made for the Siberian Arctic, similar increases in the frequency of lightning strikes are likely. In addition to combustion of aboveground vegetation, fire from lightning and other sources may smolder and overwinter in the carbon-rich taiga and tundra soils, to emerge in the subsequent spring as described for Alaska, the Northwest Territories in Canada, and northeast Siberia [48,49].

4.2. Implications for Arctic Ecology and Carbon Storage

Our analysis of wildfire dynamics in the Siberian Arctic suggests that fire frequency and extent will continue to increase under current climate trends that increase the availability of both above- and below-ground fuel and lightning frequency as a source of ignition. With continued regional warming, the role of lightning as a source of wildfire ignition is likely to increase both because of the increased availability of dry fuel as well as from a direct increase in lightning frequency. Our results show that the relationship of fire to climate is based not just on continuous climate trends, but on “heat waves”, unusual spikes in air temperature.
The implications for C dynamics are somewhat less clear. Throughout the Holocene, Arctic taiga and tundra biomes have stored soil C that was removed from the atmosphere and fixed into organic biomass by Arctic vegetation. Although growing seasons are short in the Arctic, conditions that promote microbial decay of soil organic matter are also suppressed to a sufficient degree to result in net accumulation of soil C in deep, wet taiga and tundra soils. The northward migration of the wildfire boundary along with increased fire frequency and extent increases the contribution of greenhouse gases from arctic soils that have accumulated C throughout the Holocene particularly in the carbon-rich soil and turf deposits of the boggy areas of Western Siberia. Increased wildfire has been described as a threat to shift the status of the region from a sink to a source of atmospheric C [16].
A countervailing trend may be presented for aboveground C storage through enhanced vegetation growth. Since the onset of the current warming period, larch species that dominate in the permafrost zone have increased in growth index, leading to a potential increase in woody biomass [23,24]. Although quantitative analysis and projections of the balance between fire-driven C loss and vegetation-fixed C accumulation are still poor, these observations support the current status of the Siberian Arctic as a carbon sink [50]. Our analyses of the vegetation productivity markers for GPP, NPP, and EVI indicate increased carbon fixation by Siberian Arctic vegetation both within burnt areas (Figure 4) and for the region as a whole (Figure 5 and Figure S1). Similar findings have been reported for boreal forests of North America e.g., [19,22] who found that net ecosystem biomass production and black spruce growth increased in northern Canada.
Fundamental changes in vegetation type following wildfire were reported by Mack et al. [51] who found that severe burning of organic soils in Alaskan forests shifted tree dominance from slow-growing black spruce to fast-growing deciduous broadleaf trees, resulting in a net increase in C storage by a factor of five over the disturbance cycle. Tall woody shrubs (e.g., Alnus fruticosa) have been reported to replace low-growing herbaceous vegetation after tundra wildfires in western Siberia [52]. Increased dominance of deciduous species in Arctic taiga and tundra could increase the C residence time and mitigate to some extent the release of stored soil C into the atmosphere. Remote sensing of the circumpolar Arctic indicates the phenomenon of “tundra greening” in response to more favorable growing conditions supports increased C fixation (e.g., [18,52]). The same environmental changes in C fixation and storages will be accompanied by changes in the microbial flora that directly affect rates of organic breakdown, so that increased C fixation does not necessarily lead to long-term C storage.
Although commonly regarded as remote, the circumpolar Arctic is increasingly the focus of modern industrialization, particularly for resource extraction. The implications of increased wildfire, particularly in western Siberia, will pose additional challenges for natural gas and petroleum exploration and utilization.

5. Conclusions

We conclude that for wildfire in the Siberian Arctic, the decadal frequency tripled and the areal extent doubled from 2001–2021. Contributing factors included the northward migration of the northern limit of wildfire occurrence, increased duration and potential change in distribution of the fire season, and increased frequency of lightning strikes, all of which were correlated to seasonal warming and drought. Meanwhile, rapid vegetation NPP and GPP recovery in combination with prevailed increasing GPP and NPP trends throughout the region and shifts in community composition, suggests that the Siberian Arctic continues to serve as a sink for atmospheric C.

Supplementary Materials

The following supporting information can be downloaded at: https://www.mdpi.com/article/10.3390/fire5040106/s1, Figure S1: Trends in productivity of the Siberian Arctic. (a) Enhanced vegetation index, EVI. (b) Gross primary productivity, GPP. (c) Net primary productivity, NPP. Positive trends observed for 36% (EVI), 22% (GPP) and 22% (NPP) of the territory. Negative trends observed on the 1.3%, 0.4%, and 0.3%, of the territory, respectively. Trends significant at p < 0.05.

Author Contributions

Conceptualization, V.I.K.; Methodology, V.I.K., S.T.I. and M.L.D.; Validation, V.I.K., S.T.I. and M.L.D.; Formal Analysis, S.T.I., M.L.D. and A.S.G.; Investigation, V.I.K., S.T.I. and M.L.D.; Resources, S.T.I., M.L.D. and A.S.G.; Data Curation, S.T.I., M.L.D. and K.T.S.; Writing—Original Draft Preparation, V.I.K.; Writing—Review & Editing, V.I.K. and K.T.S.; Visualization, S.T.I., M.L.D. and A.S.G.; Supervision, V.I.K.; Project Administration, V.I.K.; Funding Acquisition, V.I.K. and K.T.S. All authors have read and agreed to the published version of the manuscript.

Funding

The research was funded by the Tomsk State University Development Program («Priority-2030»). Support for K.T.S. was provided by the USDA Forest Service. Findings and conclusions are those of the authors and should not be construed to represent official U.S. government policy.

Institutional Review Board Statement

Not applicable.

Informed Consent Statement

Not applicable.

Data Availability Statement

The data presented in this study are openly available: burned areas in sftp://fuoco.geog.umd.edu (accessed on 24 June 2022), https://doi.org/10.1016/j.rse.2018.08.005, (accessed on 24 June 2022), reference number [25]; hotspots in https://firms.modaps.eosdis.nasa.gov/download/ (accessed on 24 June 2022) DOI:10.5067/FIRMS/MODIS/MCD14DL.NRT.006 reference number [27]; climate data in https://cds.climate.copernicus.eu (accessed on 24 June 2022) reference number [34]; PEI in https://spei.csic.es/map/maps (accessed on 24 June 2022), https://doi.org/10.1175/2009JCLI2909.1 (accessed on 24 June 2022) reference number [35]; lightning number gained from https://doi.org/10.1029/2020GL091366 (accessed on 24 June 2022) reference number [36]; GPP/NPP data in https://search.earthdata.nasa.gov (accessed on 24 June 2022), https://doi.org/10.5067/MODIS/MOD17A2H.006 (accessed on 24 June 2022) reference number [37]; EVI data in https://search.earthdata.nasa.gov (accessed on 24 June 2022) https://doi.org/10.5067/MODIS/MOD13Q1.006 (accessed on 24 June 2022) reference number [38].

Acknowledgments

We appreciate the constructive suggestions and comments from the editor and anonymous reviewers.

Conflicts of Interest

The authors declare no conflict of interest.

References

  1. Bowman, D.M.J.S.; Kolden, C.A.; Abatzoglou, J.T.; Johnston, F.; van der Werf, G.R.; Flannigan, M. Vegetation fires in the Anthropocene. Nat. Rev. Earth Environ. 2020, 1, 500–515. [Google Scholar] [CrossRef]
  2. Tymstra, C.; Stocks, B.; Cai, X.; Flannigan, M. Wildfire Management in Canada: Review, Challenges and Opportunities. Prog. Disaster Sci. 2020, 5, 10004. [Google Scholar] [CrossRef]
  3. Ivanova, G.A.; Ivanov, V.A. The fire regime in the forests of the central Siberia. In Forest Fire Management at Regional Level; Furyaev, V.V., Ed.; Alex: Moscow, Russia, 2004; pp. 147–150. [Google Scholar]
  4. Evangeliou, N.; Kylling, A.; Eckhardt, S.; Myroniuk, V.; Stebel, K.; Paugam, R.; Zibtsev, S.; Stohl, A. Open fires in Greenland in summer 2017: Transport, deposition and radiative effects of BC, OC and BrC emissions. Atmos. Chem. Phys. 2019, 19, 1393–1411. [Google Scholar] [CrossRef] [Green Version]
  5. Anderegg, W.R.L.; Trugman, A.T.; Badgley, G.; Anderson, C.M.; Bartuska, A.; Ciais, P.; Cullenward, D.; Field, C.B.; Freeman, J.; Goetz, S.J.; et al. Climate-driven risks to the climate mitigation potential of forests. Science 2020, 368, eaaz7005. [Google Scholar] [CrossRef] [PubMed]
  6. Hanes, C.X.; Jain, W.P.; Parisien, M.-A.; Little, J.; Flannigan, M. Fire Regime Changes in Canada over the Last Half Century. Can. J. For. Res. 2019, 49, 256–269. [Google Scholar] [CrossRef]
  7. Moskovchenko, D.V.; Aref’ev, S.P.; Moskovchenko, M.D.; Yurtaev, A.A. Spatiotemporal Analysis of Wildfires in the Forest Tundra of Western Siberia. Contemp. Probl. Ecol. 2020, 13, 193–203. [Google Scholar] [CrossRef]
  8. Kharuk, V.I.; Ponomarev, E.I.; Ivanova, G.A.; Dvinskaya, M.L.; Coogan, S.C.P.; Flannigan, M.D. Wildfires in the Siberian taiga. Ambio 2021. [Google Scholar] [CrossRef]
  9. Frost, G.V.; Epstein, H.E. Tall Shrub and Tree Expansion in Siberian Tundra Ecotones Since the 1960s. Glob. Chang. Biol. 2014, 20, 1264–1277. [Google Scholar] [CrossRef]
  10. Kharuk, V.I.; Dvinskaya, M.L.; Ranson, K.J.; Im, S.T. Expansion of evergreen conifers to the larch-dominated zone and climatic trends. Russ. J. Ecol. 2005, 36, 164–170. [Google Scholar] [CrossRef]
  11. Shuman, J.K.; Foster, A.C.; Shugart, H.H.; Hoffman-Hall, A.; Krylov, A.; Loboda, T.; Ershov, D.; Sochilova, E. Fire disturbance and climate change: Implications for Russian forests. Environ. Res. Lett. 2017, 12, 035003. [Google Scholar] [CrossRef]
  12. Sizov, O.; Ezhova, E.; Tsymbarovich, P.; Soromotin, A.; Prihod’ko, N.; Petäjä, T.; Zilitinkevich, S.; Kulmala, M.; Bäck, J.; Köster, K. Fire and vegetation dynamics in northwest Siberia during the last 60 years based on high-resolution remote sensing. Biogeosciences 2021, 18, 207–228. [Google Scholar] [CrossRef]
  13. Romps, D.; Seeley, J.; Vollaro, D.; Molinari, J. Projected increase in lightning strikes in the United States due to global warming. Science 2014, 346, 851–854. [Google Scholar] [CrossRef] [PubMed]
  14. Veraverbeke, S.; Rogers, R.; Goulden, M.; Jandt, R.; Miller, C.; Wiggins, E.B.; Randerson, J.T. Lightning as a major driver of recent large fire years in North American boreal forests. Nat. Clim. Chang. 2017, 7, 529–534. [Google Scholar] [CrossRef]
  15. Hessilt, T.D.; van der Werf, G.; Abatzoglou, J.T.; Scholten, R.C.; Veraverbeke, S. Future increases in lightning-ignited boreal fires from conjunct increases in dry fuels and lightning. In Proceedings of the 23rd EGU General Assembly, Online, 19–30 April 2021; EGU21-2218. Available online: https://meetingorganizer.copernicus.org/EGU21/EGU21-2218.html (accessed on 19 July 2021).
  16. Coogan, S.C.P.; Robinne, F.-N.; Jain, P.; Flannigan, M.D. Scientists’ warning on wildfire—A Canadian perspective. Can. J. For. Res. 2019, 49, 1015–1023. [Google Scholar] [CrossRef] [Green Version]
  17. Zhu, Z.; Piao, S.; Myneni, R.B.; Huang, M.; Canadell, J.G.; Ciais, P.; Sitchet, S.; Friedlingstein, P.; Arneth, A.; Cao, C.; et al. Greening of the Earth and its drivers. Nat. Clim. Chang. 2016, 6, 791–795. [Google Scholar] [CrossRef]
  18. Vickers, H.; Hogda, K.A.; Solbo, S.; Karlsen, S.R.; Tommervik, H.; Aanes, R.; Hansen, B.B. Changes in Greening in the High Arctic: Insights from a 30 Year AVHRR Max NDVI Dataset for Svalbard. Environ. Res. Lett. 2016, 11, 105004. [Google Scholar] [CrossRef]
  19. Hember, R.A.; Kurz, W.A.; Coops, N.C. Increasing net ecosystem biomass production of Canada’s boreal and temperate forests despite decline in dry climates. Glob. Biogeochem. Cycles 2017, 31, 134–158. [Google Scholar] [CrossRef]
  20. Luo, Y.; Niu, S. The fertilization effect of CO2 on a mature forest. Nature 2020, 580, 191–192. [Google Scholar] [CrossRef] [Green Version]
  21. Giguere-Croteau, C.; Boucher, E.; Bergeron, Y.; Girardin, M.; Drobyshev, I.; Silva, L.; Helie, J.-F.; Garneau, M. North America’s oldest boreal trees are efficient water users due to increased [CO2], but do not grow faster. Proc. Natl. Acad. Sci. USA 2019, 116, 2749–2754. [Google Scholar] [CrossRef] [PubMed] [Green Version]
  22. Hember, R.A.; Kurz, W.A.; Girardin, M.P. Tree ring reconstructions of stemwood biomass indicate increases in the growth rate of black spruce trees across boreal forests of Canada. J. Geophys. Res. Biogeosci. 2019, 124, 2460–2480. [Google Scholar] [CrossRef] [Green Version]
  23. Kharuk, V.I.; Ranson, K.J.; Im, S.T.; Petrov, I.A. Climate-induced larch growth response within Central Siberian permafrost zone. Environ. Res. Lett. 2015, 10, 125009. [Google Scholar] [CrossRef] [Green Version]
  24. Kharuk, V.I.; Ranson, K.J.; Petrov, I.A.; Dvinskaya, M.L.; Im, S.T.; Golyukov, A.S. Larch (Larix dahurica Turcz) growth response to climate change in the Siberian permafrost zone. Reg. Environ. Chang. 2019, 19, 233–243. [Google Scholar] [CrossRef] [Green Version]
  25. Giglio, L.; Boschetti, L.; Roy, D.P.; Humber, M.L.; Justice, C.O. The Collection 6 MODIS burned area mapping algorithm and product. Remote Sens. Environ. 2018, 217, 72–85. [Google Scholar] [CrossRef]
  26. Sterckx, S.; Benhadj, I.; Duhoux, G.; Livens, S.; Dierckx, W.; Goor, E.; Adriaensen, S.; Heyns, W.; Van Hoof, K.; Strackx, G.; et al. The PROBA-V mission: Image processing and calibration. Int. J. Remote Sens. 2014, 35, 2565–2588. [Google Scholar] [CrossRef]
  27. Schroeder, W.; Giglio, L. NASA VIIRS Land Science Investigator Processing System (SIPS)/Visible Infrared Imaging Radiometer Suite (VIIRS)/375 m and 750 m Active Fire Products (Users Guide Version 1.4). 2018. Available online: https://viirsland.gsfc.nasa.gov/PDF/VIIRS_activefire_User_Guide.pdf (accessed on 9 May 2021).
  28. Zhang, N.; Sun, L.; Sun, Z.; Qu, Y. Detecting low-intensity fires in east Asia using VIIRS data: An improved contextual algorithm. Remote Sens. 2021, 13, 4226. [Google Scholar] [CrossRef]
  29. Krylov, A.; McCarty, J.L.; Potapov, P.; Loboda, T.; Tyukavina, A.; Turubanova, S.; Hansen, M.C. Remote sensing estimates of stand-replacement fires in Russia, 2002–2011. Environ. Res. Lett. 2014, 9, 105007. [Google Scholar] [CrossRef]
  30. Hawbaker, T.J.; Vanderhoof, M.K.; Beal, Y.-J.; Takacs, J.D.; Schmidt, G.L.; Falgout, J.T.; Williams, B.; Fairaux, N.M.; Caldwell, M.K.; Picotte, J.J.; et al. Mapping burned areas using dense time-series of Landsat data. Remote Sens. Environ. 2017, 198, 504–522. [Google Scholar] [CrossRef]
  31. Zhang, Q.; Ge, L.; Zhang, R.; Metternicht, G.I.; Du, Z.; Kuang, J.; Xu, M. Deep-learning-based burned area mapping using the synergy of Sentinel-1&2 data. Remote Sens. Environ. 2021, 264, 112575. [Google Scholar] [CrossRef]
  32. Jung, M.; Tautenhahn, S.; Wirth, C.; Kattge, J. Estimating basal area of spruce and fir in post-fire residual stands in Central Siberia using Quickbird, Feature Selection, and Random Forests. Procedia Comput. Sci. 2013, 18, 2386–2395. [Google Scholar] [CrossRef] [Green Version]
  33. Bartalev, S.A.; Stytsenko, F.V.; Egorov, V.A.; Lupyan, E.A. Sputnikovaya Otsenka Gibeli Lesov Rossii ot Pozharov. Lesovedenie 2015, 2, 83–94. (In Russian) [Google Scholar]
  34. Hersbach, H.; Rosnay, P.; Bell, B.; Schepers, D.; Simmons, A.; Soci, C.; Abdalla, S.; Alonso-Balmaseda, M.; Balsamo, G.; Bechtold, P.; et al. Operational Global Reanalysis: Progress, Future Directions and Synergies with NWP. ECMWF ERA Report Series. 2018. Available online: https://www.ecmwf.int/en/elibrary/18765-operational-global-reanalysis-progress-future-directions-and-synergies-nwp (accessed on 19 July 2021).
  35. Vicente-Serrano, S.M.; Beguería, S.; López-Moreno, J.I. A multiscalar drought index sensitive to global warming. The standardized precipitation evapotranspiration index. J. Clim. 2010, 23, 1696–1718. [Google Scholar] [CrossRef] [Green Version]
  36. Holzworth, R.H.; Brundell, J.B.; McCarthy, M.P.; Jacobson, A.R.; Rodger, C.J.; Anderson, T.S. Lightning in the Arctic. Geophys. Res. Lett. 2021, 48, e2020GL091366. [Google Scholar] [CrossRef]
  37. Running, S.; Mu, Q.; Zhao, M. MOD17A2H MODIS/Terra Gross Primary Productivity 8-Day L4 Global 500 m SIN Grid V006 (Dataset). NASA EOSDIS Land Processes DAAC. 2015. Available online: https://doi.org/10.5067/MODIS/MOD17A2H.006 (accessed on 9 May 2021).
  38. Didan, K.; Huete, A. MOD13Q1 MODIS/Terra Vegetation Indices 16-Day L3 Global 250 m SIN Grid (Dataset). NASA EOSDIS Land Processes DAAC. 2015. Available online: https://doi.org/10.5067/MODIS/MOD13Q1.006 (accessed on 9 May 2021).
  39. Tabachnick, B.G.; Fidell, L.S. Using Multivariate Statistics, 6th ed.; Pearson: Boston, MA, USA, 2013. [Google Scholar]
  40. Hurvich, C.M.; Tsai, C.L. Regression and time series model selection in small samples. Biometrika 1989, 76, 297–307. [Google Scholar] [CrossRef]
  41. Ponomarev, E.I.; Kharuk, V.I.; Ranson, K.J. Wildfires dynamics in Siberian larch forests. Forests 2016, 7, 125. [Google Scholar] [CrossRef] [Green Version]
  42. Mack, M.C.; Bret-Harte, M.S.; Hollingsworth, T.N.; Jandt, R.R.; Schuur, E.A.G.; Shaver, G.R.; Verbyla, D.L. Carbon loss from an unprecedented Arctic tundra. Nature 2011, 475, 489–492. [Google Scholar] [CrossRef]
  43. French, N.H.F.; Jenkins, L.K.; Loboda, T.V.; Flannigan, M.; Jandt, R.; Bourgeau-Chavez, L.L.; Whitley, M. Fire in the tundra of Alaska: Past fire activity, future fire potential, and significance for land management and ecology. Int. J. Wildland Fire 2015, 24, 1045–1061. [Google Scholar] [CrossRef] [Green Version]
  44. Myers-Smith, I.H.; Grabowski, M.M.; Thomas, H.J.; Angers-Blondin, D.S.; Daskalova, G.N.; Bjorkman, A.D.; Cunliffe, A.M.; Assmann, J.J.; Boyle, J.S.; McLeod, E.; et al. Eighteen years of ecological monitoring reveals multiple lines of evidence for tundra vegetation change. Ecol. Monogr. 2019, 89, e01351. [Google Scholar] [CrossRef] [Green Version]
  45. Kharuk, V.I.; Ranson, K.J.; Im, S.T.; Oskorbin, P.A.; Ovchinnikov, D.V. Tree-line structure and dynamics of the northern limit of the larch forest: Anabar Plateau, Siberia, Russia. Arct. Antarct. Alp. Res. 2013, 45, 526–537. [Google Scholar] [CrossRef] [Green Version]
  46. Kharuk, V.I.; Dvinskaya, M.L.; Ranson, K.J. Fire return intervals within the northern boundary of the larch forest in Central Siberia. Int. J. Wildland Fire 2013, 22, 207–2011. [Google Scholar] [CrossRef]
  47. Sapozhnikov, V.M.; Krechetov, A.A. Meteorological and geophysical aspects of underground cables lightning damage. In Atmospheric Electricity; Evteeva, A., Ed.; Gidrometheoizdat: Leningrad, Russia, 1982; pp. 256–258. [Google Scholar]
  48. Scholten, R.C.; Jandt, R.; Miller, E.A.; Rogers, B.M.; Veraverbeke, S. Overwintering fires in boreal forests. Nature 2021, 593, 399–404. [Google Scholar] [CrossRef]
  49. McCarty, J.L.; Smith, T.E.L.; Turetsky, M.R. Arctic fires re-emerging. Nat. Geosci. 2020, 13, 658–660. [Google Scholar] [CrossRef]
  50. Xu, L.; Saatchi, S.S.; Yang, Y.; Yu, Y.; Pongratz, J.; Bloom, A.A.; Bowman, K.; Worden, J.; Liu, J.; Yin, Y.; et al. Changes in global terrestrial live biomass over the 21st century. Sci. Adv. 2021, 7, eabe9829. [Google Scholar] [CrossRef]
  51. Mack, M.C.; Walker, X.J.; Johnstone, J.F.; Alexander, H.D.; Melvin, A.M.; Jean, M.; Miller, S.N. Carbon loss from boreal forest wildfires offset by increased dominance of deciduous trees. Science 2021, 372, 280–283. [Google Scholar] [CrossRef] [PubMed]
  52. Bhatt, U.S.; Walker, D.A.; Raynolds, M.K.; Bieniek, P.A.; Epstein, H.E.; Comiso, J.C.; Pinzon, J.E.; Tucker, C.J.; Steele, M.; Ermold, W.; et al. Changing Seasonality of Panarctic Tundra Vegetation in Relationship to Climatic Variables. Environ. Res. Lett. 2017, 12, 055003. [Google Scholar] [CrossRef]
Figure 1. Geographic sectors of the Siberian Arctic: (1) Western Siberia (from the Ural Mountains eastward to the Yenisei River), (2) Eastern Siberia (eastward from the Yenisei River to the Kolyma River), (3) Far East (eastward from the Kolyma River to the easternmost. The locations of wildfires during the 2001–2021 period are marked by red.
Fire 05 00106 g001
Figure 2. For the Siberian Arctic as whole, (a) decadal mean fire frequency and burned area (broken lines) increased 2.8 and 2.6 times from 2001–2010 to 2011–2021. (b) The mean timing of the wildfire season has a unimodal pattern, whereas the 2019 extreme fire year is bimodal, atypical of the Siberian Arctic. (c) Duration of the wildfire season differs across the Arctic, with an increase for Western Siberia and decrease for the Far East sector. Trends significant at p < 0.05.
Fire 05 00106 g002
Figure 3. (a) Fire boundary norward migration correlated with MJJAS air temperature. (b) Fire boundary extreme shifts synchronized with air temperature extremes (“heat waves” in 2013, 2015–2016, and 2020 years). Trends significant at p < 0.05.
Fire 05 00106 g003
Figure 4. Vegetative recovery of burnt areas in the Siberian Arctic. The year of the fire is set at 0. (a) Enhanced vegetation index. (b) Gross primary productivity. (c) Net primary productivity. Shaded areas represent the 95% confidence interval around the trend line.
Fire 05 00106 g004
Figure 5. Gross primary productivity (GPP) post-fire trends within “hot spots”. GPP increasing and decreasing trends observed within 97.3% and 2.7% of “hotspots”, correspondingly. Trends significant at p < 0.05. Note: hot spots presented as a non-scale points.
Fire 05 00106 g005
Table 1. Wildfire parameters for the Siberian Arctic and its regional sectors: a median values comparison of two time intervals (2001–2010 vs. 2011–2021).
ParameterWhole Siberian ArcticWestern Siberia SectorEastern Siberia SectorFar East Sector
Fire frequency ratio2.82.3 *2.11.1
Burnt area extent ratio2.63.5 **2.50.5
Fire season duration (days)18.0 **36.5 **8.5−19.0*
Onset of fire season (days)−6.0−23.0 **−5.06.5
Conclusion of fire season (days)11.518.5 *1.0−15.5
Northern fire boundary shift
(degrees of latitude)
0.02.6 **−0.40.1
Kruskal-Wallis test significance at p < 0.10 (*) and p < 0.05 (**). Mann-Whitney U-test significance at p < 0.10 (italic) and p < 0.05 (bold).
Table 2. Correlation of wildfire characteristics with climate in the Siberian Arctic (2001–2021) A.
VariablesWhole Siberian ArcticWestern Siberia SectorEastern Siberia SectorFar East Sector
Annual Fire Frequency
Air temperature (June–August)0.66 **0.41 *0.68 **0.39 *
Precipitations (June–August)−0.56 **−0.38 *−0.53 **−0.36
Ground cover moisture (May–September)−0.82 **−0.46 **−0.84 **−0.50 **
SPEI B (May–September)−0.68 **−0.42 *−0.70 **−0.50 **
Burnt area extent
Air temperature (June–August)0.70 **0.43 *0.68 **0.27
Precipitations (June–August)−0.49 **−0.27−0.44 **−0.15
Ground cover moisture (May–September)−0.76 **−0.34−0.78 **−0.49 **
SPEI B (May–September)−0.59 **−0.56 **−0.62 **−0.56 **
Fire season duration
Air temperature (May–September)0.41 *0.72 **0.190.28
Precipitations (June–August)−0.47 **−0.22−0.32−0.39 *
Ground cover moisture (May–September)−0.48 **−0.50 **−0.43 **−0.61 **
SPEI B (May–September)−0.09−0.10−0.25−0.62 **
Northern boundary
Air temperature (May–September)0.41 *0.65 **0.38 *0.18
Precipitations (June–August)−0.26−0.25−0.36−0.37 *
Ground cover moisture (May–September)−0.28−0.42 **−0.32−0.33
SPEI B (May–September)−0.68 **−0.27−0.62 **−0.15
Onset date
Air temperature (May–June)−0.41 *−0.59 **−0.32−0.23
Final date
Air temperature (August–September)0.290.58 **0.110.09
A Values in the table are Pearson and Spearman (italic) correlation coefficients. Spearman statistic was used in cases of non-Gaussian distribution. Significance levels at p < 0.10 (*) and p < 0.05 (**) are marked. B SPEI is Standardized Precipitation Evapotranspiration Index. Median values were used in analysis. Note: SPEI increase corresponded to the drought decrease by definition.
Publisher’s Note: MDPI stays neutral with regard to jurisdictional claims in published maps and institutional affiliations.

