Article

Wildfire Rates of Spread in Grasslands under Critical Burning Conditions

1
CSIRO, GPO Box 1700, Canberra, ACT 2601, Australia
2
Wild Rose Fire Behaviour, 180–50434 Range Road 232, Leduc County, AB T4X 0L1, Canada
3
Country Fire Authority, P.O. Box 701, Mt Waverley, VIC 3149, Australia
*
Author to whom correspondence should be addressed.
Submission received: 11 March 2022 / Revised: 31 March 2022 / Accepted: 12 April 2022 / Published: 14 April 2022

Abstract

:
An analysis of a dataset (n = 58) of high-intensity wildfire observations in cured grasslands from southern Australia revealed a simple relationship suitable for quickly obtaining a first approximation of a fire’s spread rate under low dead fuel moisture contents and strong wind speeds. It was found that the forward rate of fire spread is approximately 20% of the average 10-m open wind speed. The data on rate of fire spread and 10 m open wind speed ranged from 1.6 to 17 and 20 to 62 km h−1, respectively. The validity of the resulting rule of thumb was examined across a spectrum of burning conditions and its performance was contrasted against that of established empirical-based fire spread models for three different grassland fuel conditions currently used operationally in Australia. The 20% rule of thumb for grassfires produced error statistics comparable to that of the fire spread rate model for grazed or cut grass fuel conditions as recommended for general use during the summer fire season in southern Australia.

1. Introduction

Grass-dominated biomes, ranging from temperate open grasslands and steppes to savanna type shrublands and woodlands, occupy more than 40% of the earth’s vegetative cover [1]. Fire, either of natural or anthropogenic origins, and other human activities such as grazing and cultivation are key in maintaining grassland areas.
Most grassland fuels comprise very fine-sized fuel particles with corresponding high surface area-to-volume ratios [2] and light fuel loads compared to other vegetation/fuel types [3]. When fully cured, grass fuel-beds are highly combustible (Figure 1) and grassfires, given their short flame front residence times [4], in turn become exceptionally responsive to wind speed and direction [5,6,7] in comparison to other wildland fuel complexes such as forests and shrublands [8].
At the extreme end of the fire danger rating scale, grassfires have been observed to propagate over multi-hour periods with sustained rates of spread in excess of 6.0 km h−1 (or 100 m min−1) [9,10,11,12,13], easily exceeding the maximums observed in many other wildland fuel types [14]. For example, at 27.3 km h−1, the 1987 Boonoke grassfire in southwestern New South Wales, Australia [15], represents one of the fastest spreading wildfires documented anywhere in the world to date, being observed to advance 25 km over the span of 55 min. Higher rates of spread (i.e., >30 km h−1), often associated with shorter time intervals (e.g., 10 min), have been documented, for example, on the 2005 Wangary Fire in South Australia [8,16] and have been anecdotally described for the 2016 Anderson Creek Fire [17] that occurred in northcentral Oklahoma/southcentral Kansas [18]. Nonetheless, it is unclear if these observations of higher rates of spread can be sustained over long time periods, such as an hour, or if they represent short-term fluctuations that result from occasional peak periods in wind velocity, fire-to-fire and fire-atmosphere interactions or if they are the results of the observation of localised pseudo-flame fronts associated with spotting behaviour that are perceived at times by observers as the main advancing head fire.
Given their potential rapid rates of spread, wildfires burning in fully cured grasslands under the influence of low relative humidity (<20%) and strong winds (>40 km h−1) can quickly grow to areas of more than 100 km2 (or 10,000 ha) in a single day [12,15,18,19,20], as illustrated in the example of the 1983 Narraweena Fire in southeastern South Australia that advanced some 65 km in a single general direction from its point of origin in a little less than four hours, burning an estimated 347 km2 of grasslands before a change in the wind direction caused the eastern flank to become a wide head with numerous ‘fingers’ and ‘bays’ (Figure 2).
It is expected that such examples of extreme wildfire behaviour events are observed throughout grassland areas of the world, which experience a marked dry season and occasional brief occurrences of heightened fire spread potential. However, such grassfires are very seldom described in the scientific literature.
As a result of their rapid spread rate potential at certain times of the year, grassfires are quite often associated with both civilian and firefighter fatalities, particularly in rural areas [12,16,18,19,20,22,23,24,25,26]. One of the most notable incidents, involving the largest number of grassfire-related human fatalities in Australia (23 in total [27]), occurred on 8 January 1969 near the community of Avalon in southcentral Victoria, in which 17 holiday travelers lost their lives when they became trapped by a grassfire after having exited their cars along the freeway between Geelong and Melbourne [3,28].
Under certain combinations of environmental conditions [19], wildfires and especially those spreading in cured grasslands can quickly impact rural communities with little or no warning. In such cases, traditional predictive fire spread capacity [29,30,31] may not be capable of issuing timely emergency warnings to the general public in advance of a rapidly spreading grassfire impacting them and the community’s values-at-risk [14,32].
Cruz and Alexander [33] have showed that a wildfire’s propagation under heightened fire danger conditions in conifer forests, eucalypt forests and shrubland fuel types will have a forward rate of spread that can be approximated as 10% of the average 10 m open wind speed where both values are expressed in the same units. For example, given an average open wind speed of 40 km h−1, the wildfire spread rate would be estimated to be about 4 km h−1. They based this rule of thumb on the analysis of a large wildfire case study dataset (n = 118). Subsequently, they undertook an evaluation study of this rule of thumb that confirmed its validity [14].
The 10% rule of thumb was deemed not applicable to grasslands [33]. The purpose of this paper is to examine the feasibility of devising a simple rule of thumb for estimating the rate of spread of wildfires in cured grasslands from wind speed alone.

2. Materials and Methods

2.1. Data

The data used to evaluate the suitability of a simple relationship between the average 10-m open wind speed (U10, km h−1) and the average forward rate of fire spread (R, km h−1) for grassfires came from the datasets given in [10,34,35], augmented by data from two significant large-scale grassfires in recent times, the 2005 Wangary fire (780 km2 area burned) in South Australia [16] and the 2015 Cascade fire (1280 km2) in Western Australia [12]. In addition to information on R and U10 for particular fire runs, these datasets included information on the date of the fire, the time interval and, thus, the duration of the fire spread observation; ambient air temperature (T, °C); relative humidity (RH, %), degree of curing (C, %); grass fuel condition (i.e., undisturbed (uncut or very lightly grazed), grazed or cut, and eaten-out (or very heavily grazed)) as per [8,10]; and a reliability rating of the weather and fire spread rate data (Table 1). The values of C were not directly measured in the field but rather estimated visually. All of the fire runs selected for analysis occurred on flat or undulating terrain; thus, slope steepness was not a factor influencing the associated spread rates. All fire runs were also representative of a fire propagating after achieving a pseudo steady-state condition [7,10]. Readers interested in further details should consult the associated publications on the data sources [10,34,35] and case studies [12,16].

2.2. Imposed Data Constraints

Criteria were imposed on the data to ensure compatibility with the intended use of the study results to provide approximate predictions of wildfire spread rates in cured grasslands over periods of one hour or more from forecasted weather data. We removed data where the spread observation interval was less than one hour, as we considered small duration wildfire runs to have a high uncertainty and to be poorly correlated with the hourly or half-hourly weather data that is normally recorded at a weather station located tens of kilometres from the headfire region. We also imposed constraints to remove situations with reduced fire spread potential—i.e., we only considered observations with a fine dead fuel moisture content (MC, %) < 10%, a C > 90% and when the Grassland Fire Danger Index (GFDI) [19] was >30. To remove data with higher uncertainty, we also did not consider fire spread runs where at least one of the two reliability ratings of 5 was present (Table 1).

2.3. Model Calculations

Several modelled variables were used to support the analysis. MC, a variable not typically measured directly during wildfire events, was estimated from an equation developed from McArthur’s [36] fuel moisture table. The equation is given in Appendix A (see Equation (A1)). The GFDI, a surrogate for fire spread potential incorporating the effects of C, T, RH and U10, was calculated using the Mk 3 equation given in [37]; see Equation (A2). We also contrasted the fit statistics obtained from this analysis with the statistics obtained using the Cheney et al. [10] models currently used operationally in Australia for predicting the rate of spread of wildfires in the following grassland fuel conditions: (1) undisturbed, (2) grazed or cut and (3) eaten-out (see Equations (A3)–(A5), respectively).

2.4. Statistics

Linear regression analysis was used to develop a statistical relationship between R and U10. The results from this analysis were used for deriving a first approximation rule of thumb. Error metrics used to quantify and compare the predictive accuracy of different models were the mean absolute error (MAE), mean bias error (MBE), mean absolute percent error (MAPE) and the root mean square error (RMSE) [38,39,40]. Statistical analysis was undertaking using the R 4.1.2 software package [41].

3. Results

3.1. Dataset Characteristics

A total of 24 R observations were presented in the [10] dataset, 187 in the [34,35] database, 15 in [16] and one run in [12]. After applying the data selection criteria, removing duplicated fire runs and excluding data with a reliability rating (Table 1) of 5 (i.e., the poorest), the dataset for analysis in the present study comprised a total of 58 wildfire observations with a fire run duration of >1.0 h, a C > 90%, an MC < 10% and a GFDI > 30. The fires in the assembled dataset include representation from Australian states of New South Wales, Victoria, South Australia and Western Australia.
Table 2 provides the basic statistics for the analysis dataset. The R averaged 6.9 km h−1, varying between 1.6 and 17 km h−1. The fire run duration averaged 1.9 h, with the longest spread distance being that of the 1983 Narraweena fire (Figure 2) that spread approximately 65 km over a period of 3.8 h [21]. The estimated MC and U10 ranged between 1.5 and 9.6%, and 20 and 62 km h−1, respectively. The GFDI averaged 101, with 49 of the 58 observations above a GFDI of 50, which is the Extreme Fire Danger Rating Class for grasslands [19]. The wildfires spread in a combination of native grasslands, pastures and winter crops (e.g., wheat, barley and canola). The dataset was characterised by the three grass fuel conditions as described by [8,10] with the following distribution: two fire runs in the undisturbed condition, 38 fire runs in grazed or cut condition and 18 fire runs in an eaten-out condition.

3.2. Modelling

A simple linear regression analysis of R with U10 as the sole explanatory variable produced a slope of 0.17122 (p = 0.001) and a y-intercept of −0.2559 (p = 0.89). A similar regression forced through the origin produced a slope of 0.1654 (p < 0.0001). This equation produced an adjusted R2 of 0.82, an MAE of 2.6 km h−1, an MBE of 0.01 km h−1 and an MAPE of 51%.
Assuming the rate of fire spread as being 20% of the wind speed (i.e., an 0.2 multiplier) yielded an MAE of 2.83 km h−1, an MBE of 1.47 (i.e., an over-prediction) and a MAPE of 65.5% (Figure 3). Residuals from the application of this model (Figure 4) were not significantly correlated with MC (Pearson r = 0.20; p = 0.13) or GFDI (Pearson r = −0.02; p = 0.88). These results suggest that the MC values contained in the dataset have no relevance in further explaining the variation in R under the associated heighted fire danger conditions of the dataset. It is noted that all fires with an MC above 6% (n = 6) were over-predicted by this model (Figure 4c).
Considering the distribution of error statistics by grass fuel condition (Table 3), the 20% rule of thumb predicted the grazed or cut grass fuel condition data the best, with the MAE, MBE and MAPE being reduced to 2.54 km h−1, 0.89 km h−1 and 51%, respectively. This model under-predicted the two undisturbed or natural grassland condition R observations with an average error of 4.17 km h−1 and over-predicted the eaten-out condition observations, with an MAE of 3.30 km h−1 and a MAPE of 80%.
Applying the three grassfire rate of spread models of Cheney et al. [10] to the entire dataset resulted in a comparable MAE (2.86 km h−1) and MAPE (60%) and an increase in the over-prediction bias to 2.07 km h−1 (Table 3). When contrasting evaluation statistics obtained with the 20% rule of thumb against those yielded by considering the specific grassland fuel conditions, a number of distinct trends were observed. For the grazed or cut fuel condition, the fire spread model produced higher errors than those obtained with the rule of thumb. The MAE was 3.34 km h−1 (vs. 2.54 km h−1 with rule of thumb), the MBE was 2.68 km h−1 (vs. 0.89 km h−1) and the MAPE was 74% (vs. 51%), although the rule of thumb under-predicted the two fastest spreading fires (Figure 3 and Figure 5).
In contrast, the fire spread model predictions were more accurate than the rule of thumb for the undisturbed and eaten-out grass conditions, with an MAE of 3.52 and 1.58 km h−1 and MAPE of 24% and 36%, respectively (Table 3). For these grassland fuel conditions, the rule of thumb under-predicted all the undisturbed grassfires and over-predicted the eaten-out ones (Figure 4 and Figure 5).

4. Discussion

4.1. General Findings

Our analysis suggests that under critical burning conditions, as defined by high wind speeds, low fine dead fuel moisture content and highly cured fuel-beds, wind speed exerts the dominant effect on the spread rate of grassfires. In such situations, the rate of fire spread in grassland fuel types can very well be approximated as being 20% of the prevailing wind speed. We propose and have, thus, focused our analysis on the 0.2 wind speed multiplier instead of the more precise 0.165 value obtained from regression analyses. We selected this value as it makes computing a grassfire’s spread rate from wind speed alone much easier and faster using mental arithmetic.
It is worth pointing out that the 20% wind speed rule of thumb for grassfires results in an approximate 15% over-prediction bias in comparison to use of the statistically derived coefficient. Over-predictions of fire behaviour can be easily adjusted without serious consequences whereas under-predictions can be potentially disastrous [42].
The contrast between our results and those obtained by [33], where it was found that the spread rate of fires in forests and shrublands was well approximated as 10% of the wind speed, reveals that under critical burning conditions, grassfires can spread at about twice the rate of fires occurring in forests and shrublands. Grassfires are, thus, capable of covering the same distance in roughly half the time.
The bulk of the data used in the present study analysis had U10 levels > 30 km h−1 and estimated MC values < 6%. These thresholds are in close agreement with the findings of [14,33] for the 10% wind speed rule of thumb for fire spread rates in forests and shrublands and should, therefore, be used as the application bounds for the grassfire rule of thumb as well.

4.2. Grassland Fuel Condition and Wildfire Propagation

Any given grassland landscape in southern Australia might very well be represented by a mosaic of varied fuel-bed conditions, composed of native grasslands as well as pastures under different grazing pressures, and winter crops (e.g., wheat, barley and canola) that could be in an unharvested (early in the fire season) or harvested state. From a fire behaviour prediction perspective, there are seasonal changes in the grass fuels across the landscape that determine which of the three Cheney et al. [10] fire spread models (Appendix A) would, for general purposes, be the most appropriate for predicting grassfire propagation. Given the current operational inability to readily map the dynamic nature of the grassland fuel condition mosaic at the landscape scale, Cheney and Sullivan [8] recommended the grazed or cut grass fuel condition model as being the most appropriate for predicting fire spread in typical summer-time situations.
Although the 20% rule of thumb was not developed to serve as a substitute for any one of the Cheney et al. [10] models (Figure 6a), it is worth noting that the fit statistics obtained with the application of the rule of thumb for this dataset were comparable to the fire spread rate model for the grazed or cut condition. The 20% rule of thumb produced smaller average errors for fires spreading with an R up to 15 km h−1, but larger under-predictions resulted for faster spreading fires. During severe drought periods, grasslands might be better characterised by the eaten-out condition for fire behaviour prediction purposes. For this grassland fuel condition, the rule of thumb over-predicted all 18 fires in the dataset. The slower spread rate in this grassland fuel condition is likely to be related to the following: (1) an inherent slower flame spread rate due to the horizontally oriented fuels and limiting fuel quantity; and (2) the inability of the small flames associated with these fuels to breach areas with horizontal fuel discontinuities, such as roads or other non-burnable areas (e.g., firebreak and ploughed field). From these results, it is expected that the rule of thumb will likely over-predict the fire spread potential in this grassland fuel condition.

4.3. Main Assumptions of the Grassfire Rule of Thumb

We believe that predictions based on the 20% rule of thumb are likely to represent a worst or near-worst case scenario for fire spread where fine dead fuel moisture contents are low (i.e., <6%); open winds are strong (i.e., >30 km h−1) and gusty; and there are no appreciable barriers to fire spread that would hinder or momentarily limit fire propagation and that fire suppression efforts are not successful in constraining fire spread and size and, hence, reducing the overall propagation. Within this context, the application of the rule of thumb assumes that the landscape is essentially fully cured. The existence of wetter or less than fully cured areas, such as along creek lines and other breaks in landscape fuel continuity (e.g., the presence of irrigated crops), might lead to over-predictions in fire spread across the landscape.
The rule of thumb assumes the fire is spreading at its quasi-steady or pseudo-steady state (i.e., it has already completed its initial growth/acceleration phase). It is expected that this acceleration phase is short, likely under 20–30 min [3,8], given the heightened fire danger conditions to which the rule of thumb is deemed applicable. Incorporating the effect of this acceleration period into the fire spread distance calculations under these burning conditions is likely not to have much practical relevance.
The rule of thumb aims to produce an approximation of the average rate of fire spread over periods of an hour or more, with the best accuracy likely to occur when the prediction period extends over several hours. The rule of thumb does not capture smaller temporal variations in rate of spread which occur in response to peak wind gusts which can cause surges in fire propagation. The rate of fire spread during these surges can be several times faster than the average observed over periods of an hour or more. Short-term peaks in the rate of fire spread have been observed to be three to five times higher than the longer-term average in high-intensity outdoor experimental fires in boreal forest [49] and semi-arid shrubland [50] fuel types. The predictive models of fire spread rate do not capture these fluctuations, but nevertheless, users of these models should be aware of this inherent short-term variability in the speed of a moving flame front. The occurrence of short- to medium-range spotting can also lead to local variations in the short-term movement of the advancing fire edge.

4.4. Error and Uncertainty in Grassfire Rate of Spread Predictions

The rule of thumb predicted the wildfire data that was used in its development to within an average relative error of 66%. This level of error and the degree of scatter visible in Figure 3 is to be expected given the nature of wildfire case study data [10,14,33] resulting from uncertainties in the rate of spread observations and the lack of representativeness of the weather data for the fire location, in addition to the effect of unquantified factors such as fuel discontinuities [51] or suppression effects on fire propagation [52]. For comparison’s sake, the fire spread models of Cheney et al. [10] used in the present study analysis estimated the spread rate of experimental fires, which would have involved accurate measurements of the model input variables, to relative errors between 20 and 30% [53].
The level of error obtained with the rule of thumb was lower than that found in other model evaluation studies involving wildfire data where the average error was closer to 100% [33]. This lower level of error is likely to arise from the higher dominance of wind speed on fire propagation in grasslands in contrast to forests or shrublands and the general lack of topographic effects on wind flow and fire behaviour in the grassfire dataset analysed in the present study.
The interpretation of the rule of thumb predictions should consider the uncertainty in the forecasted wind speeds or extrapolation of observed wind speeds at one weather station location to the landscape as a whole. The utilisation of the ±35 error bands [40] in conjunction with the average prediction is likely to help in the interpretation of the results beyond just a best estimate.

4.5. Practical Application of the Grassfire Rule of Thumb

The practical application of the 20% rule of thumb requires an estimate of the 10 m open wind speed. A weather forecast will be the most obvious source of the wind speed needed to estimate grassfire spread. In cases where a forecast is not available or the forecast is not viewed as representative of the situation, the local observations of average wind speed should be used. If the measurement height and location does not conform to the 10 m open average wind assumption (e.g., wind speed is measured at a different exposure height, the measurement location is sheltered by obstructions such as trees or buildings, or the measurement is averaged over shorter time interval than the 10 min standard), adjustments should be applied [48].
The estimation of a grassfire’s rate of spread using the 20% wind speed rule of thumb involves a straightforward mental calculation. In order to extend the application of the rule of thumb even further, we have provided in Appendix B a table of a grassfire’s R and elliptical fire length-to-breadth (L:B) ratio as a function of U10 [42], in addition to the forward fire spread distance, area burned and perimeter length [54] as a function of elapsed time since ignition (Table A1).
A simple fire spread map can be readily derived from the tabled information in Appendix B through the following steps: (1) estimate R and L:B ratio based on the wind speed; (2) derive the forward fire spread distance from the wind speed and duration of the run (hours); (3) plot a fire spread direction arrow on a map aligned in the direction of the prevailing wind [24] with the length of the arrow, representing the fire’s forward spread distance; (4) mark the hourly fire spread increments along this line to determine the fire’s expected arrival times at different locations; and finally (5) draw an elliptical shape around the spread vector as a series of ‘nested ellipses’ based on a common origin given the L:B ratio. The resulting map will represent an approximation of the grassfire’s shape and size provided the wind direction remains relatively constant [24].

4.6. Application of the Grassfire Rule of Thumb Outside of Australia

The present analysis was based on wildfire data collected from grasslands in southern Australia. It is pertinent to discuss whether the results obtained here would be applicable to other regions of the world where extreme grassfires are often observed, such as the African savanna regions [25,55,56], the Central Asia grass steppe [57,58] or the North American prairies [11,18,59,60]. This is especially pertinent in countries without an established wildfire behaviour prediction capacity, although it is also relevant to countries with both such a capability as well as an established wildland fire research program.
From a fuel structure perspective, we have not identified any differences that would limit the application of the rule of thumb to just southern Australia grasslands. The variations in grassland fuel structure in the semi-arid, steppe or temperate regions of the world where grassfire outbreaks occur are comparable to the range of grassland fuel conditions found in southern Australia. Grassland fuel types can vary in height from a few centimetres in eaten-out paddocks to about 1–1.5 m tall in undisturbed grasslands after a wet winter. Available fuel quantities in southern Australia grasslands can vary over a range of about 0.05 kg m−2 (in heavily grazed pastures) to around 1 kg m−2 (or 10 t ha−1) in undisturbed sub-tropical and tropical grasslands, although localised areas with higher fuel quantities can be found in areas dominated by invasive species [53,61]. This range in fuel structure is comparable to what is found in grasslands throughout the world over a range of climates [62,63,64,65,66,67].
Given the comparable fuel structures, we believe the 20% rule of thumb would be generally applicable to grasslands in regions outside Australia that are prone to the occurrence of extreme grassfires, as long as the environmental conditions meet the assumptions associated with the rule of thumb as described earlier on (i.e., low fine dead fuel moisture, fully cured landscape and strong winds). It should also be noted that in places with an established fire behaviour prediction capacity, the rule of thumb might yield outputs that differ from those obtained with other fire spread rate prediction models. Figure 6b contrasts the different rate of fire spread prediction trajectories as a function of wind speed for fuel type/fuel models found in Canadian [43,44] and US [45,46] fire behaviour modelling systems. Of these, the US fuel model 3-tall grass [47] is the one that best compares with the 20% rule of thumb.

5. Conclusions

Grass, of one species or another, is the most common fuel type found in Australia, covering nearly three-quarters of the country [8]. Australia’s climate makes it especially prone to the occurrence of extreme fires, often involving multiple starts of anthropogenic origin [68].
The 20% rule of thumb described here offers fire practitioners a means of quickly assessing the spread potential of grassfires burning under heightened fire danger. The simplicity of the rule of thumb allows its application in situations where trained fire behaviour analysts may not be available or do not have enough time to undertake a detailed fire behaviour prediction. We believe the rule of thumb could be easily applied by experienced fire practitioners that may lack the advanced training in conducting detailed fire spread predictions. In this context, we see the rule of thumb as being valuable in places where an established fire behaviour prediction capacity involving fire spread models may be non-existent.
The findings from the present study also have relevance beyond the operational prediction of fire spread. The results of the data analysis show the dominant control that wind speed exerts on fire spread in grassfires under dry fuel conditions (i.e., low fine dead fuel moisture content of cured grasses). The findings could also provide guidance in future fire spread model development and calibration, namely what kind of behaviour should one expect for grassfires burning under heightened fire danger conditions.
A rule of thumb is, by its own definition, a principle with broad application that does not aim to be strictly accurate in every situation [33]. The 20% rule of thumb was derived from a relatively large (n = 58) and diverse dataset of wildfire rate of spread observations and evaluated against the data used in its development. We aim to continue collecting data on wildfires in grasslands in order to continually evaluate the rule of thumb against independent data. We would be interested in hearing from anyone who might have data on wildfire rates of spread in grasslands and associated fuel and weather conditions that could be used for the purpose of evaluating the 20% rule of thumb, particularly for grassland ecosystems outside Australia.

Author Contributions

Conceptualization, M.G.C. and M.E.A.; methodology, M.G.C.; validation, M.G.C.; formal analysis, M.G.C.; investigation, M.G.C. and M.E.A.; resources, M.G.C. and M.E.A.; data curation, M.G.C. and M.K.; writing—original draft preparation, M.G.C. and M.E.A.; writing—review and editing, M.G.C. and M.E.A.; visualization, M.G.C. and M.E.A.; supervision, M.G.C.; project administration, M.G.C.; funding acquisition, M.E.A. All authors have read and agreed to the published version of the manuscript.

Funding

This research received no external funding.

Institutional Review Board Statement

Not applicable.

Informed Consent Statement

Not applicable.

Data Availability Statement

The dataset assembled for the present study is available upon request from the corresponding author provided a proposal for its intended use is included.

Acknowledgments

Thanks to Andrew Sullivan, Todd Lindley and J.D. Carlson for their comments on a draft of this article. The authors would like to gratefully acknowledge the various practitioners and researchers over the years who have made the data available for this study all possible.

Conflicts of Interest

The authors declare no conflict of interest.

Appendix A

Appendix A.1. Calculating the Estimated Fine Dead Fuel Moisture Content in Grasslands

The moisture content of fine dead grass fuels (MC, %) was calculated from an equation developed by [69] describing McArthur’s [36] fuel moisture table:
M C = 9.58 0.205   T + 0.138   R H
where T is air temperature (°C), and RH is relative humidity (%).

Appendix A.2. Calculating the Grassland Fire Danger Index

The Grassland Fire Danger Index (GFDI) was calculated from the parameterization by [37] of the McArthur [19] Mk 3 grassland fire danger meter:
G F D I = 2   exp ( 23.6 + 5.01   ln ( C ) + 0.0281   T 0.226   R H + 0.633   U 10 )
where C is the degree of curing (%), T is the ambient air temperature (°C), RH is the relative humidity (%) and U10 is the 10 m open wind speed (km h−1). The GFDI is “a relative number denoting an evaluation of rate of spread or suppression difficulty for specific combinations of fuel, fuel moisture content and wind speed” [8].

Appendix A.3. Calculating Rate of Fire Spread in Australian Grasslands

Cheney et al. [10] proposed models for predicting the rate of spread of Australian wildfires in undisturbed (Rn, km h−1), grazed or cut (Rcu, km h−1) and eaten-out (Re, km h−1) grassland fuel conditions from an analysis of outdoor experimental fire and wildfire data:
          R n = { ( 0.054 + 0.269   U 10 )   ϕ M   ϕ C                 U 10 < 5   km   h 1   ( 1.4 + 0.838 (   U 10 5 ) 0.844 )   ϕ M   ϕ C               U 10 5   km   h 1
          R c u = { ( 0.054 + 0.209   U 10 )   ϕ M   ϕ C                 U 10 < 5   km   h 1   ( 1.1 + 0.705 (   U 10 5 ) 0.844 )   ϕ M   ϕ C               U 10 5   km   h 1
R e = ( 0.55 + 0.357   (   U 10 5 ) 0.844 )   ϕ M   ϕ C               U 10 5   km   h 1
where U10 is the 10 m open wind speed (km h−1), ϕM is the fuel moisture coefficient and ϕC is the curing coefficient. The fuel moisture coefficient is calculated as follows:
Φ M = { e x p ( 0.108   M C )                                     M C < 12 % 0.684 0.0342   M C                                     M C 12 % ,   U 10 < 10   km   h 1 0.547 0.0228   M C                                     M C 12 % ,   U 10 10   km   h 1
where MC is the fine dead fuel moisture content (% oven-dry weight basis) with application bounds of 2–24%. Model parameterization relied on the use of Equation (A1). The curing coefficient is given as follows [30]:
Φ C = 1.036 1 + 103.99   e x p ( 0.0996 ( C 20 ) )
where C is the degree of grass curing (%) with application bounds of 20% < C < 100%. If C is <20%, fires are assumed not to spread at all.

Appendix B

Table A1. Fire behaviour and elliptical fire characteristics as a function of wind speed and elapsed time based on the 20% rule of thumb for grassfires.
10-m Open Wind Speed (km h−1)
30354045505560657075
Forward Rate of Fire Spread (km h−1)
6789101112131415
Elliptical Fire Length-to-Breadth Ratio
5.35.76.16.46.87.17.47.67.98.2
Forward Fire Spread Distance (km)
Elliptical Fire Area (ha)
Elliptical Fire Perimeter (km)
1 h Since Ignition
6
530
13
7
672
15
8
825
17
9
989
19
10
1162
21
11
1346
23
12
1538
25
13
1739
27
14
1949
28
15
2167
30
2 h Since Ignition
12
2122
25
14
2688
29
16
3301
33
18
3955
37
20
4650
41
22
5383
45
24
6153
49
26
6957
53
28
7796
57
30
8668
61
3 h Since Ignition
18
4774
38
21
6049
44
24
7426
50
27
8899
56
30
10 462
62
33
12 111
68
36
13 843
74
39
15 654
80
42
17 542
85
45
19 503
91
4 h Since Ignition
24
8486
50
28
10 754
58
32
13 202
66
36
15 820
74
40
18 599
82
44
21 531
90
48
24 610
98
52
27 830
106
56
31 185
114
60
34 671
122
5 h Since Ignition
30
13 260
63
35
16 803
73
40
20 628
83
45
24 719
93
50
29 061
103
55
33 643
113
60
38 454
123
65
43 484
133
70
48 727
142
75
54 174
152
6 h Since Ignition
36
19 095
75
42
24 196
87
48
29 705
99
54
35 595
111
60
41 848
123
66
48 446
135
72
55 373
147
78
62 617
159
84
70 167
171
90
78 011
183

References

  1. Neary, D.G.; Leonard, J.M. Effects of fire on grassland soils and water: A review. In Grasses and Grassland Aspects; Kindomihou, V.M., Ed.; Books on Demand: Norderstedt, Germany, 2020; pp. 1–22. Available online: https://www.intechopen.com/books/grasses-and-grassland-aspects/effects-of-fire-on-grassland-soils-and-water-a-review (accessed on 15 March 2022).
  2. Brown, J.K. Ratios of surface area to volume for common fine fuels. For. Sci. 1970, 16, 101–105. [Google Scholar]
  3. Luke, R.H.; McArthur, A.G. Bushfires in Australia; Australian Government Publishing Service: Canberra, Australia, 1978; pp. 1–359.
  4. Sneeuwjagt, R.J.; Frandsen, W.H. Behavior of experimental grass fires vs. predictions based on Rothermel’s fire model. Can. J. For. Res. 1977, 7, 357–367. [Google Scholar] [CrossRef]
  5. Cheney, N.P.; Gould, J.S.; Catchpole, W.R. The influence of fuel, weather and fire shape variables on fire-spread in grasslands. Int. J. Wildland Fire 1993, 3, 31–44. [Google Scholar] [CrossRef]
  6. Cheney, N.P.; Gould, J.S. Fire growth in grassland fuels. Int. J. Wildland Fire 1995, 5, 237–247. [Google Scholar] [CrossRef]
  7. Cheney, N.P.; Gould, J.S. Fire growth and acceleration. Int. J. Wildland Fire 1997, 7, 1–5. [Google Scholar] [CrossRef]
  8. Cheney, P.; Sullivan, A. Grassfires: Fuel, Weather and Fire Behaviour, 2nd ed.; CSIRO Publishing: Collingwood, Australia, 2008; pp. 1–150. [Google Scholar]
  9. Maynes, K.J.; Garvey, M.F. Report on Selected Major Fires in Country Areas of Victoria on 14 January 1985; Country Fire Authority of Victoria: Melbourne, Australia, 1985; pp. 1–36.
  10. Cheney, N.P.; Gould, J.S.; Catchpole, W.R. Prediction of fire spread in grasslands. Int. J. Wildland Fire 1998, 8, 1–13. [Google Scholar] [CrossRef]
  11. Alexander, M.E.; Heathcott, M.J.; Schwanke, R.L. Fire Behaviour Case Study of Two Early Winter Grass Fires in Southern Alberta, 27 November 2011; Partners in Protection: Edmonton, ON, Canada, 2013; pp. 1–76. [Google Scholar]
  12. Burrows, N. Fuels, Weather and Behaviour of the Cascade Fire (Esperance Fire #6), 15–17 November 2015; Department of Parks and Wildlife, Science and Conservation Division: Perth, Australia, 2015; pp. 1–18.
  13. Fernandes, P.M.; Sil, Â.; Ascoli, D.; Cruz, M.G.; Rossa, C.G.; Alexander, M.E. Characterizing fire behavior across the globe. In The Fire Continuum—Preparing for the Future of Wildland Fire, Proceedings of the Fire Continuum Conference, Missoula, MT, USA, 21–24 May 2018; Hood, S., Drury, S., Steelman, T., Steffens, R., Eds.; Proceedings RMRS-P-78; USDA Forest Service, Rocky Mountain Research Station: Fort Collins, CO, USA, 2020; pp. 258–263. [Google Scholar]
  14. Cruz, M.G.; Alexander, M.E.; Fernandes, P.M.; Kilinc, M.; Sil, Â. Evaluating the 10% wind speed rule of thumb for estimating a wildfire’s forward rate of spread against an extensive independent set of observations. Environ. Model. Softw. 2020, 133, 104818. [Google Scholar] [CrossRef]
  15. Noble, J.C. Behaviour of a very fast grassland wildfire on the Riverine Plain of southeastern Australia. Int. J. Wildland Fire 1991, 1, 189–196. [Google Scholar] [CrossRef]
  16. Gould, J.S. Development of Bushfire Spread of the Wangary Fire, 10–11 January 2005, Lower Eyre Peninsula, South Australia; CISRO/Ensis: Canberra, Australia, 2006; pp. 1–42. [Google Scholar]
  17. Browning, B.; Browning, J. The Anderson Creek Fire. Prairie Wings Winter 2016/Spring 2017. 2017, pp. 3–5. Available online: https://www.audubonofkansas.org/prairie-wings.cfm?fx=BJM6XTH2FVQL1B6L (accessed on 10 March 2022).
  18. Lindley, T.T.; Speheger, D.A.; Day, M.A.; Murdoch, G.P.; Smith, B.R.; Nauslar, N.J.; Daily, D.C. Megafires on the Southern Great Plains. J. Operat. Meteorol. 2019, 7, 164–179. [Google Scholar] [CrossRef]
  19. McArthur, A.G. Weather and Grassland Fire Behaviour. In Leaflet 100; Commonwealth of Australia, Department of National Development, Forestry and Timber Bureau: Canberra, Australia, 1966; pp. 1–19. [Google Scholar]
  20. McArthur, A.G.; Cheney, N.P.; Barber, J. The Fires of 12 February 1977 in the Western District of Victoria; CSIRO Division of Forest Research and Country Fire Authority of Victoria: Canberra, Australia; Melbourne, Australia, 1982; pp. 1–73.
  21. Keeves, A.; Douglas, D.R. Forest fires in South Australia on 16 February 1983 and consequent future forest management aims. Aust. For. 1983, 46, 148–162. [Google Scholar] [CrossRef]
  22. Country Fire Authority of Victoria. The Major Fires Originating 16 February 1983; Vaughan Printing Pty. Ltd.: East Kew, Australia, 1983; pp. 1–38. [Google Scholar]
  23. Rawson, R.P.; Billing, P.R.; Duncan, S.F. The 1982–1983 forest fires in Victoria. Aust. For. 1983, 46, 163–172. [Google Scholar] [CrossRef]
  24. Fogarty, L.G.; Alexander, M.E. A Field Guide for Predicting Grassland Fire Potential: Derivation and Use. In Fire Technology Transfer Note 20; Natural Resources Canada; Canadian Forest Service: Ottawa, ON, Canada; Forest Research and National Rural Fire Authority: Rotorua, New Zealand; Wellington, New Zealand, 1999; pp. 1–10. [Google Scholar]
  25. de Ronde, C. Wildland fire–related fatalities in South Africa: A 1994 case study and looking back at the year 2001. In Forest Fire Research and Wildland Fire Safety; Viegas, D.X., Ed.; Millpress: Rotterdam, The Netherlands, 2002; pp. 1–7. [Google Scholar]
  26. Mutch, B.; Keller, P. Case Study: Lives Lost—Lessons Learned. The Victims and Survivors of the 2005–2006 Texas and Oklahoma Wildfires; USDA Forest Service, Wildland Fire Lessons Learned Center: Tucson, AZ, USA, 2010; pp. 1–133.
  27. Cheney, N.P. Bushfire disasters in Australia, 1945–1975. Aust. For. 1976, 39, 245–268. [Google Scholar] [CrossRef]
  28. Finocchiaro, N.; Lindforth, D.J.; Shields, D.T. Report on the Meteorological Aspects of the Extensive Grassfires in Victoria on 8 January 1969. In Working Paper 127; Commonwealth of Australia, Department of Interior, Bureau of Meteorology: Melbourne, Australia, 1970; pp. 1–17. [Google Scholar]
  29. Scott, A.C.; Bowman, D.M.J.S.; Bond, W.J.; Pyne, S.J.; Alexander, M.E. Fire on Earth: An Introduction; Wiley-Blackwell: Chichester, UK, 2014; pp. 1–413. [Google Scholar]
  30. Cruz, M.G.; Gould, J.S.; Alexander, M.E.; Sullivan, A.L.; McCaw, W.L.; Matthews, S. A Guide to Rate of Fire Spread Models for Australian Vegetation, Revised ed.; CSIRO Land and Water Flagship and AFAC: Canberra, Australia; Melbourne, Australia, 2015; pp. 1–125.
  31. Neale, T.; Vergani, M.; Begg, C.; Kilinc, M.; Wouters, M.; Harris, S. ‘Any prediction is better than none’? A study of the perceptions of fire behaviour analysis users in Australia. Int. J. Wildland Fire 2021, 30, 946–953. [Google Scholar] [CrossRef]
  32. Cova, T.J.; Li, D.; Siebeneck, L.K.; Drews, F.A. Toward simulating dire wildfire scenarios. Nat. Hazards Rev. 2021, 22, 06021003. [Google Scholar] [CrossRef]
  33. Cruz, M.G.; Alexander, M.E. The 10% wind speed rule of thumb for estimating a wildfire’s forward rate of spread in forests and shrublands. Ann. For. Sci. 2019, 76, 44. [Google Scholar] [CrossRef] [Green Version]
  34. Harris, S.; Anderson, W.; Kilinc, M.; Fogarty, L. Establishing a Link Between the Power of Fire and Community Loss: The First Step Towards Developing a Bushfire Severity Scale. In Report 89; Victorian Government, Department of Sustainability and Environment: Melbourne, Australia, 2011; pp. 1–75. [Google Scholar]
  35. Kilinc, M.; Anderson, W.; Price, B. The Applicability of Bushfire Behaviour Models in Australia. In Technical Report 1; DSE Schedule 5: Fire Severity Rating Project; Victorian Government, Department of Sustainability and Environment: Melbourne, Australia, 2012; pp. 1–60. [Google Scholar]
  36. McArthur, A.G. Fire Danger Rating Tables for Annual Grasslands; Commonwealth of Australia, Department of National Development, Forestry and Timber Bureau: Canberra, Australia, 1960; pp. 1–15.
  37. Noble, I.R.; Bary, G.A.V.; Gill, A.M. McArthur’s fire danger meters expressed as equations. Aust. J. Ecol. 1980, 5, 201–203. [Google Scholar] [CrossRef]
  38. Willmott, C.J. Comments on the evaluation of model performance. Bull. Am. Meteor. Soc. 1982, 63, 1309–1313. [Google Scholar] [CrossRef] [Green Version]
  39. Mayer, D.G.; Butler, D.G. Statistical validation. Ecol. Model. 1993, 68, 21–32. [Google Scholar] [CrossRef]
  40. Cruz, M.G.; Alexander, M.E. Uncertainty associated with model predictions of surface and crown fire rates of spread. Environ. Model. Softw. 2013, 47, 16–28. [Google Scholar] [CrossRef]
  41. R Core Team. R: A Language and Environment for Statistical Computing; R Foundation for Statistical Computing: Vienna, Austria, 2021; Available online: https://www.R-project.org/ (accessed on 15 March 2022).
  42. Cheney, N.P. Fire behaviour. In Fire and the Australian Biota; Gill, A.M., Groves, R.H., Noble, I.R., Eds.; Australian Academy of Science: Canberra, Australia, 1981; pp. 151–175. [Google Scholar]
  43. Forestry Canada Fire Danger Group. Development and Structure of the Canadian Forest Fire Behavior Prediction System. In Information Report; ST-X-3; Forestry Canada, Science and Sustainable Development Directorate: Ottawa, ON, Canada, 1992; pp. 1–63. [Google Scholar]
  44. Wotton, B.M.; Alexander, M.E.; Taylor, S.W. Updates and Revisions to the 1992 Canadian Forest Fire Behavior Prediction System. In Information Report; GLC-X-10E; Natural Resources Canada, Canadian Forest Service, Great Lakes Forestry Centre: Sault Ste. Marie, ON, Canada, 2009; pp. 1–45. [Google Scholar]
  45. Rothermel, R.C. A Mathematical Model for Predicting Fire Spread in Wildland Fuels. In Research Paper; INT-115; USDA Forest Service, Intermountain Forest and Range Experiment Station: Ogden, UT, USA, 1972; pp. 1–40. [Google Scholar]
  46. Andrews, P.L. Current status and future needs of the BehavePlus Fire Modeling System. Int. J. Wildland Fire 2014, 23, 21–33. [Google Scholar] [CrossRef] [Green Version]
  47. Anderson, H.E. Aids to Determining Fuel Models for Estimating Fire Behavior. In General Technical Report; INT-122; USDA Forest Service, Intermountain Forest and Range Experiment Station: Ogden, UT, USA, 1982; pp. 1–22. [Google Scholar]
  48. Andrews, P.L. Modeling Wind Adjustment Factor and Midflame Wind Speed for Rothermel’s Surface Fire Spread Model. In General Technical Report; RMRS-GTR-266; USDA Forest Service, Rocky Mountain Research Station: Fort Collins, CO, USA, 2012; pp. 1–39. [Google Scholar]
  49. Taylor, S.W.; Wotton, B.M.; Alexander, M.E.; Dalrymple, G.N. Variation in wind and crown fire behaviour in a northern jack pine—black spruce forest. Can. J. For. Res. 2004, 34, 1561–1576. [Google Scholar] [CrossRef]
  50. Cruz, M.G.; McCaw, W.L.; Anderson, W.R.; Gould, J.S. Fire behaviour modelling in semi-arid mallee-heath shrublands of southern Australia. Environ. Model. Softw. 2013, 40, 21–34. [Google Scholar] [CrossRef]
  51. Wilson, A.A.G. Width of firebreak that is necessary to stop grassfires: Some field experiments. Can. J. For. Res. 1988, 18, 682–687. [Google Scholar] [CrossRef]
  52. Douglas, D.R. Minimum needs for effective suppression of grass fires. Aust. For. Res. 1966, 2, 54–57. [Google Scholar]
  53. Cruz, M.G.; Sullivan, A.L.; Gould, J.S.; Hurley, R.J.; Plucinski, M.P. Got to burn to learn: The effect of fuel load on grassland fire behaviour and its management implications. Int. J. Wildland Fire 2018, 27, 727–741. [Google Scholar] [CrossRef]
  54. Van Wagner, C.E. A simple fire-growth model. For. Chron. 1969, 45, 103–104. [Google Scholar] [CrossRef] [Green Version]
  55. Mojeremane, W. Wildland fires in Botswana. Fire Manag. Today 2004, 64, 34–36. [Google Scholar]
  56. Cahoon, D.R.; Stocks, B.J.; Levine, J.S.; Cofer, W.R.; O’Neill, K.P. Seasonal distribution of African savanna fires. Nature 1992, 359, 812–815. [Google Scholar] [CrossRef]
  57. Stocks, B.J.; Jin, J.-Z. The China fire of 1987: Extremes in fire weather and behavior. In Fire Management in a Climate of Change, Proceedings of the Annual Meeting of the Northwest Fire Council, Victoria, BC, Canada, 14–15 November 1988; Lawson, B.D., Hawkes, B.C., Dalrymple, G.N., Eds.; Northwest Fire Council: Victoria, ON, Canada, 1989; pp. 67–79. [Google Scholar]
  58. Na, L.; Zhang, J.; Bao, Y.; Bao, Y.; Na, R.; Tong, S.; Si, A. Himawari-8 satellite based dynamic monitoring of grassland fire in China-Mongolia border regions. Sensors 2018, 18, 276. [Google Scholar] [CrossRef] [Green Version]
  59. Courtwright, J. Prairie Fire: A Great Plains History; University Press of Kansas: Lawrence, KS, USA, 2011; pp. 1–274. [Google Scholar]
  60. Pyne, S.J. The Great Plains: A Fire Survey; University of Arizona Press: Tucson, AZ, USA, 2017; pp. 1–215. [Google Scholar]
  61. Setterfield, S.A.; Rossiter-Rachor, N.; Douglas, M.M.; McMaster, D.; Adams, V.; Ferdinands, K. The impacts of Andropogon gayanus (gamba grass) invasion on the fire danger index and fire management at a landscape scale. In Proceedings of 19th Australasian Weeds Conference, Hobart, Australia, 1–4 September 2014; Baker, M., Ed.; Tasmanian Weed Society: Hobart, Australia, 2014; pp. 125–128. [Google Scholar]
  62. Trollope, W.S.W.; Potgieter, A.L.F. Estimating grass fuel loads with a disc pasture meter in the Kruger National Park. J. Grassl. Soc. S. Afr. 1986, 3, 148–152. [Google Scholar] [CrossRef]
  63. van Wilgen, B.W.; Wills, A.J. Fire behaviour prediction in savanna vegetation. S. Afr. J. Wildl. Res. 1988, 18, 41–46. [Google Scholar]
  64. Scott, J.H.; Burgan, R.E. Standard Fire Behavior Fuel Models: A Comprehensive Set for Use with Rothermel’s Surface Fire Spread Model. In General Technical Report; RMRS-GTR-153; USDA Forest Service, Rocky Mountain Research Station: Fort Collins, CO, USA, 2005; pp. 1–72. [Google Scholar]
  65. McGranahan, D.A.; Engle, D.M.; Miller, J.R.; Debinski, D.M. An invasive grass increases live fuel proportion and reduces fire spread in a simulated grassland. Ecosystems 2013, 16, 158–169. [Google Scholar] [CrossRef]
  66. Smit, I.P.J.; Archibald, S. Herbivore culling influences spatio-temporal patterns of fire in a semiarid savanna. J. Appl. Ecol. 2018, 56, 711–721. [Google Scholar] [CrossRef]
  67. Kidnie, S.; Wotton, B.M. Characterisation of the fuel and fire environment in southern Ontario’s tallgrass prairie. Int. J. Wildland Fire 2015, 24, 1118–1128. [Google Scholar] [CrossRef]
  68. Miller, C.; Plucinski, M.; Sullivan, A.; Stephenson, A.; Huston, C.; Charman, K.; Prakash, M.; Dunstall, S. Electrically caused wildfires in Victoria, Australia are over-represented when fire danger is elevated. Landsc. Urban Plan. 2017, 167, 267–274. [Google Scholar] [CrossRef]
  69. Cheney, N.P.; Gould, J.S.; Hutchings, P.T. Prediction of Fire Spread in Grasslands; CSIRO National Bushfire Research Unit: Canberra, Australia, 1989; pp. 1–41.
Figure 1. A flattened smoke/convection column and a high elliptical fire length-to-breath ratio [19] are hallmarks of a fast-spreading grassfire driven by strong winds. Aerial oblique photos of (top) the Cascades fire in Western Australia on 17 November 2015 during its 94 km run as viewed from an airliner (photo courtesy of Australian Broadcasting Corporation); (lower left) the Blackford fire in South Australia on 1 November 2021 at 14:31, approximately two hours after ignition; this fire ended up spreading 39 km under the influence of wind speeds averaging 35 km h−1 during a single afternoon burning period (photo by Karen Barnes, South Australia Country Fire Service); and (lower right) the Parker Creek Fire in Texas on 15 December 2021 during a severe wind event (photo courtesy of Texas A&M Forest Service).
Fire 05 00055 g001
Figure 2. Progress map for the Narraweena and Clay Wells fires in southeastern South Australia on Ash Wednesday, 16 February 1983 (from [8] (p. 93) based on [21]).
Fire 05 00055 g002
Figure 3. Plot of the 20% rule of thumb line and ±35% error prediction intervals as per the suggestion of [40] against the observations of rate of spread for the 58 wildfires in grasslands used in the present study analysis. The 10% rule of thumb for forests and shrublands of [33] is plotted for contrasting purposes.
Fire 05 00055 g003
Figure 4. Residuals from the use of the grassfire 20% rule of thumb vs. (a) Open wind speed at 10 m (km h−1), (b) predicted fine dead fuel moisture content (%) and (c) Grassland Fire Danger Index.
Fire 05 00055 g004
Figure 5. Distribution of mean residuals and standard deviation obtained by the Cheney et al. [10] models (black symbols, •) and the 20% rule of thumb (red symbols, ) across a rate of fire spread spectrum for (a) all fires and the three separate grass fuel conditions: (b) undisturbed; (c) grazed or cut; and (d) eaten-out.
Fire 05 00055 g005
Figure 6. Model predictions of rate of fire spread as a function of 10 m open wind speed on level ground for the 20% rule of thumb in contrast to those fire spread models used operationally in Australia and North America and the ±35% error prediction intervals as per [40]. This includes the following: (a) the three grassland fuel condition types (natural, grazed or cut and eaten-out) in southern Australia of [10]; and (b) fuel type O-1b (standing grass) in the Canadian Forest Fire Behavior Prediction (FBP) System [43,44] and the Rothermel [45] model as implemented in the US BehavePlus Fire Modeling System [46] for two of the three grass fuel models (1—short grass (0.3 m); 3—tall grass (0.75 m)) found in [47] based on a wind adjustment factor of 0.4 [48]. Simulations assume a 100% degree of curing and a fine dead fuel moisture content of 3.7% (the average in the database used in the present study analysis).
Fire 05 00055 g006
Table 1. Reliability rating scheme for weather and fire spread observations for wildfire behaviour case study documentation reported in Australian grasslands (after [10]).
RatingWeatherFire Spread
1Nearby meteorological station or direct observation.Direct timing from field measurements by authors.
2Meteorological station within 50 km of the fire site.Reliable timing by a third party.
3Meteorological station > 50 km, reconstruction of wind speed for fire site.Reconstruction based on numerous cross references from third party observations.
4Spot meteorological observations near the fire site.Doubtful reconstruction.
5Distant meteorological observations at locations very different to the fire site.Anecdotal or conflicting reports.
Table 2. Summary of basic statistics for observed rate of fire spread (R), 10 m open wind speed (U10), ambient air temperature (T), relative humidity (RH), estimated fine dead fuel moisture content (MC), Grassland Fire Danger Index (GFDI) and fire run duration for the grassland wildfires analysed in this study.
VariableMean (Standard Deviation)Range
R (km h−1)6.9 (3.6)1.6–17.0
U10 (km h−1)42.1 (9.3)20.0–62.0
T (°C)37.0 (4.5)23.7–43.0
RH (%)12.4 (7.2)3–36
MC (%)3.7 (1.9)1.5–9.6
GFDI101.6 (53.3)30.3–267.1
Fire run duration (h)1.9 (1.3)1.0–5.0
Table 3. Summary of evaluation statistics for predicted rate of fire spread by the 20% rule of thumb for grasslands and the Cheney et al. [10] rate of fire spread models for the three Australian grassland fuel conditions.
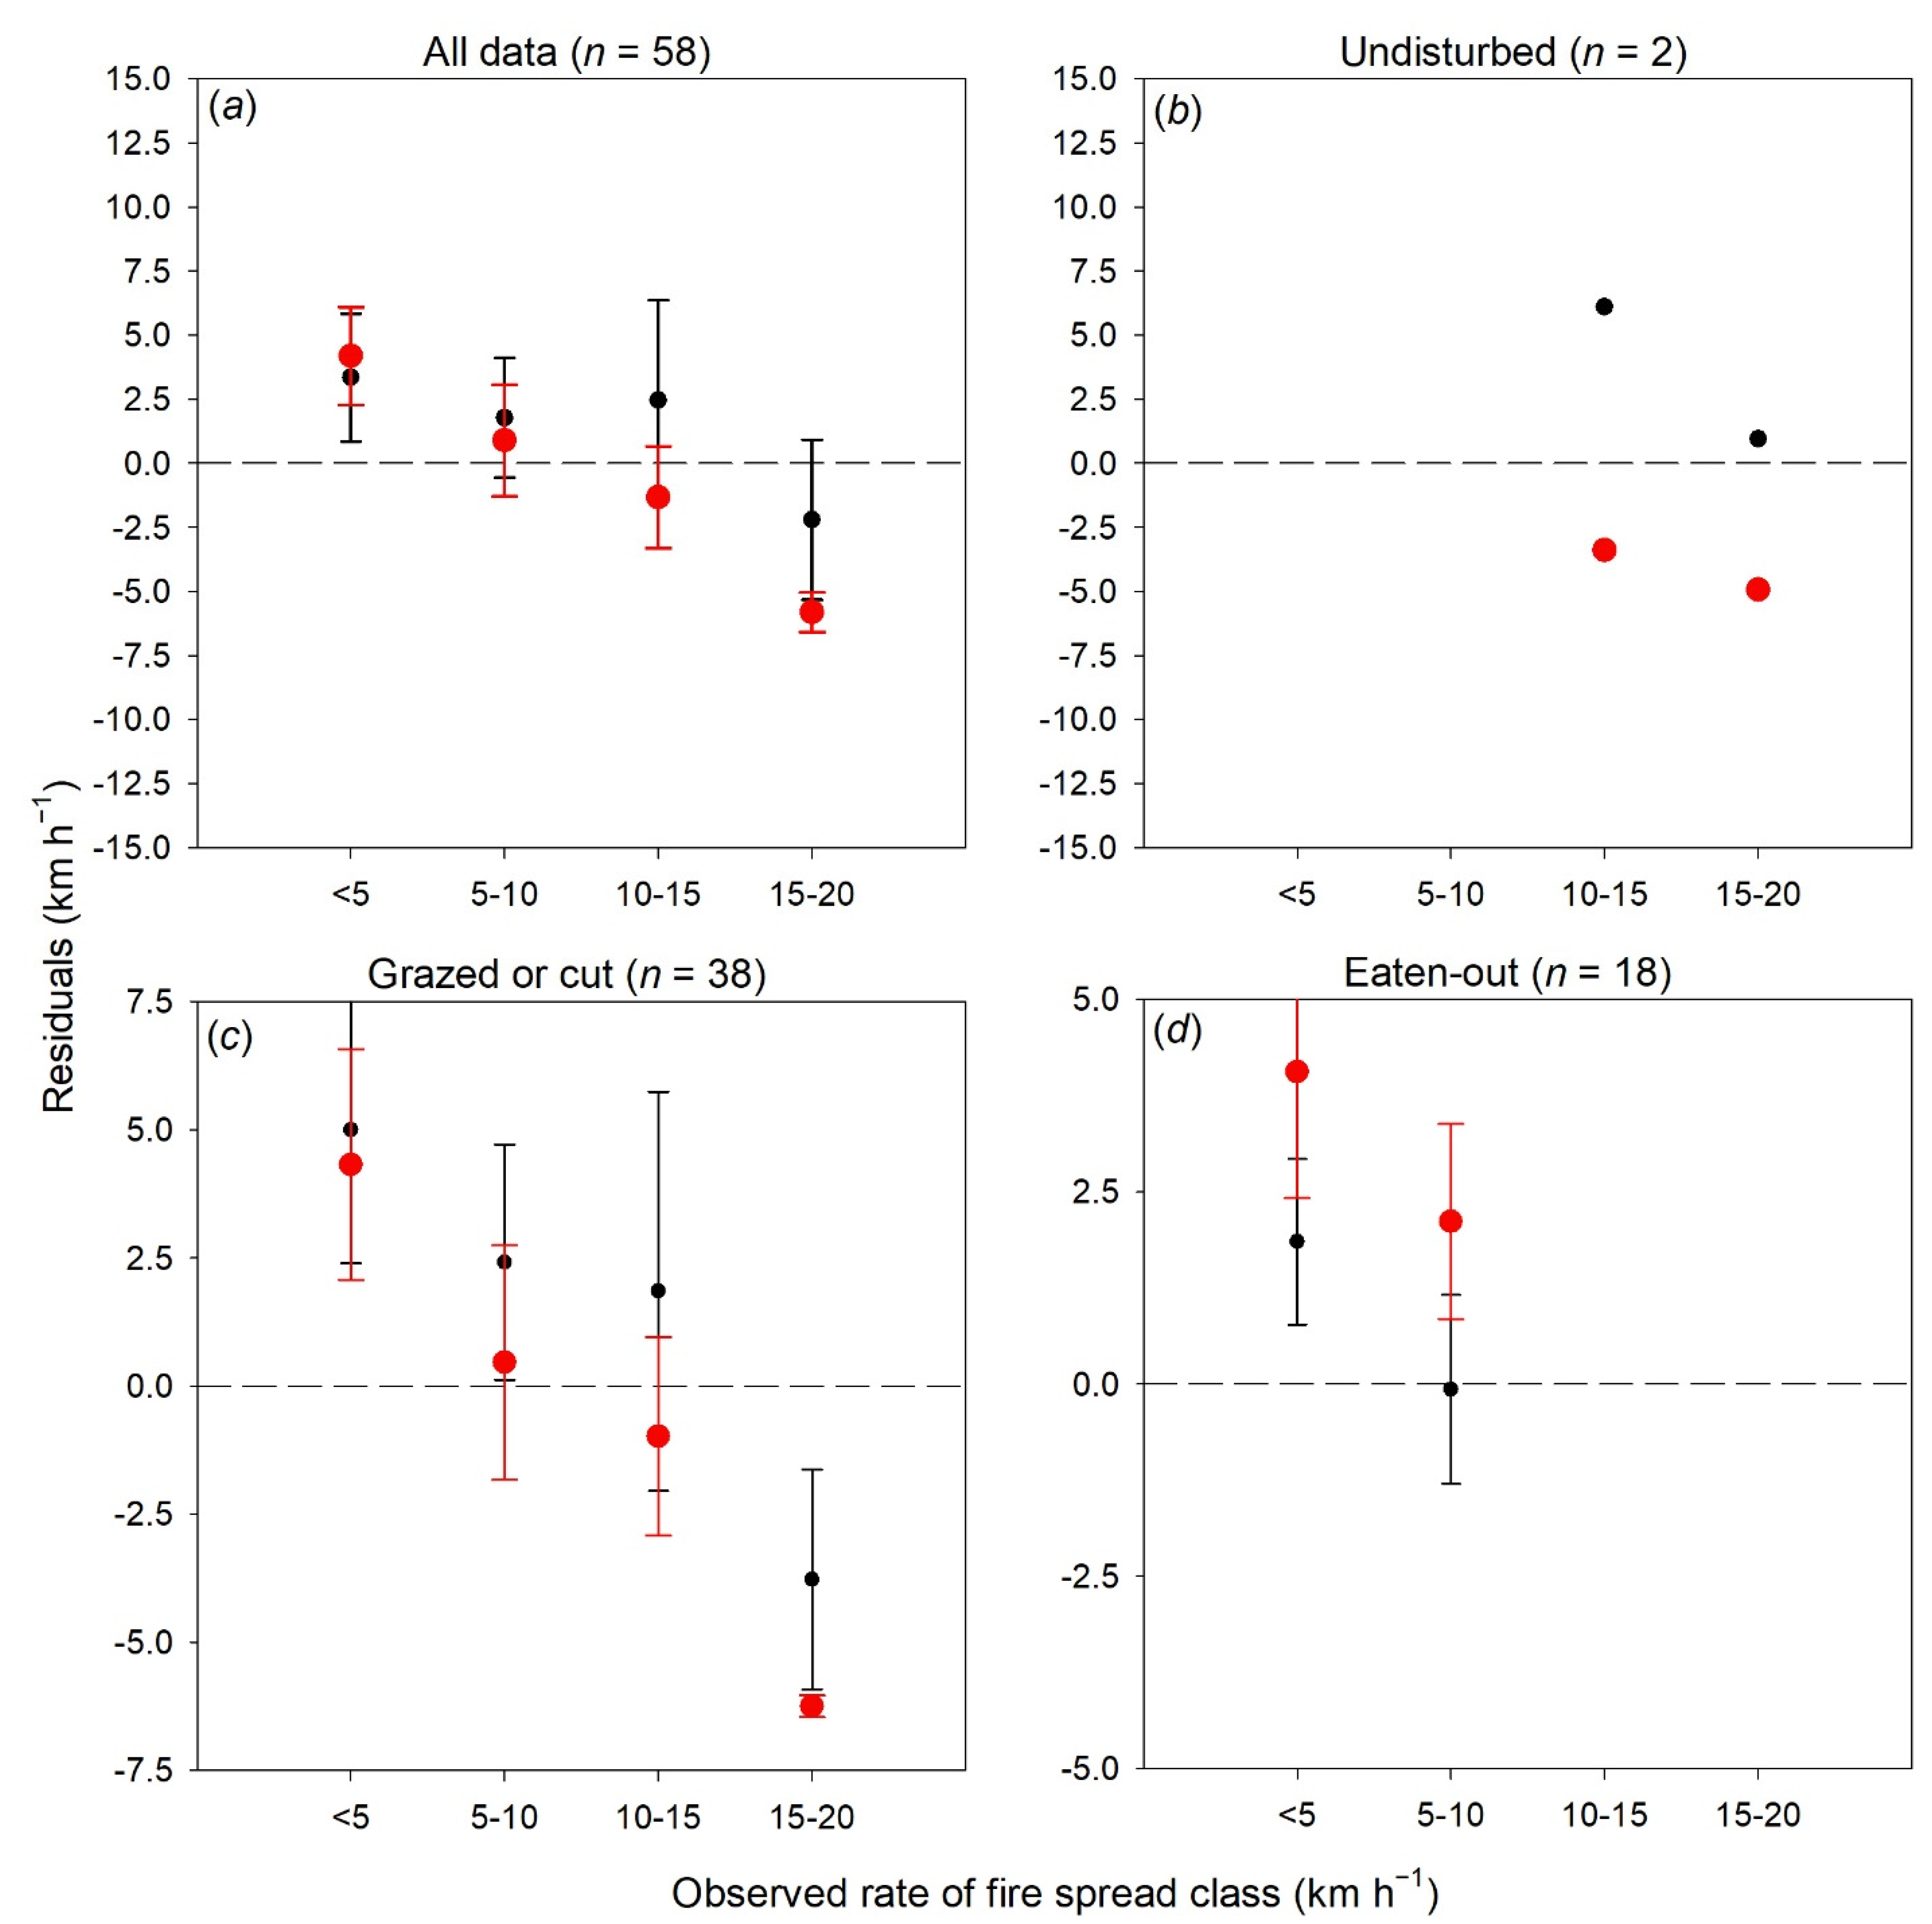
Grassfire Rate of Spread Models by Fuel ConditionMAE
(km h−1)
MAPE
(%)
MBE
(km h−1)
RMSE
(km h−1)
20% Rule of Thumb
All data (n = 58)2.83661.473.53
Undisturbed (n = 2)4.1728−4.174.24
Grazed or cut (n = 38)2.54510.893.39
Eaten-out (n = 18)3.30803.303.72
Cheney et al. [10] Models
All data (n = 58)2.86602.073.67
Undisturbed (n = 2)3.52243.524.36
Grazed or cut (n = 38)3.34742.684.16
Eaten-out (n = 18)1.58361.101.80
Publisher’s Note: MDPI stays neutral with regard to jurisdictional claims in published maps and institutional affiliations.

