Article

Extreme Winds Alter Influence of Fuels and Topography on Megafire Burn Severity in Seasonal Temperate Rainforests under Record Fuel Aridity

1
Department of Environmental Science and Management, Portland State University, Portland, OR 97207, USA
2
Department of Geography, Portland State University, Portland, OR 97207, USA
*
Authors to whom correspondence should be addressed.
Submission received: 15 February 2022 / Revised: 15 March 2022 / Accepted: 17 March 2022 / Published: 22 March 2022

Abstract

:
Nearly 0.8 million hectares of land were burned in the North American Pacific Northwest (PNW) over two weeks under record-breaking fuel aridity and winds during the extraordinary 2020 fire season, representing a rare example of megafires in forests west of the Cascade Mountains. We quantified the relative influence of weather, vegetation, and topography on patterns of high burn severity (>75% tree mortality) among five synchronous megafires in the western Cascade Mountains. Despite the conventional wisdom in climate-limited fire regimes that regional drivers (e.g., extreme aridity, and synoptic winds) overwhelm local controls on vegetation mortality patterns (e.g., vegetation structure and topography), we hypothesized that local controls remain important influences on burn severity patterns in these rugged forested landscapes. To study these influences, we developed remotely sensed fire extent and burn severity maps for two distinct weather periods, thereby isolating the effect of extreme east winds on drivers of burn severity. Our results confirm that wind was the major driver of the 2020 megafires, but also that both vegetation structure and topography significantly affect burn severity patterns even under extreme fuel aridity and winds. Early-seral forests primarily concentrated on private lands, burned more severely than their older and taller counterparts, over the entire megafire event regardless of topography. Meanwhile, mature stands burned severely only under extreme winds and especially on steeper slopes. Although climate change and land-use legacies may prime temperate rainforests to burn more frequently and at higher severities than has been historically observed, our work suggests that future high-severity megafires are only likely to occur during coinciding periods of heat, fuel aridity, and extreme winds.

1. Introduction

Megafires have surged globally [1,2,3] due to increasing and seasonally prolonged aridity [4,5,6,7,8] with extensive impacts on carbon storage, radiative forcing, biodiversity, and ecosystem services (e.g., [9,10,11,12]). Moist temperate forests, where fuels are abundant yet typically too wet to burn, may be particularly sensitive to climate change-mediated increases in aridity [13,14,15,16]. Changes in disturbance patterns within these systems may have disproportionately high ecological and societal impacts given that these forests represent some of the most productive and carbon-dense ecosystems on the planet [17]. Many of the planet’s temperate rainforests experienced megafires between 2016 and 2020 [18], including Eurasia, Patagonia, Southeast Australia, and in the Pacific Northwest [19,20,21,22]. A better understanding of the controls of fire extent and severity in temperate rainforests is therefore critical towards anticipating and adapting to the social and ecological impacts of megafires on a warming planet.
Fire regimes are linked to spatial and temporal variations and timing in biomass, drought, extreme weather, and ignitions. Variability among these factors determines the size and severity of individual fire events and the dynamics of disturbance patches that characterize landscapes over extended periods [20]. Wildfire activity in forests characterized by mild, wet winters, and warm dry summers is marked by long periods of quiescence (>100–300 years) punctuated by episodic and extreme fire events of mixed to high severity [23,24]. Because fuels are abundant, wildfire activity is primarily controlled by changes in flammability linked to both shorter-term weather events and longer-term drought [25,26,27]. Owing to the broad temporal and spatial scale of these weather and climate-related drivers, wildfires tend to burn larger, more severely, and synchronously with other fires in the region exposed to similar fire weather conditions.
The Pacific Northwest (PNW) contains the largest seasonal temperate rainforests in the world [22] and despite only slight increases in the area burned (before 2020), major shifts in future fire activity have been projected [28,29,30,31]. Discerning these trends is difficult owing to the episodic nature of wildfire events [32], the size and severity of these disturbances [33], and striking climatic gradients. Historical reports of megafires in temperate rainforests of Oregon and Washington describe rapid fire growth occurring during periods of low fuel moisture and strong, sustained, downslope mountain, east winds [34,35,36], suggesting that synoptic-scale weather patterns drive fire disturbance in the region [23]. Despite the importance of synoptic-scale drivers (e.g., aridity and wind patterns), land ownership and management may additionally affect fire behavior and burn severity by altering vegetation structure, fuel loads, microclimate, and fuel aridity [37,38]. Burn severity in the PNW has been linked to both vegetation structure and topography [39,40,41], but the relative infrequency of fires in these wet forests has contributed to a long-lasting debate among land managers and policymakers over how harvest and planting affect burn severity [39]. The 2002 Biscuit megafire, which occurred in the warmer and drier forests in SW Oregon, showed that plantations were more likely to experience high burn severity under extreme conditions [39,42], that smaller dimension trees were most affected, and that shrubs had a particularly strong influence on fire effects [40,41]. It is an open question as to how these findings translate to relatively wetter and cooler forests that occur within the central and northern Cascades in western Oregon and that are closer in latitude, temperature, and precipitation to megafires that burned (and reburned) in the first half of the twentieth century [43].
Wildfires in 2020 burned ca. 4.1 M ha across the states of California, Oregon, and Washington, USA, making it the most extensive fire season in the region since Euro-American settlement [23,26,44,45]. Building off the warmest meteorological summer in the Northern Hemisphere and the second driest year on record for the western US, five megafires in western Oregon developed over the US Labor Day (7 September 2020) weekend under extreme east winds caused by early-season arctic air mass that descended across the much of the US and created an extreme temperature/pressure gradient over the Cascade Range [46]. While neither aridity level nor winds were unprecedented, the combined magnitude of both exceeded summer fire-weather conditions observed in more than 100 years [46]. The area burned west of the Cascade Range in Oregon surpassed all areas burned during the previous half-century combined. Numerous lives were lost, thousands of homes were destroyed, hundreds of thousands were under an evacuation advisory, and millions suffered prolonged smoke exposure [47].
The size and severity of the 2020 Labor Day fires were comparable to megafires that occurred in the early twentieth century [34,35,36] (Figure 1B), although spatially-explicit records of vegetation structure and fire effects are extremely limited for these historical disturbance events [26,36,44,48,49]. While the Biscuit megafire of 2002 provided important insights into the relative roles of vegetation structure and topography on canopy damage under variable weather conditions within fuel-rich, mixed-conifer/hardwood forests [39,40,41], that fire occurred in the warmer and drier Klamath Basin of SW Oregon within a climate envelope distinct from that found further north in the western Cascades (Figure 1C). These 2020 megafires, therefore, provide an opportunity to quantify the effects of wind and landscape conditions on severity patterns in mesic conifer-dominated forests closer in latitude, annual precipitation, and temperature to extreme fires observed in the early twentieth century (i.e., in the western hemlock vegetation zone; [50]) and potentially more sensitive to prolonged and drier fire seasons driven by a warming climate.
We developed extent and burn severity maps for the five primary megafires that made up the Labor Day fire event in order to predict, rank, and compare the relative effects of vegetation structure and topography on high burn severity (i.e., >75% tree mortality based on [44]). We leveraged two distinct weather periods (P1 and P2; Figure 1A) to examine how record fuel aridity and extreme winds interacted with fuels and topography to influence the probability of high burn severity across all five megafires combined. P1 occurred during extreme east winds and under extreme aridity (7–9 September); P2 occurred under calm west winds and sustained extreme fuel aridity (10–17 September). Specifically, we examined: (1) how vegetation structure and topography influenced patterns of high burn severity patterns under extreme aridity; (2) whether these relationships changed under extreme winds; (3) how high burn severity was affected by management practices associated with different land ownership. We hypothesized that extreme winds would amplify the role of topography on burn severity during period P1; that vegetation structure would emerge as the strongest predictor of burn severity during P2; that interactions between fuels, topography, and high burn severity would differ between P1 and P2; that management legacies would be become pronounced during period P2 due to the increased importance of vegetation structure on burn severity under mild winds. In quantifying drivers of high burn severity under contrasting extreme weather conditions, this work provides context and a reference for ongoing discussions regarding preparedness, mitigation, and responses to megafires in moist temperate and fuel-rich ecological systems with climate-restricted wildfire regimes (e.g., [51,52]).

2. Materials and Methods

To assess the drivers of high burn severity in these temperate rainforests, we used Boosted Regression Trees (BRT), a machine learning approach (see methods) to evaluate how the probability of high-burn severity varied with regard to vegetation structure and topography and how these relationships changed between the two periods. We examined the effects of 12 explanatory variables on burn severity, including widely used forest structure and topographic drivers of burn severity (e.g., [20,53]). The vegetation structure and topographic variables we examined included stand age and canopy height (i.e., vegetation structure; [23,54]), slope and aspect (i.e., topography; [23]), and topographic indices of microclimatic fuel aridity (i.e., indices of topographic wetness and heat load [55,56,57]). All data were aggregated to 90 m raster grid based on their nearest neighbor to reduce the processing time and account for broader-scale patterns in topography and vegetation structure.
Wildfire severity was estimated using Google Earth Engine based on surface reflectance captured by the Copernicus Sentinel-2 satellite on 1 September 2020 (pre) and 2 October 2020 (post; https://developers.google.com/earth-engine/dataset, accessed on 1 December 2020). We calculated burn severity as the relativized differenced normalized burn ratio (RdNBR; [58,59]) and defined high severity as a binary response variable based on thresholds derived from field observations (>75% tree mortality; RdNBR > 0.676, [44]). We also examined burn severity derived from dNBR in addition to running both RdNBR and dNBR as continuous variables but found that the modeled response remained similar.
Forest structure variables included stand age, canopy height, and canopy cover, which were extracted from national-scale LANDFIRE 2.0 remap data (circa 2016; [60]) and PNW regional-scale LEMMA GNN data (circa 2012; [61]). To account for potential changes in forest structure post-2012, we used annual forest loss data reported in [62] to update the LEMMA forest age variable to 2020 conditions (i.e., in severely disturbed forests, age was set back to zero in the year a disturbance occurred).
Topographic variables included elevation, slope, aspect, heat load index (HLI), topographic wetness index (TWI), and topographic position index (TPI). All topographic variables and indexes were calculated from a 90 m digital elevation model obtained from LANDFIRE. Topographic indices (e.g., HLI, TWI, and TPI) are correlated with forest structure legacies in the Cascades [56] and were included to account for topographic effects on microclimate and fuel moisture [63]. HLI is related to evapotranspiration potential, or the relative dryness/wetness of a location based on annual incident solar radiation [64]. TWI approximates the effect of topography on runoff accumulation, and therefore moisture availability to vegetation [65]. TPI describes the relative elevation of each location in a landscape relative to its neighbors and therefore describes local ridges, depressions, slopes, and flats.
We assigned burned areas to P1 or P2 based on the first day of fire activity detected by Suomi NPP satellite’s 375 m VIIRS sensor (i.e., 7–9 September extreme winds and fuel aridity event vs. 10–17 September mild winds and extreme fuel aridity; refer to blue and red bars in Figure 1A). These periods act as proxies for the multitude of meteorological conditions that have been previously explored [45,46], including the shift in wind direction from east to west, decrease in wind speed from extreme to mild, and changes in relative humidity related to adiabatic warming of eastern winds during P1 and a temperature inversion during P2.
We masked some areas within fire perimeters given the focus of this study on upland forests in the western Cascades. This removed 14.6% of the area within the selected fire perimeters (Table S1), including (1) land ownership that was not Forest Service, Bureau of Land Management, state, or private (10.9%), (2) areas not classified as upland forest or woodland (2.9%), (3) areas east of the Cascade crest divide (4.3%), and (4) lands that had experienced forest loss after 2016 from the study (5.8%). Land within fire perimeters where a heat signature was not detected by the VIIRS sensor was also removed (1.6%). After all data filters had been applied, we retained 86% of the total area within all five fire perimeters for analyses.
We modeled high-severity wildfire using logistic boosted regression trees fit within the R software environment using the gbm package [66]. We fit models to several samples: (1) randomly sampled observations, (2) observations equally stratified by weather period, (3) observations from P1 alone, and (4) observations from P2 alone. Because this study examined the differences between weather periods, we focused on the latter three samples. In total, 30% of the data were reserved for testing. Using the 70% of data left for training, one model was built using the entire burn period using the stratified data, and two other models were fit separately under P1 and P2 wind conditions. We relied on the receiver operator characteristic area under the curve (AUC-ROC) from the cross-validation samples across the two burn-weather periods. The AUC of the stratified model using the test data for both periods combined was 0.83, 0.75 for the period 1 model, and 0.85 for the period 2 model (Table S2). Test AUC increased slightly when excluding areas above 1250 m, which only occurred within the Lionshead Fire perimeter when excluding areas above 1250 m (which only occurred within the Lionshead Fire perimeter). The AUC for the entire period was 0.84, 0.75 for P1, and 0.87 for P2.
To examine how the relationship between burn severity, topography, and vegetation structure differed between P1 and P2, we created partial dependence plots for each period and graphed both within the same panel to show differences in patterns of high burn severity between the two periods. To estimate interaction among variables, we modified an approach developed in the R dismo package [67]. A synthetic dataset was created for prediction by generating a sequence of regularly spaced values within the range of each independent variable and then used to predict the likelihood of fire severity. A linear regression model of predicted severity was then created for each pairwise combination of independent variables, where each was treated as a fixed dummy variable. The mean square error was then logged for that variable combination under the assumption that those pairwise combinations with the greatest degree of interaction would have the greatest amount of error. Once all pairwise combinations were processed, mean squared errors were rearranged in descending order, with the resulting list representing the degree of interaction within the model. Finally, we created two-dimensional partial dependence plots using the R pdp package [68], which omitted areas where no observations were made. We examined the interaction on the probability of high-severity fire between all response variable pairs and highlighted those that had the greatest degree of interaction.
We examined ownership separately from the preceding analysis owing to the high correlation between ownership and independent variables used in the BRT model (e.g., ownership, stand age, and stand structure) using a spatial overlay approach [69,70]. Contingency tables were calculated for the observed area burned at high severity by categories of forest structure (canopy height class), land ownership, and burn weather period. Observed burned areas (at high severity) were separately compared with expected areas in each ownership category and canopy height class, which is proportional to the total area burned (i.e., all severities) in each land ownership category and canopy height class, respectively. Our spatial overlays assessed entire populations and not just samples. Thus, all deviations between observed and expected are viewed as real differences between the datasets and statistical tests are not necessary.

3. Results

The five megafires that made up the 2020 Labor Day fires burned 334,000 hectares total between 7 and 16 September 2020, most of which (90%) occurred within the seasonally moist hemlock-Douglas fir forests found west of the Cascade crest. The majority of fire growth (85%, 284,000 ha) occurred during the ca. 72-h period of extreme east winds between 7 and 9 September (P1); the remainder (15%, 50,000 ha) burned between 10 and 16 September when windspeeds subsided, yet fuel aridity remained extreme (P2) (Figure 1 and Figure S1; Table S3). The portion of high burn severity (i.e., areas likely to have >75% tree mortality) was nearly 2.5 times higher during P1 than P2 (58% vs. 25%; Table S4). The extent of high-severity fire differed among the five megafires from 39% to 68% and was inversely correlated with annual total precipitation (Figure 1C) and latitude. Elevation had a significant impact on the predicted likelihood of high fire severity at elevations above 1250 m, especially during P2, although the vast majority of this area (82%) occurred with the Lionshead fire that burned within a substantially colder climatic envelope than the other fires. As a result, we focused primarily on fire effects below 1250 m where the majority of the Labor Day fires occurred.
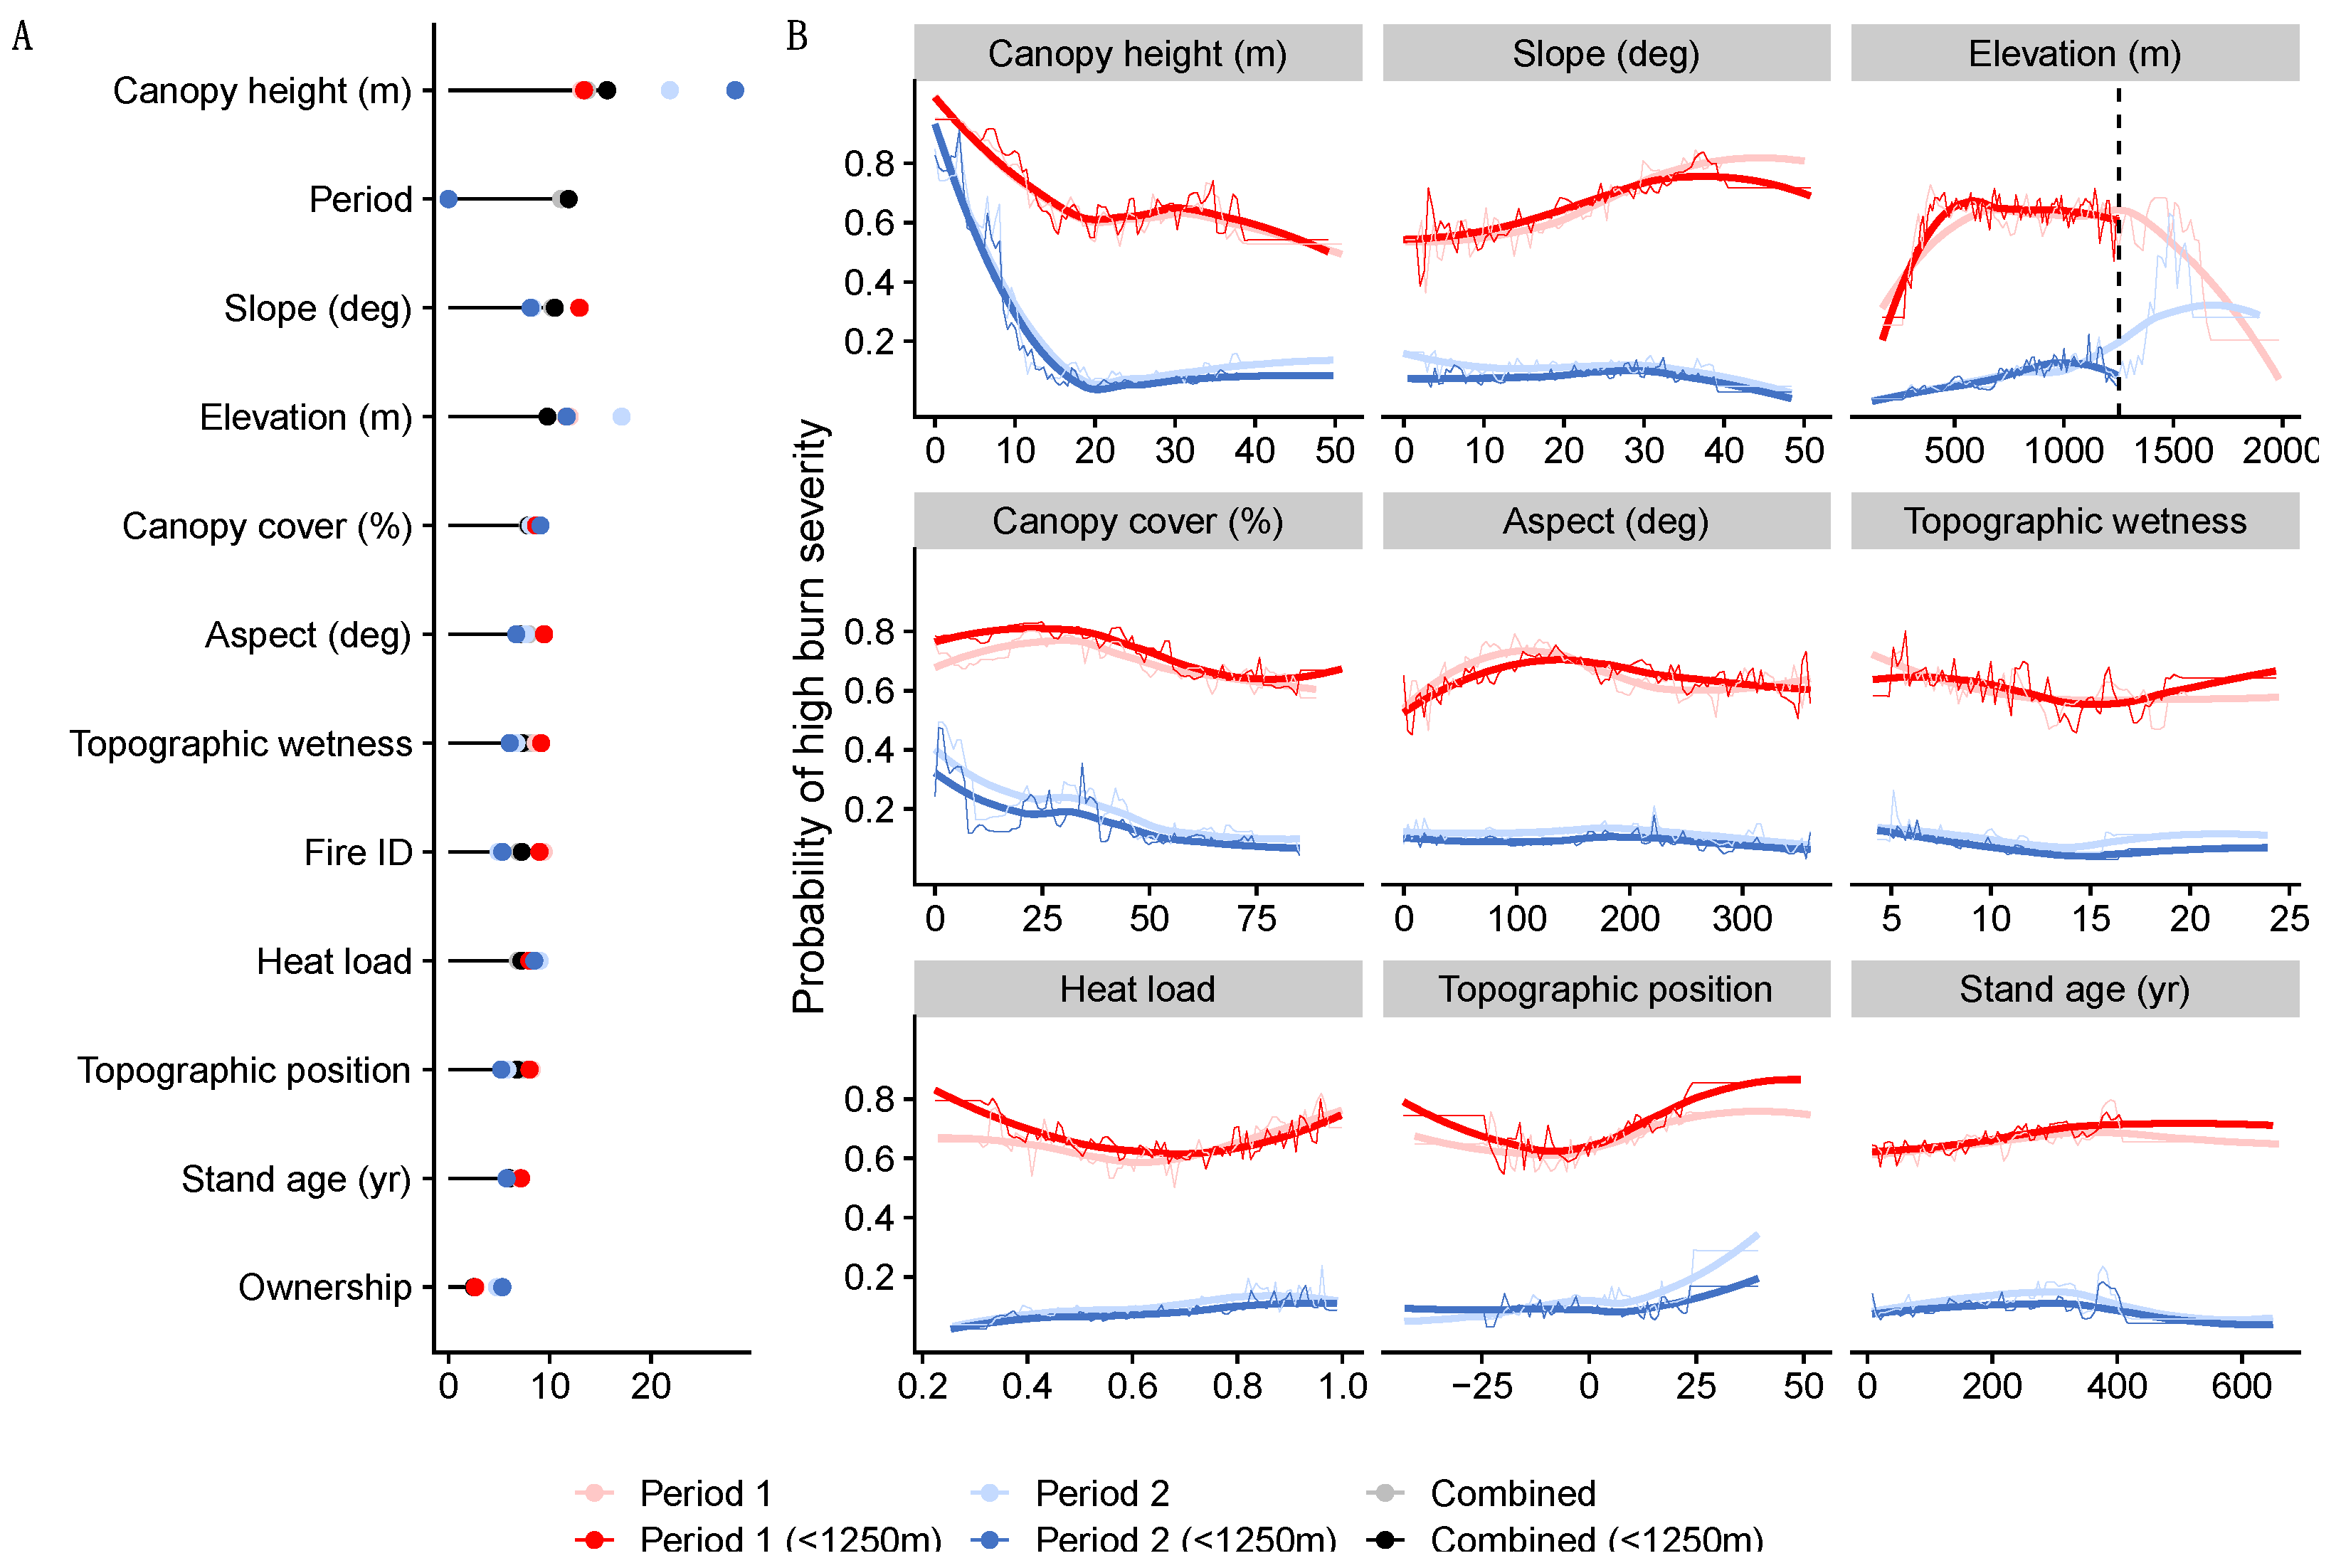
The most important factors explaining high burn severity across all five megafires combined (both burn periods) were canopy height, followed by weather period (i.e., winds), slope, elevation, and canopy cover (%) (Figure 2A; Table S5). While canopy height (m) was the most important factor during both periods (ca. 13.4% and 28%, respectively), topographic effects were substantially more pronounced during P1 (i.e., cumulative ca. 59% of the importance) due to the importance of slope (ca. 13%), followed by elevation (ca. 12%), aspect (ca. 9.5%), and TWI (ca. 9%), while factors associated with vegetation structure factors were less important (i.e., cumulative ca. 29%). By contrast, the effects of topography and vegetation were more similar during P2 (46% and 43%, respectively), where canopy height was again the most important factor (ca. 28%), followed by elevation (ca. 12%), canopy cover (ca. 9%), HLI (8.4%), and slope (ca. 8%).
Vegetation structure (especially canopy height) was the strongest predictor of high burn severity and was strongly related to two important thresholds. First, the likelihood of high burn severity increased markedly in stands shorter than 20 m and was particularly high below 10 m for P1 and especially P2 (Figure 2B). The likelihood of short-stature vegetation (ca. 5 m) burning at high severity compared to 30 m in P1 was ca. 40% higher and 750% higher in P2. Second, open canopy vegetation, especially below 40% cover, was at substantially higher risk of burning at high severity during both periods, and particularly so for P2. Stand age showed a relatively weak association with high burn severity, and although the probability of high-severity burn went up slightly with stand age in P1 and down slightly in P2, the differences were less pronounced than other vegetation structure variables.
Topography had a greater effect on burn severity in P1, with slope having the greatest effect. The probability of high burn severity was ca. 45% higher on slopes greater than 35 degrees compared to flat terrain and was greatest above 500 m in elevation and along east-, south-east, and south-facing slopes. By contrast, the effect of slope and aspect on severity was negligible during P2. During both periods, and for all megafires combined, high burn-severity probability declined substantially below ca. 400 m and over 1500 m, but peaked at ca. 1000 m in elevation during P2. Although more pronounced during P1, high burn severity during both periods was associated with topographic crests and ridges and also with valley bottoms and depressions (as represented by low and high TWI values, respectively). Similarly, the effect of heat load (HLI) and topographic position (TPI) on high-burn severity probability was stronger at both low and high values during P1, mostly representing valley bottoms facing W and steep ridges facing SE and S, respectively.
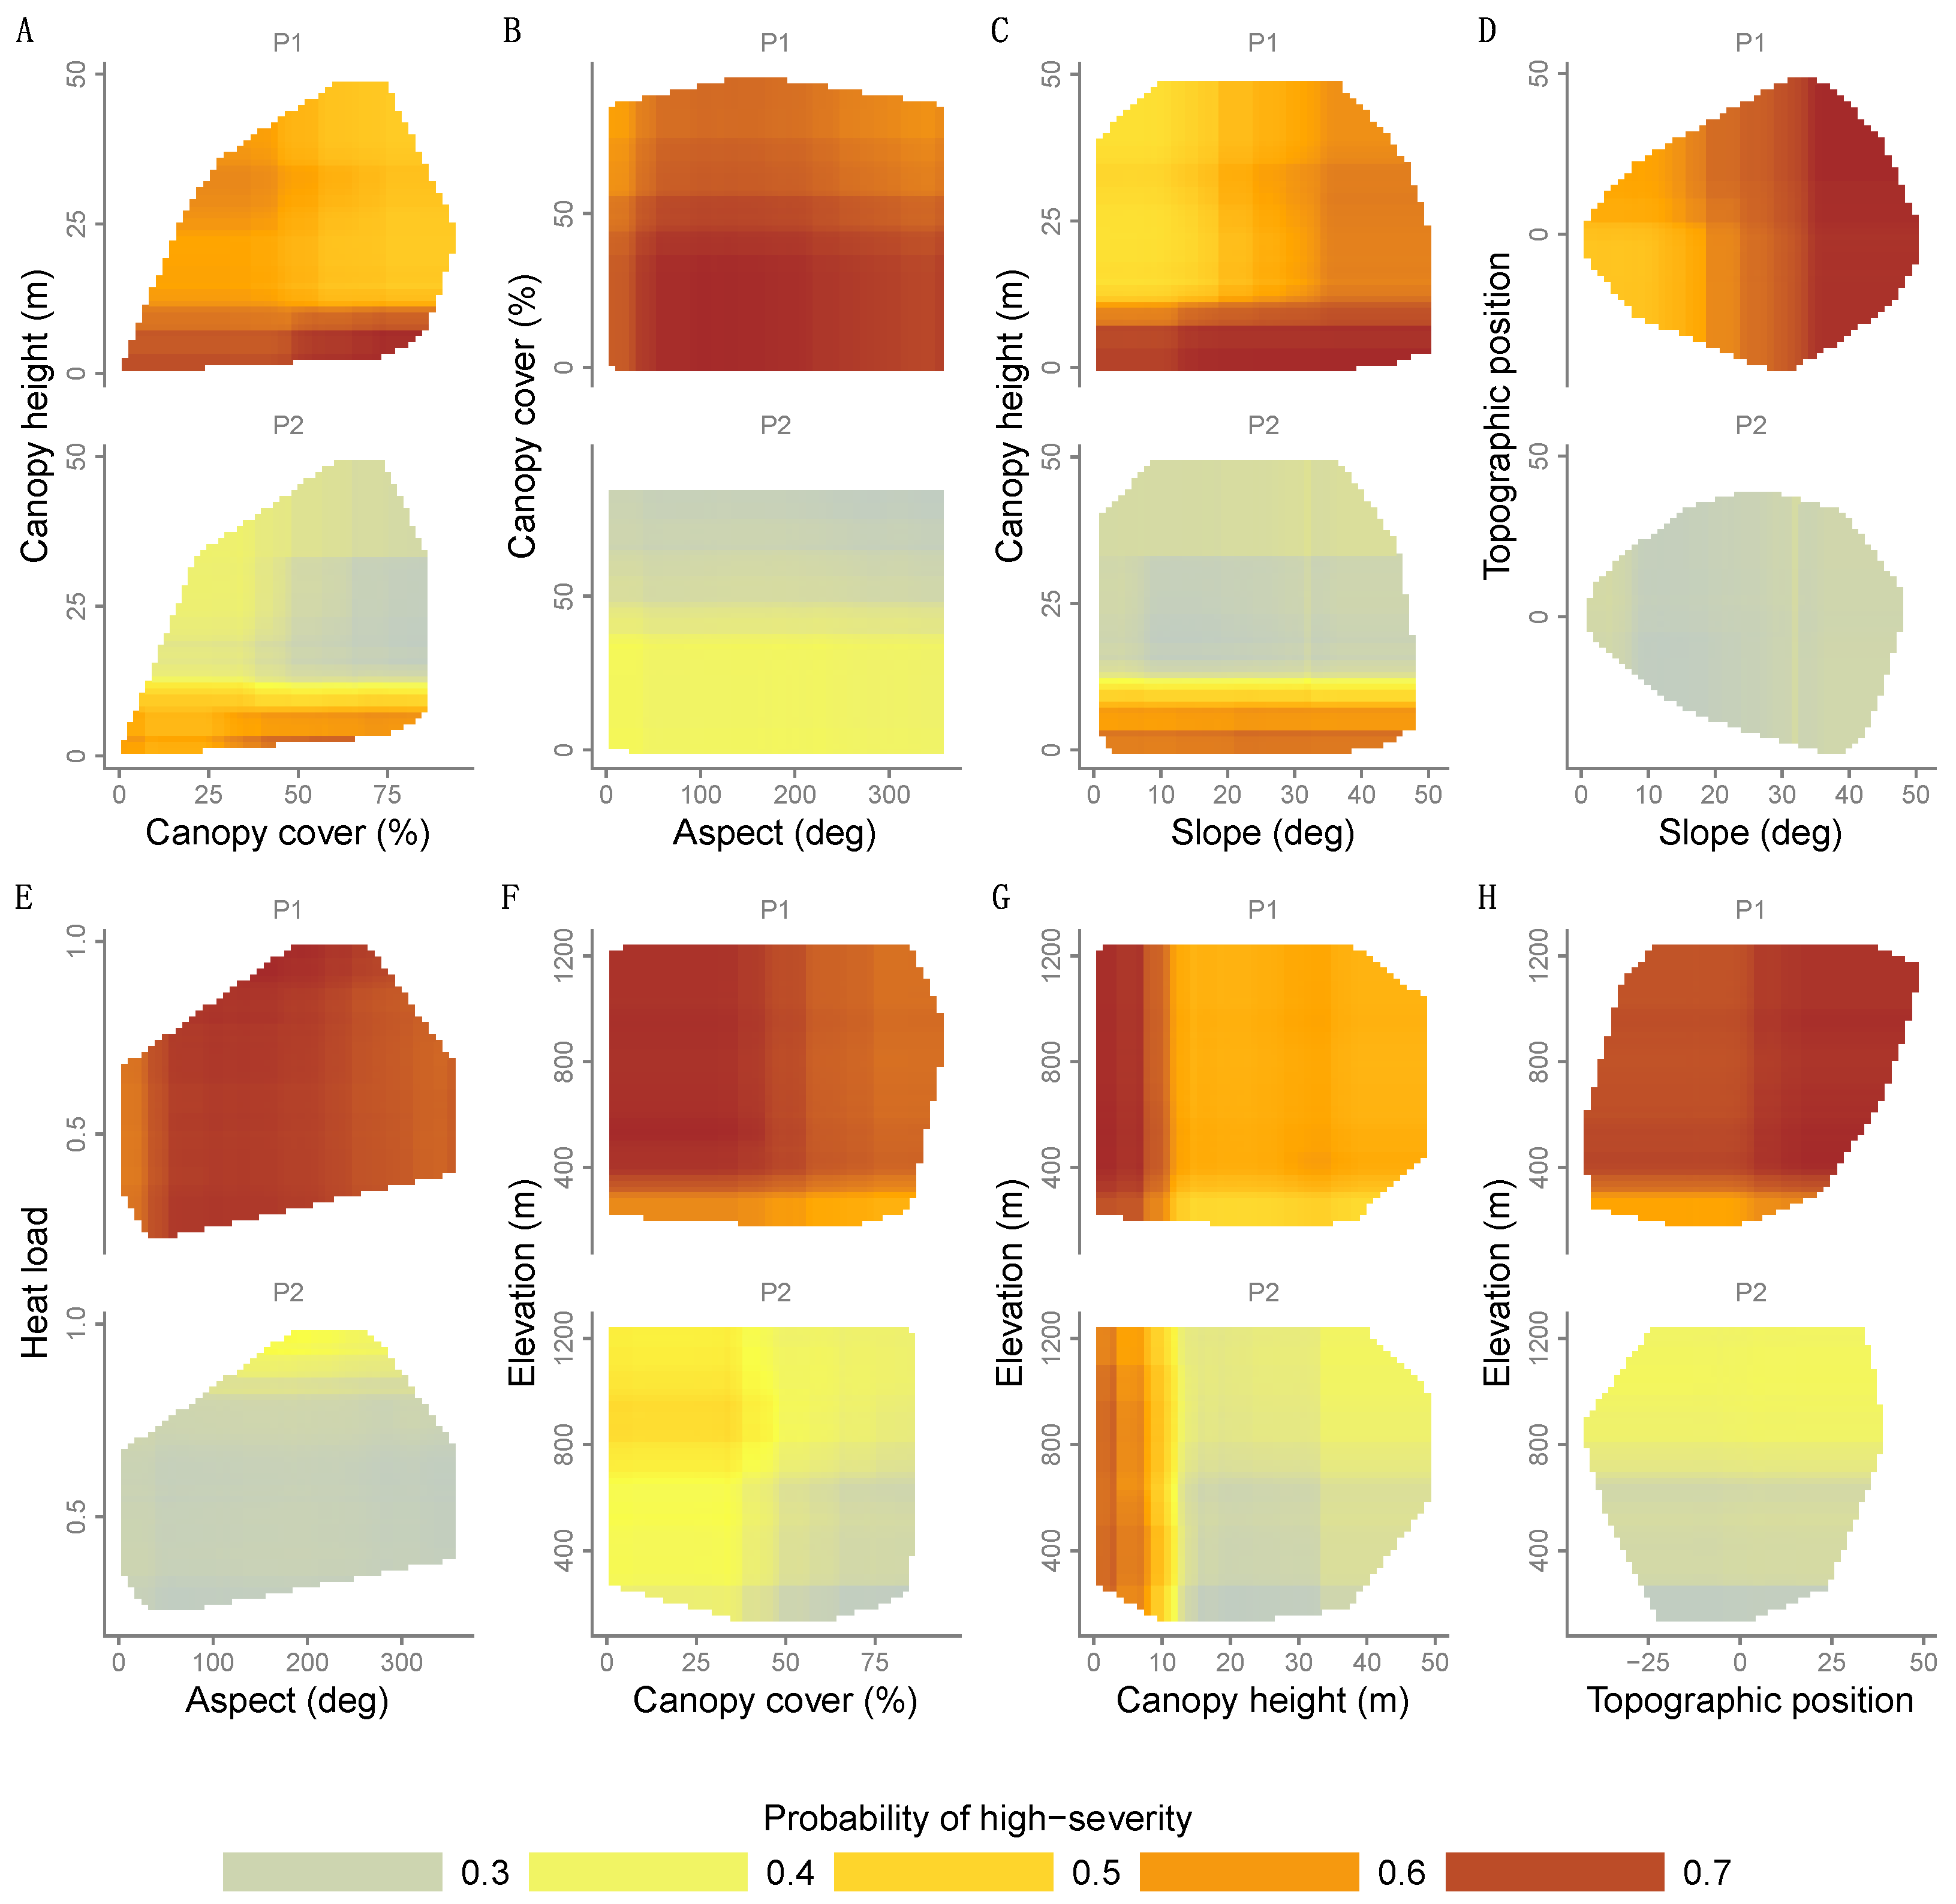
The variables observed with the greatest degree of interactions included weather period, land ownership, canopy height, fire perimeter, elevation, and canopy cover (%). Weather period had the greatest degree of interaction with other variables when examining the entire fire event, supporting our hypothesis that patterns and drivers of burn severity differed substantially between P1 and P2 (Table S6). When controlling for period, fire (e.g., latitude) followed by slope had the greatest degree of interaction with other variables in P1, whereas ownership and elevation had the greatest interaction size in P2. Based on our hypotheses, several variable pairs with the strongest interactions are illustrated in Figure 3. Canopy height and canopy cover had one of the most pronounced interactions both within and across periods, both of which had a notable and compounding effect on severity below specific thresholds (e.g., canopy heights < 10 m; canopy cover < 40%; Figure 3A). These compounding effects were pervasive and had an overriding effect on other variables. For instance, the effect of slope on severity in P1 was overwhelmed in stands lower than 10 m in canopy height (Figure 3C,G). Other interactions show how topography interacted with vegetation structure to increase severity during P1, such as how E-SE aspects amplified the effects of canopy cover (Figure 3B) and ridges (i.e., high topographic position) amplified the effect of slope (Figure 3D). Elevations had an overriding dampening effect on burn severity throughout the entire burn period, although the interactive impact of elevation was particularly pronounced during P2, likely due to the temperature inversion that formed in P2.
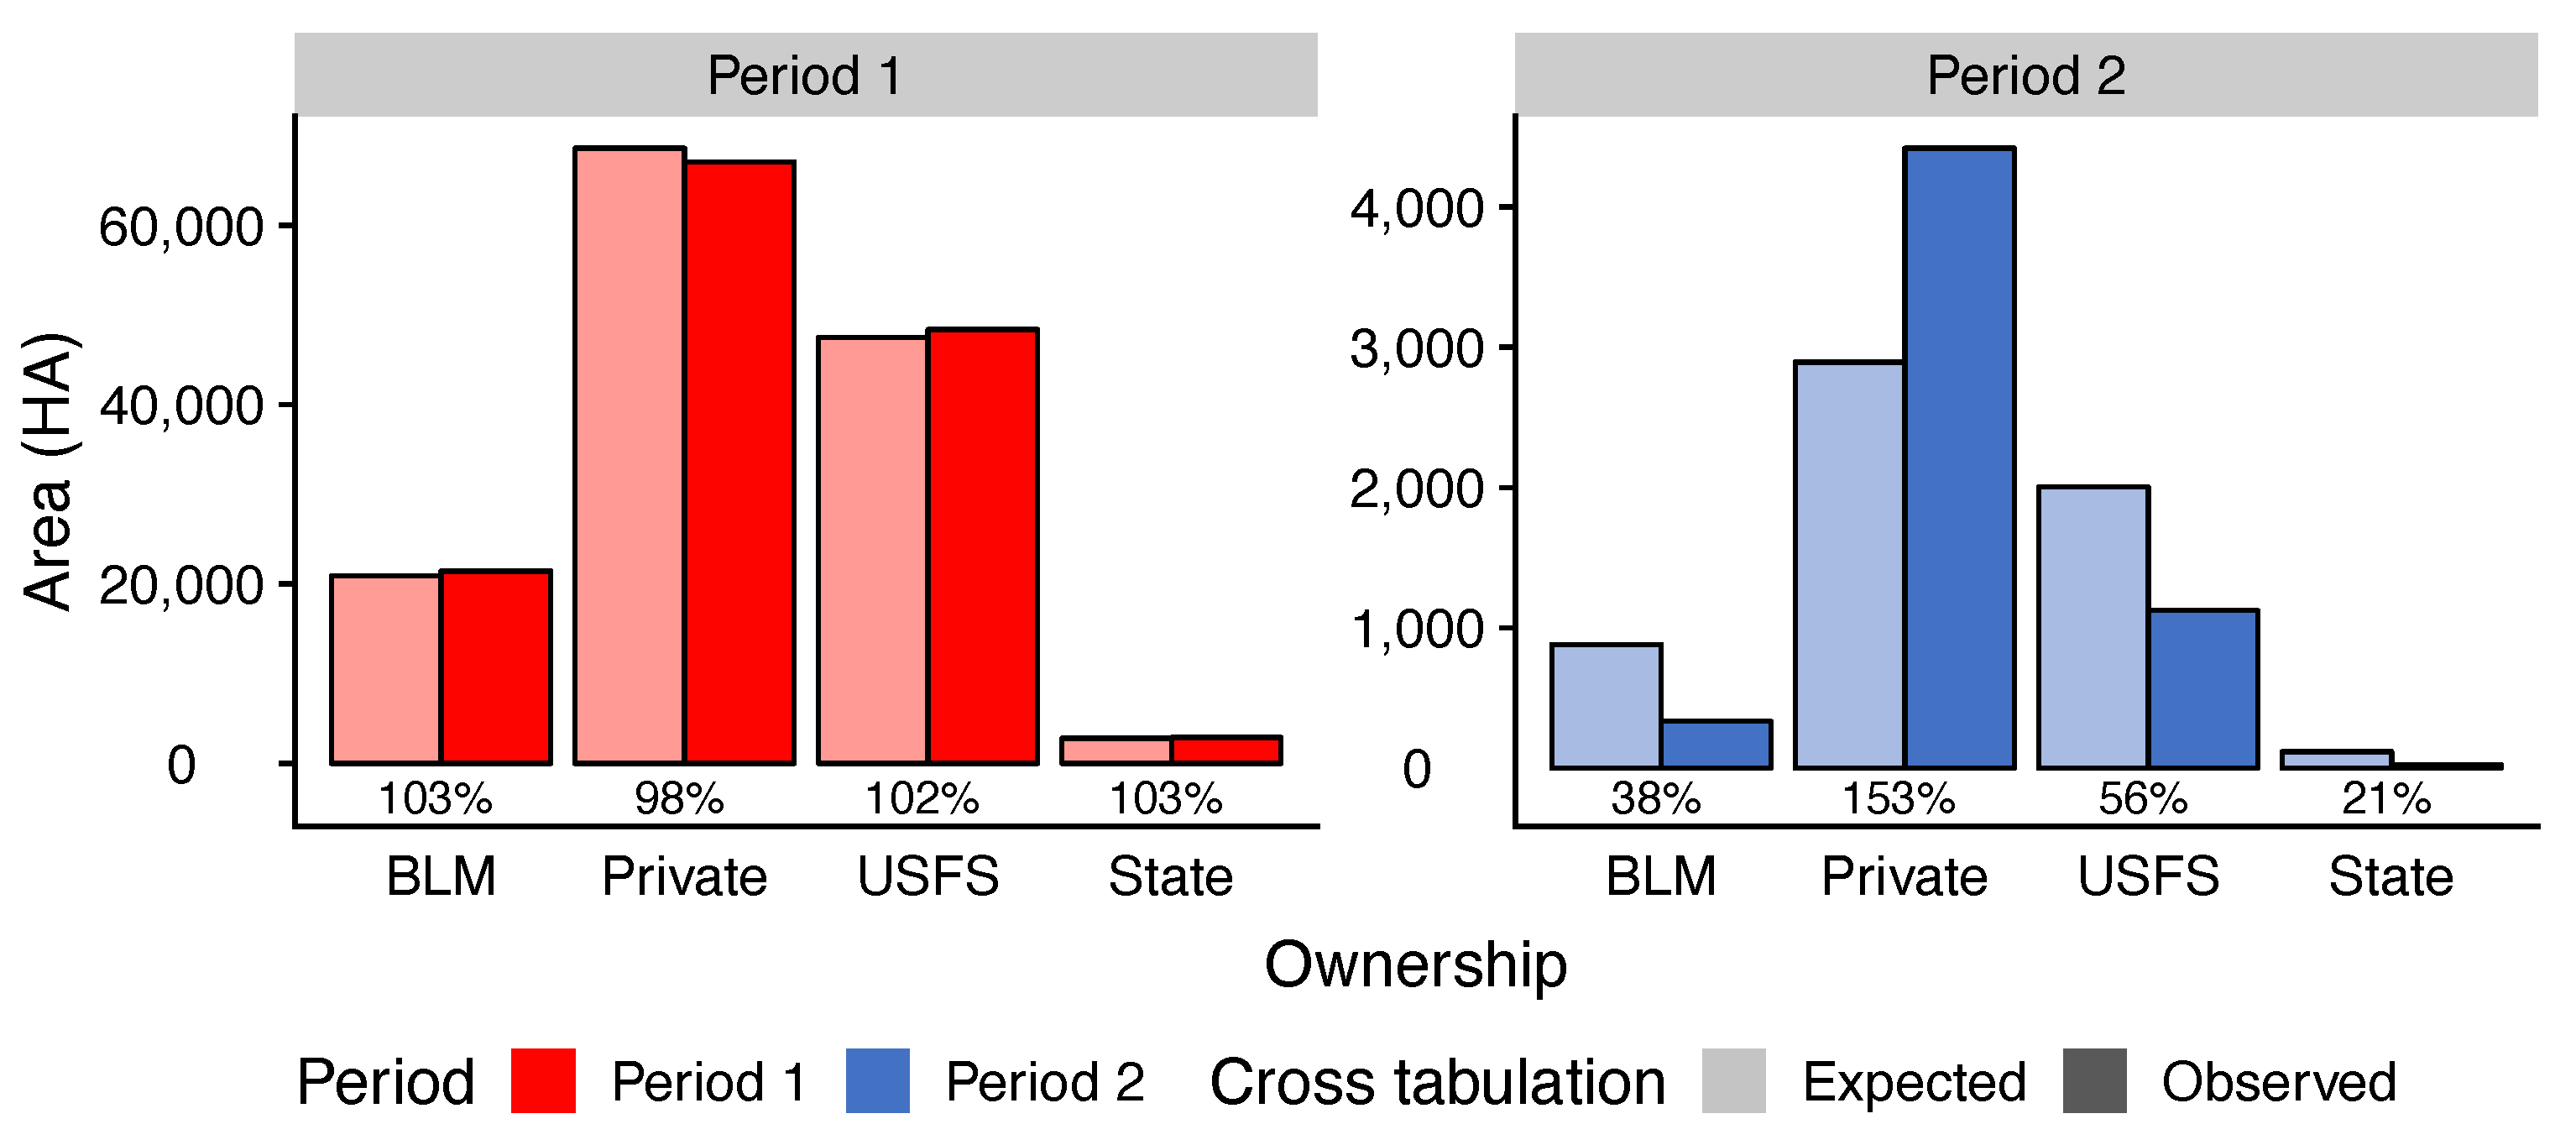
Lastly, we report differences in burn severity patterns among primary land ownerships. One-third of the total area burned occurred on national forest, one-third on private industrial timberland, and the remainder occurred on a mixture of BLM timberlands, state forests, and private non-industrial lands (Table S7). While land ownership ranked lowest as a predictor of high burn severity (Figure 2A), further assessment showed that this lack of effect was due to the strong correlation between land ownership and other independent variables (primarily vegetation structure and secondarily topography). Among the land ownerships affected, private lands experienced the highest proportion of high-severity fire (Table S8). As hypothesized, vegetation structure played a more important role during P2, which drove the greater proportion of severe fire on private industrial forests (83%) compared to public lands (17%). Finally, while the amount of land burned was independent of land ownership during P1, high burn severity extent during P2 was disproportionally higher on private land and lower in BLM and national forests (Figure 4).

4. Discussion

We examined the relative influence of fuels and topography on the probability of high-severity fire among five megafires that occurred in western Oregon during September 2020 under record fuel aridity, and how these drivers changed with the presence of extreme east winds. Our study contributes to the understanding of the relative roles of topography and vegetation on patterns of fire severity in temperate rainforests of the PNW, under climatic and meteorological conditions similar to archetypical megafires that occurred in the mid-nineteenth and early-twentieth centuries. Practically, our findings contribute to active debates about the effects of fuel loads and land management on fire risk, severity, and extent across private and federal lands in the western Cascades of the PNW, especially under a warmer climate, longer fire seasons, and increased aridity. While conceptual frameworks describing the relative influence and roles of topography and vegetation on fire activity have been proposed in drier/warmer ecosystems in North America [71,72] and elsewhere [73,74,75], our study explores the nuances of how these factors interact in biomass-rich, temperate rainforests with historically moderate-to-infrequent fire regimes.
The area burned during the 2020 Labor Day fires represents nearly 10 times the area that burned in the western hemlock vegetation zone of the PNW between 1984 and 2010 [44], yet matches the size of historical [26] and modeled [53] large burns in the region in the early twentieth century. Nearly 60% of the 2020 burn extent occurred at high severity (>75% mortality; Table S3), twice the high-severity proportion observed in all vegetation zones combined and 50% higher than those observed in wet vegetation zones during the 1984–2010 period [44]. The vast majority of the area burned in September 2020 occurred during the ca. 72-h period with extreme east winds and high fuel aridity (P1; Figure 1), which matches weather conditions reported during historic large-scale events [34,35]. By contrast, the fire activity that continued once east winds subsided yet while fuel aridity remained extreme (P2) more closely resembled the extent and proportion of high-severity fire activity observed in this vegetation zone between 1984 and 2010 [44]. As expected, the more erratic burn behavior observed during the very extreme weather in P1 when most high tree mortality occurred meant that P1 models explained slightly more than half the deviance explained during P2 [76].
Inconsistent with hypothesis H1, forest structure (particularly canopy height) was the single most important predictor of high-burn severity during P1, while topography (particularly slope) was second by a very small margin. Instead, and agreeing with H2, vegetation structure was substantially more important than any topographic variable in the absence of extreme wind (Figure 2). Topographical protection provided by canyon bottoms improved as dry, extreme, downward winds from the east subsided (i.e., higher TWI and lower TPI values were buffered from high severity burning during P2). This shift was particularly notable among the southernmost fires, which saw a greater proportion of high-severity fire along south and southwestern slopes compared to the three northern fires (Figure S2; [26,44,77]). The southernmost fires occurred within areas with a warmer bioclimate, a higher proportion of shrubs (e.g., [78]), that had experience more frequent wildfires [26], and were drier at the onset of the 2020 megafires than their northern counterparts [46]. With the drop in wind speeds, slope became even less important than height, canopy cover, and stand age during P2, similar to patterns of high burn severity observed in southern Oregon [40]. The probability of high-severity burn remained elevated for low-stature forests while mature stands were likely protected by thicker bark, shadier conditions [37], increased canopy–base height [79], and lower canopy bulk density [80,81]. Early successional vegetation (<40% canopy cover) burned more severely than closed-canopy forests. Streams and the moist, deep soils of the canyon bottom [20,82,83] lowered the likelihood of high severity fire during P2 but did not buffer the typically wetter, taller, denser, and older trees from high-severity burns during P1. Previous work in the warmer and drier Klamath Basin in SW Oregon also reported a change in the relative importance of drivers of crown fire damage due to weather period, and where stands of small conifers and early successional vegetation (i.e., shrubs) were also disproportionally damaged compared to those of larger conifers and closed-canopy forest [39,41], as open, short-stature stands are warmer and drier [37].
Similar to fires in northern Cascade forests [84], topography interacted with the effects of fuel aridity and the weather period (with vs. without extreme winds) on burn severity as hypothesized (H3). During P1, tree mortality was exacerbated by steep slopes due to increased wind exposure, convective heating, and higher fire ventilation and turbulence [20,82,85]. While high-severity burns were especially likely on E-SE-facing slopes, even protected canyons oriented parallel to the east winds burned at rates of severity greater than those observed during the past half-century [82,86,87]. Steep slopes at mid-to-higher elevations amplified the effects of strong winds and led to extensive mortality in taller and older stands to high-burn severity during P1. The extent of high-severity burns within older stands during P1 supports the understanding that high winds are a key mechanism in the periodic, large-scale conflagrations that shape disturbance regimes in these regions, including wetter and warmer forests burned (and reburned) during the 1902 Yacolt and the 1933 Tillamook fires [88,89,90].
Reburns can drive subsequent fire risk in the region [40] and across the western US [32], which can lead to large-scale vegetation transformation [56,91] and continued community exposure. Early-20th-century megafires reburned multiple times in the decade(s) subsequent to the initial fire (e.g., [92,93]). Shrub and tree regeneration in southern Oregon were found to have a dominant impact on crown damage during subsequent fires, which indicates one mechanism by which subsequent reburns may occur. Accordingly, we expect sustained flammability on burned landscapes and recommend that wildfire managers be particularly alert to reburns in the short- to mid-term future due to growth in early-seral shrubs that dry easily and burn intensely (e.g., [56,93,94]) in densely planted, even-aged plantations that lack thermal buffering and have vertically connected fuels [39]. Importantly, fire behavior observed in P2 shows how open and short-stature vegetation are susceptible to fire even in the absence of extreme winds, thus increasing the likelihood of repeated fire, forest conversion if tree regeneration is limited [95], and continued impact on communities attempting to recover and rebuild from the 2020 burns.
With wildfires becoming larger and more costly [96], managers, planners, and emergency responders in the western Cascades are challenged to better forecast extreme events and improve preparedness ahead of time. The preliminary total cost of the Oregon 2020 Labor Day Fires was estimated at USD 1.15 billion [47]. Given the wind-driven nature of fire spread common to these megafires and the heavy fuel loads of these mesic temperate rainforests that are quick to regrow fuels after fuel reduction treatments, our view is that it is not practical nor scientifically defendable to prevent large conflagrations by mechanically reducing fuels or prescribing fires. That said, our results highlight the role of land management in shaping fire effects under extreme aridity independent of extreme wind events. While different findings may emerge when determining drivers of all severity classes of the 2020 megafires, in general, private industrial lands had less canopy closure and shorter-stature forests, which reduces thermal buffering [97] and increases ground-to-canopy connectivity, thus making young forests particularly susceptible to widespread mortality, i.e., the probability of high-burn severity [42,86,98]. Similar results have been reported in SW Oregon [40,42], as well as in moist forests elsewhere (e.g., [99]). Broad shifts in US industrial forestry have shortened harvest rotations [100,101] which has increased the vulnerability of these forests. Extreme aridity is expected to increase under emerging and novel climate futures, potentially reshaping fire behavior in the region. These findings suggest changes in how forests are managed, particularly in areas closer to urban areas where fires, can have disproportionally high impacts to air quality and water supplies [102]. In contrast to the landscape scale hazardous fuel management promoted within dry forests, management in these mesic, fuel rich forests should focus instead on increasing community preparedness, hardening infrastructure, promoting forests that are more buffered against high-severity fire, and preparing for fire suppression (when weather permits), in addition to other FireWise activities such as wildfire awareness and evacuation planning [103].
Increased fuel aridity under climate change may prime western Cascade forests to burn more frequently and at higher severities than historically observed, at least given trends in aridity observed over the last four decades (e.g., [104]) and especially among early-seral stands [42]. The difference in fire behavior between the two weather periods shows that high-severity megafires that have historically characterized disturbance dynamics within these forests are unlikely to occur without coinciding extreme wind events [46], but also how winds can substantially alter vegetation and topographic effects observed under more mild wind conditions. Although less work has been conducted on extreme summer wind events in the PNW (but see [46]), increases in annual offshore downslope wind activity have been observed in the Cascades during the 1979–2018 period [105], even though it has been projected to decrease elsewhere (e.g., Santa Ana winds in southern California; [106]). Regardless, the 2020 fire season mirrors observed climate-driven trends in increasing area burned across the western US [4,45], and increased fire activity under extremely high fuel aridity has been projected by the mid-21st century for the western Cascades (e.g., [28,30]). Chronically drier fuels will prime temperate rainforests for more frequent fire as a result [103,107,108], which will likely burn at severity levels similar to those observed during P2 (i.e., with open or short-stature stands). However, lengthened fire seasons due to climate change [109] also means that dry conditions will extend further into late summer and early fall [4,110] when dry east winds are more frequent (e.g., [111]), thereby increasing the likelihood of combined winds and aridity that drove the high-severity megafire behavior observed during P1. Addressing megafires under these conditions requires risk mitigation and adaptation approaches different from those pursued in drier forests, with a greater focus on managing human ignitions, suppressing fire (when weather permits), and preparing communities to adapt to and recover from extreme fire events.

Supplementary Materials

The following supporting information can be downloaded at: https://www.mdpi.com/article/10.3390/fire5020041/s1, Figure S1: Map of fire severity; Figure S2: Partial dependence plots for individual fires; Table S1: Percent fire excluded from analysis; Table S2: Boosted regression tree performance; Table S3: Area burned by fire; Table S4: Percent high severity by fire; Table S5: Variable importance; Table S6: Variable interactions; Table S7: Area burned by ownership; Table S8: Severity by ownership; ‘Script_0_func’: R script with analysis and graph functions; ‘Script_1_brt’: boosted regression trees; R script ‘Script_2_plot.R’: graphs and figures; R script ‘Script_3_table.R’: tables. Fire_data_csv.zip: Data used in analysis saved as a csv.

Author Contributions

Conceptualization, C.E., A.H. and S.B.; methodology, C.E.; software, C.E.; validation, C.E.; formal analysis, C.E. and S.B.; investigation, C.E., A.H., S.B. and M.N.-P.; resources, C.E. and M.N.-P.; data curation, C.E.; writing—original draft preparation, C.E., A.H., S.B. and M.N.-P.; writing—review and editing, C.E. and A.H.; visualization, C.E. and S.B.; supervision, A.H.; project administration, A.H.; funding acquisition, C.E., A.H. and M.N.-P. All authors have read and agreed to the published version of the manuscript.

Funding

This research was funded by the National Science Foundation (CNH2L Grant #1922866, GSS Grant #1832483, and LTER8 DEB Grant #2025755) and the US Forest Service Award # 20-JV-11221637-062.

Institutional Review Board Statement

Not applicable.

Informed Consent Statement

Not applicable.

Data Availability Statement

All data are available upon request.

Acknowledgments

We thank Thomas Veblen, Alan Tepley, and Bart Johnson for their assistance in reviewing early versions of this manuscript and providing critical feedback in terms of organization and content. We thank anonymous reviews for critical feedback in subsequent drafts. Publication of this article in an open access journal was funded by the Portland State University Library’s Open Access Fund.

Conflicts of Interest

The authors declare no conflict of interest. The funders had no role in the design of the study; in the collection, analyses, or interpretation of data; in the writing of the manuscript, or in the decision to publish the results.

References

  1. Bowman, D.M.J.S.; Kolden, C.A.; Abatzoglou, J.T.; Johnston, F.H.; Van Der Werf, G.R.; Flannigan, M. Vegetation fires in the Anthropocene. Nat. Rev. Earth Environ. 2020, 1, 500–515. [Google Scholar] [CrossRef]
  2. Cattau, M.E.; Wessman, C.; Mahood, A.; Balch, J.K. Anthropogenic and lightning-started fires are becoming larger and more frequent over a longer season length in the U.S.A. Glob. Ecol. Biogeogr. 2020, 29, 668–681. [Google Scholar] [CrossRef]
  3. Khorshidi, M.S.; Dennison, P.E.; Nikoo, M.R.; AghaKouchak, A.; Luce, C.H.; Sadegh, M. Increasing concurrence of wildfire drivers tripled megafire critical danger days in Southern California between1982 and 2018. Environ. Res. Lett. 2020, 15, 104002. [Google Scholar] [CrossRef]
  4. Abatzoglou, J.T.; Williams, A.P. Impact of anthropogenic climate change on wildfire across western US forests. Proc. Natl. Acad. Sci. USA 2016, 113, 11770–11775. [Google Scholar] [CrossRef] [Green Version]
  5. Balch, J.K.; Bradley, B.A.; Abatzoglou, J.T.; Nagy, R.C.; Fusco, E.J.; Mahood, A.L. Human-started wildfires expand the fire niche across the United States. Proc. Natl. Acad. Sci. USA 2017, 114, 2946–2951. [Google Scholar] [CrossRef] [Green Version]
  6. Haugo, R.D.; Kellogg, B.S.; Cansler, C.A.; Kolden, C.; Kemp, K.B.; Robertson, J.C.; Metlen, K.L.; Vaillant, N.M.; Restaino, C.M. The missing fire: Quantifying human exclusion of wildfire in Pacific Northwest forests, USA. Ecosphere 2019, 10, 02702. [Google Scholar] [CrossRef] [Green Version]
  7. Keane, R.E.; Ryan, K.C.; Veblen, T.T.; Allen, C.D.; Logan, J.; Hawkes, B. Cascading Effects of Fire Exclusion in the Rocky Mountain Ecosystems: A Literature Review; U.S. Department of Agriculture: Fort Collins, CO, USA, 2002. [CrossRef] [Green Version]
  8. Marlon, J.R.; Bartlein, P.J.; Walsh, M.K.; Harrison, S.P.; Brown, K.J.; Edwards, M.E.; Higuera, P.E.; Power, M.J.; Anderson, R.S.; Briles, C.; et al. Wildfire responses to abrupt climate change in North America. Proc. Natl. Acad. Sci. USA 2009, 106, 2519–2524. [Google Scholar] [CrossRef] [Green Version]
  9. Xu, W.; He, H.S.; Hawbaker, T.J.; Zhu, Z.; Henne, P. Estimating burn severity and carbon emissions from a historic megafire in boreal forests of China. Sci. Total Environ. 2020, 716, 136534. [Google Scholar] [CrossRef]
  10. Gleason, K.E.; McConnell, J.R.; Arienzo, M.M.; Chellman, N.; Calvin, W.M. Four-fold increase in solar forcing on snow in western U.S. burned forests since 1999. Nat. Commun. 2019, 10, 2026. [Google Scholar] [CrossRef]
  11. de la Barrera, F.; Barraza, F.; Favier, P.; Ruiz, V.; Quense, J. Megafires in Chile 2017: Monitoring multiscale environmental impacts of burned ecosystems. Sci. Total Environ. 2018, 637–638, 1526–1536. [Google Scholar] [CrossRef]
  12. Jones, G.M.; Gutiérrez, R.; Tempel, D.J.; Whitmore, S.A.; Berigan, W.J.; Peery, M.Z. Megafires: An emerging threat to old-forest species. Front. Ecol. Environ. 2016, 14, 300–306. [Google Scholar] [CrossRef]
  13. Littell, J.S. Drought and Fire in the Western USA: Is Climate Attribution Enough? Curr. Clim. Chang. Rep. 2018, 4, 396–406. [Google Scholar] [CrossRef]
  14. Mariani, M.; Holz, A.; Veblen, T.T.; Williamson, G.; Fletcher, M.; Bowman, D.M.J.S. Climate Change Amplifications of Climate-Fire Teleconnections in the Southern Hemisphere. Geophys. Res. Lett. 2018, 45, 5071–5081. [Google Scholar] [CrossRef]
  15. McKenzie, D.; Littell, J.S. Climate change and the eco-hydrology of fire: Will area burned increase in a warming western USA? Ecol. Appl. 2017, 27, 26–36. [Google Scholar] [CrossRef]
  16. Sommerfeld, A.; Senf, C.; Buma, B.; D’Amato, A.W.; Després, T.; Díaz-Hormazábal, I.; Fraver, S.; Frelich, L.E.; Gutiérrez, Á.G.; Hart, S.J.; et al. Patterns and drivers of recent disturbances across the temperate forest biome. Nat. Commun. 2018, 9, 4355. [Google Scholar] [CrossRef]
  17. Keith, H.; Mackey, B.G.; Lindenmayer, D.B. Re-evaluation of forest biomass carbon stocks and lessons from the world’s most carbon-dense forests. Proc. Natl. Acad. Sci. USA 2009, 106, 11635–11640. [Google Scholar] [CrossRef] [Green Version]
  18. Duane, A.; Castellnou, M.; Brotons, L. Towards a comprehensive look at global drivers of novel extreme wildfire events. Clim. Chang. 2021, 165, 1–21. [Google Scholar] [CrossRef]
  19. Tepley, A.J.; Swanson, F.J.; Spies, T.A. Fire-mediated pathways of stand development in Douglas-fir/western hemlock forests of the Pacific Northwest, USA. Ecology 2013, 94, 1729–1743. [Google Scholar] [CrossRef] [Green Version]
  20. Bradstock, R.A. A biogeographic model of fire regimes in Australia: Current and future implications. Glob. Ecol. Biogeogr. 2010, 19, 145–158. [Google Scholar] [CrossRef]
  21. Collins, L.; Bradstock, R.A.; Clarke, H.; Clarke, M.F.; Nolan, R.H.; Penman, T.D. The 2019/2020 mega-fires exposed Australian ecosystems to an unprecedented extent of high-severity fire. Environ. Res. Lett. 2021, 16, 044029. [Google Scholar] [CrossRef]
  22. DellaSala, D.A. Temperate and Boreal Rainforests of the World: Ecology and Conservation; Island Press: Washington, DC, USA, 2011. [Google Scholar]
  23. Agee, J.K. Fire Ecology of Pacific Northwest Forests; Island Press: Washington, DC, USA, 1996. [Google Scholar]
  24. Baker, W.L. Fire Ecology in Rocky Mountain Landscapes; Island Press: Washington, DC, USA, 2009. [Google Scholar]
  25. Murphy, B.P.; Bradstock, R.A.; Boer, M.M.; Carter, J.; Cary, G.J.; Cochrane, M.A.; Fensham, R.J.; Russell-Smith, J.; Williamson, G.J.; Bowman, D.M.J.S. Fire regimes of Australia: A pyrogeographic model system. J. Biogeogr. 2013, 40, 1048–1058. [Google Scholar] [CrossRef]
  26. Spies, T.A.; Hessburg, P.F.; Skinner, C.N.; Puettmann, K.J.; Reilly, M.J.; Davis, R.J.; Kertis, J.A.; Long, J.W.; Shaw, D.C. Chapter 3: Old Growth, Disturbance, Forest Succession, and Management in the Area of the Northwest Forest Plan. In Synthesis of Science to Inform Land Management within the Northwest Forest Plan Area; Department of Agriculture, Forest Service, Pacific Northwest Research Station: Portland, OR, USA, 2018. [Google Scholar]
  27. Mundo, I.A.; Holz, A.; González, M.E.; Paritsis, J. Fire History and Fire Regimes Shifts in Patagonian Temperate Forests. In Dendroecology; Springer: Cham, Switzerland, 2017; pp. 211–229. [Google Scholar] [CrossRef]
  28. Rogers, B.M.; Neilson, R.P.; Drapek, R.; Lenihan, J.M.; Wells, J.R.; Bachelet, D.; Law, B. Impacts of climate change on fire regimes and carbon stocks of the U.S. Pacific Northwest. J. Geophys. Res. Earth Surf. 2011, 116, 1–13. [Google Scholar] [CrossRef] [Green Version]
  29. Halofsky, J.S.; Conklin, D.R.; Donato, D.C.; Halofsky, J.E.; Kim, J.B. Climate change, wildfire, and vegetation shifts in a high-inertia forest landscape: Western Washington, U.S.A. PLoS ONE 2018, 13, e0209490. [Google Scholar] [CrossRef] [Green Version]
  30. McEvoy, A.; Nielsen-Pincus, M.; Holz, A.; Catalano, A.; Gleason, K. Projected Impact of mid-21st Century Climate Change on Wildfire Hazard in a Major Urban Watershed outside Portland, Oregon USA. Fire 2020, 3, 70. [Google Scholar] [CrossRef]
  31. Buma, B.; Batllori, E.; Bisbing, S.; Holz, A.; Saunders, S.C.; Bidlack, A.L.; Creutzburg, M.K.; DellaSala, D.A.; Gregovich, D.; Hennon, P.; et al. Emergent freeze and fire disturbance dynamics in temperate rainforests. Austral Ecol. 2019, 44, 812–826. [Google Scholar] [CrossRef]
  32. Buma, B. Disturbance ecology and the problem of n = 1: A proposed framework for unifying disturbance ecology studies to address theory across multiple ecological systems. Methods Ecol. Evol. 2021, 12, 2276–2286. [Google Scholar] [CrossRef]
  33. Donato, D.C.; Halofsky, J.S.; Reilly, M.J. Corralling a black swan: Natural range of variation in a forest landscape driven by rare, extreme events. Ecol. Appl. 2020, 30, e02013. [Google Scholar] [CrossRef] [PubMed]
  34. Dague, C.I. The weather of the great tillamook, oreg., fire of august 1933. Mon. Weather Rev. 1934, 62, 227–231. [Google Scholar] [CrossRef]
  35. Morris, W.G. Forest Fires in Western Oregon and Western Washington. Or. Hist. Q. 1934, 35, 313–339. [Google Scholar]
  36. Cramer, O.P. Dry East Winds over Northwest Oregon and Wouthwest Washington; Pacific Northwest Forest & Range Experiment Station: Portland, OR, USA, 1957.
  37. Countryman, C.M. Old-Growth Conversion Also Converts Fire Climate; US Forest Service Fire Control Notes; United States Forest Service: Washington, DC, USA, 1955; pp. 15–19.
  38. Odion, D.C.; Frost, E.J.; Strittholt, J.R.; Jiang, H.; Dellasala, D.A.; Moritz, M.A. Patterns of Fire Severity and Forest Conditions in the Western Klamath Mountains, California. Conserv. Biol. 2004, 18, 927–936. [Google Scholar] [CrossRef]
  39. Thompson, J.R.; Spies, T.A.; Ganio, L.M. Reburn severity in managed and unmanaged vegetation in a large wildfire. Proc. Natl. Acad. Sci. USA 2007, 104, 10743–10748. [Google Scholar] [CrossRef] [Green Version]
  40. Thompson, J.R.; Spies, T.A. Vegetation and weather explain variation in crown damage within a large mixed-severity wildfire. For. Ecol. Manag. 2009, 258, 1684–1694. [Google Scholar] [CrossRef]
  41. Thompson, J.R.; Spies, T.A. Factors associated with crown damage following recurring mixed-severity wildfires and post-fire management in southwestern Oregon. Landsc. Ecol. 2010, 25, 775–789. [Google Scholar] [CrossRef]
  42. Zald, H.; Dunn, C.J. Severe fire weather and intensive forest management increase fire severity in a multi-ownership landscape. Ecol. Appl. 2018, 28, 1068–1080. [Google Scholar] [CrossRef] [PubMed]
  43. PBS America’s Most Devastating Wildfires. Available online: https://www.pbs.org/wgbh/americanexperience/features/burn-worst-fires/ (accessed on 27 December 2021).
  44. Reilly, M.J.; Dunn, C.J.; Meigs, G.; Spies, T.A.; Kennedy, R.E.; Bailey, J.D.; Briggs, K. Contemporary patterns of fire extent and severity in forests of the Pacific Northwest, USA (1985–2010). Ecosphere 2017, 8, e01695. [Google Scholar] [CrossRef] [Green Version]
  45. Higuera, P.E.; Abatzoglou, J.T. Record-setting climate enabled the extraordinary 2020 fire season in the western United States. Glob. Chang. Biol. 2021, 27, 1–2. [Google Scholar] [CrossRef]
  46. Abatzoglou, J.T.; Rupp, D.E.; O’Neill, L.W.; Sadegh, M. Compound Extremes Drive the Western Oregon Wildfires of September 2020. Geophys. Res. Lett. 2021, 48, e2021GL092520. [Google Scholar] [CrossRef]
  47. Governor’s Wildfire Economic Recovery Council. Recoverying & Rebuilding from Oregon’s 2020 Wildfires. Available online: https://www.oregon.gov/gov/policy/Documents/WERC-2020/Wildfire%20Report%20FINAL.pdf (accessed on 29 December 2021).
  48. Beals, E.A. The value of weather forecasts in the problem of protecting forests from fire. Mon. Weather Rev. 1914, 42, 111–119. [Google Scholar] [CrossRef]
  49. Dague, C.I. Disastrous fire weather of september, 1929. Mon. Weather Rev. 1930, 58, 368–370. [Google Scholar] [CrossRef]
  50. Franklin, J.F.; Dyrness, C.T. Christen Natural Vegetation of Oregon and Washington; US Government Printing Office: Washington, DC, USA, 1973; Volume 8.
  51. Jones, M.W.; Smith, A.; Betts, R.; Canadell, J.G.; Prentice, I.C.; Quéré, C.L. Climate Change Increases the Risk of Wildfires. ScienceBrief Rev. 2020, 116, 117. [Google Scholar]
  52. UNEP Are “Megafires” the New Normal? Available online: https://www.unep.org/news-and-stories/story/are-megafires-new-normal (accessed on 1 December 2020).
  53. Parks, S.A.; Holsinger, L.M.; Panunto, M.H.; Jolly, W.M.; Dobrowski, S.; Dillon, G.K. High-severity fire: Evaluating its key drivers and mapping its probability across western US forests. Environ. Res. Lett. 2018, 13, 044037. [Google Scholar] [CrossRef]
  54. Agee, J.K.; Skinner, C.N. Basic principles of forest fuel reduction treatments. For. Ecol. Manag. 2005, 211, 83–96. [Google Scholar] [CrossRef]
  55. Cartwright, J. Landscape Topoedaphic Features Create Refugia from Drought and Insect Disturbance in a Lodgepole and Whitebark Pine Forest. Forests 2018, 9, 715. [Google Scholar] [CrossRef] [Green Version]
  56. Busby, S.U.; Moffett, K.B.; Holz, A. High-severity and short-interval wildfires limit forest recovery in the Central Cascade Range. Ecosphere 2020, 11, 11. [Google Scholar] [CrossRef]
  57. Nyman, P.; Baillie, C.C.; Duff, T.J.; Sheridan, G.J. Eco-hydrological controls on microclimate and surface fuel evaporation in complex terrain. Agric. For. Meteorol. 2018, 252, 49–61. [Google Scholar] [CrossRef]
  58. Miller, J.D.; Thode, A.E. Quantifying burn severity in a heterogeneous landscape with a relative version of the delta Normalized Burn Ratio (dNBR). Remote Sens. Environ. 2007, 109, 66–80. [Google Scholar] [CrossRef]
  59. Parks, S.A.; Holsinger, L.M.; Koontz, M.J.; Collins, L.; Whitman, E.; Parisien, M.-A.; Loehman, R.A.; Barnes, J.L.; Bourdon, J.-F.; Boucher, J.; et al. Giving Ecological Meaning to Satellite-Derived Fire Severity Metrics across North American Forests. Remote Sens. 2019, 11, 1735. [Google Scholar] [CrossRef] [Green Version]
  60. Rollins, M.G. LANDFIRE: A nationally consistent vegetation, wildland fire, and fuel assessment. Int. J. Wildland Fire 2009, 18, 235–249. [Google Scholar] [CrossRef] [Green Version]
  61. Ohmann, J.L.; Gregory, M.J.; Henderson, E.B.; Roberts, H.M. Mapping gradients of community composition with nearest-neighbour imputation: Extending plot data for landscape analysis. J. Veg. Sci. 2011, 22, 660–676. [Google Scholar] [CrossRef]
  62. Hansen, M.C.; Potapov, P.V.; Moore, R.; Hancher, M.; Turubanova, S.A.; Tyukavina, A.; Thau, D.; Stehman, S.V.; Goetz, S.J.; Loveland, T.R.; et al. High-resolution global maps of 21st-century forest cover change. Science 2013, 342, 850–853. [Google Scholar] [CrossRef] [Green Version]
  63. Countryman, C.M. The Fire Environment Concept; Pacific Southwest Forest and Range Experiment Station: Berkley, CA, USA, 1972.
  64. McCune, B.; Keon, D. Equations for potential annual direct incident radiation and heat load. J. Veg. Sci. 2002, 13, 603–606. [Google Scholar] [CrossRef]
  65. Beven, K.J.; Kirkby, M.J. A physically based, variable contributing area model of basin hydrology. Hydrol. Sci. J. 1979, 24, 43–69. [Google Scholar] [CrossRef] [Green Version]
  66. Greenwell, B.; Boehmke, B.; Cunningham, J. gbm: Generalized Boosted Regression Models. R Package Version 2.1.8. 2020. Available online: https://CRAN.R-project.org/package=gbm (accessed on 27 December 2021).
  67. Hijmans, R.J.; Phillips, S.; Leathwick, J.; Elith, J. dismo: Species Distribution Modeling. R Package Version 1.1-4. 2020. Available online: https://CRAN.R-project.org/package=dismo (accessed on 27 December 2021).
  68. Greenwell, B.M. Pdp: An R Package for Constructing Partial Dependence Plots. R J. 2017, 9, 421. [Google Scholar] [CrossRef] [Green Version]
  69. Bigler, C.; Kulakowski, D.; Veblen, T.T. Multiple disturbance interactions and drought influence fire severity in rocky mountain subalpine forests. Ecology 2005, 86, 3018–3029. [Google Scholar] [CrossRef]
  70. Hart, S.J.; Schoennagel, T.; Veblen, T.T.; Chapman, T.B. Area burned in the western United States is unaffected by recent mountain pine beetle outbreaks. Proc. Natl. Acad. Sci. USA 2015, 112, 4375–4380. [Google Scholar] [CrossRef] [Green Version]
  71. Heyerdahl, E.K.; Brubaker, L.B.; Agee, J.K. Spatial Controls of Historical Fire Regimes: A Multiscale Example from the Interior West, USA. Ecology 2001, 82, 660–678. [Google Scholar] [CrossRef]
  72. Keeley, J.E.; Syphard, A.D. Twenty-first century California, USA, wildfires: Fuel-dominated vs. wind-dominated fires. Fire Ecol. 2019, 15, 24. [Google Scholar] [CrossRef] [Green Version]
  73. Bradstock, R.A.; Hammill, K.A.; Collins, L.; Price, O. Effects of weather, fuel and terrain on fire severity in topographically diverse landscapes of south-eastern Australia. Landsc. Ecol. 2010, 25, 607–619. [Google Scholar] [CrossRef]
  74. Nolan, R.H.; Boer, M.M.; Collins, L.; Resco de Dios, V.; Clarke, H.; Jenkins, M.; Kenny, B.; Bradstock, R.A. Causes and consequences of eastern Australia’s 2019–20 season of mega-fires. Glob. Chang. Biol. 2020, 26, 1039–1041. [Google Scholar] [CrossRef] [Green Version]
  75. Adams, M.A.; Shadmanroodposhti, M.; Neumann, M. Causes and consequences of Eastern Australia’s 2019–20 season of mega-fires: A broader perspective. Glob. Chang. Biol. 2020, 26, 3756–3758. [Google Scholar] [CrossRef]
  76. Povak, N.A.; Kane, V.R.; Collins, B.M.; Lydersen, J.M.; Kane, J.T. Multi-scaled drivers of severity patterns vary across land ownerships for the 2013 Rim Fire, California. Landsc. Ecol. 2019, 35, 293–318. [Google Scholar] [CrossRef]
  77. Littell, J.S.; Peterson, D.L.; Riley, K.L.; Liu, Y.; Luce, C. A review of the relationships between drought and forest fire in the United States. Glob. Chang. Biol. 2016, 22, 2353–2369. [Google Scholar] [CrossRef] [PubMed]
  78. Tepley, A.J.; Thompson, J.R.; Epstein, H.E.; Anderson-Teixeira, K.J. Vulnerability to forest loss through altered postfire recovery dynamics in a warming climate in the Klamath Mountains. Glob. Chang. Biol. 2017, 23, 4117–4132. [Google Scholar] [CrossRef] [PubMed]
  79. Lentile, L.B.; Holden, Z.A.; Smith, A.; Falkowski, M.J.; Hudak, A.T.; Morgan, P.; Lewis, S.A.; Gessler, P.E.; Benson, N.C. Remote sensing techniques to assess active fire characteristics and post-fire effects. Int. J. Wildland Fire 2006, 15, 319–345. [Google Scholar] [CrossRef]
  80. Rothermel, R.C. A Mathematical Model for Predicting Fire Spread in Wildland Fuels; Intermountain Forest & Range Experiment Station, Forest Service: Ogden, UT, USA, 1972; Volume 115.
  81. Keane, R.E.; Reinhardt, E.D.; Scott, J.; Gray, K.; Reardon, J. Estimating forest canopy bulk density using six indirect methods. Can. J. For. Res. 2005, 35, 724–739. [Google Scholar] [CrossRef]
  82. Estes, B.L.; Knapp, E.E.; Skinner, C.N.; Miller, J.D.; Preisler, H.K. Factors influencing fire severity under moderate burning conditions in the Klamath Mountains, northern California, USA. Ecosphere 2017, 8, e01794. [Google Scholar] [CrossRef] [Green Version]
  83. Krawchuk, M.A.; Haire, S.L.; Coop, J.; Parisien, M.A.; Whitman, E.; Chong, G.; Miller, C. Topographic and fire weather controls of fire refugia in forested ecosystems of northwestern North America. Ecosphere 2016, 7, e01632. [Google Scholar] [CrossRef]
  84. Cansler, C.A.; McKenzie, D. Climate, fire size, and biophysical setting control fire severity and spatial pattern in the northern Cascade Range, USA. Ecol. Appl. 2014, 24, 1037–1056. [Google Scholar] [CrossRef]
  85. Coen, J.L.; Stavros, E.N.; Fites-Kaufman, J.A. Deconstructing the King megafire. Ecol. Appl. 2018, 28, 1565–1580. [Google Scholar] [CrossRef]
  86. Weatherspoon, C.P.; Skinner, C.N. An Assessment of Factors Associated with Damage to Tree Crowns from the 1987 Wildfires in Northern California. For. Sci. 1995, 41, 430–451. [Google Scholar]
  87. Wood, S.W.; Murphy, B.P.; Bowman, D.M.J.S. Firescape ecology: How topography determines the contrasting distribution of fire and rain forest in the south-west of the Tasmanian Wilderness World Heritage Area. J. Biogeogr. 2011, 38, 1807–1820. [Google Scholar] [CrossRef]
  88. Agee, J.K.; Huff, M.H. Fuel succession in a western hemlock/Douglas-fir forest. Can. J. For. Res. 1987, 17, 697–704. [Google Scholar] [CrossRef]
  89. Franklin, J.F.; Spies, T.A.; Van Pelt, R.; Carey, A.B.; Thornburgh, D.A.; Berg, D.R.; Lindenmayer, D.B.; Harmon, M.E.; Keeton, W.S.; Shaw, D.C.; et al. Disturbances and structural development of natural forest ecosystems with silvicultural implications, using Douglas-fir forests as an example. For. Ecol. Manag. 2002, 155, 399–423. [Google Scholar] [CrossRef]
  90. Spies, T.A.; Franklin, J.F.; Thomas, T.B. Coarse Woody Debris in Douglas-Fir Forests of Western Oregon and Washington. Ecology 1988, 69, 1689–1702. [Google Scholar] [CrossRef]
  91. Isaac, L.A. Vegetative Succession Following Logging in the Douglas Fir Region with Special Reference to Fire. J. For. 1940, 38, 716–721. [Google Scholar]
  92. Arthur, W.B.; Charles, E.P. Plant Communities and Environmental Interrelationship in a Portion of the Tillamook Burn, Northwestern Oregon. Ecology 1968, 49, 1–13. [Google Scholar]
  93. Gray, A.N.; Franklin, J.F. Effects of Multiple Fires on the Structure of Southwestern Washington Forests. Northwest Sci. 1997, 71, 174–185. [Google Scholar]
  94. Prichard, S.J.; Stevens-Rumann, C.S.; Hessburg, P.F. Tamm Review: Shifting global fire regimes: Lessons from reburns and research needs. For. Ecol. Manag. 2017, 396, 217–233. [Google Scholar] [CrossRef]
  95. Coop, J.D.; Parks, S.A.; Stevens-Rumann, C.S.; Crausbay, S.D.; Higuera, P.E.; Hurteau, M.D.; Tepley, A.; Whitman, E.; Assal, T.; Collins, B.M.; et al. Wildfire-Driven Forest Conversion in Western North American Landscapes. Bioscience 2020, 70, 659–673. [Google Scholar] [CrossRef]
  96. North, M.P.; Stephens, S.L.; Collins, B.M.; Agee, J.K.; Aplet, G.; Franklin, J.F.; Fule, P.Z. Reform forest fire management. Science 2015, 349, 1280–1281. [Google Scholar] [CrossRef]
  97. Frey, S.J.K.; Hadley, A.S.; Johnson, S.L.; Schulze, M.; Jones, J.A.; Betts, M.G. Spatial models reveal the microclimatic buffering capacity of old-growth forests. Sci. Adv. 2016, 2, e1501392. [Google Scholar] [CrossRef] [Green Version]
  98. Thompson, J.R.; Wiek, A.; Swanson, F.J.; Carpenter, S.R.; Fresco, N.; Hollingsworth, T.; Spies, T.A.; Foster, D.R. Scenario Studies as a Synthetic and Integrative Research Activity for Long-Term Ecological Research. BioScience 2012, 62, 367–376. [Google Scholar] [CrossRef] [Green Version]
  99. Lindenmayer, D.B.; Kooyman, R.M.; Taylor, C.; Ward, M.; Watson, J.E.M. Recent Australian wildfires made worse by logging and associated forest management. Nat. Ecol. Evol. 2020, 4, 898–900. [Google Scholar] [CrossRef] [PubMed]
  100. Gunnoe, A. The Financialization of the US Forest Products Industry: Socio-Economic Relations, Shareholder Value, and the Restructuring of an Industry. Soc. Forces 2015, 94, 1075–1101. [Google Scholar] [CrossRef]
  101. Bliss, J.C.; Kelly, E.C.; Abrams, J.; Bailey, C.; Dyer, J. Disintegration of the U. S. Industrial Forest Estate: Dynamics, Trajectories, and Questions. Small-Scale For. 2010, 9, 53–66. [Google Scholar] [CrossRef]
  102. McEvoy, A.; Kerns, B.; Kim, J. Hazards of Risk: Identifying Plausible Community Wildfire Disasters in Low-Frequency Fire Regimes. Forests 2021, 12, 934. [Google Scholar] [CrossRef]
  103. Halofsky, J.S.; Donato, D.C.; Franklin, J.F.; Halofsky, J.E.; Peterson, D.L.; Harvey, B.J. The nature of the beast: Examining climate adaptation options in forests with stand-replacing fire regimes. Ecosphere 2018, 9, e02140. [Google Scholar] [CrossRef]
  104. Abatzoglou, J.T.; Juang, C.S.; Williams, A.P.; Kolden, C.A.; Westerling, A.L. Increasing Synchronous Fire Danger in Forests of the Western United States. Geophys. Res. Lett. 2021, 48, e2020GL091377. [Google Scholar] [CrossRef]
  105. Abatzoglou, J.T.; Hatchett, B.J.; Fox-Hughes, P.; Gershunov, A.; Nauslar, N.J. Global climatology of synoptically-forced downslope winds. Int. J. Clim. 2021, 41, 31–50. [Google Scholar] [CrossRef]
  106. Guzman-Morales, J.; Gershunov, A. Climate Change Suppresses Santa Ana Winds of Southern California and Sharpens Their Seasonality. Geophys. Res. Lett. 2019, 46, 2772–2780. [Google Scholar] [CrossRef]
  107. Davis, R.; Yang, Z.; Yost, A.; Belongie, C.; Cohen, W. The normal fire environment—Modeling environmental suitability for large forest wildfires using past, present, and future climate normals. For. Ecol. Manag. 2017, 390, 173–186. [Google Scholar] [CrossRef]
  108. Halofsky, J.E.; Peterson, D.L.; Harvey, B.J. Changing wildfire, changing forests: The effects of climate change on fire regimes and vegetation in the Pacific Northwest, USA. Fire Ecol. 2020, 16, 4. [Google Scholar] [CrossRef] [Green Version]
  109. Jolly, W.M.; Cochrane, M.A.; Freeborn, P.H.; Holden, Z.A.; Brown, T.J.; Williamson, G.J.; Bowman, D.M.J.S. Climate-induced variations in global wildfire danger from 1979 to 2013. Nat. Commun. 2015, 6, 7537. [Google Scholar] [CrossRef] [PubMed]
  110. Westerling, A.L. Increasing western US forest wildfire activity: Sensitivity to changes in the timing of spring. Philos. Trans. R. Soc. B Biol. Sci. 2016, 371, 20150178. [Google Scholar] [CrossRef]
  111. Goss, M.; Swain, D.L.; Abatzoglou, J.T.; Sarhadi, A.; Kolden, C.A.; Williams, A.P.; Diffenbaugh, N.S. Climate change is increasing the likelihood of extreme autumn wildfire conditions across California. Environ. Res. Lett. 2020, 15, 094016. [Google Scholar] [CrossRef] [Green Version]
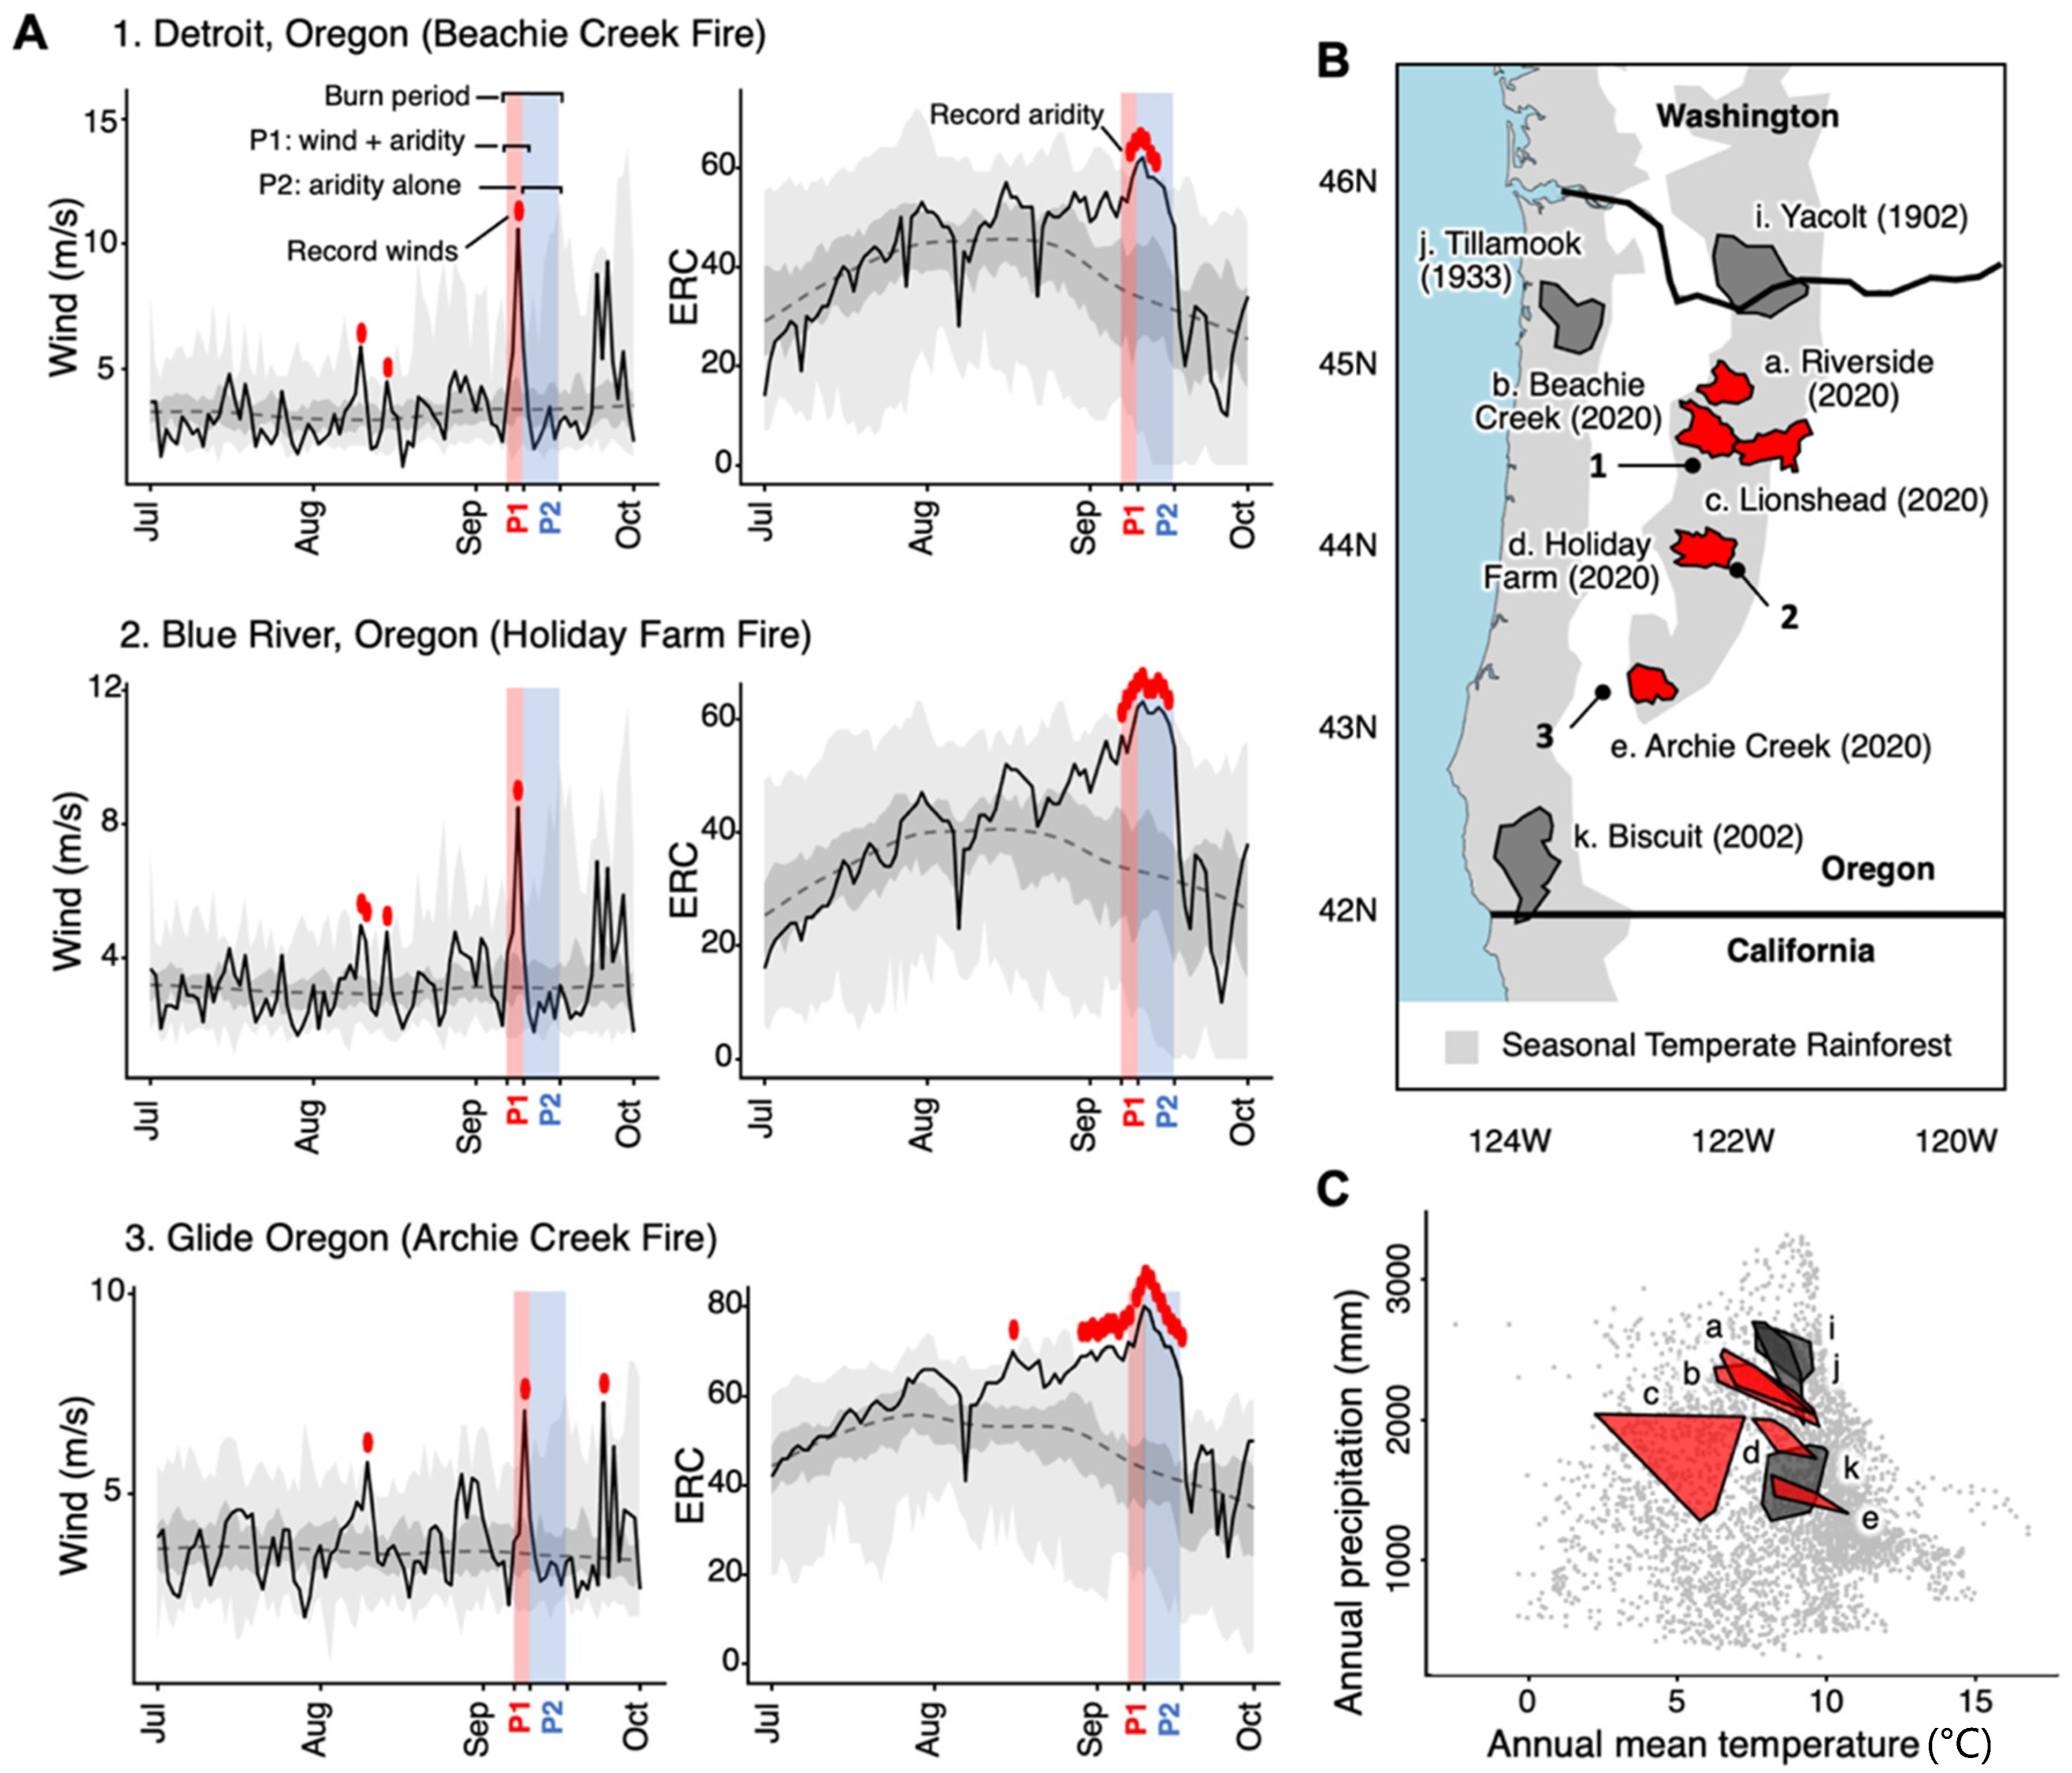
Figure 1. (A) Long-term (1979–2020) and 2020 weather conditions for the PNW fire season (July to October) from north (top panel) to south (bottom panel) in the western Cascade Range of Oregon (source: GridMET, https://www.climatologylab.org/gridmet.html, accessed on 8 January 2021). Long-term maximum daily values for wind and energy release component (ERC; a metric of mid-to-coarse fuel aridity) are shown in light gray; the interquartile range in darker gray; the median daily value as a dashed line. Daily values for 2020 are shown as a solid black line (record-breaking daily values denoted with bold red emphasis). Based on wind patterns, the five synchronous megafires are divided into two periods: period 1 (P1) with extreme winds and fuel aridity (red), and period 2 (P2) with extreme fuel aridity alone (blue). (B) From north (top) to south (bottom), the GridMET stations are located in (1) the Santiam River watershed, near Detroit, Oregon (Beachie Creek Fire; top left panel), in (2) the McKenzie watershed, near Blue River, Oregon (Holiday Farm Fire; middle left panel), and in (3) the Umpqua River watershed near Glide, Oregon (Archie Creek Fire; bottom left panel). (C) The regional context of these fires within temperate rainforests is shown to the right. Climate envelope data are built from by BioClim for PNW seasonal temperate rainforests [22].
Fire 05 00041 g001
Figure 2. (A) Variable importance of both fire periods ranked by stratified sample (below 1250 m) as shown by horizontal black lines. Points show variable importance for models fit individually to both periods at all elevations and at elevations less than 1250 m. (B) Partial dependence of high-severity for continuous variables ordered by importance. Lines plotted for P1 (red) and P2 (blue) are shown with (dark) and without (light) the elevation filter (see elevation panel for reference). From top-left to bottom-right panels are ordered by relative importance as shown in (A).
Fire 05 00041 g002
Figure 3. Notable interactions among several variable pairs (AH) are shown for both periods 1 and 2. The likelihood of high burn severity for both periods and each variable combination is described by the color ramp shown in the legend at bottom. For example, (A) shows forests with canopy heights less than 10 m were most likely to see severe burns during P1 and P2, but higher probabilities for severe burns were also observed in taller stands in P1, particularly as slopes increased beyond 20 degrees (C).
Fire 05 00041 g003
Figure 4. Area of high severity fire (hectares) for BLM (BL), USFS (FS), and private (PR) as observed (darker color) versus as expected (lighter color) based on the individual proportions for weather period and land ownerships. Observed and expected values deviate markedly across all ownership in period 2 (reported as a percent under each set of bars), with much less high-severity fire for BLM, USFS, and state, and much more in private lands.
Fire 05 00041 g004
Publisher’s Note: MDPI stays neutral with regard to jurisdictional claims in published maps and institutional affiliations.