Abstract
Woody thickening is a widespread phenomenon in the grassy woodlands of the world, often with deleterious effects on nature conservation values. We aimed to determine whether increasing the frequency of planned fire prevented woody thickening and improved conservation values in a Eucalyptus viminalis grassy woodland in the process of invasion by Allocasuarina verticillata (henceforth Allocasuarina) in Hobart, Tasmania, Australia. We used a before–after control intervention design. Ten plots from which detailed vegetation data were collected in 2018 (before the burns), 2019 (between burns), 2020 (between burns) and 2021 (after the burns) were randomly located in each of four blocks. Two of the blocks were burned in both 2018 and 2021. One block was burned only in 2021, and another was not burned at all. Mechanical thinning of Allocasuarina took place in 2021 in six plots in one unburned block and in three twice-burned plots. The fires were low intensity and patchy, reflecting the reality of planned burns in this environment. Thus, there were unburned plots mixed with burned plots in each of the three burned blocks. We compared changes in vegetation and cover attributes between a preburn survey in 2018 and a postburn survey in 2021, between five fire history/thinning classes (unburned, no thinning; unburned, thinning; twice burned; burned in 2018 only; burned in 2021 only). Fires in both 2018 and 2021 resulted in lower litter cover and higher exotic species richness than one fire in 2021. Exotic species richness increase between 2018 and 2021 was greater after fires in 2018 and 2021 than after a fire in 2021 alone. Exotic species richness was lowest six years after fire and highest one to three years after fire. The basal area of Allocasuarina was, counter-intuitively, less reduced by two fires in four years than by one. Mechanical thinning reduced shrub layer cover, which largely consisted of small trees, but did not affect basal area. Our data suggested that grass cover increased until five years after a fire, declining back to a low level by eight years. The implications of the results for conservation management are that the mechanical removal of young Allocasuarina may be successful in preventing its thickening and that burning at a five-year interval is likely to best maintain understorey conservation values. The counter-intuitive results related to Allocasuarina basal area emphasise the importance of understanding cumulative effects of fire regimes on fuel cycles and the consequent effects on tree mortality.
1. Introduction
Temperate grassy ecosystems are one of the vegetation types of the world that have been most transformed by agricultural development [1,2,3,4,5]. In their preagricultural condition, the interaction of fire and grazing/browsing regimes [6] and the role of ground disturbance in reducing root competition with tree seedlings in the grass sward [7] appear to have been critical in determining their woody content.
The dieback of grassy woodland trees in areas grazed by domestic stock has been regarded as a major problem for conservation and production [8]. In Australia, this dieback has been largely attributed to the population growth of native mammal and bird species induced by the fragmentation of native vegetation and changes in land management practices [9,10,11,12]. Pastures that are grazed by sheep, however, have been occasionally found to have higher conservation values than adjacent vegetation from which stock are excluded [2,13,14]. Stock can remove competition for threatened native plants and suppress tree and shrub regeneration, sometimes producing a desirable conservation outcome for flora [8].
The opposite problem to dieback, woody thickening, has occurred to the degree to which the vegetation transforms into a scrub or forest alternative steady state, thereby losing its grassiness [15,16,17,18,19,20,21]. For example, grassy woodlands from which stock and native grazers are excluded often experience woody thickening [22,23].
It has been suggested that woody thickening may partially be a function of the steadily increasing CO2 content of the atmosphere [24,25], a supposition consistent with remote sensing calculations of increasing biomass [25]. There is an even stronger suspicion that reductions in fire frequency might be responsible for much woody thickening [25,26], a suspicion reinforced by the effectiveness of planned burning regimes in preventing shrub and tree takeover of some temperate grassy ecosystems, such as those in the Surrey Hills, Tasmania [27].
Our study area, the Queens Domain (the Domain), Hobart, Tasmania, Australia, is a grassy woodland remnant that has been subject to well-documented woody thickening since the mid-twentieth century [23,28]. The main agent of thickening is a small native sheoak tree, Allocasuarina verticillata (henceforth Allocasuarina), that is widespread in temperate Australia. Its regeneration can be impeded by rabbit (Oryctolagus cuniculus) grazing [29]. It is well down on the list of preferred tree species for browsing macropods, although when macropod populations are high, it is heavily grazed [30]. Where Allocasuarina forms closed communities, fires usually kill the foliage [31]. Where trees are scattered in grassland or among rocks, their aboveground parts generally survive low-intensity fire. If all its foliage is killed by fire, Allocasuarina resprouts from buds at its base and on its roots. It also releases large amounts of tadpole-shaped seed held in persistent woody capsules after fire. Allocasuarina photosynthesises through cladodes (small branches), with stomata held deep in grooves and protected by hairs, helping make it the tree species that is most drought-resistant in Tasmania [32]. A dense understorey of Allocasuarina competes with the taller eucalypts for moisture and is thought to be an agent of their death by drought [22]. Few other vascular plants survive in the understorey of a closed Allocasuarina forest, making the community undesirable for nature conservation, as the threatened plant species of temperate grassy woodland are found in the ground layer, albeit often in bare spaces under well-separated trees [33].
It has been suggested that increasing the fire frequency to the shortest period possible might prevent the woody thickening on the Domain that had occurred with intervals of five years or more, by preventing seedlings from converting into saplings [23]. The present paper addresses this question and the implications of its answer for conservation values in general. While the suggested annual or biannual burning [23] proved to be too difficult to implement because of inadequate fuel levels, we were able to burn three years after our first fire in a before–after control intervention design, thereby contrasting the outcomes of a three-year interval between fires with an eight-year interval. We hypothesised that the more frequent burning would reduce the basal area compared to the alternative regimes in the experiment and would also favour the persistence of conservation values. An alternative solution to the problem of thickening of Allocasuarina, mechanical thinning of the smaller stems, was trialled in the plots that were not burned during the course of the experiment.
2. Materials and Methods
2.1. The Study Area
The mean annual rainfall in 1991–2020 from the nearby Hobart station is 565 mm, with the wettest month being August with 63 mm and the driest being March with 37 mm. The mean daily maximum temperature of the warmest month (January) is 22.7 °C, while the mean daily minimum temperature of the coldest month (July) is 5.2 °C. The Domain is largely underlain by dermosols formed on Jurassic dolerite. It is an urban park that was originally covered in open grassy eucalypt woodlands, which has experienced woody thickening since the mid-twentieth century [23,28].
2.2. Experimental Design and Site Selection
Four adjacent compartments on the eastern slopes of the Domain with boundaries suitable for planned burning were selected for the experiment in 2018. They were previously burned in 2013. A replicated before–after control intervention design was used to determine any differences in the effects of frequent and infrequent fire.
The central compartments were planned to be burned twice, once immediately after the baseline survey and a second time within three years of the first burn. The northernmost and southernmost compartments were to be burned only once, during the second time. The date of the 2018 fire was the 16 of October. The 2021 burning treatment took place between 27 April and 3 May, because a lack of continuous fuel required multiple combustions. Ten sites were randomly selected within each compartment for surveying (Figure 1).
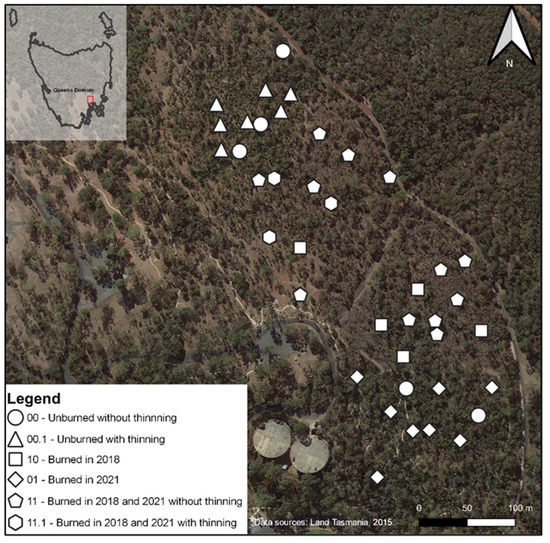
Figure 1.
Distribution of sample sites across the Domain with type of treatment applied. Aerial imagery was taken in the years previous to the 2018 fire [34].
The reality of the experiment differed from the initial conception because of difficulties in implementing the planned burning program uniformly over compartments and the exigencies of COVID-19 restrictions. The treatments of no fire, an early fire but not a late one, a late fire but not an early one and both an early and late fire were not fully coincident with compartments (Figure 1), making replication a matter of plot, rather than compartment or scale.
An additional treatment was imposed on six of the eleven plots that were unburned during the course of the experiment and three of the plots burned twice. This treatment was mechanical thinning, consisting of cutting all small stems of Allocasuarina, leaving only the larger trees of the species.
2.3. Field Data Collection
The methods for vegetation data collection from sites were developed to be consistent with those of previous work on the Domain [23,35]. At each site, a 15 × 1 m quadrat was lain along the contour, marked at both upslope corners with a deck spike and geolocated at both the spikes using a field GPS. Photographs were taken of each end of the quadrat at all sampling times to further assist in exact relocation.
Data collection took place in March 2018, March 2019, July 2020 and October 2021. All observed vascular plant taxa with living parts directly above the quadrat were recorded. The upslope boundary of the quadrat was used as a line intercept. Outline covers were recorded along this line to 1 cm accuracy for: grass, graminoids (other monocotyledons than Poacaceae), shrubs (woody plants with foliage less than 1 m above ground), herbs, bare ground (with no foliage within 1 m above it), rocks (greater than 2 cm diameter, wood (greater than 2 cm diameter) and litter (dead plant material lying parallel to the ground). A Bitterlich Wedge was used to estimate the basal area (m2/ha) by tree species from the northern upslope corner of the quadrat. The presence of scats of macropods, possums (Trichosurus vulpecula) and rabbits and the presence of small mammal diggings was noted.
The intensity of recent fire (<1 year previous) was measured by recording the scorch height on shrub and tree foliage in 2019 and 2021. The coverage of fire in 2019 and 2021 was measured along the line intercept and expressed as a percentage.
2.4. Statistical Methods
All analyses were undertaken in Minitab16 [36]. Line intercept data were converted into percentages. Exotic plant species richness, native plant species richness and total plant species richness were calculated for each plot at each time by counting the number of identified taxa with parts above the plot. For each of the cover, richness and basal area variables with sufficient data for analysis, the 2018 data for each plot were subtracted from the 2021 data. Each of these differences were the response variable in one-way analyses of variance (ANOVA). The predictor variable was burn/thinning history, which had five classes: 00—unburned in both 2018 and 2021, unthinned (n = 5); 00.1—unburned in both 2018 and 2021, thinned (n = 6); 01—unburned in 2018 and at least partially burned in 2021, unthinned (n = 9); 10—at least partially burned in 2018 and unburned in 2021 (n = 5), unthinned; 11—at least partially burned in both 2018 and 2021, unthinned (n = 12). The plots that were at least partially burned in both 2018 and 2021 and thinned in 2021 were not used in these analyses because of their low number (n = 3). They were used in analyses of data collected before thinning took place. ANOVA was used to determine whether there was variation in the variables between the burn/thinning classes before treatments were applied. The frequency of individual plant taxa was related to the burn/thinning history using Chi2. For both total basal area and Allocasuarina basal area, the changes between 2018 and 2019, 2019 and 2020 and 2020 and 2021 were calculated. ANOVA was used to determine if these basal area change variables differed between burn/thinning classes. The time since the last fire to the nearest year was calculated for each plot for each of the 2018, 2019, 2020 and 2021 data sets, and then pooled. Thus, for example, one year after the 2018 fire was pooled with one year after the 2021 fire. ANOVA was used to determine the responses of grass cover, exotic plant richness, bare and rock cover and litter cover to this variable for the full data set. In all ANOVAs, Fisher’s individual error rate was used to determine significantly differing classes.
3. Results
3.1. The Prefire Sampling Environment
With the exception of sedge cover, which was significantly higher in the plots that were burned only in 2018 than those burned only in 2021, the richness, basal area and cover variables did not vary between the 2021 burn/thinning classes in the prefire sampling. In 2018, before any treatment, total species richness averaged 15.0 with a standard error of 0.5. Exotic species richness was 1.9 (0.2), while native species richness was 13.0 (0.5). The mean basal area was 7.6 (0.6) m2/ha, mostly constituted of stems of Allocasuarina (5.1 (0.5) m2/ha). Eucalyptus viminalis was an occasional emergent from the Allocasuarina canopy (basal area = 1.1 (0.3) m2/ha). Most of the living ground cover was grass (78.0 (2.1)%), followed by sedges (7.6 (1.3)%), herbs (5.0 (0.5)%) and shrubs (4.0 (0.7)%). The non-living ground cover was litter (85.7 (1.5)%), wood (10.7 (1.6)%), rock (2.0 (0.3)%) and bare ground (1.5 (0.3)%). The vegetation was grazed by macropods (Bennet’s wallaby (Macropus rufogriseus) and pademelons (Thylogale billardierii)) and rabbits. Eastern barred bandicoots (Perameles gunnii) and southern brown bandicoots (Isoodon obesulus) excavated the ground to form diggings.
3.2. Intensity and Coverage of Burns and Tree Thinning
The second fire was less intense than the first burn, with little more than half the coverage and less than half the scorch height than plots burned in 2018 (Table 1). The plots burned twice did not differ much from those burned only at the second time in either of the intensity variables (Table 1).

Table 1.
Mean burn area within plots and scorch height for the 2018 and 2021 fires by burn/thinning class. Class 11 includes thinned plots.
3.3. Effects of Burn History on Species Richness, Basal Area and Cover Types
Total, exotic and native species richness all increased in all burn classes between 2018 and 2021. Only exotic species richness significantly varied between classes, with those areas burned only in 2018 having the greatest increase and those burned only in 2021 the least (Table 2). The lowest exotic species richness occurred six years after fire, significantly less than all other time periods, while 1, 2 and 3 years had the highest values, significantly different from 5 and 6 years after fire (ANOVA, F = 4.356, 153, p < 0.001).
Table 2.
Effects of burn/thinning history on change in cover, richness and basal area variables between 2018 (prefire) and 2021 (postfire). F and p values from one-way analysis of variance and Fishers test (if any letter is the same, figures in rows are statistically identical at p > 0.05). 0 = unburned, 0.1 = unburned and thinned; 10 = burned only in 2018, 01 = burned only in 2021, 11 = burned in both 2018 and 2021.
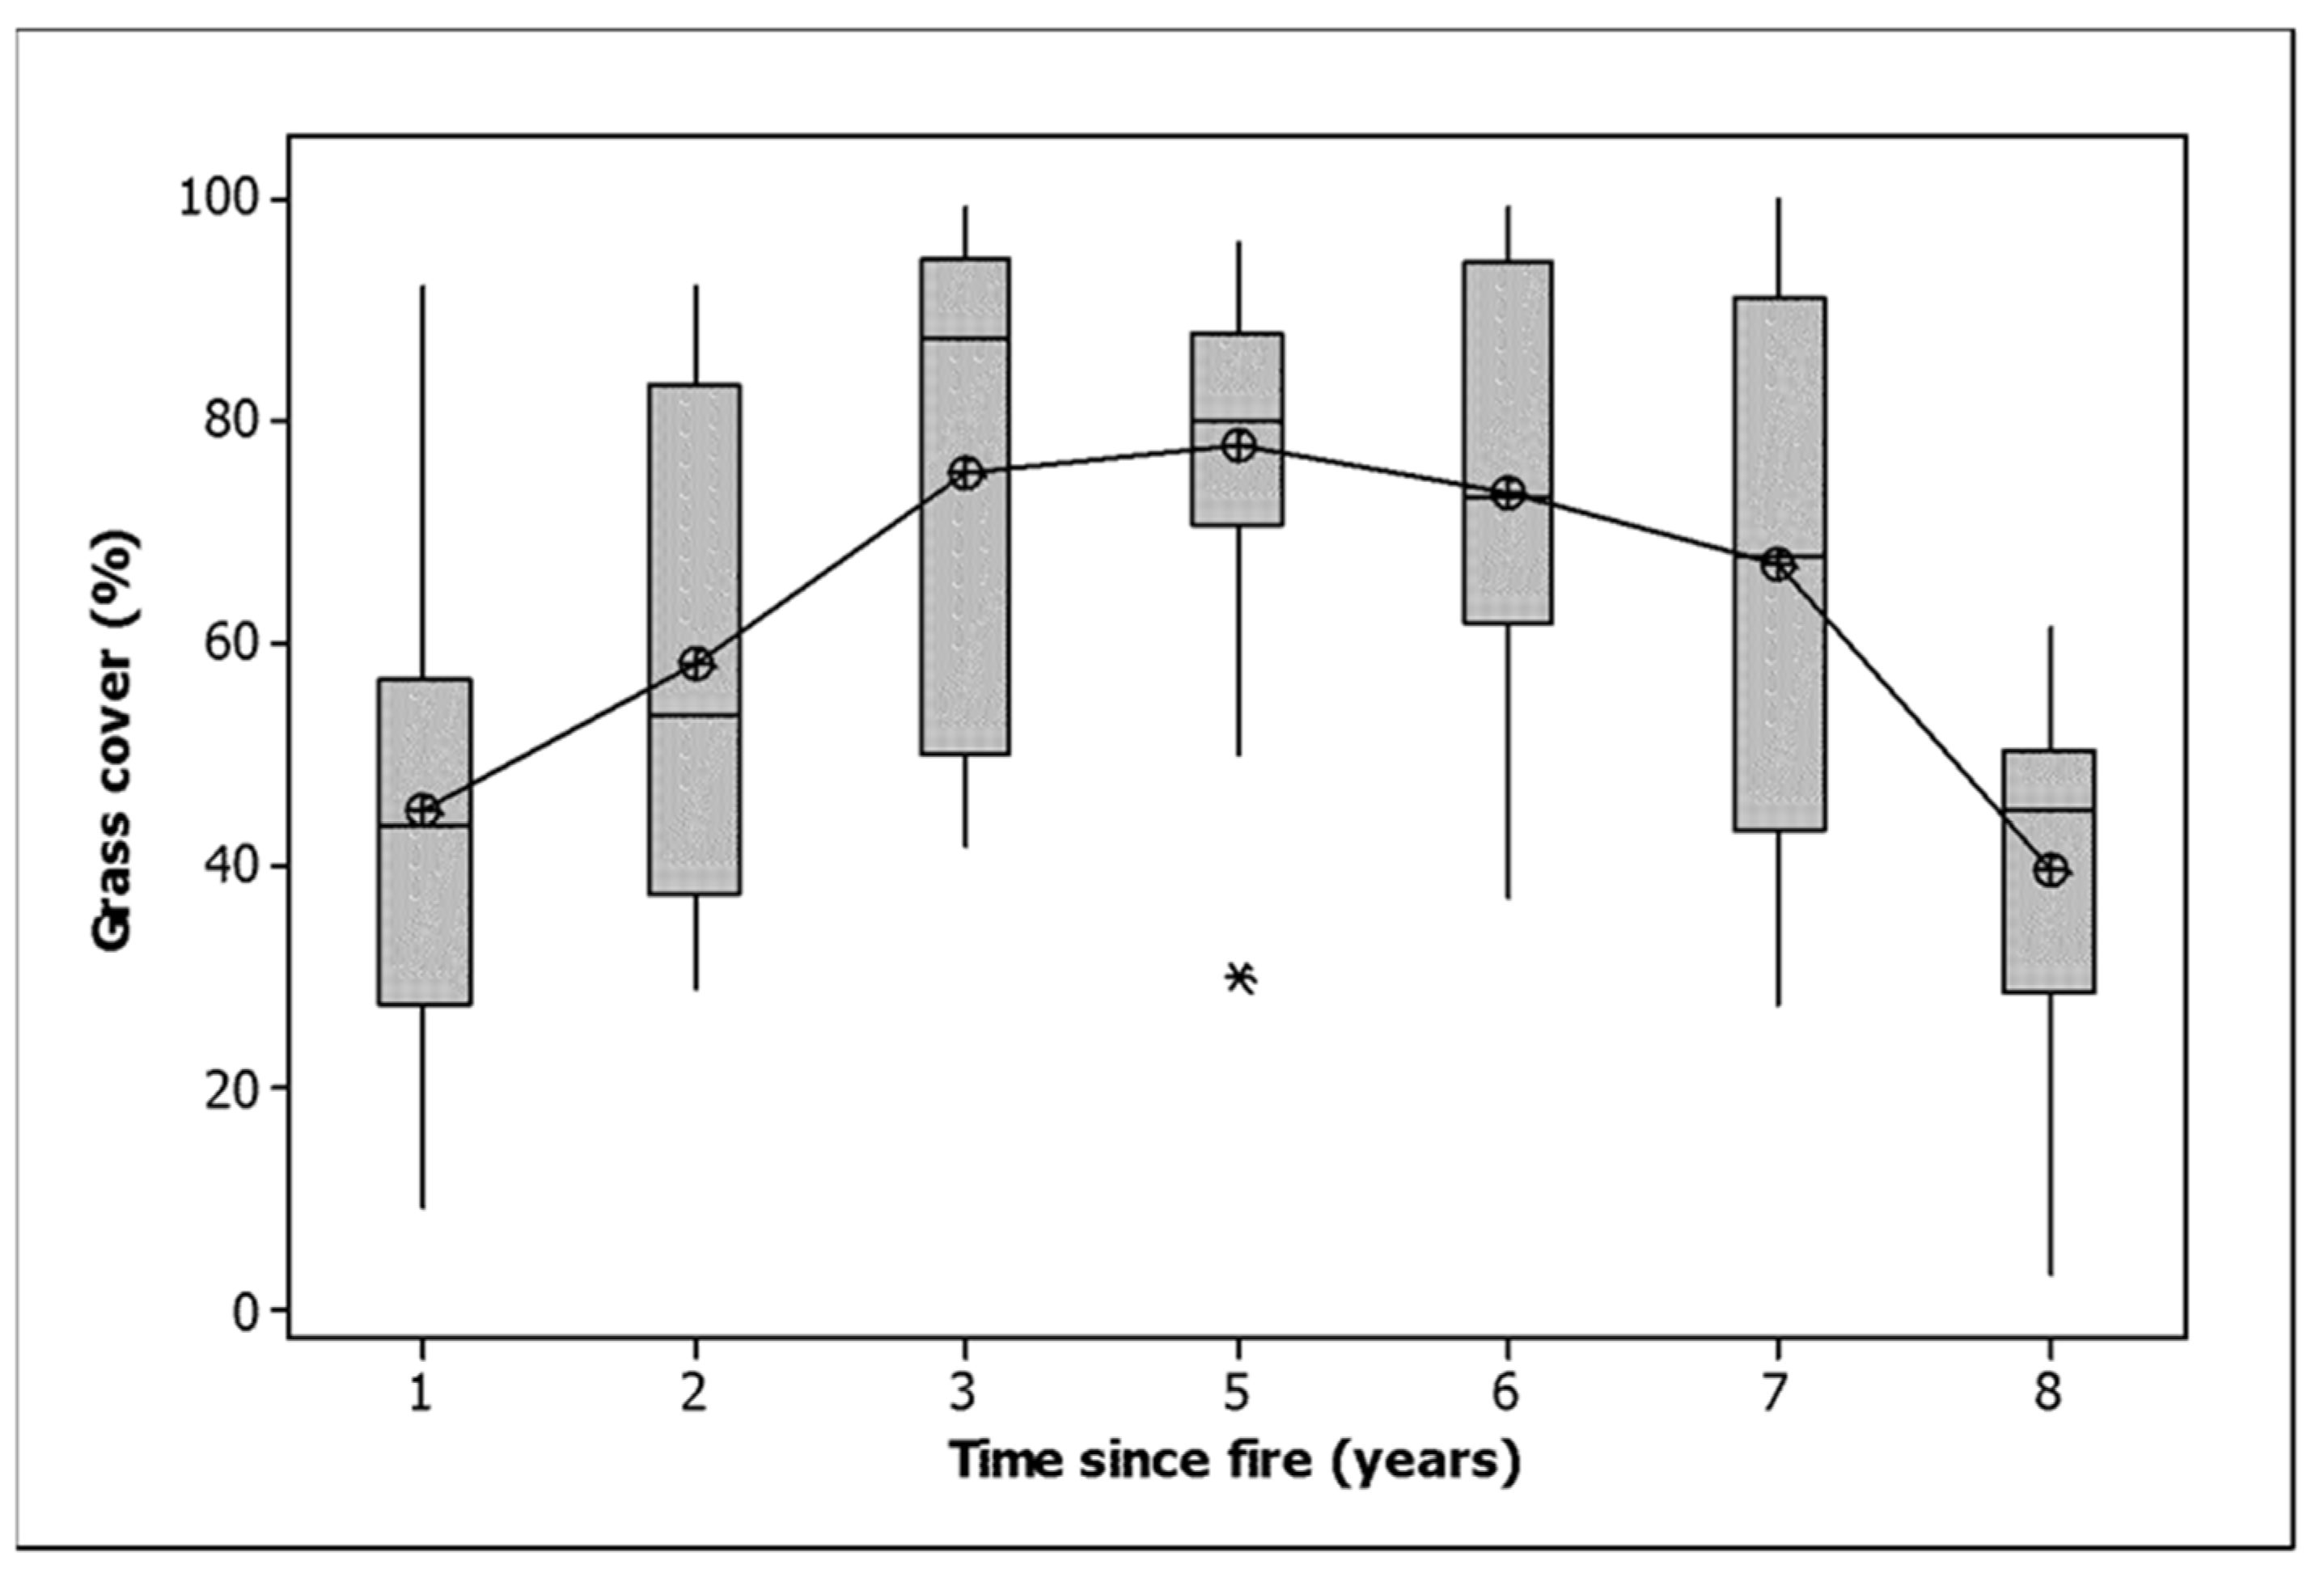
Bare ground, including rock cover, wood cover, grass cover and herb cover, all decreased between the first and last measurement in all classes (Table 2). Shrub cover increased in the unburned and unthinned plots and those burned only in 2021 and decreased in the other classes (Table 2). Litter cover increased in the plots burned only in 2021 and decreased elsewhere. Sedge cover declined in the plots burned only in 2021 but increased in the other classes (Table 2). The grass cover data, when graphed by time since fire, exhibited a domed response, with the maximum grass cover attained five years after fire, followed by a decline to the level of a year after fire by 8 years (Figure 2). The statistical differentiation between years was very strong (ANOVA, F = 14.186,153, p < 0.001).

Figure 2.
Grass cover related to time since fire. The median is shown by a horizontal line. The box contains two quartiles. The symbols are outliers. Means are joined by a line.
Woody debris cover declined in all burn classes, as did bare ground and rock (Table 2). Most of the loss of bare ground and rock occurred three or more years after fire, with years 1 and 2 being significantly greater than the rest (Figure 3, ANOVA, F = 9.616,153, p < 0.001). Litter cover declined dramatically in all treatments except the 2021 fire. Two fires resulted in a significantly greater loss of litter than one (Table 2). Litter cover was stable between one and three years, saw a dramatic increase by five years and a slight decline towards eight years (Figure 4). Litter cover was significantly higher 5, 6 and 7 years after fire than 1, 2, 3 and 8 years after fire (ANOVA, F = 16.916,153, p < 0.001).
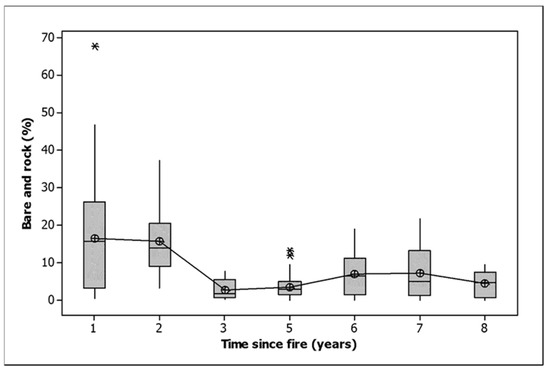
Figure 3.
Bare ground and rock cover related to time since fire. Note that the one-year data includes observations in 2021 after burning that covered only 57% of the area within burned plots. Given that only half of the area of the burned plots was burned in 2021, an adjusted bare and rock cover at one year would be approximately 22%. The median is shown by a horizontal line. The box contains two quartiles. The symbols are outliers. Means are joined by a line.
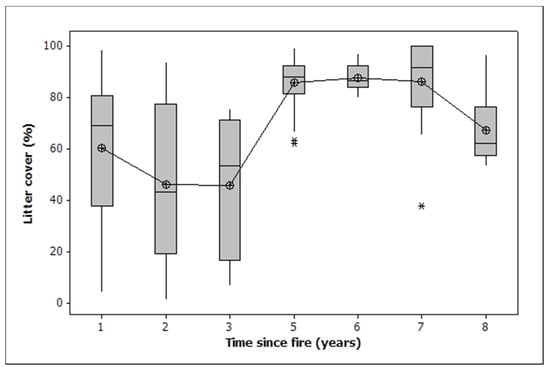
Figure 4.
Box plots showing temporal change in litter cover. Note that the one-year data includes observations in 2021 after burning that covered only 57% of the area within burned plots. Given that only half of the area of the burned plots was burned in 2021, an adjusted litter cover at one year would be approximately 45%. The median is shown by a horizontal line. The box contains two quartiles. The symbols are outliers. Means are joined by a line.
There was no significant variation by burn/thinning class for either total basal area or Allocasuarina basal area. Both increased in all burn classes between first and last measurement (Table 2). Total basal area responded weakly to year since fire (Basal area (m2/ha) = 7.625 + 0.2534 Time since fire (years), r2 = 2.4%, p = 0.049). However, a more nuanced picture (Table 3) reveals that the 2018 fire slightly reduced the basal area of Allocasuarina, but not total basal area, with a resurgence by 2020. Burning in 2021 resulted in a basal area decline for both variables, except for plots burned in both 2018 and 2021, which were stable (Table 3). Between 2020 and 2021, the plots burned both in 2018 and 2021 lost significantly less basal area than those burned only in 2021 (Table 3). In 2020, the plots unburned until 2021 had significantly greater basal areas than those burned in 2018 (Figure 5). They also had significantly higher covers of litter (99.1% (SV = 1.4) cf 48.8% (3.5)).
Table 3.
Mean changes and standard deviation of mean changes in total basal area and Allocasuarina verticillata basal area (m2/ha) between successive and all samplings related to fire history. The one variable that significantly varied in one-way ANOVA has letters next to the values, which indicate the results of Fishers test. Values that share one letter are statistically identical at p > 0.05.
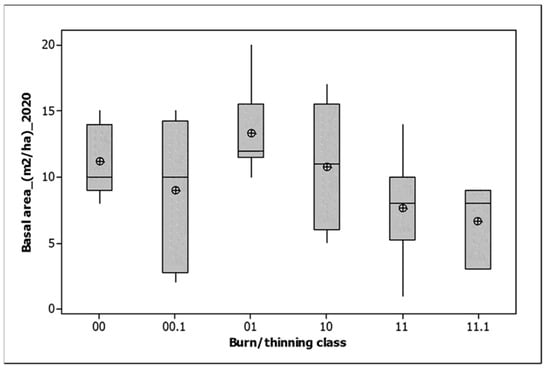
Figure 5.
Total basal area by 2021 burn/thinning class for the 2020 monitoring. 00 = unburned, 00.1 = unburned and thinned, 10 = burned only in 2018, 01 = burned only in 2021, 11 = burned in both 2018 and 2021, 11.1 = burned in both 2018 and 2021 and thinned. The median is shown by a horizontal line. The box contains two quartiles. Means are shown by circles.
There were 5 perennial species out of 43 that were identifiable in all seasons and were abundant enough for testing that significantly varied in their frequency by burn class. With three of the species, this variation reflected their frequencies before the first experimental burn (Table 4). An obligate-seeding, short-lived daisy shrub, Olearia ramulosa, was eliminated by two fires and dramatically reduced by one. It also declined, to a lesser degree, in the unburned plots (Table 4). One of the most widespread perennial herbaceous weeds, Urospermum dalechampii, was constant in the unburned treatments, decreased in the plots burned only in 2018 and increased in the other treatments (Table 4).
Table 4.
Significant effects of burn/thinning history on the frequency of individual species in 2021, showing percentage frequency by class and 2018 percentage frequency in brackets. p values are from Chi2. 00 = unburned, 00.1 = unburned and thinned, 10 = burned only in 2018, 01 = burned only in 2021, 11 = burned in both 2018 and 2021. dal. = dalechampii, lat. = laterale.
Macropod scats were evenly spread across burn classes in 2021, ranging from 80 to 100% of plots. Levels of native animal diggings in 2021 were lowest in the plots burned only in 2018 at 40%, with a frequency of 73% for the twice-burned plots, 91% for the unburned plots and 100% for those burned only in 2021 (Chi2 = 8.4, df = 3, p = 0.037).
4. Discussion
Our experiment was designed to determine whether increasing the frequency of planned burning from once every five or more years to more frequently might help prevent observed ongoing woody thickening by Allocasuarina and improve the conservation values of a remnant temperate grassy woodland. We were able to compare the effects of one fire in a four-year period to those of two fires and to contrast understorey and overstorey changes one to eight years after fire. Our hypothesis that more frequent fires would reverse woody thickening and improve conservation values was rejected. Our data suggest that fire more frequent than once every five years is likely to be counterproductive in preventing woody thickening in this ecosystem. We also found that two indicators of conservation value, grass cover (positive) and exotic species richness (negative), were optimised by burning every five years.
Our measurements of scorch height and burn cover might be thought to be consistent with the proposition that an increase in fire frequency in these ecosystems is likely to reduce the intensity of fire because of its effect on fuel hazard. Although this effect is likely to exist (Figure 4), the vegetation that burned in the 2021 fires did so with the same low intensity whether previously burned in 2013 or 2018, indicating that conditions on the day were the major control on intensity. Planned burns tend to be less intense than wildfires because of the restricted range of weather and soil moisture conditions in which they can be implemented [31].
Time since fire showed major effects on grass cover, with five years between fires resulting in the highest cover. Between five and eight years, expansion in shrub and sedge cover and litter cover from the tree layer result in a rapid decline in grass cover from about 80% to less than 40%. Grass cover is important for conservation because it is the grassy component in temperate native grassy vegetation that has been most depleted among major vegetation types in Australia and which supports many threatened plant and animal species [1,5,37]. Five years between fires, with some degree of patchiness, as in our experimental burns, is likely to allow the survival of obligate seeding native shrubs, such as Olearia ramulosa, while preventing them from shading out the grass layer. Five years between fires also appears to be close to optimal for minimizing the number of introduced plant species, including one of the most common herbaceous weeds, Urospermum dalechampii. Five years probably minimises the number of weed species because adventives that colonise after fire are outcompeted by native perennials, while fire-sensitive woody adventives are still in the process of recolonisation.
Bandicoots, one species of which is nationally threatened, appear to benefit from long intervals between fire and fire after a long interval. However, bandicoots were not absent from other burn classes to a degree to cause any worry.
A five-year interval between fires may aid the conservation of most of the native biota, but our data suggest that it might be a medium-term recipe for a transition from grassy woodland to Allocasuarina closed forest, a transition that has taken place in other parts of the Domain [23]. Trees kept thickening after the 2018 burn, although not to the degree that they thickened in the unburned plots, and there was a very slight decline in the Allocasuarina basal area, reversed in the following year (Table 3). Thus, effects of a five-year interval between fires on basal area were ephemeral. These results contrasted markedly with the changes caused to the 2020 basal areas by the 2021 burn, which was a marked decrease in total and Allocasuarina basal area in the once-burned plots, whether burned in 2018 or 2021, and close to stability for the unburned and twice-burned plots. In particular, the significant difference in change in basal area between 2020 and 2021 between the twice-burned and the 2021-only burned plots needs further exploration, as it could have been expected that more burning would result in greater decline, rather than less. An explanation for this apparent paradox may lie in the relative characteristics of the two burn types in 2020. Those plots burned only in 2021 had significantly more litter cover and total basal area in 2020 than those burned in 2018 and 2021. Although the effect of higher litter cover can be discounted by the lack of difference in fire intensity indicators, the denser tree layer may have resulted in more death in small groups of trees through increased lateral heat transfer. These trees may also have been stressed by moisture competition, which increases with basal area and makes trees more susceptible to death after fire. Whatever the cause of the difference, it is apparent that burning at an interval of three years is less likely to solve the thickening problem in this vegetation type than burning after 8 years.
It may be that infrequent (five-to-ten-year intervals), severe fire followed by high grazing pressure might be effective in preventing a resurgence of Allocasuarina, which is usually top-killed in such fires. Resprouts from Allocasuarina tree bases, roots and seedlings can be heavily grazed, particularly by introduced rabbits [29] and sheep [8], but also by macropods [30]. It may be that the grazing pressure on the Domain is insufficient to cause the suppression of tree regeneration that has occurred with the combination of grazing and fire in sheep grazing runs [8] and in Maria Island National Park [38]. The density of macropod scats was an order of abundance less than that seen in similar vegetation not surrounded by urban development [30]. Macropods and sheep were absent from the Domain during the late twentieth century (1974 -2000, observations of J.B.K.), the former having recently returned, either by infiltration through suburbia in an era when dogs are kept indoors at night or by release from domestication. The population size may be limited by the busy roads to the east and west of the Domain, as macropods have failed to develop much road sense.
5. Implications
The prevention of further thickening of Allocasuarina on the Domain seems best achieved by the continuation of the mechanical removal program currently underway by Hobart City Council, which, in our data, reduced shrub layer cover but not basal area. The prevention of recruitment to the tree layer will maintain the openness of the tree canopy. The maximisation of the grassiness of the grassy woodland ecosystem requires burning at an interval of 4–6 years. To maintain the full range of native species on the Domain, patchiness in burning or longer intervals in some compartments will be necessary. The combination of mechanical removal and half-decadal planned burning has the potential to return the vegetation of the Domain to a previous state. It could lead to the landscape of the early 19th century, consisting of scattered large eucalypts, with occasional mature small trees, including Allocasuarina, over an understorey of native grasses, sedges and herbs [28].
One implication of our work for the more general problem of woody thickening in global ecosystems [39,40] is that local contingencies, such as low-herbivore populations, need to be taken into account when determining appropriate management regimes to maintain conservation values. The counter-intuitive lesser effects on woody thickening of two fires in three years compared to one at the end of the period that we observed indicate a need to consider cumulative effects of fires on fuel cycles and tree mortality.
Author Contributions
Project design, J.B.K.; data collection, J.B.K., I.J; data analysis, J.B.K.; mapping, I.J; writing up, J.B.K., I.J. All authors have read and agreed to the published version of the manuscript.
Funding
This research was assisted by a small grant from the Hobart City Council.
Data Availability Statement
Not applicable.
Acknowledgments
This work was supported financially and in kind by the Hobart City Council. We thank Elise Jeffery for suggesting that we undertake this work, providing a framework for inquiry and for help with practical matters, Tom Guy, who helped J.B.K. collect the data in 2018, Julie Fielder, who helped J.B.K. collect data in 2019 and Ellen-Rose Sorenson, who helped J.B.K. and I.J. collect data in 2020.
Conflicts of Interest
The authors declare no conflict of interest.
References
- Kirkpatrick, J.B.; Gilfedder, L.; Fensham, R. City Parks and Cemeteries: Tasmania’s Grassy Heritage; Tasmanian Conservation Trust: Hobart, Australia, 1988. [Google Scholar]
- Hobbs, R.J.; Yates, C.J. Temperate Eucalypt Woodlands in Australia: Biology, Conservation, Management and Restoration, 1st ed.; Chipping Norton: Surrey Beatty, Australia, 2000. [Google Scholar]
- Tremont, R.M.; McIntyre, S. Natural Grassy Vegetation and Native Forbs in Temperate Australia: Structure, Dynamics and life histories. Aust. J. Bot. 1994, 42, 641–658. [Google Scholar] [CrossRef]
- Prober, S.M.; Thiele, K.R. Conservation of the grassy white box Woodlands: Contributions of size and disturbance to floristic composition and diversity of remnants. Aust. J. Bot. 1995, 43, 349–366. [Google Scholar] [CrossRef]
- McIntyre, S.; McIvor, J.G.; Heard, K.M. Managing & Conserving Grassy Woodlands; CSIRO Publishing: Collingwood, Australia, 2002. [Google Scholar]
- Bond, W.J.; Archibald, S. Confronting complexity: Fire policy choices in South African savanna parks. Int. J. Wildland Fire 2003, 12, 381–389. [Google Scholar] [CrossRef]
- Fensham, R.J.; Kirkpatrick, J.B. Eucalypt forest-grassland/grassy woodland boundary in central Tasmania. Aust. J. Bot. 1992, 40, 123–138. [Google Scholar] [CrossRef]
- Kirkpatrick, J.B.; Bridle, K.L. People, Sheep and Nature Conservation: The Tasmanian Experience; CSIRO Publishing: Collingwood, Australia, 2007. [Google Scholar]
- Landsberg, J.; Wylie, F.R. Water stress, leaf nutrients and defoliation: A model of dieback of rural eucalypts. Aust. J. Ecol. 1983, 8, 27–41. [Google Scholar] [CrossRef]
- Reid, N.; Landsberg, J. Tree decline in agricultural landscapes: What we stand to lose. In Temperate Eucalypt Woodlands in Australia: Biology, Conservation, Management and Restoration; Hobbs, R.J., Yates, C.J., Eds.; Surrey Betty: Sydney, Australia, 2000; pp. 127–166. [Google Scholar]
- Kirkpatrick, J.B.; Zacharek, A.; Chappell, K. Testing methods for mitigation of tree dieback in Tasmanian dry eucalypt forests and woodlands. Pac. Conserv. Biol. 2000, 6, 94–101. [Google Scholar] [CrossRef]
- MacDonald, M.; Kirkpatrick, J.B. Explaining bird species composition and richness in eucalypt-dominated remnants in subhumid Tasmania. J. Biogeogr. 2003, 30, 1415–1426. [Google Scholar] [CrossRef]
- Yates, C.J.; Norton, D.A.; Hobbs, R.J. Grazing effects on plant cover, soil and microclimate in fragmented woodlands in south-western Australia: Implications for restoration. Aust. Ecol. 2000, 25, 36–47. [Google Scholar] [CrossRef]
- McIntyre, S.; Lavorel, S. How environmental and disturbance factors influence species composition in temperate Australian grasslands. J. V. Sci. 1994, 5, 373–384. [Google Scholar] [CrossRef]
- Bennett, L.T. The expansion of Leptospermum laevigatum on the Yanakie Isthmus, Wilson’s Promontory, under changes in burning and grazing regimes. Aust. J. Bot. 1994, 42, 555–564. [Google Scholar]
- Archer, S.; Schimel, D.S.; Holland, E.A. Mechanisms of shrubland expansion: Land use, climate or CO2? Clim. Chang. 1995, 29, 91–99. [Google Scholar] [CrossRef]
- Fensham, R.J.; Fairfax, R.J. The disappearing grassy balds of the Bunya Mountains, south-eastern Queensland. Aust. J. Bot. 1996, 44, 543–558. [Google Scholar] [CrossRef]
- Mast, J.N.; Veblen, T.T.; Hodgson, M.E. Tree invasion within a pine/grassland ecotone: An approach with historic aerial photography and GIS modelling. For. Ecol. Manag. 1997, 93, 181–194. [Google Scholar] [CrossRef]
- Bartolome, J.; Franch, J.; Plaixats, J.; Seligman, N.G. Grazing alone is not enough to maintain landscape diversity in the Montseny Biosphere Reserve. Agric. Ecosyst. Environ. 2000, 77, 267–273. [Google Scholar] [CrossRef]
- Briggs, J.M.; Knapp, A.K.; Brock, B.L. Expansion of woody plants in tall grass prairie: A fifteen-year study of fire and fire-grazing interactions. Am. Midl. Nat. 2002, 147, 287–294. [Google Scholar] [CrossRef]
- Eckhardt, C.H.; Wilgen, W.B.; Biggs, C.H. Trends in woody vegetation cover in the Kruger National Park, South Africa between 1940 and 1998. Afr. J. Ecol. 2000, 38, 108–115. [Google Scholar] [CrossRef]
- Lunt, I. Allocasuarina (Casuarinaceae) Invasion of an Unburnt Coastal Woodland at Ocean Grove, Victoria: Structural Changes 1971–1996. Aust. J. Bot. 1998, 46, 649–656. [Google Scholar] [CrossRef] [Green Version]
- Kirkpatrick, J. Vegetation change in an urban grassy woodland 1974–2000. Aust. J. Bot. 2004, 52, 597–608. [Google Scholar] [CrossRef]
- Bond, W.J.; Midgley, G.F. A proposed CO2-controlled mechanism of woody plant invasion in grasslands and savannas. Glob. Chang. Biol. 2000, 6, 865–869. [Google Scholar] [CrossRef]
- Murphy, B.P.; Lehmannn, C.E.R.; Russell-Smith, J. Fire regimes and woody biomass dynamics in Australian savannas. J. Biogeogr. 2014, 41, 133–144. [Google Scholar] [CrossRef]
- Close, D.C.; Davidson, N.J.; Johnson, D.W.; Abrams, M.D.; Hart, S.C.; Lunt, I.D.; Archibald, R.D.; Horton, B.; Adams, M.A. Premature Decline of Eucalyptus and Altered Ecosystem Processes in the Absence of Fire in Some Australian Forests. Bot. Rev. 2009, 75, 191–202. [Google Scholar] [CrossRef]
- Kirkpatrick, J.B.; Gilfedder, L.; Duncan, F.; Wapstra, M. Frequent planned fire can prevent succession to woody plant dominance in montane temperate grasslands. Austral Ecol. 2020, 45, 872–879. [Google Scholar]
- Sorensen, E.-R.; Kirkpatrick, J.B. Vegetation change in an urban grassy woodland since the early nineteenth century. Pap. Proc. R. Soc. Tasman. 2021, 155, 37–54. [Google Scholar] [CrossRef]
- Cooke, B.D. The effects of rabbit grazing on regeneration of sheoaks, Allocasuarina verticillata, and saltwater ti-trees, Melaleuca halmaturorum, in the Coorong National Park, South Australia. Aust. J. Ecol. 1987, 13, 11–20. [Google Scholar] [CrossRef]
- Hazeldine, A.; Kirkpatrick, J.B. Practical and theoretical implications of a browsing cascade in Tasmanian forest and woodland. Aust. J. Bot. 2015, 63, 135–143. [Google Scholar] [CrossRef]
- Marsden-Smedley, J.B. Planned Burning in Tasmania: Operational Guidelines and Review of Current Knowledge; Parks and Wildlife Service, DPIPWE: Hobart, Australia, 2009. [Google Scholar]
- Kirkpatrick, J.B.; Marks, F. Observation of drought damage to some native plant species in eucalypt forests and woodlands near Hobart, Tasmania. Pap. Proc. R. Soc. Tasm. 1985, 119, 15–21. [Google Scholar] [CrossRef]
- Kirkpatrick, J.B.; Gilfedder, L. Conserving weedy natives: Two Tasmanian endangered herbs in the Brassicaceae. Aust. J. Ecol. 1998, 23, 466–473. [Google Scholar] [CrossRef]
- Land Tasmania. TASMAP 1:5 000 Orthophoto Map Index; Department of Natural Resource and Environment Tasmania: Tasmania, Australia, 2015. [Google Scholar]
- Kirkpatrick, J. The viability of bush in cities—ten years of change in an urban grassy woodland. Aust. J. Bot. 1986, 34, 691–708. [Google Scholar] [CrossRef]
- Minitab 18 Statistical Software; Minitab, Inc.: State College, PA, USA, 2021.
- Kirkpatrick, J.B. The status of lowland temperate grasslands in south-eastern Australia. In Management of Relict Lowland Grasslands; Sharp, S., Rehwinkel, R., Eds.; Conservation Series; ACT Parks and Conservation Service: Canberra, Australia, 1995; Volume 8, pp. 75–79. [Google Scholar]
- Ingram, J.; Kirkpatrick, J.B. Native vertebrate herbivores facilitate native plant dominance in old fields while preventing native tree invasion-implications for threatened species. Pac. Conserv. Biol. 2013, 19, 331–342. [Google Scholar] [CrossRef]
- Stevens, N.; Lehmann, C.E.; Murphy, B.P.; Durigan, G. Savanna woody encroachment is widespread across three continents. Glob. Chang. Biol. 2017, 23, 235–244. [Google Scholar] [CrossRef] [Green Version]
- García Criado, M.; Myers-Smith, I.H.; Bjorkman, A.D.; Lehmann, C.E.R.; Stevens, N. Woody plant encroachment intensifies under climate change across tundra and savanna biomes. Glob. Ecol. Biogeogr. 2020, 29, 925–943. [Google Scholar] [CrossRef]


Publisher’s Note: MDPI stays neutral with regard to jurisdictional claims in published maps and institutional affiliations. |
© 2022 by the authors. Licensee MDPI, Basel, Switzerland. This article is an open access article distributed under the terms and conditions of the Creative Commons Attribution (CC BY) license (https://creativecommons.org/licenses/by/4.0/).