Article

Real-Time Forest Fire Detection Framework Based on Artificial Intelligence Using Color Probability Model and Motion Feature Analysis

1
Departemen of Computer Science and Electronics, Universitas Gadjah Mada, Yogyakarta 55281, Indonesia
2
Faculty of Informatics, Institut Teknologi Telkom Purwokerto, Purwokerto 53147, Indonesia
3
School of Computing, Telkom University, Bandung 40257, Indonesia
4
Department of Electrical Engineering, University of Ulsan, Ulsan 680749, Korea
*
Author to whom correspondence should be addressed.
Submission received: 31 December 2021 / Revised: 5 February 2022 / Accepted: 10 February 2022 / Published: 12 February 2022
(This article belongs to the Section Fire Science Models, Remote Sensing, and Data)

Abstract

:
As part of the early warning system, forest fire detection has a critical role in detecting fire in a forest area to prevent damage to forest ecosystems. In this case, the speed of the detection process is the most critical factor to support a fast response by the authorities. Thus, this article proposes a new framework for fire detection based on combining color-motion-shape features with machine learning technology. The characteristics of the fire are not only red but also from their irregular shape and movement that tends to be constant at specific locations. These characteristics are represented by color probabilities in the segmentation stage, color histograms in the classification stage, and image moments in the verification stage. A frame-based evaluation and an intersection over union (IoU) ratio was applied to evaluate the proposed framework. Frame-based evaluation measures the performance in detecting fires. In contrast, the IoU ratio measures the performance in localizing the fires. The experiment found that the proposed framework produced 89.97% and 10.03% in the true-positive rate and the false-negative rate, respectively, using the VisiFire dataset. Meanwhile, the proposed method can obtain an average of 21.70 FPS in processing time. These results proved that the proposed method is fast in the detection process and can maintain performance accuracy. Thus, the proposed method is suitable and reliable for integrating into the early warning system.

1. Introduction

Indonesia is one of the countries with the largest forest area globally. According to the World Bank, the forest area in Indonesia was reported at 49.1% in 2020 [1]. Therefore, Indonesia always experiences forest fires every year in various regions. The government has taken many strategies to reduce the occurrence of forest fires, especially early fire detection [2]. However, these strategies have not fully utilized artificial intelligence to the best of our knowledge. Therefore, an early warning system based on artificial intelligence is needed to detect fire in a forest area.
Fire detection is one of the essential modules in an early warning system, which is used to identify abnormal events in a monitoring area. Fire detectors are used to provide the earliest possible warning of a fire. Conventional fire detectors currently use smoke and temperature sensors. If the sensor is placed in an open and wide area such as a forest, densely populated settlements, and roads, it will be less effective and cost a significant amount of money. In addition, conventional fire detectors have problems regarding delays and alarm sound errors. In other words, the utilization of camera monitoring is currently increasing to ensure citizens’ safety. Therefore, it is possible for Closed Circuit Television (CCTV) cameras to detect fires using digital image processing and computer vision technology, referred to as image-based fire detection. The advantages of image-based fire detection compared to conventional fire detectors can be placed in an open and wide area so that the costs incurred can be cheaper.
Image-based fire detection is strongly influenced by the features used to distinguish fire from other objects. Two types of features are often used to detect fire: handcrafted features and non-handcrafted features. Handcrafted features are designed with predetermined rules. Examples of these features are motion, shape, color, and texture. Meanwhile, non-handcrafted features are obtained directly from the neural network layers.
Several previous researchers carried out fire detection only by color reference. The characteristic of fire with a reddish-yellow color is considered to distinguish fire from other objects. In [3,4], the Red, Green, Blue (RGB) values of the images were analyzed. The object with the highest R-value component was determined as a fire area candidate. Other color spaces can also be used as a reference for detecting fire. For example, the YCbCr color space is used by [5]. In that study, YCbCr was able to overcome the weakness of RGB. YCbCr can detect fire in images with significant changes in illumination, which is difficult for RGB.
If only referring to color features, objects with a red color can also be detected as fire. Some researchers add motion as a reference for fire detection. In [6,7], background subtraction was used to determine the movement of objects between frames. Objects that move and have a predominant color of red are detected as fire. The addition of motion rules is done by [8,9]. Not all moving and red objects are detected as fire, but objects with specific motions resemble sparkling fire. This method minimizes false positives on ordinary moving objects that are red.
Several other studies combine more than two features to perform fire detection. In [10,11], in addition to color and motion, wavelet domain analysis was also used in detecting fire. In [12], they used color, motion, and shape as features. Some of these combined features then become the input of a classifier model. In [10], they applied a voting system, while [11] used a Support Vector Machine (SVM), and [12] used a Multi Expert System (MES).
Several recent studies have used non-handcrafted features for fire detection. For example, in [13], the deep learning architecture used is a Convolutional Neural Network (CNN), while [14] uses SqueezeNet, and [15] uses You Only Look Once v3 (YOLOv3). Deep learning architecture is also used to overcome the problem of few data, as was done [16] by implementing the Generative Adversarial Network (GAN). The results of fire detection accuracy using non-handcrafted features are relatively better than the fire detection accuracy using handcrafted features. However, non-handcrafted features generally have a longer computational time than handcrafted characteristics.
The other researchers tried to combine handcrafted and non-handcrafted features for fire detection. For example, in [17], they combined motion features with CNN architecture, while [18] combines color features with Faster R-CNN architecture, and [19] combined flicker detection with CNN architecture. Combining two features can achieve high detection accuracy but requires a longer computational time.
Our goal was to integrate the fire detection module into a CCTV-based early warning system (EWS). In the EWS, the speed of the process is crucial in responding quickly to any detected abnormal events. Because of this requirement, the integrated fire detection module must run in real-time but still maintain performance. Therefore, this study proposed a real-time fire detection based on a combination of novel color-motion features and machine learning to achieve real-time processing and high accuracy in performance. Overall, the main contributions of the work are summarized as follows:
  • Introducing the use of a color probability model based on the Gaussian Mixture Model for segmenting the fire region, which can handle any illumination condition.
  • Proposing simple motion feature analysis of fire detection, which reduces the false-positive rate.
  • Integrating classification-based fire verification to make decision steps more effective and efficient in localizing the fire region.
  • Introducing the new evaluation protocol and annotation for fire detection evaluation based on the intersection over union (IoU) rate.

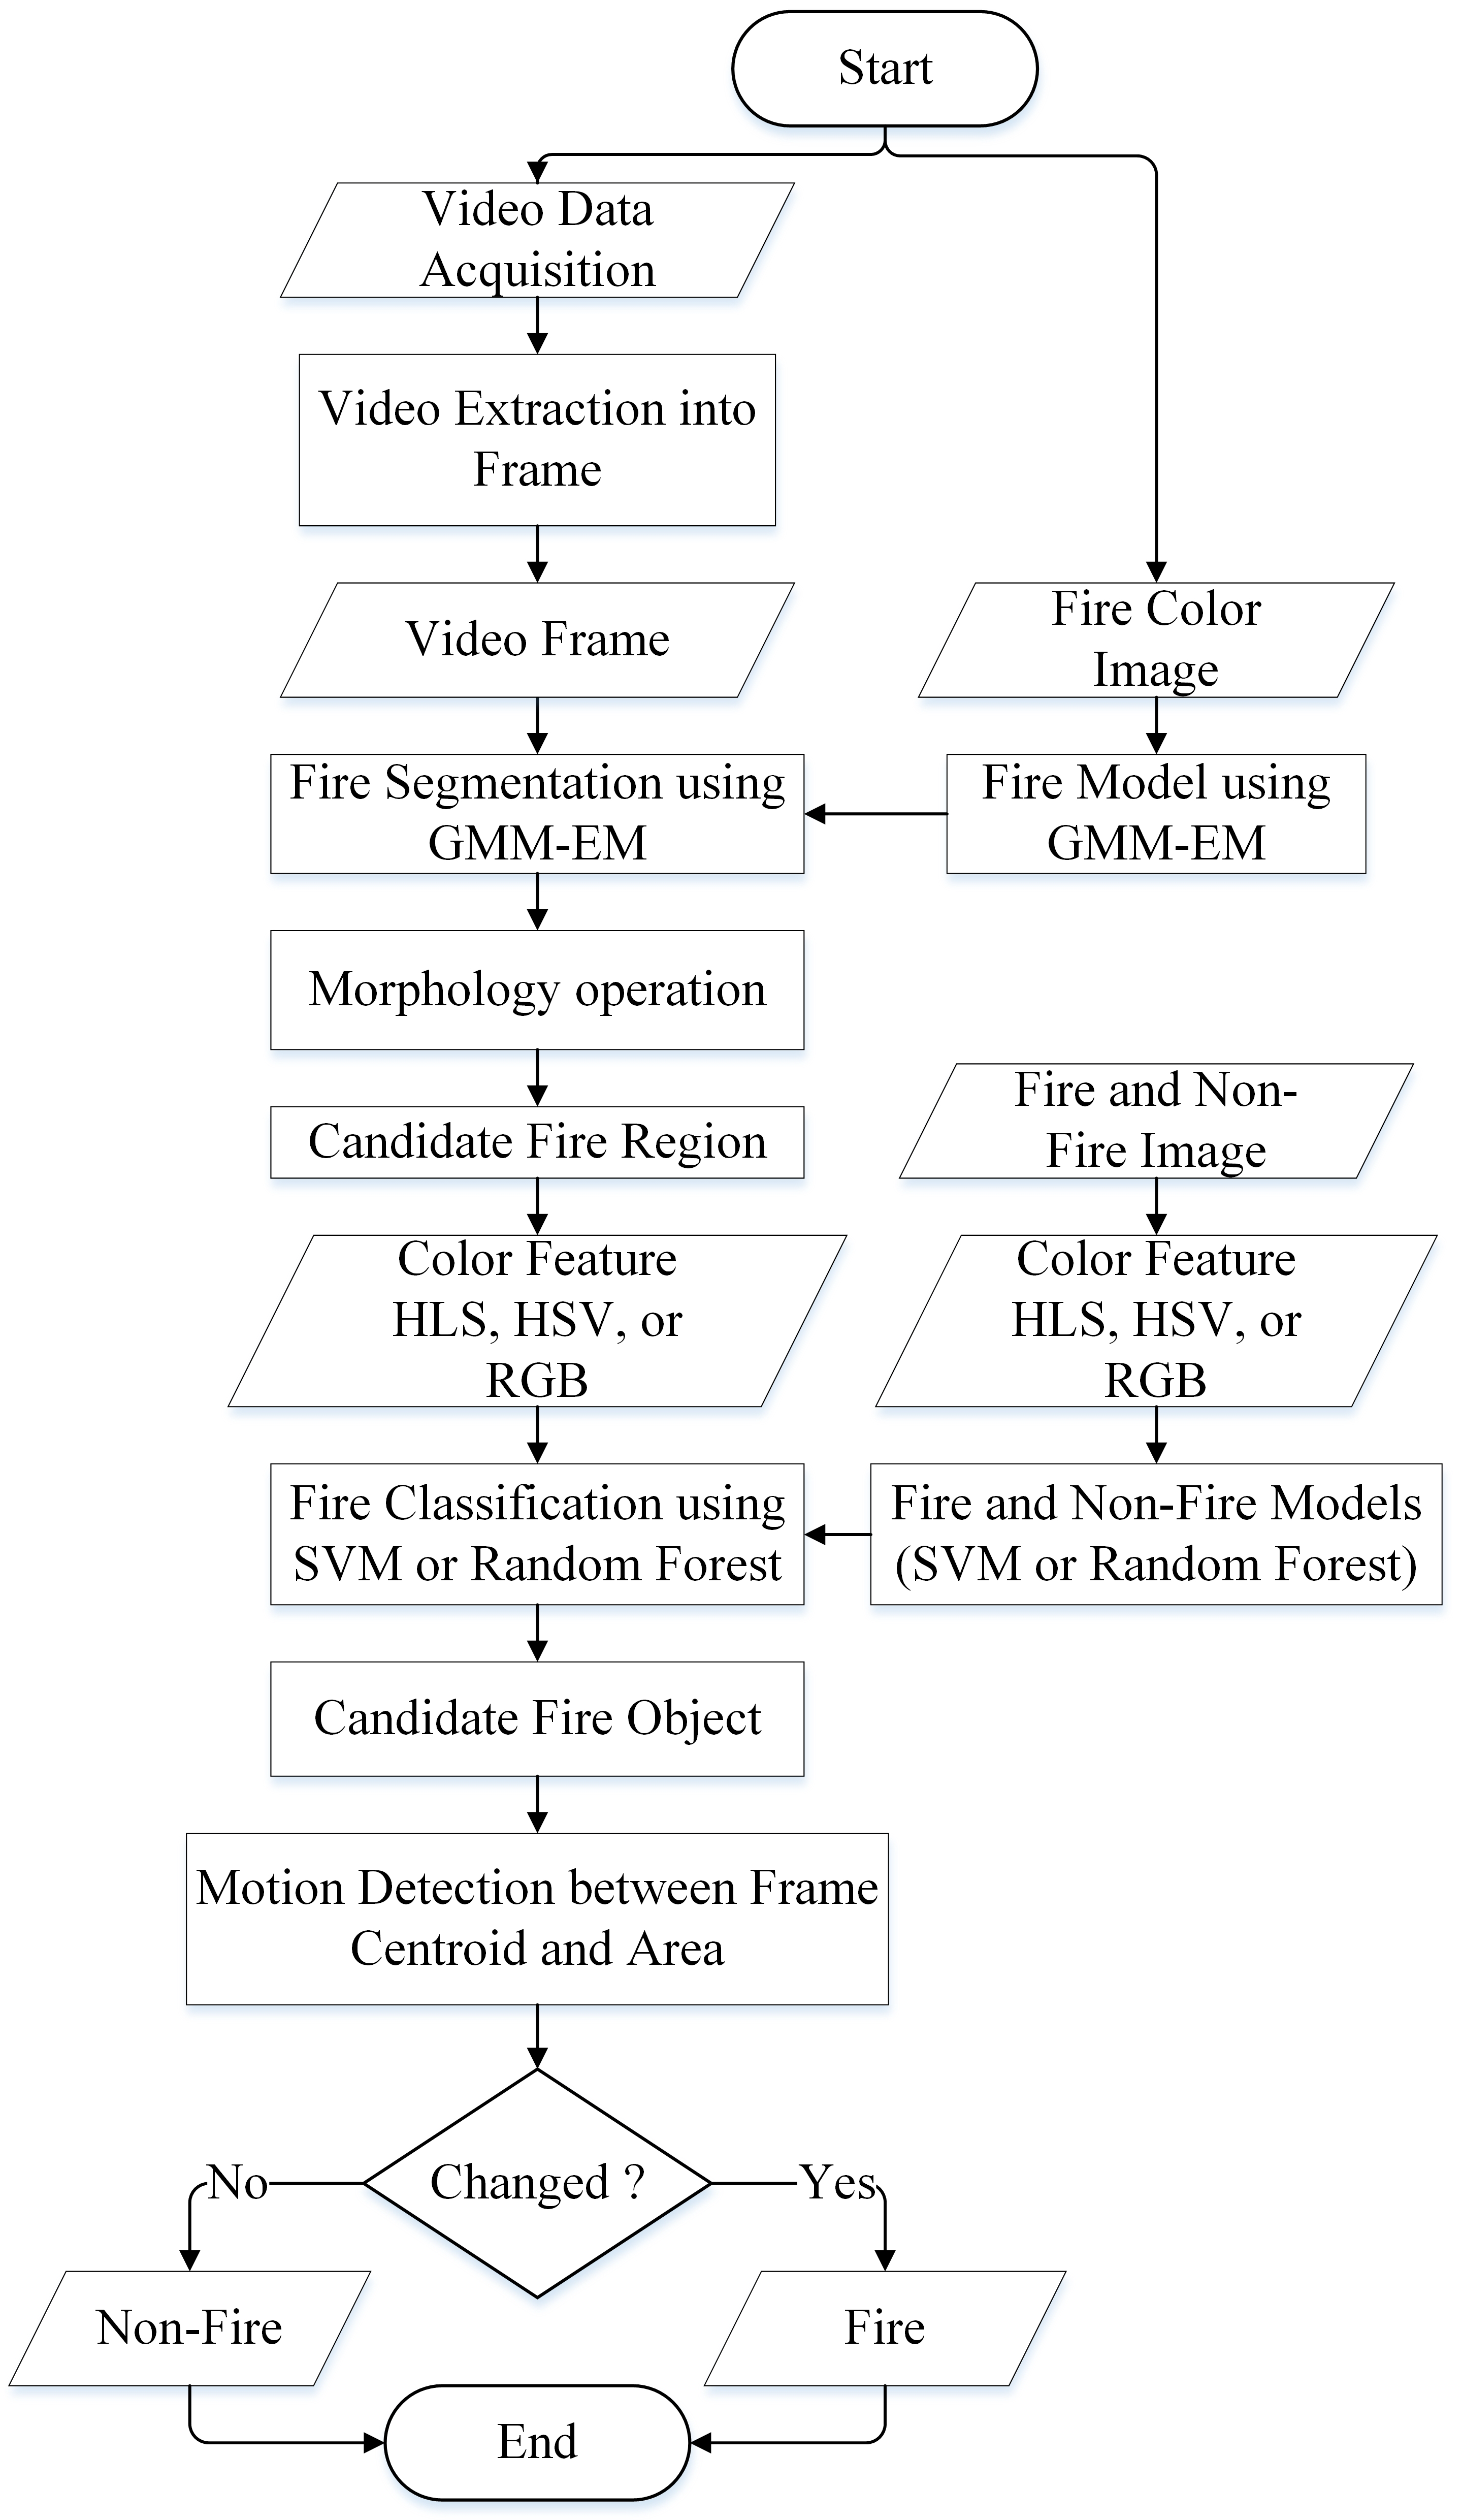
2. The Proposed Framework

The fire detection system starts by forming a color probability model for the segmenting fire region using the Gaussian Mixture Model and Expectation Maximization (GMM-EM) methods. Then, the model is trained based on a dataset containing varying fire colors. This model would find the fire region candidates in the video frames extracted from the video input. After obtaining the candidates, the machine learning strategies were performed for verifying them based on the color histogram (e.g., HSV, YCbCr, or RGB). This research utilized two machine learning methods: support vector machine (SVM) and random forest (RF). SVM is used because of its ability to classify an object into two classes linearly. On the other hand, RF was chosen because of its ability to combine color and motion features in object classification. However, these two methods will be compared in implementation to obtain the most optimal framework. Lastly, further verification was then conducted by checking the motion of fire regions. The fire motion was measured according to the centroid and the area of the region. If the method detects irregular motion in a fire region, then this region was assigned as a fire object and vice versa. The detailed proposed framework is shown in Figure 1.

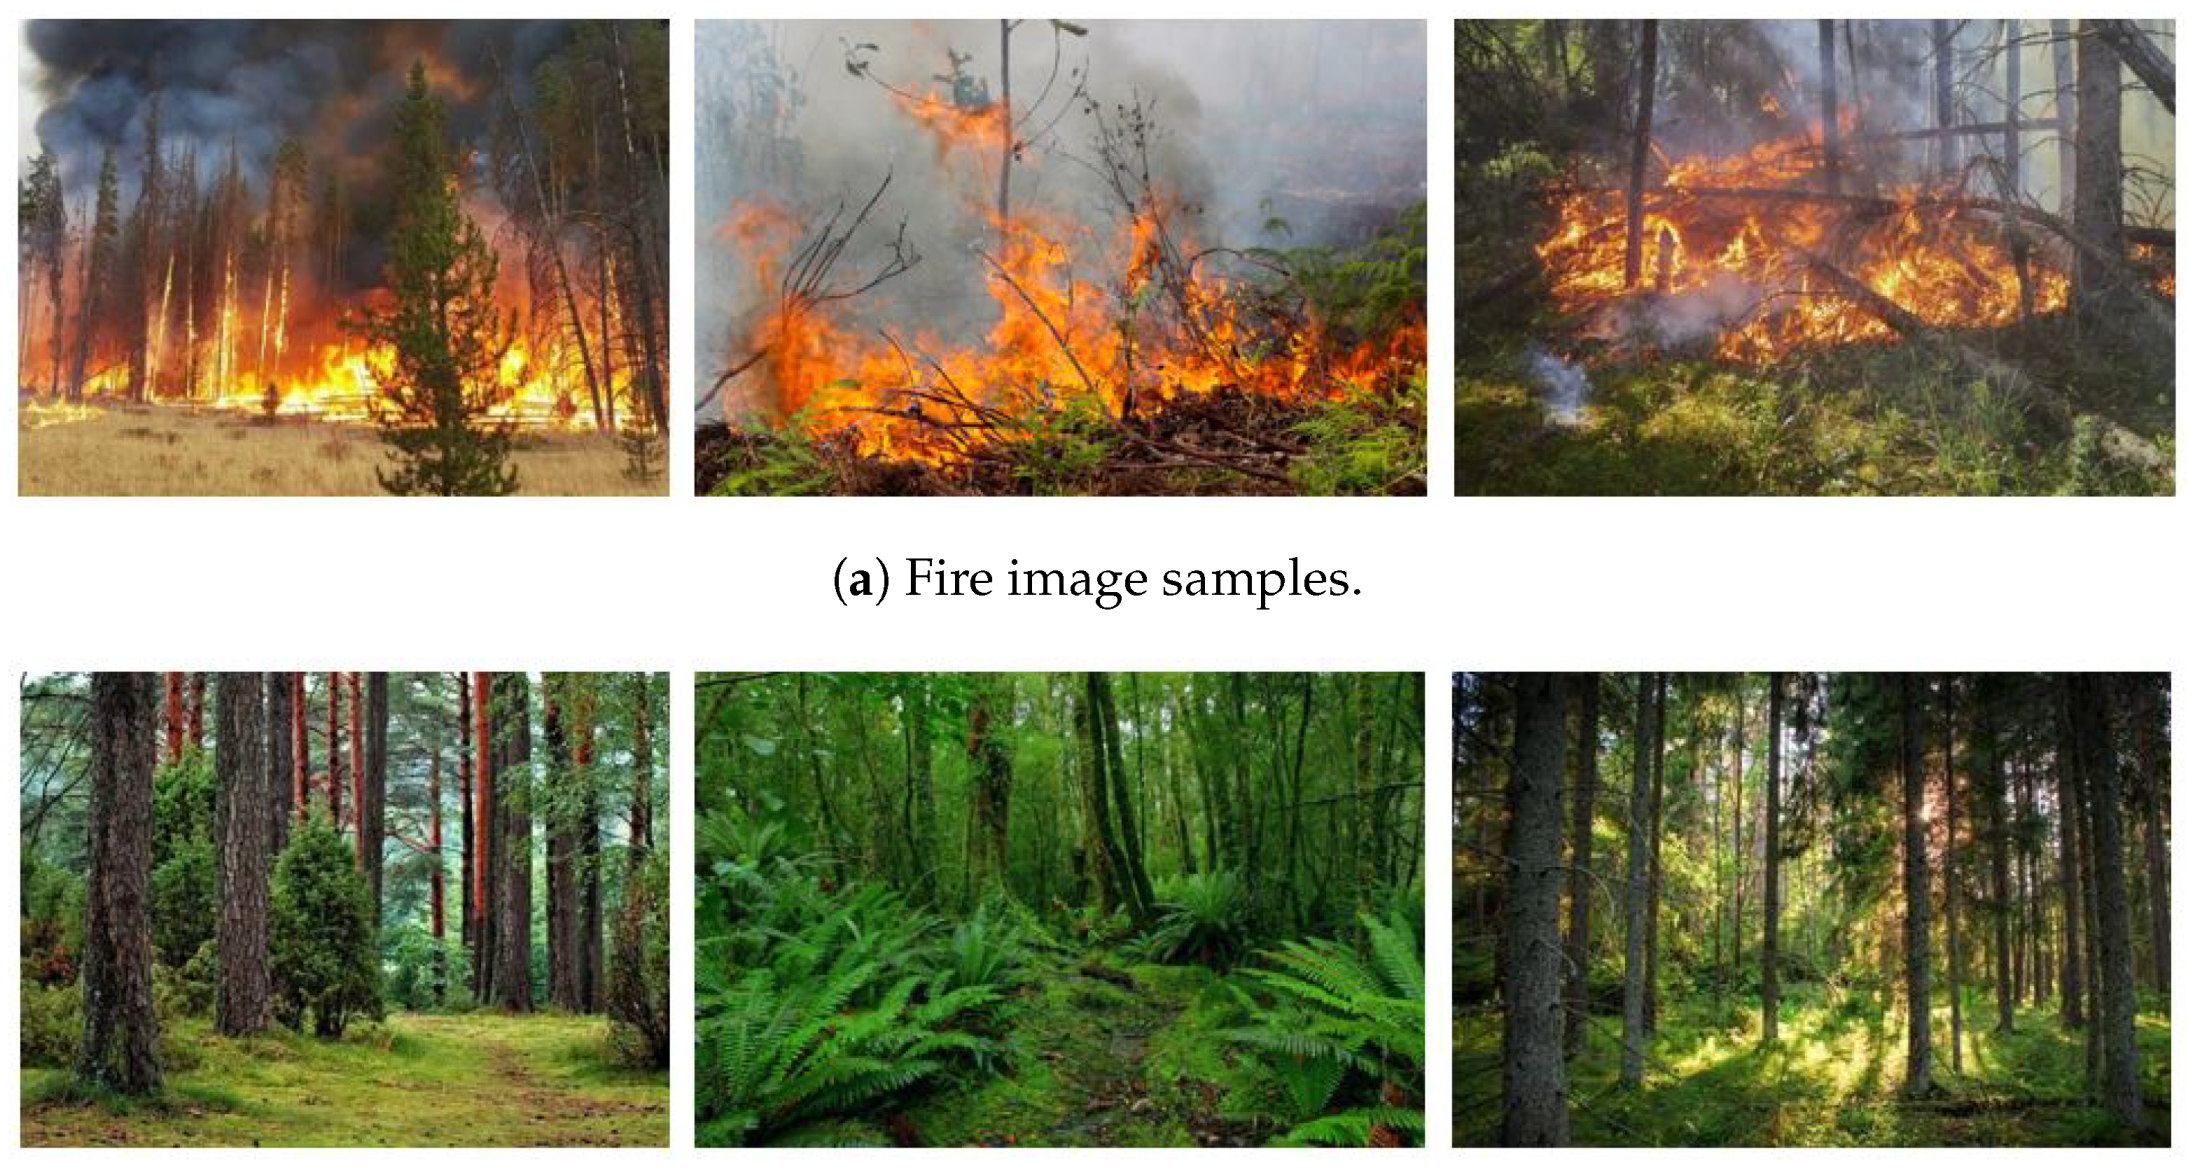
2.1. Training Data Acquisition

In this research, two training datasets were used: the dataset for fire segmentation and fire classification. The dataset for segmentation consisted of 30 images of fire regions in various conditions with the size of 100 × 100 pixels. The features were extracted on this dataset based on the RGB color model for representing the variation in fire colors in the color probability model. Figure 2 shows the selected samples of fire color images used for the segmentation stage. On the other hand, the fire classification stage utilized a dataset consisting of 1124 fire images and 1301 non-fire images created by Jadon et al. [20]. It was produced by capturing photographs of fire and non-fire objects in challenging situations, such as the fire image in the forest and non-fire images with fire-like objects in the background. The dataset was then divided into 80 % and 20 % for training and testing subsets. Figure 3 shows examples of fire and non-fire images in the forest environment.

2.2. Color Probability Modeling

Fire color modeling is the most challenging strategy, as fire usually has various color distributions. Using a single Gaussian and estimating parameters is not optimal for modeling such a dataset. For instance, if we take a dataset with two means numbers of 218 and 250, the average might be around 221, which leads to an accurate estimation. Hence, the color distribution would be represented by multiple clusters [21]. Using the same above instance, a multiple Gaussian with means of 218 and 250 provide a more realistic representation of the color distribution.
Nevertheless, in some scenarios, where multiple datasets with varying numbers of clusters describe the same feature, it is more advisable to use a multivariate Gaussian [22] to model the data across the three sets. It enables us to have a more detailed assessment of how the clusters are distributed over the given data. Equation (1) shows the equation of the multivariate Gaussian.
N ( x | μ , ) = 1 ( 2 π | | ) 0 . 5 e x p { 1 2 ( x μ ) T 1 ( x μ ) }
A multivariate Gaussian [23] was utilized based on three color channels: red, green, and blue. Therefore, fire objects were detected on each color channel according to the number of clusters. Then, the model of the entire image was three-dimensional Gaussian. Finally, the Expectation-Maximization algorithm [24] determined the probability of a pixel belonging to a particular cluster and estimated the means and co-variances.
In addition, the fire object segmentation stage may produce several imperfect regions, i.g., regions with holes. These regions might be challenging to be detected at the classification stage. Therefore, the post-processing step was conducted by applying two morphological operations: closing and dilation operators. The closing operator was used to remove tiny holes in the fire area, while dilation was used to enlarge the size of the fire area. The sample results of these operations can be seen in Figure 4.

2.3. Color-Based Feature Extraction

In this research, three different color models, such as RGB, HSV, and YCbCr, were implemented and compared to determine the optimal model for the fire detection framework. First, the RGB color model consists of red, green, and blue channels. Each channel is a set of pixel intensities with values of 0 to 255. Thus, the number of possible colors for each pixel in the RGB color model is 256 × 256 × 256 = 16,777,216 colors [25]. Second, the HSV model defines color in terms of hue, saturation, and value channels [26]. Hue represents true colors, such as red, violet, and yellow, defining redness, greenness, and others. Saturation represents the purity of a certain color, while value represents the brightness or darkness of the color ranging from between 0 % and 100 % . Third, the YCbCr color model is equivalent to the RGB model. Y is the luma component, describing the brightness. Cb and Cr are the chroma components, representing the ratio of blue and red to green components, respectively. Among these three color models, the HSV model is considered better in representing visual perception by the human sense. In contrast, RGB and YCbCr models are formed by a mixture of primary colors. Therefore, these models are less sensitive to human vision.
Next, a color histogram was generated after extracting the pixel intensity from the image. A color histogram illustrates the distribution of pixel intensities in an image [27]. It can be visualized as a graph (or plot) that depicts the distribution of pixel intensity value. For example, if the RGB color model was used, the histogram of each channel contains 256 bins. We then effectively counted the frequency of each pixel intensity. This color histogram was then utilized as a feature in the classification stage, using a support vector machine or random forest classification as described in the following subsection.

2.4. Fire Object Verification

In the previous stage, the fire region candidates were extracted. However, these regions may not belong to fire objects, which results in misdetection. Hence, the classification stage is required to verify whether the region is a fire or a non-fire object. Two machine learning algorithms were implemented and compared in the experiment, such as support vector machines and random forest.
The support vector machine (SVM) is one of the most popular machine learning algorithms for binary classification [28], as it is relatively straightforward and simple but effective. Technically, the SVM finds the optimal hyperplane that distinguishes the two separated classes by maximizing their distance. This hyperplane is located in the middle of the two classes. For example, in fire detection problems, these two classes are defined as fire and non-fire.
On the other hand, random forest is a widely known technique to develop classification models [29]. The random forest algorithm works by constructing several randomized decision trees, called predictors. First, each predictor is generated by using training sample data. Then, these predictors are aggregated for the final decision based on majority voting [30]. For instance, suppose we generated a Random Forest model with three decision trees and would classify unknown data. The first and the second decision trees classified the data as fire class, while the last decision tree assigned the same data as a non-fire class. Therefore, the data are classified as a fire class in the final decision using majority voting.

2.5. Motion Feature Analysis

Verifying a fire region based solely on the color feature may produce some false positives, e.g., a red-colored non-fire object is classified as a fire object. Besides color, another characteristic of fire is its irregular movement in certain areas. Therefore, a further verification stage was conducted by utilizing the motion feature to reduce false positives. According to [31], the object motion could be represented by image moments. Thus, the image moments, particularly the centroid and the area, were exploited in the experiment. The formula to calculate the centroid and the area is shown in (2).
A r e a = M 00 a n d C e n t r o i d { x ^ , y ^ } = M 10 M 00 , M 01 M 00

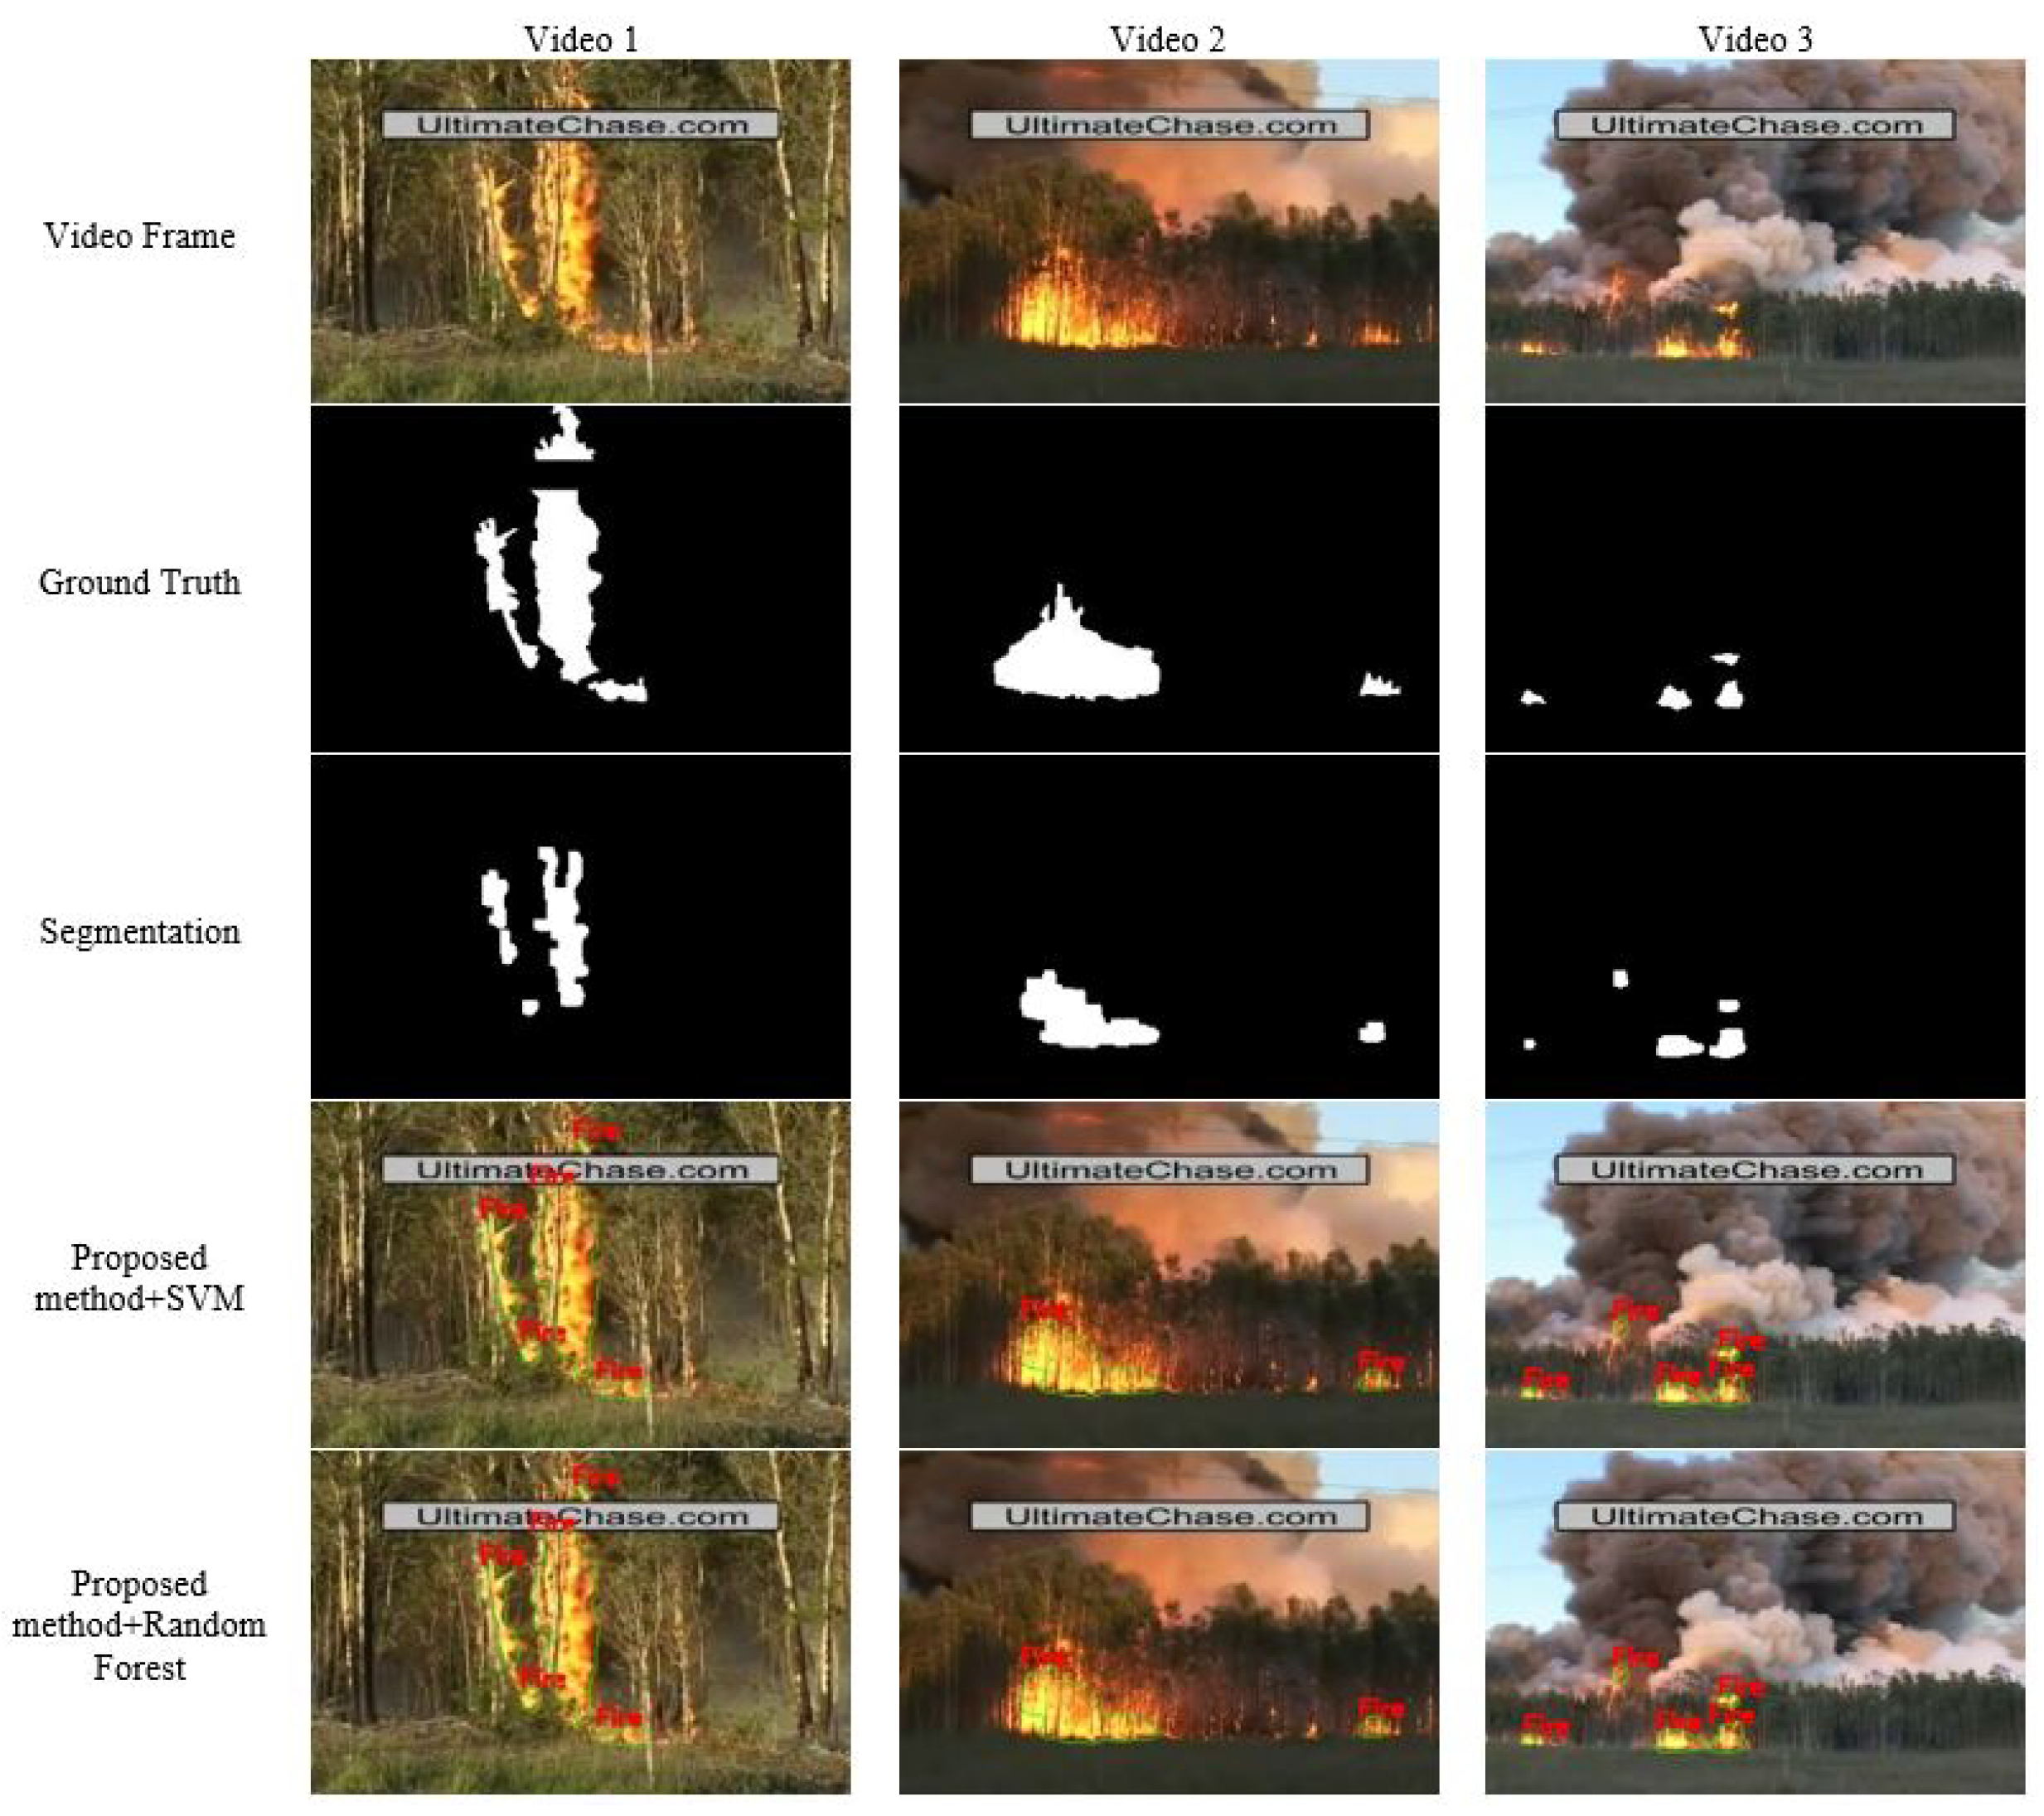
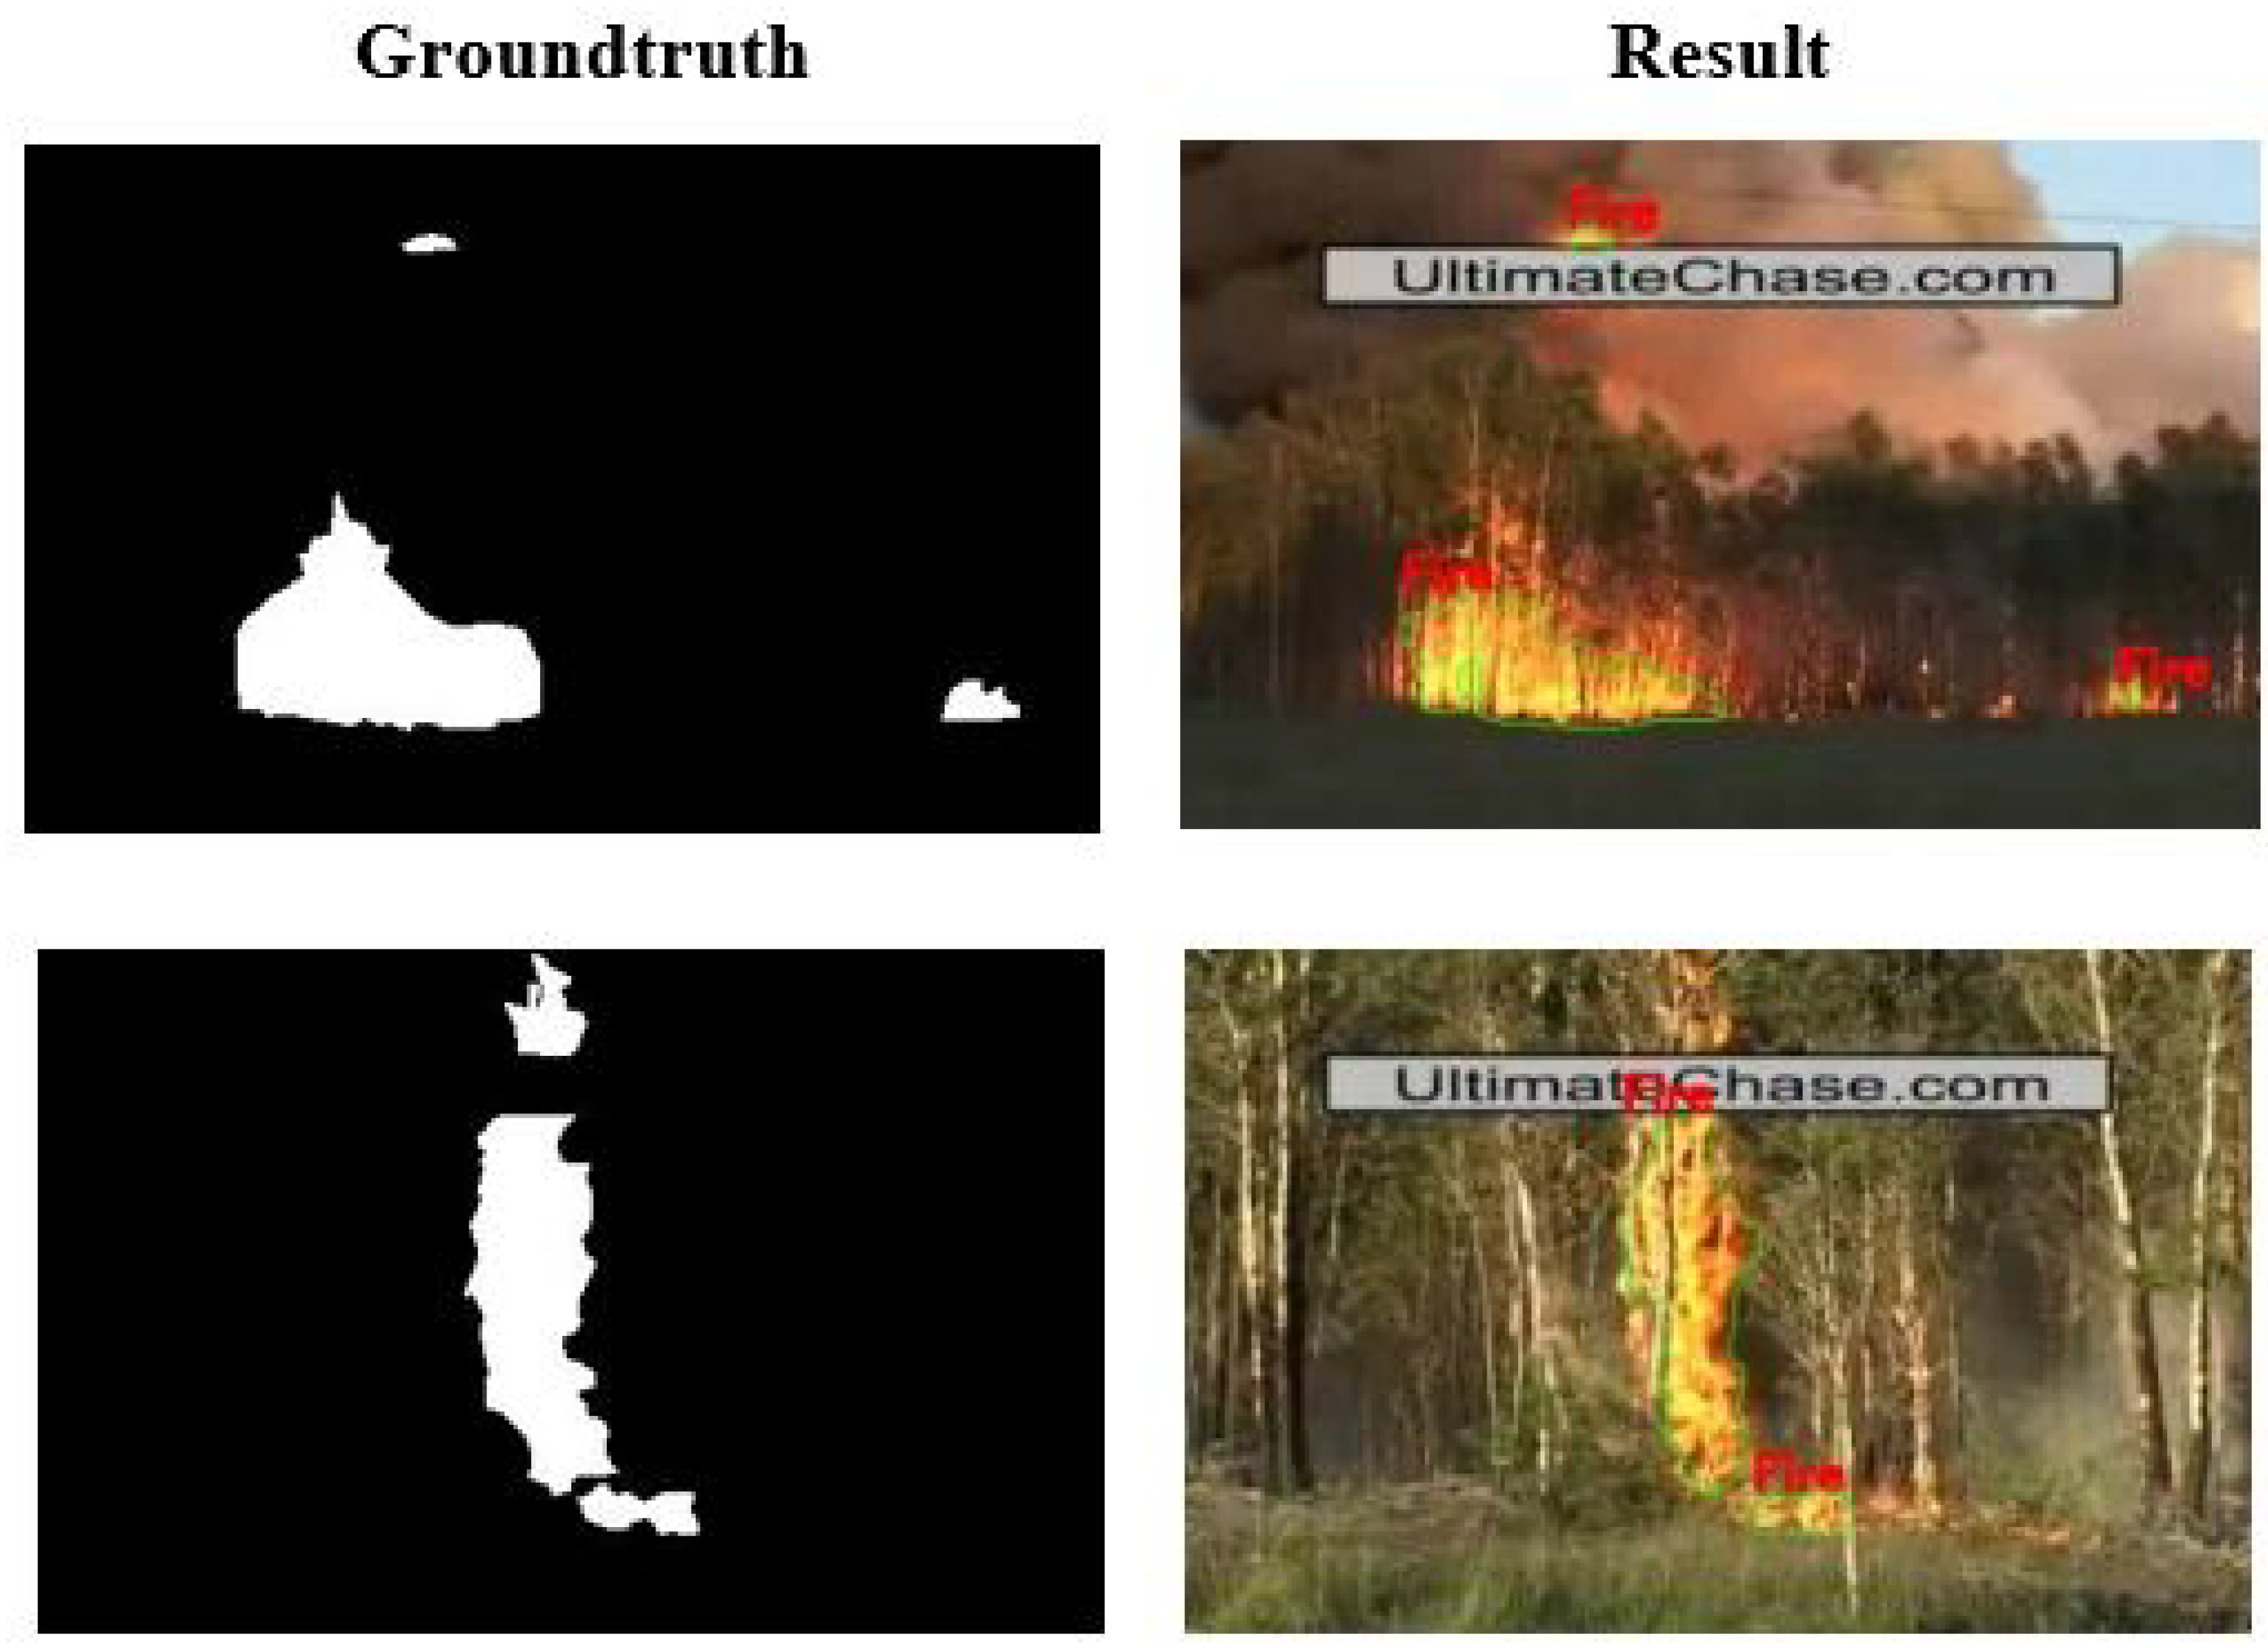
3. Results and Discussion

3.1. Experimental Setting and Protocol Evaluation

The proposed method was tested on several public datasets. The proposed method was implemented using the Python programming language on a Core i3 CPU and 8GB RAM. In the experiment, the true-positive rate (TPR), the true-negative rate (TNR), the false-positive rate (FPR), the false-negative rate (FNR), the intersection over union (IoU) rate, as well as the processing time were evaluated. The TPR is the ratio between the number of correctly detected fire frames and the number of ground truth fire frames. The TNR is the ratio between the number of correctly detected non-fire frames and the number of ground truth non-fire frames. The FPR is the ratio between the number of wrongly detected fire frames and the number of ground truth non-fire frames. Lastly, the FNR is defined as the ratio between the number of improperly detected non-fire frames and the number of ground truth fire frames. The IoU rate evaluated how well the method localizes the fire. TPR and FNR values were used to assess video containing the fire, while TNR and FPR values were used for video without fire. Lastly, the frame rate measures the method’s effectiveness, also referred to as frames per second (FPS).
Our method was evaluated using VisiFire [32], and FireSense [33]. These datasets contain several video sequences of fire and non-fire video. Table 1 shows the detailed information of the evaluated dataset. In training, we collected the fire images from the Internet to model the color probability. To the best of our knowledge, most annotation datasets are based on the presense of fire on the video or frame without knowing its exact location. Thus, a new annotation was proposed based on the fire region location. In addition, we also compared our proposed method with other methods [10,34,35,36] in terms of accuracy and processing time.

3.2. Optimal Parameter Settings

Both fire object segmentation and classification stages require to set hyperparameter. Thus, this part describes how to obtain the optimal parameter for both stages.

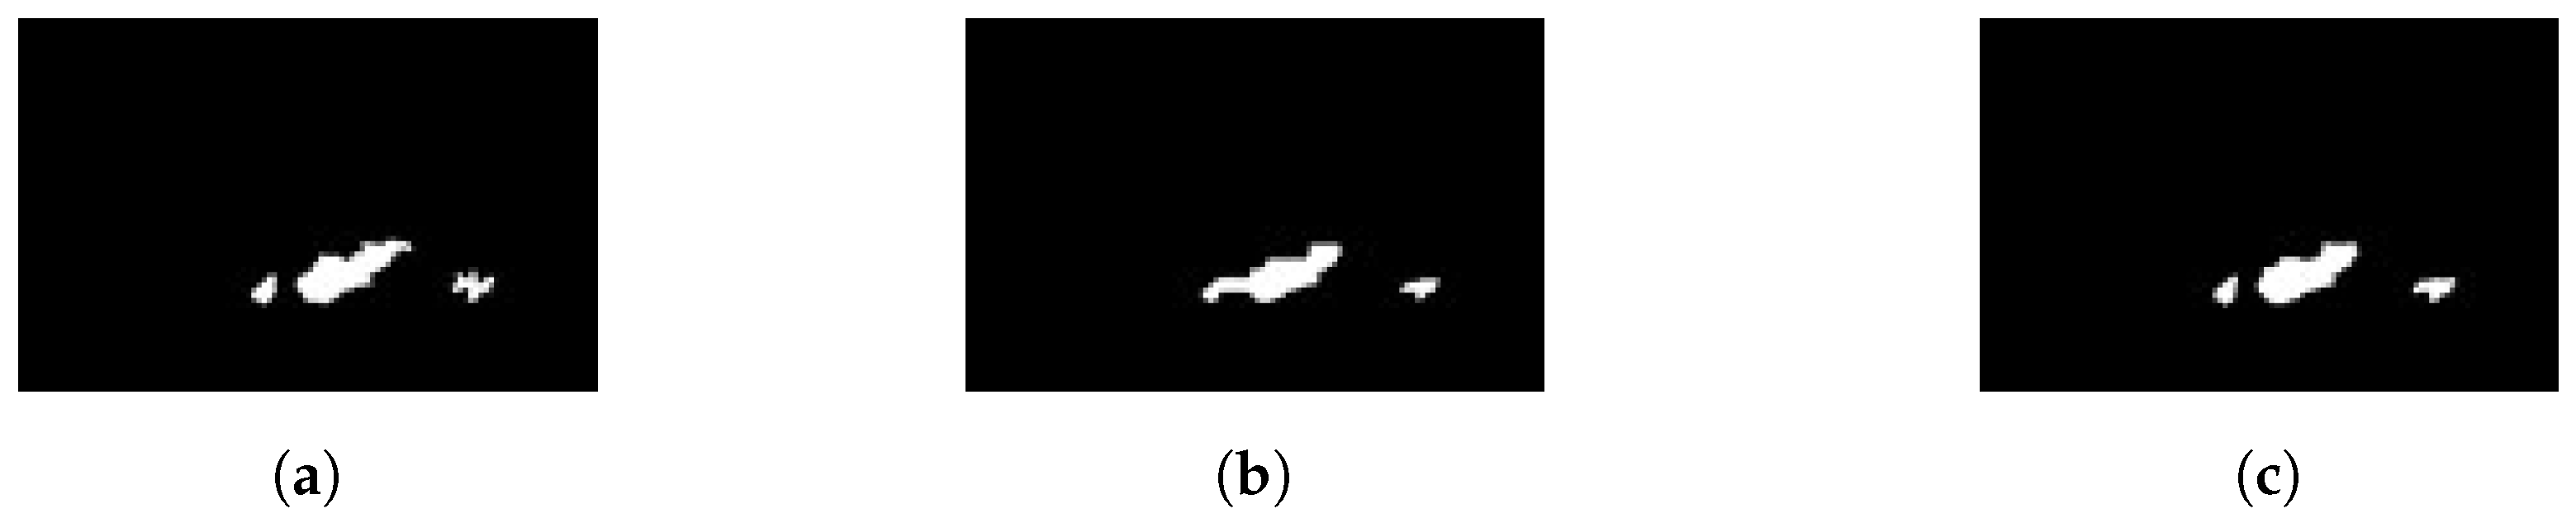
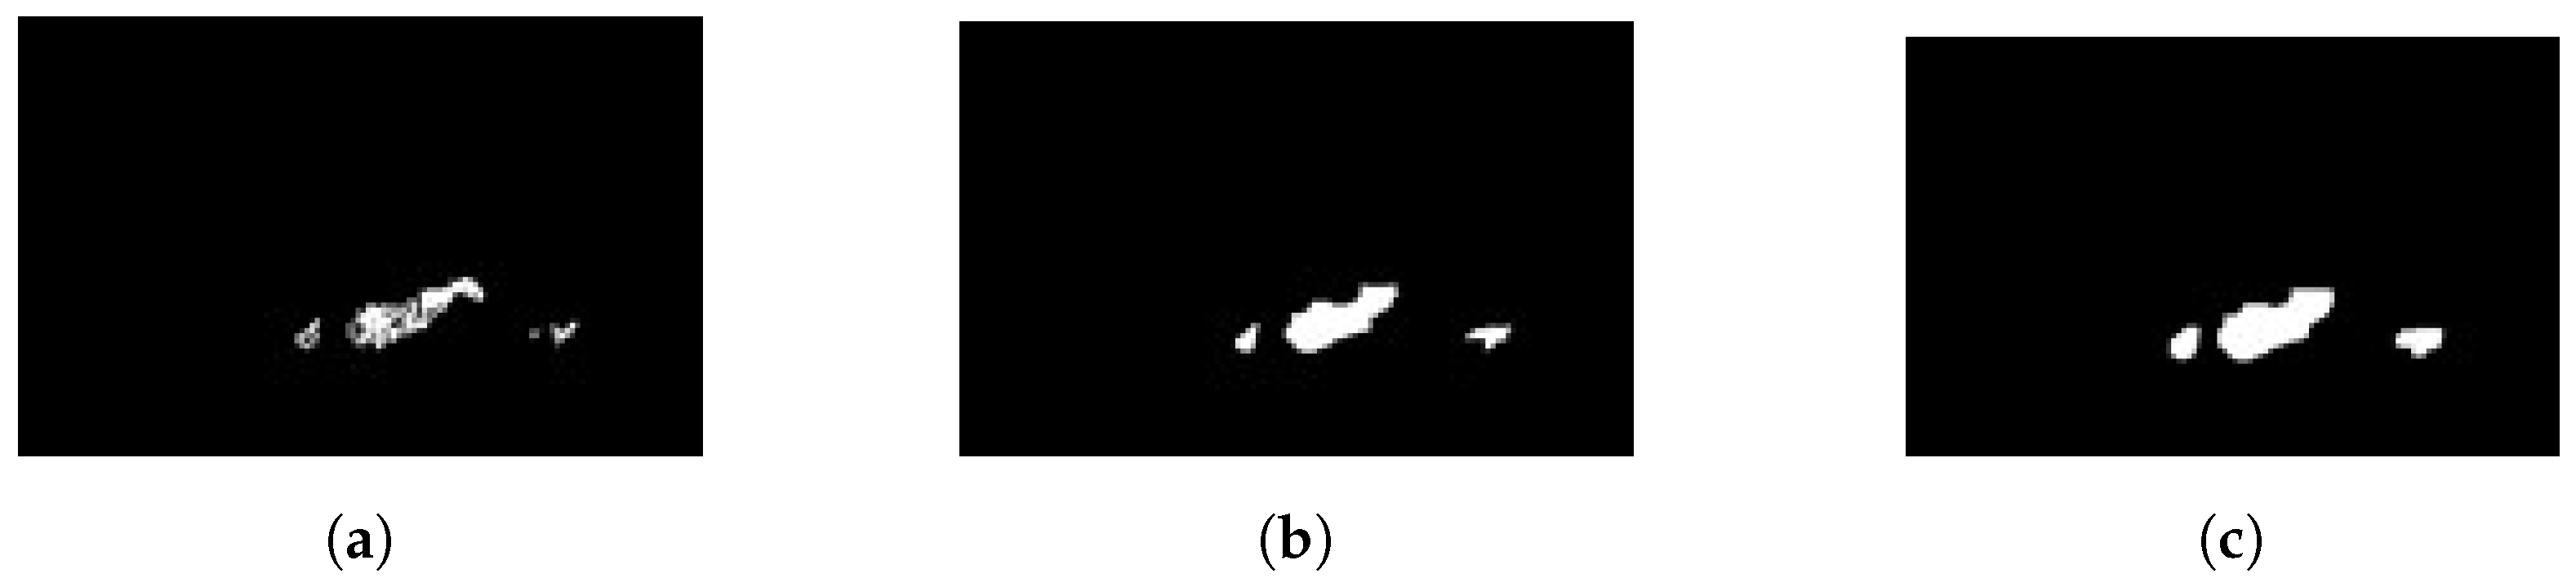
3.2.1. Parameters for Fire Object Segmentation

In the segmentation stage, the most crucial parameter is the value of K in GMM and EM methods. K is defined as the number of clusters used to differentiate fire and non-fire. Therefore, the heuristic approach was used by choosing several values of K and selecting the optimal one. Table 2 shows the results of the variation of the K value on the segmentation results.
As shown in Table 2, it was found that when the value of K = 2 was used, many non-fire objects were detected as belonging to the fire class, defined as false positives. The false positives were also detected when we set K = 4 and K = 5 , although the number was reducing. The best results were obtained from the value of K = 3 . However, in terms of the processing speed, the value of K = 2 was the fastest because it only uses two clusters to perform segmentation. The higher the value of K, the FPS value was getting smaller. Based on these results, we decided to use the K = 3 because the number of detection results is the same as the ground truth, and the FPS value was not too small.
In addition to the K value, morphological operations also affect the accuracy of the segmentation results. In this study, we used closing morphology to close the hole in the fire area and dilation to widen the surface of the fire object. Figure 5 shows the results of using the dilation morphology operation on the IoU rate.
Based on the experiment, without using a dilation operation, the IoU rate was 0.445, while using a dilation operation, the IoU rate increased to 0.794. This improvement was due to the dilation process enlarging the fire region area in the segmentation stage. Thus, the overlapping area between the fire region and the ground truth was getting bigger. In general, dilation operators can handle fire detection in a small size, as it is possible to widen the area of the fire object.

3.2.2. Parameters for Fire Object Classification

Next, an evaluation to determine the optimal machine learning was carried out. Table 3 and Table 4 show the evaluation results for support vector machine and random forest, respectively. As shown in Table 3, the utilization of SVM with the linear kernel was more accurate than the RBF and polynomial. Since only two classes were separated, the linear kernel in the form of straight lines was more accurate than RBF kernels and polynomials. Unfortunately, as shown in Table 4, the random forest with 20 trees achieved better results than SVM. In both machine learning methods, the HSV model was slightly better than the YCbCr model due to HSV separating luma (image intensity) from chroma (color information). It is beneficial in various situations, especially in natural objects like trees, fire, etc. Therefore, a random forest with 20 trees on the HSV color model was applied for our fire detection framework in the testing stage. Figure 6 shows an example of the results on each step of fire detection.

3.3. Frame-Based Evaluation

Frame-based evaluation is calculated regarding the presence of fire in a particular frame, which several previous researchers commonly use. It consists of the true-positive rate (TPR), the true-negative rate (TNR), the false-positive rate (FPR), and the false-negative rate (FNR). The evaluation result of fire detection for video containing fire can be seen in Table 5, while the evaluation result for video without fire can be seen in Table 6.
Unfortunately, because of limited resources and difficulty implementing other research, we could not compare our proposed with other methods for all testing videos. Instead, we compared them based on the video used in their experiment. Around 12 VisiFire videos were used as data testing, and there were four videos used by several previous researchers as data testing, as shown in Table 5. If only referring to the four videos, the proposed method achieved the fourth-best average TPR with 81.67 % . The highest TPR was achieved by Torebiyan et al. [36] with 100 % , followed by R-CNN with 94.92 % and Truong and Kim [35] with 94.32 % , respectively.
Furthermore, it is also very important to evaluate the method on videos without containing the fire. Thus, we also evaluated our method on FireSense video, which was then compared with the R-CNN method. As shown in Table 6, the proposed method achieved a TNR value of 38.73 % . This result is better than the TNR value for the R-CNN method with a TNR of around 18.65 % . Nevertheless, our method still yielded relatively high false positives. However, this result is still better than R-CNN.

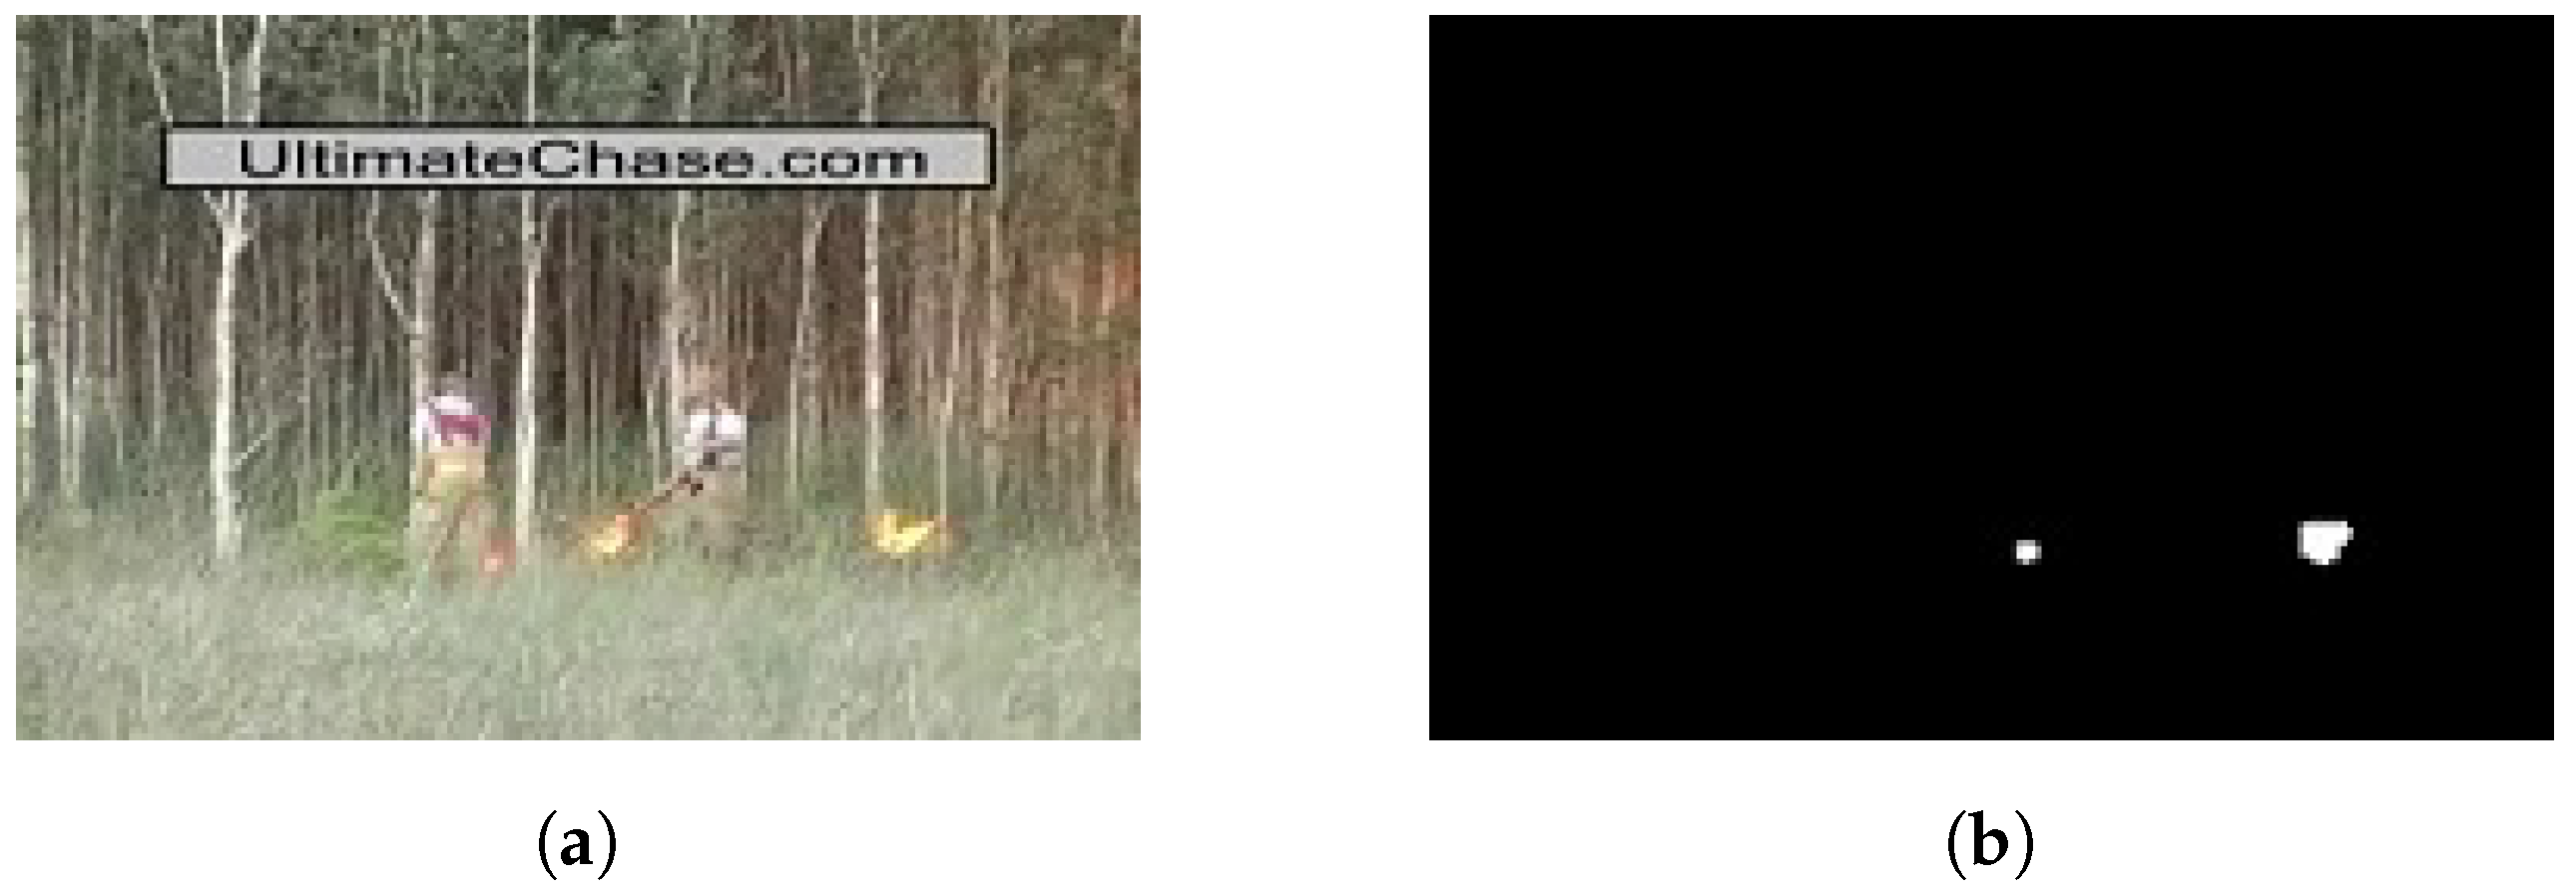
3.4. Location-Based Evaluation

Along with knowing the presence of fire in the frame, information about the exact location of the fire is also very significant. The specific fire location information will speed up the process of extinguishing the fire. Therefore, in addition to the frame-based evaluation, it is also crucial to conduct an intersection over union (IoU)-based evaluation. However, to the best of our knowledge, most of the state of the art methods do not conduct an evaluation based on IoU. The IoU-based evaluation is more challenging than frame-based evaluation because of the large number of annotations required for each video. However, this study proposes a new annotation based on the region to be evaluated on an IoU rate. This evaluation compares the location of the detected fire with the actual location of the fire. The IoU can be calculated as a ratio between the intersection area of the detected fire and the ground truth and the union area of the detected fire and the ground truth.
The proposed method was also evaluated based on the computational time. The faster the computation time used, the more potential the technique is implemented for real-time surveillance. To the best of our knowledge, there was no other research evaluating fire detection based on the IoU rate. Therefore, due to limited resources in implementation, we only compared our proposed method with the R-CNN deep learning method. Table 7 shows the comparison of the proposed method and R-CNN based on the IoU and computation time. The average IoU value in Table 7 refers to the average IoU value for the entire frame of each video. The average IoU rate for the proposed method was 0.32, while for R-CNN it was 0.26. Hence, it proved that the proposed method could detect the location of fire better than R-CNN. In addition, we compared the frames per second (FPS) value for the computation time comparison. The computational time used by the proposed method was much faster than that of R-CNN. The proposed method can detect fire with a speed of 21.70 FPS, while R-CNN only had 2.53 FPS.
Furthermore, the proposed method can detect relatively small fires with an area size of at least 20 pixels (see Figure 7). It is because the reference used is the color of the object. As long as the object has a color that matches the reference color on the probability model, the object could be detected as fire.
Nevertheless, the proposed method still has limitations. For example, the system may fail to detect potential fire or invisible fire caused by a significant amount of smoke or haze in the forest due to the proposed method depending on the visual appearance of fire. Therefore, utilizing additional sensors (e.g., thermal camera, temperature sensor, humidity sensor, etc.) could be one of the solutions to overcome this problem. Additionally, the proposed method still produces false positives, affecting fire detection handling. Therefore, further research is needed to reduce these false positives. Examples of successful and failed fire detection using the proposed method can be seen in Figure 8.

4. Conclusions

A real-time and reliable fire detection method for an early warning system is required so that an immediate response to an incident can be made effective. In this study, methods based on color probabilities and motion features were successfully implemented to achieve this goal. The proposed method exploits the characteristics of the color of fire by developing a probability model using a multiple Gaussian. On the other hand, other fire characteristics, namely, dynamic fire movement modeled with motion features based on moment invariants, were also applied. The experiment found that the processing time required on average reached 21.70 FPS with a relatively high true positive rate of 89.92 % . These results indicate that the proposed method is suitable for a real-time early warning system. Nonetheless, one of the greatest challenges in implementing the module is physically installing the camera, which may be very difficult. Therefore, it will remain a challenge for our further research.

Author Contributions

Conceptualization, W.; methodology, W., F.D.A. and G.K.; validation, W. and G.K.; formal analysis, W. and G.K.; investigation, W.; resources, W.; writing—original draft preparation, F.D.A. and G.K.; writing—review and editing, W., A.H., A.D. and K.-H.J.; supervision, W.; funding acquisition, W. All authors have read and agreed to the published version of the manuscript.

Funding

This work was funded by the Ministry of Education, Culture, Research, and Technology, the Republic of Indonesia, under World-Class Research (WCR) Grant 111/E4.1/AK.04.PT/2021 and 4506/UN1/DITLIT/DIT-LIT/PT/2021.

Data Availability Statement

The annotation data used in this article are openly available in Zenodo at https://doi.org/10.5281/zenodo.5893854. Please refer [37] for the detailed description of this annotation data.

Acknowledgments

We would like to thank and acknowledge the time and effort devoted by anonymous reviewers to give suggestions which improve the quality of our paper.

Conflicts of Interest

The authors declare no conflict of interest. The funders had no role in the design of the study; in the collection, analyses, or interpretation of data; in the writing of the manuscript; or in the decision to publish the results.

References

  1. The World Bank. Forest Area—Indonesia|Data. data.worldbank.org. 2020. Available online: https://data.worldbank.org/indicator/AG.LND.FRST.ZS?locations=ID (accessed on 3 February 2022).
  2. Fitriany, A.A.; Flatau, P.J.; Khoirunurrofik, K.; Riama, N.F. Assessment on the use of meteorological and social media information for forest fire detection and prediction in Riau, Indonesia. Sustainability 2021, 13, 11188. [Google Scholar] [CrossRef]
  3. Chen, T.H.; Wu, P.H.; Chiou, Y.C. An early fire-detection method based on image processing. In Proceedings of the International Conference on Image Processing (ICIP), Singapore, 24–27 October 2004; Volume 3, pp. 1707–1710. [Google Scholar] [CrossRef]
  4. Dimitropoulos, K.; Gunay, O.; Kose, K.; Erden, F.; Chaabene, F.; Tsalakanidou, F.; Grammalidis, N.; Çetin, E. Flame Detection for Video-Based Early Fire Warning for the Protection of Cultural Heritage. In Lecture Notes in Computer Science (Including Subseries Lecture Notes in Artificial Intelligence and Lecture Notes in Bioinformatics); Springer: Berlin/Heidelberg, Germany, 2012; Volume 7616, pp. 378–387. [Google Scholar]
  5. Çelik, T.; Demirel, H. Fire detection in video sequences using a generic color model. Fire Saf. J. 2009, 44, 147–158. [Google Scholar] [CrossRef]
  6. Celik, T. Fast and efficient method for fire detection using image processing. ETRI J. 2010, 32, 881–890. [Google Scholar] [CrossRef] [Green Version]
  7. Shidik, G.F.; Adnan, F.N.; Supriyanto, C.; Pramunendar, R.A.; Andono, P.N. Multi color feature background subtraction and time frame selection for fire detection. In Proceedings of the International Conference on Robotics, Biomimetics and Intelligent Computing System, Shenzhen, China, 12–14 December 2013; pp. 115–120. [Google Scholar] [CrossRef]
  8. Mueller, M.; Karasev, P.; Kolesov, I.; Tannenbaum, A. Optical Flow Estimation for Flame Detection in Videos. IEEE Trans. Image Process. 2013, 22, 2786–2797. [Google Scholar] [CrossRef] [Green Version]
  9. Teng, Z.; Kim, J.; Kang, D. Fire Detection Based on Hidden Markov Models. Int. J. Control. Autom. Syst. 2010, 8, 822–830. [Google Scholar] [CrossRef]
  10. Töreyin, B.U.; Dedeoǧlu, Y.; Güdükbay, U.; Çetin, A.E. Computer vision based method for real-time fire and flame detection. Pattern Recognit. Lett. 2006, 27, 49–58. [Google Scholar] [CrossRef] [Green Version]
  11. Barmpoutis, P.; Dimitropoulos, K.; Grammalidis, N. Real time video fire detection using spatio-temporal consistency energy. In Proceedings of the 10th IEEE International Conference on Advanced Video Signal Based Surveillance, Krakow, Poland, 27–30 August 2013; pp. 365–370. [Google Scholar] [CrossRef]
  12. Foggia, P.; Saggese, A.; Vento, M. Real-Time Fire Detection for Video-Surveillance Applications Using a Combination of Experts Based on Color, Shape, and Motion. IEEE Trans. Circuits Syst. Video Technol. 2015, 25, 1545–1556. [Google Scholar] [CrossRef]
  13. Muhammad, K.; Ahmad, J.; Mehmood, I.; Rho, S.; Baik, S.W. Convolutional Neural Networks Based Fire Detection in Surveillance Videos. IEEE Access 2018, 6, 18174–18183. [Google Scholar] [CrossRef]
  14. Muhammad, K.; Ahmad, J.; Lv, Z.; Bellavista, P.; Yang, P.; Baik, S.W. Efficient Deep CNN-Based Fire Detection and Localization in Video Surveillance Applications. IEEE Trans. Syst. Man Cybern. Syst. 2019, 49, 1419–1434. [Google Scholar] [CrossRef]
  15. Li, P.; Zhao, W. Image fire detection algorithms based on convolutional neural networks. Case Stud. Therm. Eng. 2020, 19. [Google Scholar] [CrossRef]
  16. Xu, Z.; Guo, Y.; Saleh, J.H. Tackling Small Data Challenges in Visual Fire Detection: A Deep Convolutional Generative Adversarial Network Approach. IEEE Access 2020, 9, 3936–3946. [Google Scholar] [CrossRef]
  17. Wu, X.; Lu, X.; Leung, H. An adaptive threshold deep learning method for fire and smoke detection. In Proceedings of the 2017 IEEE International Conference on Systems, Man, and Cybernetics (SMC), Banff, AB, Canada, 5–8 October 2017; pp. 1954–1959. [Google Scholar] [CrossRef]
  18. Chaoxia, C.; Shang, W.; Zhang, F. Information-Guided Flame Detection Based on Faster R-CNN. IEEE Access 2020, 8, 58923–58932. [Google Scholar] [CrossRef]
  19. Xie, Y.; Zhu, J.; Cao, Y.; Zhang, Y.; Feng, D.; Zhang, Y.; Chen, M. Efficient video fire detection exploiting motion-flicker-based dynamic features and deep static features. IEEE Access 2020, 8, 81904–81917. [Google Scholar] [CrossRef]
  20. Jadon, A.; Omama, M.; Varshney, A.; Ansari, M.S.; Sharma, R. FireNet: A Specialized Lightweight Fire and Smoke Detection Model for Real-Time IoT Applications. arXiv 2019, arXiv:1905.11922. [Google Scholar]
  21. Iglesias, F.; Zseby, T.; Ferreira, D.; Zimek, A. MDCGen: Multidimensional Dataset Generator for Clustering. J. Classif. 2019, 36, 599–618. [Google Scholar] [CrossRef] [Green Version]
  22. Xiao, J.; Xu, Q.; Wu, C.; Gao, Y.; Hua, T.; Xu, C. Performance evaluation of missing-value imputation clustering based on a multivariate Gaussian mixture model. PLoS ONE 2016, 11, e0161112. [Google Scholar] [CrossRef]
  23. Wei, W.; Balabdaoui, F.; Held, L. Calibration tests for multivariate Gaussian forecasts. J. Multivariat Anal. 2016, 154, 216–233. [Google Scholar] [CrossRef] [Green Version]
  24. Mohd Yusoff, M.I.; Mohamed, I.; Abu Bakar, M.R. Improved expectation maximization algorithm for gaussian mixed model using the kernel method. Math. Probl. Eng. 2013, 2013, 757240. [Google Scholar] [CrossRef]
  25. Boccuto, A.; Gerace, I.; Giorgetti, V.; Rinaldi, M. A Fast Algorithm for the Demosaicing Problem Concerning the Bayer Pattern. Open Signal Process. J. 2019, 6, 1–14. [Google Scholar] [CrossRef]
  26. Zarkasi, A.; Nurmaini, S.; Setiawan, D.; Abdurahman, F.; Deri Amanda, C. Implementation of fire image processing for land fire detection using color filtering method. J. Phys. Conf. Ser. 2019, 1196, 012003. [Google Scholar] [CrossRef]
  27. Chen, Y.; Sano, H.; Wakaiki, M.; Yaguchi, T. Secret Communication Systems Using Chaotic Wave Equations with Neural Network Boundary Conditions. Entropy 2021, 23, 904. [Google Scholar] [CrossRef]
  28. Roberto, N.; Baldini, L.; Adirosi, E.; Facheris, L.; Cuccoli, F.; Lupidi, A.; Garzelli, A. A Support Vector Machine Hydrometeor Classification Algorithm for Dual-Polarization Radar. Atmosphere 2017, 8, 134. [Google Scholar] [CrossRef] [Green Version]
  29. Tyralis, H.; Papacharalampous, G.; Langousis, A. A Brief Review of Random Forests for Water Scientists and Practitioners and Their Recent History in Water Resources. Water 2019, 10, 910. [Google Scholar] [CrossRef] [Green Version]
  30. Zhai, Y.; Zheng, X. Random Forest based Traffic Classification Method In SDN. In Proceedings of the 2018 International Conference on Cloud Computing. Big Data and Blockchain (ICCBB), Fuzhou, China, 15–17 November 2018; pp. 1–5. [Google Scholar] [CrossRef]
  31. Shu, X.; Zhang, Q.; Shi, J.; Qi, Y. A Comparative Study on Weighted Central Moment and Its Application in 2D Shape Retrieval. Information 2016, 7, 10. [Google Scholar] [CrossRef] [Green Version]
  32. Çetin, A.E. Computer Vision Based Fire Detection Dataset. 2014. Available online: http://signal.ee.bilkent.edu.tr/VisiFire/ (accessed on 15 July 2021).
  33. Grammalidis, N.; Dimitropoulos, K.; Cetin, E. FIRESENSE database of videos for flame and smoke detection. IEEE Trans. Circuits Syst. Video Technol. 2017, 25, 339–351. [Google Scholar] [CrossRef]
  34. Ko, B.C.; Cheong, K.H.; Nam, J.Y. Fire detection based on vision sensor and support vector machines. Fire Saf. J. 2009, 44, 322–329. [Google Scholar] [CrossRef]
  35. Xuan Truong, T.; Kim, J.M. Fire flame detection in video sequences using multi-stage pattern recognition techniques. Eng. Appl. Artif. Intell. 2012, 25, 1365–1372. [Google Scholar] [CrossRef]
  36. Torabian, M.; Pourghassem, H.; Mahdavi-Nasab, H. Fire Detection Based on Fractal Analysis and Spatio-Temporal Features. Fire Technol. 2021, 57, 2583–2614. [Google Scholar] [CrossRef]
  37. Wahyono; Dharmawan, A.; Harjoko, A.; Chrystian; Adhinata, F.D. Region-based annotation data of fire images for intelligent surveillance system. Data Br. 2022, 107925. [Google Scholar] [CrossRef]
Figure 1. The proposed method flowchart.
Fire 05 00023 g001
Figure 2. The selected sample of fire images for training data in the segmentation stage.
Fire 05 00023 g002
Figure 3. The selected sample of fire and non-fire images for classification stage.
Fire 05 00023 g003
Figure 4. The sample results of morphology operations as post-processing. (a) Segmentation result; (b) closing operation result; (c) dilation operation result.
Fire 05 00023 g004
Figure 5. The effect of morphological operations on the segmentation result. (a) Ground truth; (b) without dilation operation; (c) with dilation operation.
Fire 05 00023 g005
Figure 6. Selected sample of forest fire detection results.
Fire 05 00023 g006
Figure 7. The smallest fire blob that can be detected by our model with area of 20 pixels. (a) Original image; (b) detected small fire blob.
Fire 05 00023 g007
Figure 8. The sample of fire detection result using the proposed framework; (top row) successful fire detection and (bottom row) failed fire detection.
Fire 05 00023 g008
Table 1. Dataset used for evaluation in the experiment.
VideoResolutionFrame RateFramesFireNotes
Video 1400 × 25615260yesControlled1 [32]
Video 2400 × 25615246yesControlled2 [32]
Video 3400 × 25615208yesControlled3 [32]
Video 4400 × 25615200yesForest1 [32]
Video 5400 × 25615245yesForest2 [32]
Video 6400 × 25615255yesForest3 [32]
Video 7400 × 25615219yesForest4 [32]
Video 8400 × 25615216yesForest5 [32]
Video 9400 × 25615218yesForestFire1 [32]
Video 10320 × 2402241yesfBackYardFire [32]
Video 11320 × 2405236yesFire1 [32]
Video 12320 × 24029.97140yes40m PanFire 20060824 [32]
Video 13320 × 24010155nonegsVideo2.859 [33]
Video 14320 × 24010160nonegsVideo3.860 [33]
Video 15480 × 36830439nonegsVideo5.862 [33]
Video 16640 × 36830541nonegsVideo7.864 [33]
Video 17640 × 48025645nonegsVideo9.866 [33]
Video 18360 × 28825246nonegsVideo10.1072 [33]
Video 19320 × 24025180nonegsVideo11.1073 [33]
Video 20352 × 28824.46272nonegsVideo13.1075 [33]
Video 211600 × 120018.51196nonegsVideo16.1077 [33]
Table 2. The effect of the value of K in segmentation results.
KGround TruthFire SegmentationFps
2 Fire 05 00023 i001 Fire 05 00023 i00227.71
3 Fire 05 00023 i003 Fire 05 00023 i00418.87
4 Fire 05 00023 i005 Fire 05 00023 i00617.07
5 Fire 05 00023 i007 Fire 05 00023 i00813.64
Table 3. Classification result using SVM.
Color SpaceKernelAccuracy (%)
RGBRBF56.08
Polynomial52.98
Linear83.50
HSVRBF65.56
Polynomial52.37
Linear81.64
YCbCrRBF75.05
Polynomial52.98
Linear81.93
Table 4. Classification result using Random Forest.
Color SpaceNumber of TreesAccuracy (%)
RGB1085.77
2086.18
3087.21
4087.83
5088.24
HSV1091.75
2092.16
3091.95
4091.13
5091.13
YCbCr1090.11
2090.72
3090.92
4092.15
5091.95
Table 5. Comparison of TPR and FNR Results (in percentage) on VisiFire Dataset [32].
VideoProposed MethodR-CNNTorabian [36]Toreyin [10]Ko [34]Truong [35]
TPRFNRTPRFNRTPRFNRTPRFNRTPRFNRTPRFNR
Video 110001000100034055.2294.985.02
Video 210001000100087.54.977.70--
Video 3100095.124.88100073.71097.90955
Video 4100095.194.81--------
Video 51000973--------
Video 692.177.8399.180.82--------
Video 7100063.2536.75--------
Video 898.611.3976.2623.74--------
Video 926.6773.3384.5815.42100051.244.156.30937
Video 1098.621.381000--------
Video 1174.7525.2560.439.6--------
Video 1288.7611.2495.514.49--------
Average89.9710.0388.8711.13100061.614.7571.780.594.335.67
Table 6. Comparison of TNR and FPR Results on FireSense Dataset [33].
VideoProposed MethodR-CNN
TNR (%)FPR (%)TNR (%)FPR (%)
Video 1327.7472.2612.2687.74
Video 1420.6279.3821.8878.12
Video 1538.7261.283.4296.58
Video 1633.4666.544.9995.01
Video 1721.7178.2923.176.9
Video 1834.5565.450100
Video 1959.4440.5697.222.78
Video 2066.4233.582.9597.05
Video 2145.9254.082.0497.96
Average38.7361.2718.6581.35
Table 7. Evaluation based on IoU Rate and Computation Time.
VideoProposed MethodR-CNN
Avg. IoUFPSAvg. IoUFPS
Video 10.523.630.31.47
Video 20.2621.750.072.64
Video 30.0918.420.022.69
Video 40.3121.840.532.68
Video 50.3819.600.142.67
Video 60.6323.360.382.74
Video 70.2919.6 00.162.64
Video 80.3422.250.312.63
Video 90.2326.990.312.44
Video 100.1919.380.162.61
Video 110.2422.770.262.57
Video 120.4320.870.412.60
Average0.3221.70.262.53
Publisher’s Note: MDPI stays neutral with regard to jurisdictional claims in published maps and institutional affiliations.

