
Probability Analysis and Prevention of Offshore Oil and Gas Accidents: Fire as a Cause and a Consequence


Abstract
:1. Introduction
2. Technical Aspects of Offshore Drilling and Production with the Protection of the Well and the Facilities
2.1. Offshore Drilling and Production
- The first phase of the drilling process is carried out in an open hole in which a casing needs to be installed to serve as the backbone of a future production well. This process is followed by drilling to deeper depths, and by continuously adding smaller bore casings until the desired drilling depth is reached. Once the first and the largest casing is put in place and secured with concrete, a marine riser is lowered to provide a link from a well head and a drilling deck on the mobile drilling unit to allow further drilling processes. Below the drilling deck, as soon as it is possible, a blowout preventer (BOP), a mechanical device in the form of a specialized valve used to seal a well to prevent blowouts, should be installed. A mud circulating system is used to remove cuttings from the well, and to assure sufficient pressure to stop the uncontrolled influx of crude oil and gas in the system during drilling, as pressure can be adjusted to the specific conditions by a variation in the drilling fluid density (a typical water-based drilling mud contains a clay, usually bentonite, to give it enough density and viscosity to carry cutting chips to the surface, as well as a mineral such as barite, i.e., barium sulfate, to increase the weight of the column enough to stabilize the borehole. While drilling fluid, mud travels from the surface all the way downhole and back to its initial point). In case of primary control loss resulting from a sudden increase in the formation pressure or a loss of circulation, it is necessary to seal off the well by some other means to prevent an uncontrollable flow or blowout of fluids using a blowout preventer (BOP) [19], which can create a seal around the drillpipe, or in emergencies, cut the drillpipe and seal off the hole. The two most used types of blowout preventer are Ram or Annular, depending on their design.
- The oil, water and gas sometimes travel from the reservoir to the surface through the production pipe under their own pressure (natural drive when a nozzle can be used to control pressure in the well) or if reservoir pressures are low, artificial lift is employed using in-well or seafloor pumps and is sometimes accompanied with in-well heating and/or gas lift systems. When the drilling phase is over, production starts when a production pipe is installed into the well and when the drilling fluid is removed. This phase is performed from a permanent production (exploitation) platform.
2.2. Protection
2.2.1. Well Protection and Control
- Shallow gas blowouts during drilling: Shallow gas is the accumulation of natural gas at an abnormal pressure, which may exist in shallow sediments below the seabed. Gas can blow out unexpectedly during well drilling and can pose a great hazard to drilling safety, especially in the early phase when a blowout preventer has not yet been installed.
- Surface blowouts during drilling: Blowouts can eject the drill string from the well and the force of the escaping fluid can be strong enough to damage the drilling rig. In addition to oil and gas, the output of a well blowout might include water, drill fluids, mud, sand, rocks and other substances. It should be prevented in the final instance by using the blowout preventer.
- Subsea blowouts during drilling: the two main causes of a subsea blowout are failures of the equipment that form barriers and well underbalance with reservoir pressure; the blowout preventers can be used in such cases to contain the blowout but not always.
- Producing well blowouts during well interventions: Well interventions using wirelines or workover equipment are necessary for servicing the subsurface isolation valves or the subsurface equipment such as pumps, well flow management, wax deposits removal, use of diagnostic tools, etc. Loss of well balance may result in an uncontrolled flow of hydrocarbons through the well and their release to the surface. In most cases, such blowouts can also be contained using blowout preventers.
- Underground Blowouts: An underground blowout is a special situation where fluids from high-pressure zones flow uncontrolled to lower pressure zones within the wellbore. Usually, this is from deeper, higher pressure zones to shallower, lower pressure formations. There may be no escaping fluid flow at the wellhead. Such types of accidents cannot be contained using blowout preventers. The formation(s) receiving the influx can become over-pressured and fractured, potentially jeapordizing future drilling plans in the vicinity being reconsidered.
2.2.2. Fire Protection
- The Consequence-Based (worst credible event) approach takes account only of the impact of the maximum credible event for each target, irrespective of its frequency. A thermal load and a blast overpressure are selected for the target protection design (e.g., fire wall and/or blast wall, equipment support, structural protection). The Consequence-Based approach can lead to blast loads that are far too large to be accommodated by by the protective structures.
- The Risk-Based approach considers both the consequences and the frequencies of all the potential fire scenarios that impact on a specific target. It enables the design of structures to resist reasonable thermal loading values and lower explosion loading values, accepting explicitly a certain residual risk of exceeding the thermal or explosion loadings design value.
- Heat transfer by thermal radiation and convection from the fire onto the vessel shell, the surface of fire protective coating, the thermal insulation or the protective shield (if applied);
- Heat transfer through the fire protective coating, the thermal insulation or the protective shield;
- Heat conduction through the vessel shell resulting in time-dependent temperature distribution;
- The reduction in the material strength with rising temperatures;
- Heat transfer by thermal radiation and convection from the inner vessel surface to the vessel contents;
- The thermodynamic equilibrium of the liquid and vapour in the vessel constantly adjusting to changing temperature;
- Variation of the pressure in the vessel due to depressurization counter-acted by the increase in the pressure due to heat input, and the boiling and expansion of the vessel contents;
- A progressive reduction in the yield stress of the vessel wall due to the steadily increasing temperature as long the external heat input persists;
- A progressive increase in the applied stress in the vessel due to the increase in pressure;
- Loss of the material strength of the vessel and vessel rupture with the release of a large mass of flammable vapour at its boiling point and ignited by the fire into a rising fireball;
- Structural effects on the vessel from a sudden release of stored energy at high pressure.
- The loss of containment, resulting in a fire and the thermal effects on people, equipment and structures;
- Escalation of an initial event resulting in a fire, where the escalating event needs to be prevented and/or vulnerable structures and equipment need to be protected;
- The impact of smoke and toxic combustion products in fires.
3. Analysis of the Largest Offshore Oil and Gas Accidents
3.1. Overview of the Largest Accidents
3.1.1. Qatar 1 Jack-Up Rig
3.1.2. C. P. Baker Drilling Barge
3.1.3. Sea Gem Jack-Up Rig
3.1.4. Gemini Jack-Up Rig
3.1.5. Ocean Express Jack-Up Rig
3.1.6. Ekofisk Bravo Production Platform Blowout
3.1.7. Ixtoc I Semisubmersible Drilling Rig
3.1.8. Bohai 2 Jack-Up Rig
3.1.9. Alexander L. Kielland Semisubmersible Accommodation Vessel (Floating Hotel—Flotel)
3.1.10. Bohai 3 Jack-Up Rig
3.1.11. Hasbah 6 Jack-Up Rig
3.1.12. Ocean Ranger Semisubmersible Drilling Rig
3.1.13. Nowruz Platform
3.1.14. Glomar Java Sea Drillship
3.1.15. Enchova Central Fixed Jacket Production Platform
3.1.16. Piper Alpha Platform
3.1.17. Seacrest Drillship
3.1.18. DB 29 Pipeship
3.1.19. Petrobras P-36 Semi-Submersible Floating Production Unit
3.1.20. Adriatic IV Gas Production Platform
3.1.21. Mumbai High North Platform
3.1.22. Usumacinta Jack-Up Rig
3.1.23. Montara Production Platform
3.1.24. Macondo Deepwater Horizon Semisubmersible Drilling Rig
3.2. Main Causes of the Offshore Accidents and Uncertainties around Their Origins
3.2.1. Overview of the Main Causes of the Accidents
3.2.2. Uncertainty Regarding the Main Causes of Accidents
4. Lessons Learned from Accidents and New Updated Regulations
4.1. Updated Safety Technologies
- Blowout preventers—BOPs have improved by providing many new practical solutions, e.g., a new procedure for the access of Remotely Operated Vehicles (ROVs) to subsea control systems is defined more clearly, casing installation, cementing and integrity tests certified by a qualified engineer are required, as well as independent third-party verification of Blind Shear Ram capacity and stack capacity (which includes minimum requirements for ram types, numbers and capability).
- The capping device [70] has the main role in containing hydrocarbon spills and consequently protecting the marine environment before engineers find a way to permanently seal the well. Such devices have been developed and improved by many companies following the Macondo Deepwater Horizon accident from 2010.
4.2. National Legislation
- Prescriptive: legally required to use an approach similarly to the US, which makes legal requirements explicit through written safety policy to clarify what is required from both dutyholders and enforcement officers but which may need more frequent amendment as a consequence of becoming outdated;
- Goal setting: best practices, objective decision making and a step-by-step challenge approach which is mainly used in Europe and which is more flexibile but can lead to missunderstandings.
4.2.1. Europe
4.2.2. United States of America (USA)
- The Bureau of Ocean Energy Management (BOEM); responsible for offshore resources;
- The Bureau of Safety and Environmental Enforcement (BSEE); responsible for safety and environmental regulations;
- The Office of Natural Resources Revenue (ONRR); responsible for revenues from energy production.
4.2.3. Mexico
4.2.4. United Kingdom (UK)
4.2.5. China
4.2.6. Australia
4.2.7. Canada
4.2.8. Brazil
4.2.9. India
5. Conclusions
- -
- Oil Spill Response Advisory Group—OSPRAG: www.oilspillresponse.com/news--media/news/upgrade-of-the-osprag-capping-device/ (accessed on 13 October 2021);
- -
- International Association of Oil and Gas Producers—IOGP: www.iogp.org (accessed on 13 October 2021)
- -
- Step Change in Safety: www.stepchangeinsafety.net (accessed on 13 October 2021);
- -
- Oil & Gas UK: https://oguk.org.uk/ (accessed on 13 October 2021);
- -
- Center for Offshore Safety: www.centerforoffshoresafety.org (accessed on 13 October 2021);
- -
- International Association of Drilling Contractors—IADC: www.iadc.org (accessed on 13 October 2021);
- -
- Norwegian Petroleum Safety Authority—PSA/PTIL: www.ptil.no/en (accessed on 13 October 2021);
- -
- Bureau of Ocean Energy Management—BOEM: www.boem.gov (accessed on 13 October 2021)’
- -
- Bureau of Safety and Environmental Enforcement—BSEE: www.bsee.gov (accessed on 13 October 2021);
- -
- Office of Natural Resources Revenue—ONRR: www.onrr.gov (accessed on 13 October 2021);
- -
- US Coast Guard: www.dco.uscg.mil (accessed on 13 October 2021);
- -
- Mexican Agencia de Seguridad, Energía y Ambiente—ASEA: www.gob.mx/asea (accessed on 13 October 2021);
- -
- United Kingdom’s Health and Safety Executive—HSE: www.hse.gov.uk/offshore/index.htm (accessed on 13 October 2021);
- -
- Australian National Offshore Petroleum Safety and Environmental Management Authority—NOPSEMA: www.nopsema.gov.au (accessed on 13 October 2021);
- -
- Australian National Offshore Petroleum Titles Administrator—NOPTA: www.nopta.gov.au (accessed on 13 October 2021);
- -
- Brazilian National Petroleum Agency—ANP: https://www.gov.br/anp/pt-br (accessed on 13 October 2021);
- -
- Oil Industry Safety Directorate of India—OISD: www.oisd.gov.in (accessed on 13 October 2021);
Author Contributions
Funding
Institutional Review Board Statement
Informed Consent Statement
Data Availability Statement
Acknowledgments
Conflicts of Interest
References
- Brittingham, M.C.; Maloney, K.O.; Farag, A.M.; Harper, D.D.; Bowen, Z.H. Ecological risks of shale oil and gas development to wildlife, aquatic resources and their habitats. Environ. Sci. Technol. 2014, 48, 11034–11047. [Google Scholar] [CrossRef]
- Rundmo, T. Perceived risk, safety status, and job stress among injured and noninjured employees on offshore petroleum installations. J. Saf. Res. 1995, 26, 87–97. [Google Scholar] [CrossRef]
- Beyer, J.; Trannum, H.C.; Bakke, T.; Hodson, P.V.; Collier, T.K. Environmental effects of the Deepwater Horizon oil spill: A review. Mar. Pollut. Bull. 2016, 110, 28–51. [Google Scholar] [CrossRef] [Green Version]
- Ismail, Z.; Kong, K.K.; Othman, S.Z.; Law, K.H.; Khoo, S.Y.; Ong, Z.C.; Shirazi, S.M. Evaluating accidents in the offshore drilling of petroleum: Regional picture and reducing impact. Measurement 2014, 51, 18–33. [Google Scholar] [CrossRef]
- Tang, K.H.D.; Dawal, S.Z.M.; Olugu, E.U. A review of the offshore oil and gas safety indices. Saf. Sci. 2018, 109, 344–352. [Google Scholar] [CrossRef]
- Sneddon, A.; Mearns, K.; Flin, R. Stress, fatigue, situation awareness and safety in offshore drilling crews. Saf. Sci. 2013, 56, 80–88. [Google Scholar] [CrossRef]
- Xue, L.; Fan, J.; Rausand, M.; Zhang, L. A safety barrier-based accident model for offshore drilling blowouts. J. Loss Prev. Process. Ind. 2013, 26, 164–171. [Google Scholar] [CrossRef]
- Paté-Cornell, M.E. Organizational aspects of engineering system safety: The case of offshore platforms. Science 1990, 250, 1210–1217. [Google Scholar] [CrossRef] [PubMed] [Green Version]
- Beard, A.N.; Santos-Reyes, J. A safety management system model with application to fire safety offshore. Geneva Pap. Risk Insur.-Issues Pract. 2003, 28, 413–425. [Google Scholar] [CrossRef]
- De Sanctis, I.; Paciarotti, C.; Di Giovine, O. Integration between RCM and RAM: A case study. Int. J. Qual. Reliab. Manag. 2016, 33, 852–880. [Google Scholar] [CrossRef]
- Young, A.G.; Remmes, B.D.; Meyer, B.J. Foundation performance of offshore jack-up drilling rigs. J. Geotech. Eng. 1984, 110, 841–859. [Google Scholar] [CrossRef]
- Rajendram, A.; Khan, F.; Garaniya, V. Modelling of fire risks in an offshore facility. Fire Saf. J. 2015, 71, 79–85. [Google Scholar] [CrossRef]
- Brkić, D.; Praks, P. Proper Use of Technical Standards in Offshore Petroleum Industry. J. Mar. Sci. Eng. 2020, 8, 555. [Google Scholar] [CrossRef]
- Brkić, D.; Stajić, Z. Offshore Oil and Gas Safety: Protection against Explosions. J. Mar. Sci. Eng. 2021, 9, 331. [Google Scholar] [CrossRef]
- Guan, Z.; Sheng, Y.N.; Luo, M.; Xu, Y.; Zhang, B.; Wang, Q. A new quantitative evaluation method for drilling risk based on uncertainty analysis. Kuwait J. Sci. 2018, 45, 105–113. Available online: https://journalskuwait.org/kjs/index.php/KJS/article/view/3636/288 (accessed on 17 August 2021).
- Brkić, D.; Praks, P. Safe, Secure and Sustainable Oil and Gas Drilling, Exploitation and Pipeline Transport Offshore. J. Mar. Sci. Eng. 2021, 9, 404. [Google Scholar] [CrossRef]
- Fingas, M. Visual Appearance of Oil on the Sea. J. Mar. Sci. Eng. 2021, 9, 97. [Google Scholar] [CrossRef]
- Kvočka, D.; Žagar, D.; Banovec, P. A Review of River Oil Spill Modeling. Water 2021, 13, 1620. [Google Scholar] [CrossRef]
- Vujasinović, A.N. How blowout preventers work. J. Pet. Technol. 1986, 38, 935–937. [Google Scholar] [CrossRef]
- Yu, G.; Jia, S.; Geng, Y. Numerical Investigation into the Two-Phase Convective Heat Transfer within the Hold of an Oil Tanker Subjected to a Rolling Motion. J. Mar. Sci. Eng. 2019, 7, 94. [Google Scholar] [CrossRef] [Green Version]
- Yu, G.; Zhang, L.; Jia, S.; Geng, Y.; Liu, J. Numerical Study on the Natural Convection of Air in a Cubic Cavity Subjected to a Yawing Motion. J. Mar. Sci. Eng. 2019, 7, 204. [Google Scholar] [CrossRef] [Green Version]
- Zan, Y.; Guo, R.; Yuan, L.; Wu, Z. Experimental and Numerical Model Investigations of the Underwater Towing of a Subsea Module. J. Mar. Sci. Eng. 2019, 7, 384. [Google Scholar] [CrossRef] [Green Version]
- Song, J.; Wang, T.; Chen, W.; Guo, S.; Yan, D. Vibration Control of Marine Top Tensioned Riser with a Single Tuned Mass Damper. J. Mar. Sci. Eng. 2020, 8, 785. [Google Scholar] [CrossRef]
- Kiran, R.; Teodoriu, C.; Dadmohammadi, Y.; Nygaard, R.; Wood, D.; Mokhtari, M.; Salehi, S. Identification and evaluation of well integrity and causes of failure of well integrity barriers (A review). J. Nat. Gas Sci. Eng. 2017, 45, 511–526. [Google Scholar] [CrossRef]
- Vignes, B.; Aadnoy, B.S. Well-integrity issues offshore Norway. In Proceedings of the IADC/SPE Drilling Conference, Orlando, FL, USA, 4–6 March 2008. [Google Scholar] [CrossRef]
- Ferdous, R.; Khan, F.; Sadiq, R.; Amyotte, P.; Veitch, B. Analyzing system safety and risks under uncertainty using a bow-tie diagram: An innovative approach. Process. Saf. Environ. Prot. 2013, 91, 1–18. [Google Scholar] [CrossRef]
- Vairo, T.; Pontiggia, M.; Fabiano, B. Critical aspects of natural gas pipelines risk assessments. A case-study application on buried layout. Process Saf. Environ. Prot. 2021, 149, 258–268. [Google Scholar] [CrossRef]
- Praks, P.; Kopustinskas, V.; Masera, M. Probabilistic modelling of security of supply in gas networks and evaluation of new infrastructure. Reliab. Eng. Syst. Saf. 2015, 144, 254–264. [Google Scholar] [CrossRef]
- Hosseinnia Davatgar, B.; Paltrinieri, N.; Bubbico, R. Safety Barrier Management: Risk-Based Approach for the Oil and Gas Sector. J. Mar. Sci. Eng. 2021, 9, 722. [Google Scholar] [CrossRef]
- Landucci, G.; Argenti, F.; Tugnoli, A.; Cozzani, V. Quantitative assessment of safety barrier performance in the prevention of domino scenarios triggered by fire. Reliab. Eng. Syst. Saf. 2015, 143, 30–43. [Google Scholar] [CrossRef]
- Benucci, S.; Pontiggia, M.; Uguccioni, G. Explosion Load Calculation for Building Design: Risk-Based versus Consequence-Based Approach. Chem. Eng. Trans. 2012, 26, 153–158. [Google Scholar] [CrossRef]
- Roberts, T.A.; Buckland, I.; Shirvill, L.C.; Lowesmith, B.J.; Salater, P. Design and protection of pressure systems to withstand severe fires. Process Saf. Environ. Prot. 2004, 82, 89–96. [Google Scholar] [CrossRef]
- Kaiser, M.J. World offshore energy loss statistics. Energy Policy 2007, 35, 3496–3525. [Google Scholar] [CrossRef]
- Visser, R.C. Offshore accidents, regulations and industry standards. In Proceedings of the SPE Western North American Region Meeting, Anchorage, AK, USA, 7–11 May 2011. [Google Scholar] [CrossRef]
- Ivshina, I.B.; Kuyukina, M.S.; Krivoruchko, A.V.; Elkin, A.A.; Makarov, S.O.; Cunningham, C.J.; Peshkur, T.A.; Atlas, R.M.; Philp, J.C. Oil spill problems and sustainable response strategies through new technologies. Environ. Sci. Process. Impacts 2015, 17, 1201–1219. [Google Scholar] [CrossRef] [Green Version]
- Mihailidou, E.K.; Antoniadis, K.D.; Assael, M.J. The 319 major industrial accidents since 1917. Int. Rev. Chem. Eng. 2012, 4, 529–540. Available online: https://pdfs.semanticscholar.org/23a3/09d1767f6e0531668ae43dee5a2a10c52ee8.pdf (accessed on 14 May 2021).
- Hunt, R.J.; Marsh, P.D. Opportunities to improve the operational and technical management of jack-up deployments. Mar. Struct. 2004, 17, 261–273. [Google Scholar] [CrossRef]
- Schaner, D.S. Mooring System Instrumentation for Floating Drilling and Offshore Construction Vessels. In Proceedings of the Offshore Technology Conference, Houston, TX, USA, 4–7 May 1975. Paper Number: OTC-2153-MS. [Google Scholar] [CrossRef]
- Burke, L. The Sea Gem: A story of material failure. J. Undergr. Eng. Res. Scholarsh. 2013. Paper Code: PT-13–Burke. Available online: https://werf-gusto.com/wp-content/uploads/2015/08/524-2055-1-PB.pdf (accessed on 14 May 2021).
- Williams, M. MODU Ocean Express Disaster 1976. J. Undergr. Eng. Res. Scholarsh. 2013. Paper Code: PT-13-Williams. Available online: https://journals.library.mun.ca/ojs/index.php/prototype/article/view/469/537 (accessed on 14 May 2021).
- Mackie, P.R.; Hardy, R.; Whittle, K.J. Preliminary assessment of the presence of oil in the ecosystem at Ekofisk after the blowout, April 22–30, 1977. J. Fish. Board Can. 1978, 35, 544–551. [Google Scholar] [CrossRef]
- Audunson, T. The fate and weathering of surface oil from the Bravo blowout. Mar. Environ. Res. 1980, 3, 35–61. [Google Scholar] [CrossRef]
- Fleischer, C.A. The Lessons of the Ekofisk Bravo Blow-out. In The Impact of Marine Pollution; Routledge: London, UK, 2019; pp. 135–154. [Google Scholar] [CrossRef]
- Myer, P.G. IXTOC I: Case study of a major oil spill. College of the Environment and Life Sciences of the University of Rhode Island, Theses and Major Papers in Marine Affairs 1984. Available online: https://core.ac.uk/download/pdf/56689435.pdf (accessed on 14 May 2021).
- Almar-Naess, A.; Haagensen, P.J.; Lian, B.; Moan, T.; Simonsen, T. Investigation of the Alexander L. Kielland failure—Metallurgical and fracture analysis. J. Energy Resour. Technol. Mar. 1984, 106, 24–31. [Google Scholar] [CrossRef]
- France, E.J. The Alexander L. Kielland Disaster Revisited: A Review by an Experienced Welding Engineer of the Catastrophic North Sea Platform Collapse. J. Fail. Anal. Prev. 2019, 19, 875–881. [Google Scholar] [CrossRef] [Green Version]
- Dier, A.; Carroll, B.; Abolfathi, S. Guidelines for Jack-Up Rigs with Particular Reference to Foundation Integrity. Research Report 289 Prepared by MSL Engineering Limited for the Health and Safety Executive 2004. Available online: https://www.hse.gov.uk/research/rrpdf/rr289.pdf (accessed on 14 May 2021).
- Heising, C.D.; Grenzebach, W.S. The Ocean Ranger oil rig disaster: A risk analysis. Risk Anal. 1989, 9, 55–62. [Google Scholar] [CrossRef]
- Al-Amirah, A.S. The Nowruz oil Spill in the Arabian Gulf: Case Study of Saudi Arabia. Geogr. Bull. 1985, 27, 82–89. [Google Scholar]
- Anonymous. Marine Casualty Report: Drill Ship Glomar Java Sea O.N. 568 182 Capsizing and Sinking in the South China Sea, on 25 OCTOBER 1983 with Multiple Loss of Life, U.S. Coast Guard Marine Board of Investigation Report and Commandant’s Action Report No. USCG 16732/0004 HQS 83. Available online: https://apps.dtic.mil/sti/pdfs/ADA166426.pdf (accessed on 14 May 2021).
- Maduro, W.P.; Reynolds, J. Enchova Blowout: Record Relief Time. In Proceedings of the SPE/IADC Drilling Conference, New Orleans, LA, USA, 28 February–3 March 1989. [Google Scholar] [CrossRef]
- Drysdale, D.D.; Sylvester-Evans, R. The explosion and fire on the Piper Alpha platform, 6 July 1988. A case study. Philos. Trans. R. Soc. London. Ser. A: Math. Phys. Eng. Sci. 1998, 356, 2929–2951. [Google Scholar] [CrossRef]
- Macleod, F.; Richardson, S. Piper Alpha-What have we learned. Loss Prevent. Bull. 2018, 261, 3–9. Available online: https://www.icheme.org/media/1982/lpb261_pg03.pdf (accessed on 21 May 2021).
- Broadribb, M.P. What have we really learned? Twenty five years after Piper Alpha. Process Saf. Prog. 2015, 34, 16–23. [Google Scholar] [CrossRef]
- Woolfson, C.; Beck, M. The British offshore oil industry after Piper Alpha. New Solut.: J. Environ. Occup. Health Policy 2000, 10, 11–65. [Google Scholar] [CrossRef] [PubMed]
- Brown, A.D. Authoritative sensemaking in a public inquiry report. Organ. Stud. 2004, 25, 95–112. [Google Scholar] [CrossRef] [Green Version]
- Mrozowska, A. Formal Risk Assessment of the risk of major accidents affecting natural environment and human life, occurring as a result of offshore drilling and production operations based on the provisions of Directive 2013/30/EU. Saf. Sci. 2021, 134, 105007. [Google Scholar] [CrossRef]
- Mannion, D. The Capsize of the Drillship Seacrest. J. Undergr. Eng. Res. Scholarsh. 2013. Paper Code: PT-13–Mannion. Available online: https://journals.library.mun.ca/ojs/index.php/prototype/article/download/410/508 (accessed on 14 May 2021).
- Xu, J.; Yu, Y.; Lu, C.; Liang, J. Marine Environmental Protection. Nat. Resour. Conserv. Res. 2018, 1, 8–14. [Google Scholar] [CrossRef]
- Baalisampang, T.; Abbassi, R.; Garaniya, V.; Khan, F.; Dadashzadeh, M. Modelling an integrated impact of fire, explosion and combustion products during transitional events caused by an accidental release of LNG. Process Saf. Environ. Prot. 2019, 128, 259–272. [Google Scholar] [CrossRef]
- Morais, C.P. Application of the 17 Practices of the Management System for Operational Safety on Marine Installations for Drilling and Production of Oil and Natural Gas in Brazil. In Proceedings of the Offshore Technology Conference, Rio de Janeiro, Brazil, 4–6 October 2011. [Google Scholar] [CrossRef]
- Fazeres-Ferradosa, T.; Rosa-Santos, P.; Taveira-Pinto, F.; Vanem, E.; Carvalho, H.; Correia, J. Advanced research on offshore structures and foundation design: Part 1. Proc. Inst. Civ. Eng.-Marit. Eng. 2019, 172, 118–123. [Google Scholar] [CrossRef]
- Daley, J. Mumbai High North Platform Disaster. J. Undergr. Eng. Res. Scholarsh. 2013. Paper Code: No. Daley-2013. Available online: https://journals.library.mun.ca/ojs/index.php/prototype/article/download/468/536 (accessed on 14 May 2021).
- Hanlon, C. The Usumacinta Disaster. J. Undergr. Eng. Res. Scholarsh. 2013. Paper Code: No. PT-13-Hanlon. Available online: https://journals.library.mun.ca/ojs/index.php/prototype/article/view/443/525 (accessed on 14 May 2021).
- De Andrade, J.; Sangesland, S. Cement sheath failure mechanisms: Numerical estimates to design for long-term well integrity. J. Pet. Sci. Eng. 2016, 147, 682–698. [Google Scholar] [CrossRef]
- Landucci, G.; Argenti, F.; Spadoni, G.; Cozzani, V. Domino effect frequency assessment: The role of safety barriers. J. Loss Prev. Process Ind. 2016, 44, 706–717. [Google Scholar] [CrossRef]
- Dubčakova, R.; Praks, P.; Moucka, L. Statistical model of quality of radon measurements using electret ion chamber detectors. Radiat. Prot. Dosim. 2011, 145, 295–299. [Google Scholar] [CrossRef]
- Atwood, C.L. Hits per trial: Basic Analysis of Binomial Data. Technical Report number EGG-RAAM-11041. Idaho National Engineering Laboratory. 1994. Available online: https://www.osti.gov/servlets/purl/10191270 (accessed on 21 July 2021).
- Fragassa, C.; Minak, G.; Pavlović, A. Measuring deformations in the telescopic boom under static and dynamic load conditions. Facta Univ. Ser.: Mech. Eng. 2020, 18, 315–328. [Google Scholar] [CrossRef]
- Vandenbussche, V.; Brude, O.W.; Tvedt, H. Effect of well capping as a blowout risk reduction measure. In International Oil Spill Conference Proceedings; American Petroleum Institute: Washington, DC, USA, 2014; Volume 2014, pp. 878–889. [Google Scholar] [CrossRef]
- Allford, L. Goal setting and prescriptive legal regimes in process safety. Loss Prev. Bull. 2019, 269, 23–24. [Google Scholar]
- Liu, K. Regulating health and safety at the workplace: Prescriptive approach vs. goal-oriented approach. Saf. Sci. 2019, 120, 950–961. [Google Scholar] [CrossRef]
- Necci, A.; Tarantola, S.; Vamanu, B.; Krausmann, E.; Ponte, L. Lessons learned from offshore oil and gas incidents in the Arctic and other ice-prone seas. Ocean Eng. 2019, 185, 12–26. [Google Scholar] [CrossRef]
- Yang, Y. Reforming health, safety, and environmental regulation for offshore operations in China: Risk and resilience approaches? Sustainability 2019, 11, 2608. [Google Scholar] [CrossRef] [Green Version]


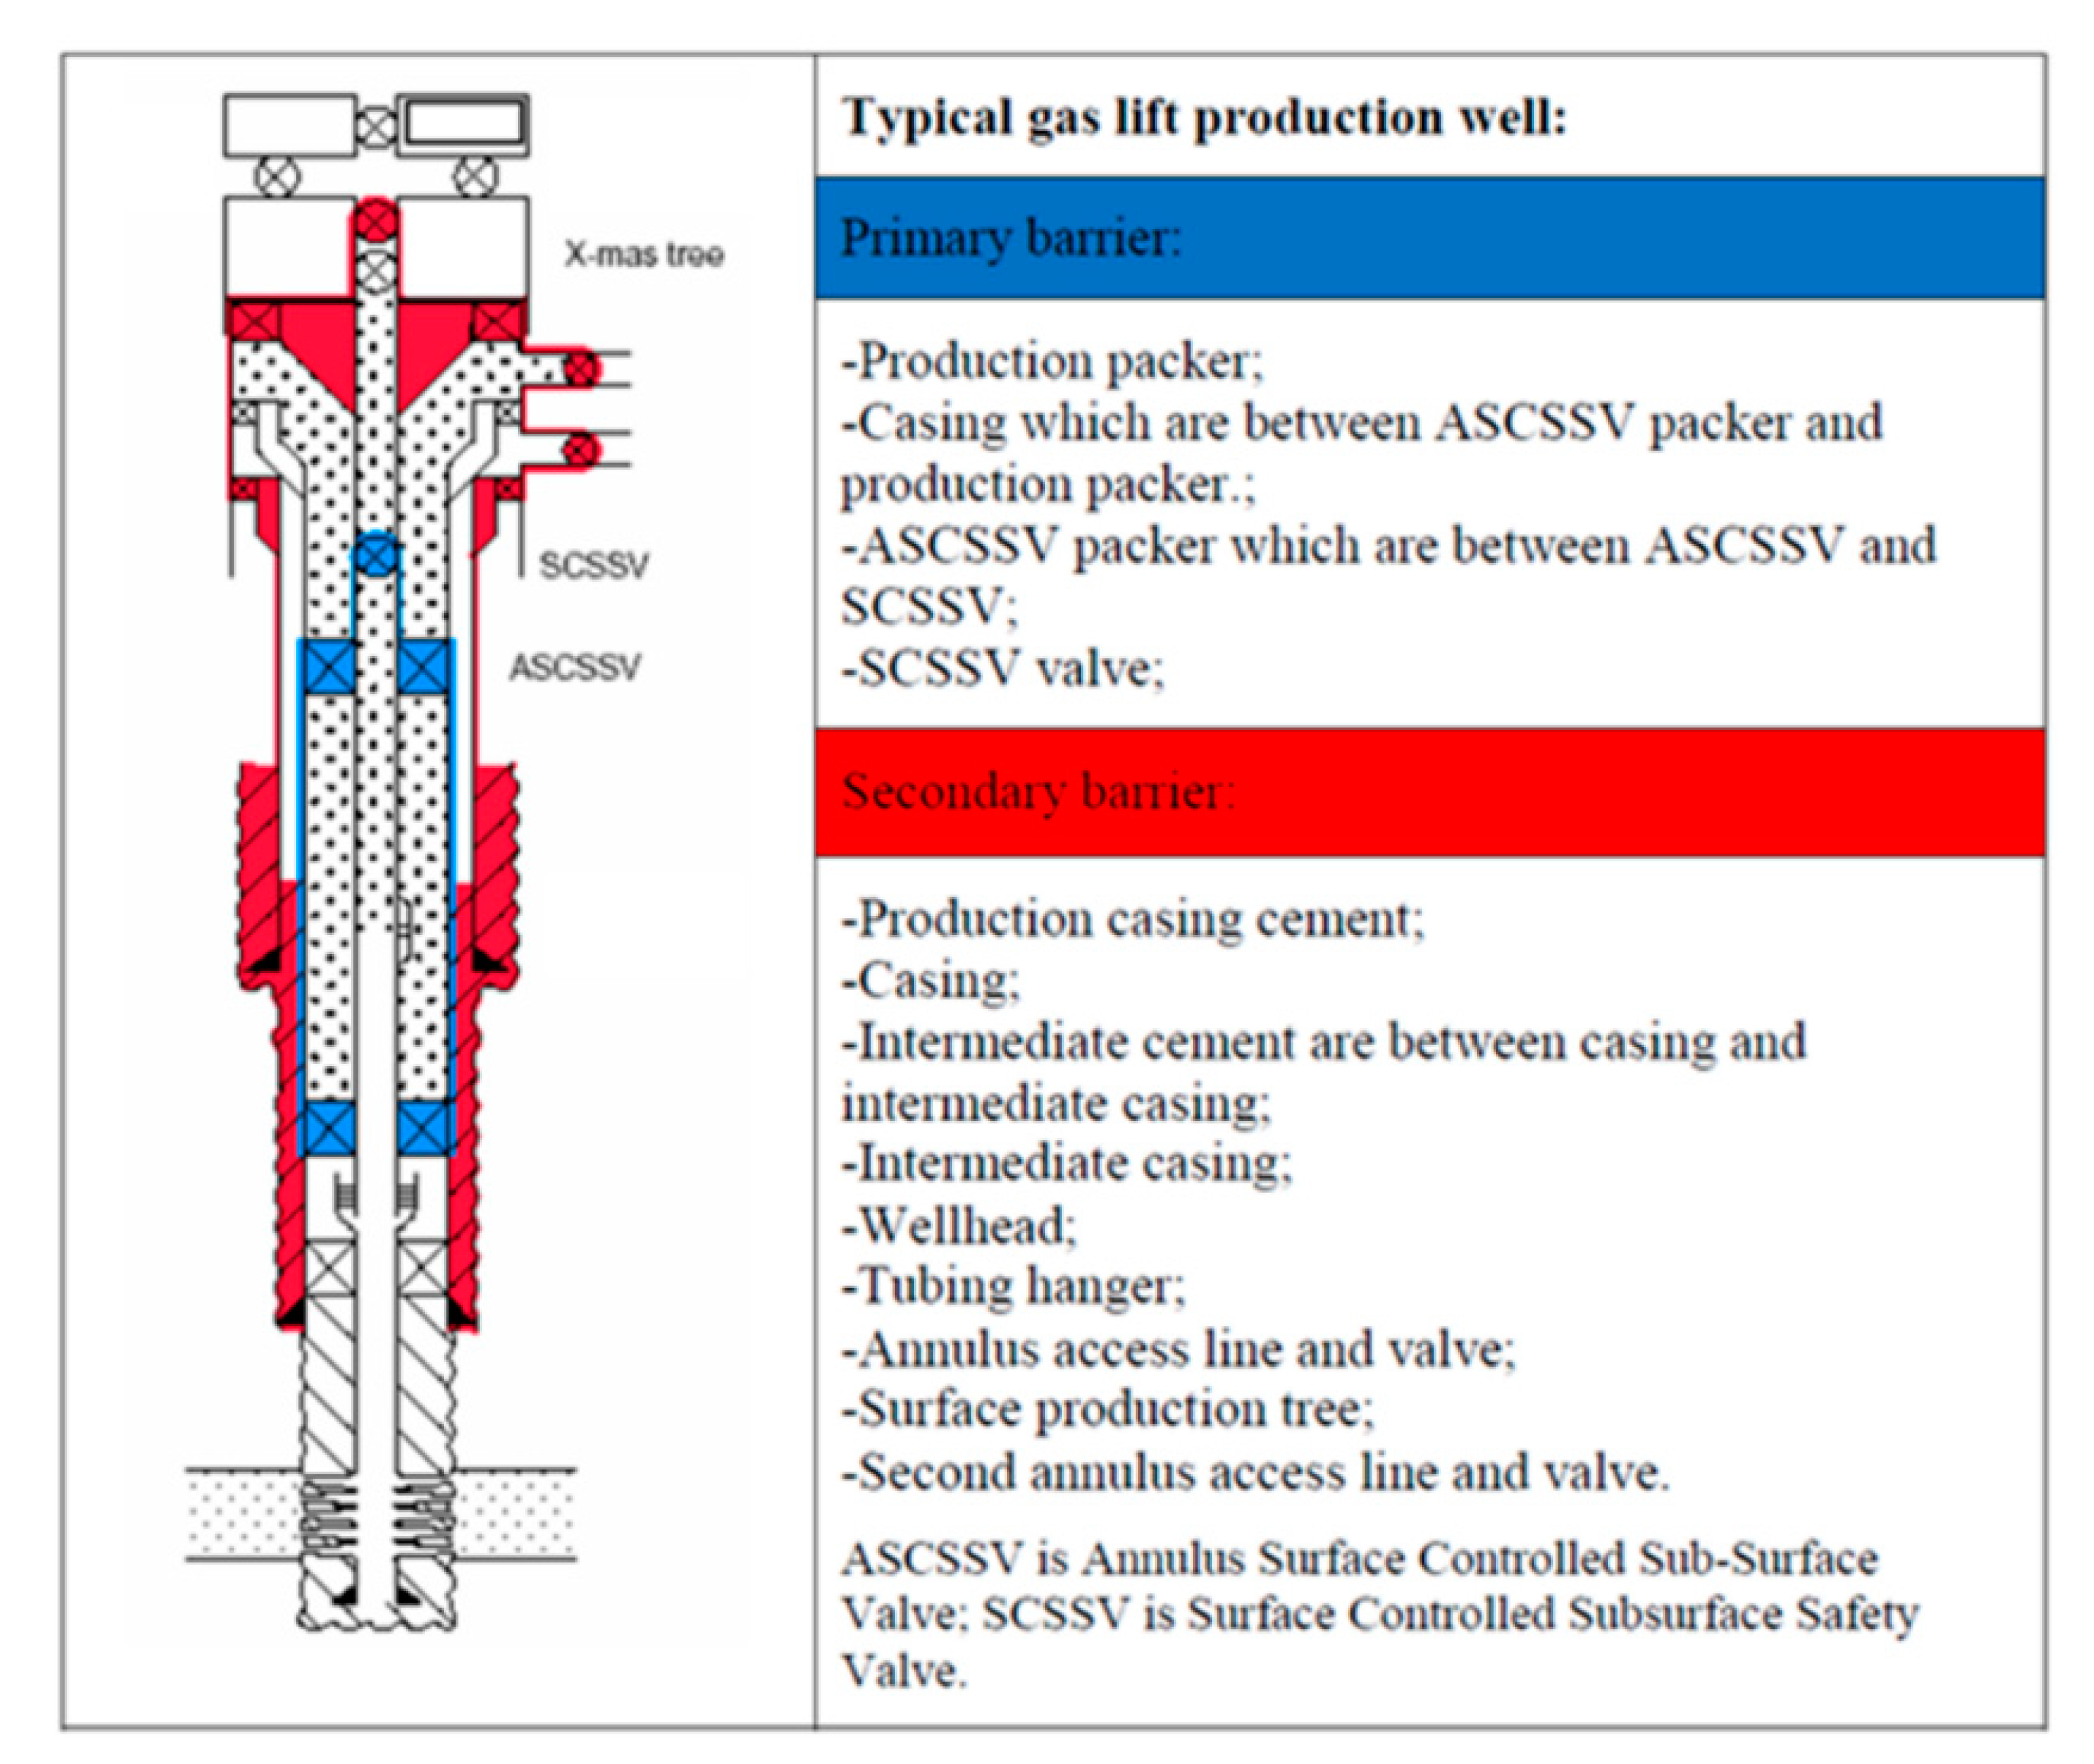
| Life Cycle Phase | Primary Barrier | Secondary Barrier |
|---|---|---|
| Drilling | Overbalanced drilling fluid (mud) | Casing cement, casing, wellhead, blowout preventer |
| Production | Casing cement, casing, packer, tubing, Downhole Safety Valve (DHSV) | Casing cement, casing, wellhead, tubing hangar and Christmas Tree |
| Intervention | Casing cement, casing, deep-set plug and overbalanced mud | Casing cement, casing, wellhead, BOP |
| Plug and abandonment 1 | Casing cement, casing and cement plug | |
| Type | Description of the Cause | Fire | Number of Fatalities | |
|---|---|---|---|---|
| 1. Qatar 1 jack-up rig | Jack-up rig | Collapsed during tow | No | 20 |
| 2. C. P. Baker | Drilling barge | Blowout | Yes | 21 |
| 3. Sea Gem | Jack-up rig | Material failure | No | 19 |
| 4. Gemini | Jack-up rig | Material failure | No | 18 |
| 5. Ocean Express | Jack-up rig | Vessel stability | No | 13 |
| 6. Ekofisk Bravo | Production platform | Blowout | No | 0 |
| 7. Ixtoc I | Semisubmersible drilling rig | Blowout | Yes | 0 |
| 8. Bohai 2 | Jack-up rig | Collapsed during tow | No | 72 |
| 9. Alexander L. Kielland | Semisubmersible accommodation vessel (floating hotel) | Material failure | No | 123 |
| 10. Bohai 3 | Jack-up rig | Blowout | Yes | 70 |
| 11. Hasbah 6 | Jack-up rig | Blowout | No | 19 |
| 12. Ocean Ranger | Semisubmersible drilling rig | Material failure | No | 84 |
| 13. Nowruz platform | Production platform | Blowout | Yes | 11 |
| 14. Glomar Java Sea | Drillship | Vessel stability | No | 81 |
| 15. Enchova Central | Fixed jacket production platform | Blowout | Yes | 42 |
| 16. Piper Alpha | Production platform | Error during maintenance | Yes | 167 |
| 17. Seacrest | Drillship | Vessel stability | No | 91 |
| 18. DB 29 | Pipeship | Collapsed during tow | No | 22 |
| 19. Petrobras P-36 | Production floating unit | Error during maintenance | Yes | 11 |
| 20. Adriatic IV | Gas production platform | Blowout | Yes | 0 |
| 21. Mumbai High North | Production platform | Collision | Yes | 22 |
| 22. Usumacinta | Jack-up rig | Collision | Yes | 22 |
| 23.Montara | Production platform | Blowout | Yes | 0 |
| 24. Macondo Deepwater Horizon | Semisubmersible drilling rig | Blowout | Yes | 11 |
| 1. | Severe Weather |
|---|---|
| 2. | Procedural failures (procedures not followed or inadequate, incompatibilities in procedures, communication failures, ineffective command structure during the accident, inadequate weather warnings, inadequate contingency plans) |
| 3. | Human factors (lack of training, inexperienced personnel, lack of knowledge of procedures or inability to respond in emergency) |
| 4. | Control system failure, including loss of well control and safety critical equipment maintenance faults |
| 5. | Mechanical failures |
| 6. | Design flaws |
| 7. | Escape, evacuation and rescue failures |
| Categories as Given in Table 3 | |||||||
|---|---|---|---|---|---|---|---|
| Accidents as Listed in Table 2 | 1 | 2 | 3 | 4 | 5 | 6 | 7 |
| 1. Qatar 1 jack-up rig | ● | ||||||
| 2. C. P. Baker | ● | ||||||
| 3. Sea Gem | ● | ||||||
| 4. Gemini | ● | ||||||
| 5. Ocean Express | ● | ● | |||||
| 6. Ekofisk Bravo | ● | ● | ● | ||||
| 7. Ixtoc I semi | ● | ● | ● | ||||
| 8. Bohai 2 | ● | ● | |||||
| 9. Alexander L. Kielland | ● | ● | |||||
| 10. Bohai 3 | ● | ||||||
| 11. Hasbah 6 | ● | ||||||
| 12. Ocean Ranger | ● | ● | ● | ● | ● | ||
| 13. Nowruz platform | ● | ||||||
| 14. Glomar Java Sea | ● | ● | |||||
| 15. Enchova Central | ● | ||||||
| 16. Piper Alpha | ● | ● | ● | ● | |||
| 17. Drillship Seacrest | ● | ● | ● | ||||
| 18. DB 29 | ● | ||||||
| 19. Petrobras P-36 | ● | ● | ● | ||||
| 20. Adriatic IV | |||||||
| 21. Mumbai High North | ● | ● | ● | ● | |||
| 22. Usumacinta | ● | ● | ● | ||||
| 23.Montara | ● | ● | |||||
| 24. Macondo Deepwater Horizon | ● | ● | |||||
| Σ | 8 | 10 | 6 | 11 | 5 | 3 | 6 |
| % of cause present in the 24 incidents | 33.3% | 41.6% | 25% | 45.8% | 20.8% | 12.5% | 25% |
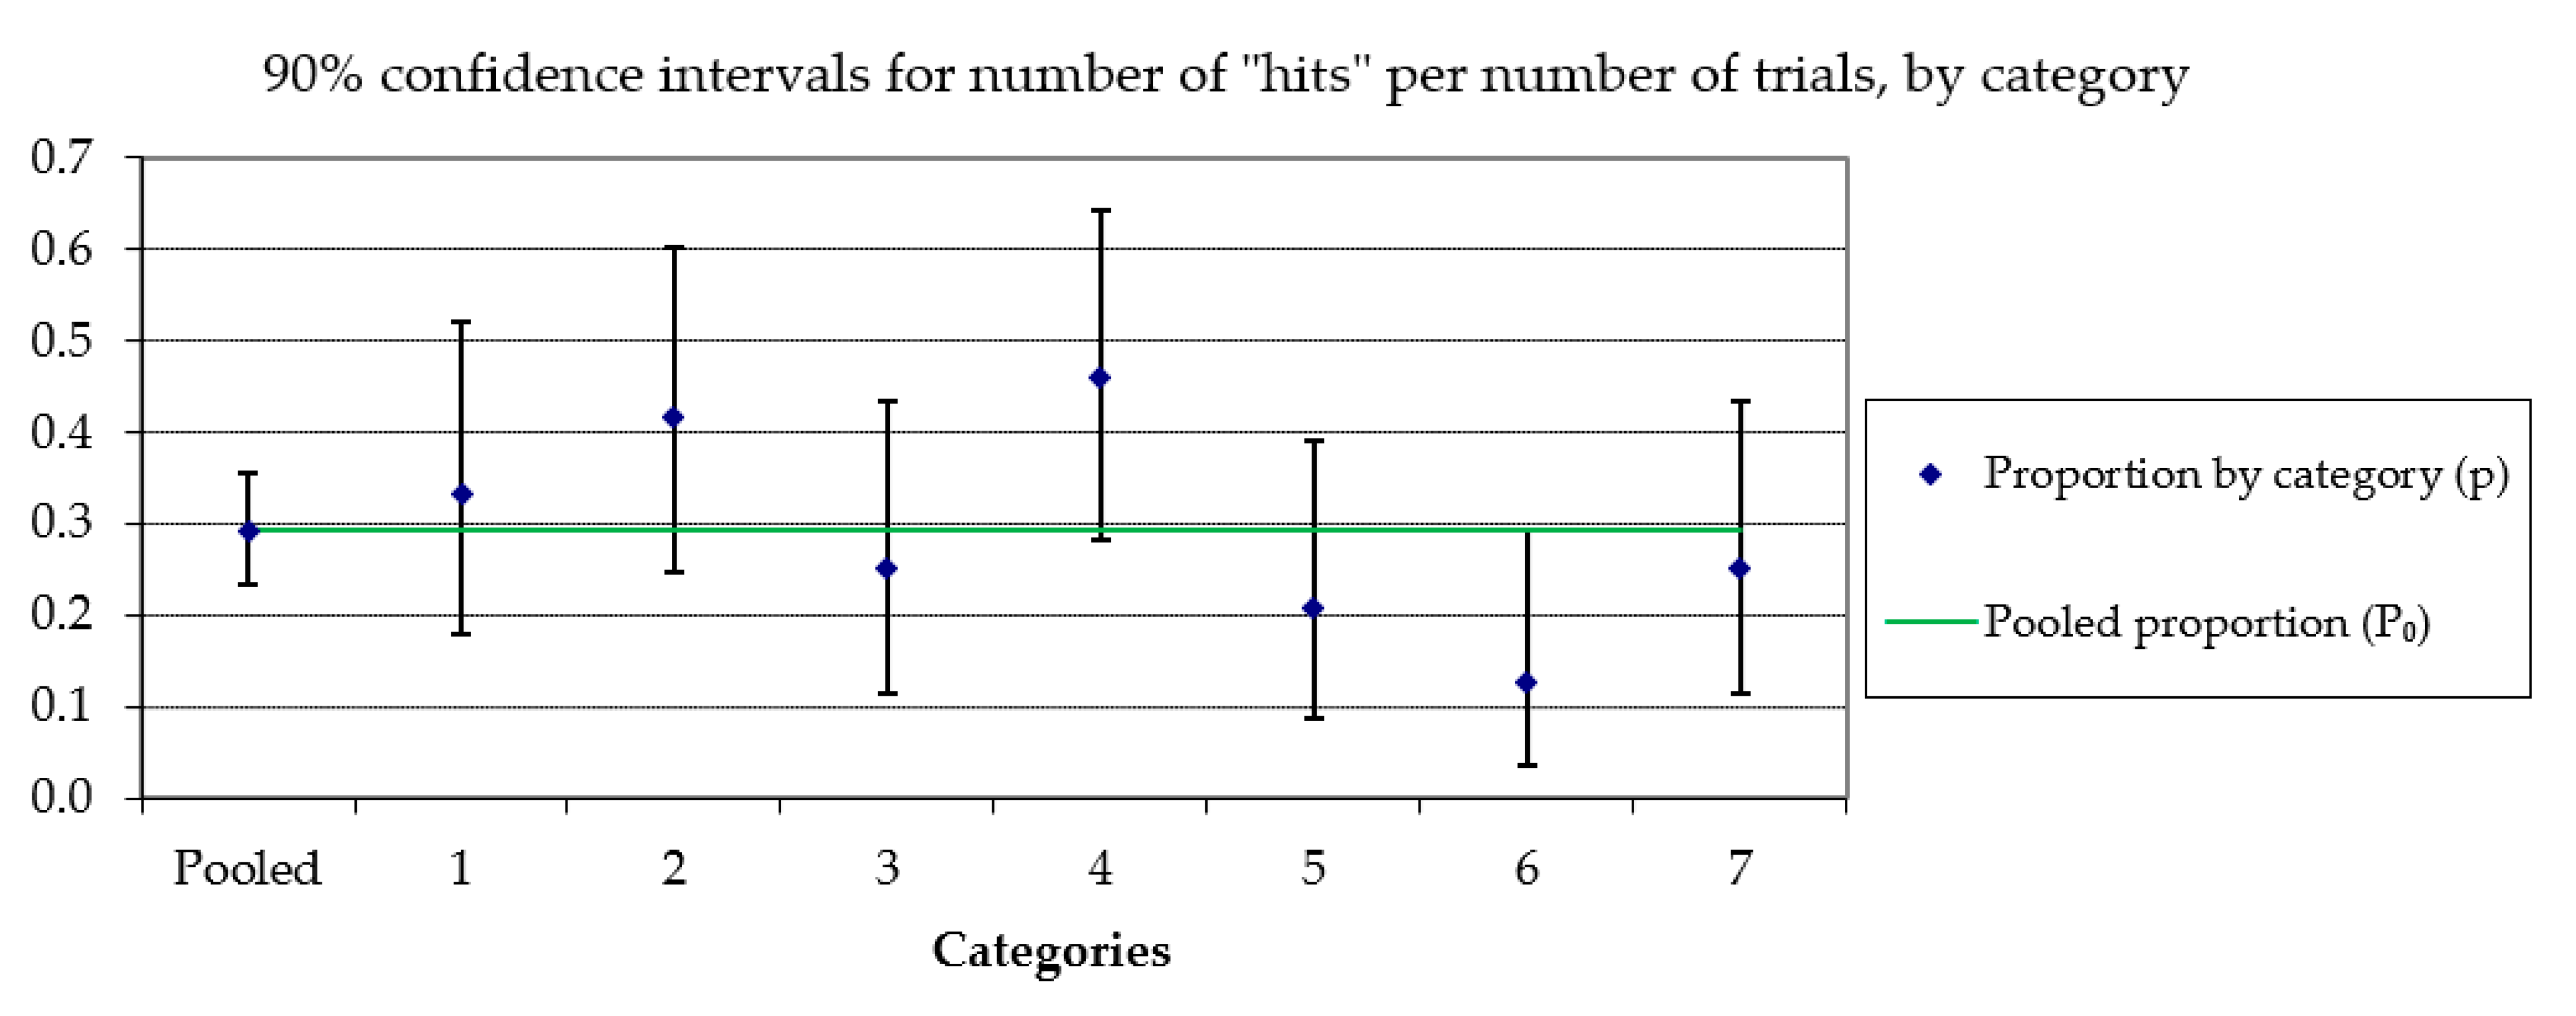
| Categories as Given in Table 3 | ||||||||
|---|---|---|---|---|---|---|---|---|
| Y (Category) 1 | Pooled | 1 | 2 | 3 | 4 | 5 | 6 | 7 |
| k: Number of “hits” | 49 | 8 | 10 | 6 | 11 | 5 | 3 | 6 |
| N: Number of trials | 168 | 24 | 24 | 24 | 24 | 24 | 24 | 24 |
| p = k/N | 0.292 | 0.333 | 0.417 | 0.250 | 0.458 | 0.208 | 0.125 | 0.250 |
| Lower Confidence Level—LCL | 0.234 | 0.178 | 0.246 | 0.115 | 0.282 | 0.086 | 0.035 | 0.115 |
| Upper Confidence Level—UCL | 0.355 | 0.521 | 0.603 | 0.435 | 0.642 | 0.389 | 0.292 | 0.435 |
Publisher’s Note: MDPI stays neutral with regard to jurisdictional claims in published maps and institutional affiliations. |
© 2021 by the authors. Licensee MDPI, Basel, Switzerland. This article is an open access article distributed under the terms and conditions of the Creative Commons Attribution (CC BY) license (https://creativecommons.org/licenses/by/4.0/).
Share and Cite
Brkić, D.; Praks, P. Probability Analysis and Prevention of Offshore Oil and Gas Accidents: Fire as a Cause and a Consequence. Fire 2021, 4, 71. https://doi.org/10.3390/fire4040071
Brkić D, Praks P. Probability Analysis and Prevention of Offshore Oil and Gas Accidents: Fire as a Cause and a Consequence. Fire. 2021; 4(4):71. https://doi.org/10.3390/fire4040071
Chicago/Turabian StyleBrkić, Dejan, and Pavel Praks. 2021. "Probability Analysis and Prevention of Offshore Oil and Gas Accidents: Fire as a Cause and a Consequence" Fire 4, no. 4: 71. https://doi.org/10.3390/fire4040071
APA StyleBrkić, D., & Praks, P. (2021). Probability Analysis and Prevention of Offshore Oil and Gas Accidents: Fire as a Cause and a Consequence. Fire, 4(4), 71. https://doi.org/10.3390/fire4040071