Article

How Much Does Fire Behavior of Leaf Litter Beds Change within Two Months?

Department of Plant Ecology and Ecotoxicology, Institute of Landscape and Plant Ecology, University of Hohenheim, August-von-Hartmann-Str. 3, 70599 Stuttgart, Germany
*
Author to whom correspondence should be addressed.
Submission received: 21 May 2019 / Revised: 6 June 2019 / Accepted: 14 June 2019 / Published: 14 June 2019

Abstract

:
Fire behavior is well-recognized as a function of fuel characteristics, but in practice the dynamics of fuels are often overlooked. Here we focus on short term changes in the fuel bed structure and fire behavior. Fire behavior and structural characteristics of leaf litter beds of Pinus halepensis, Ceratonia silique, and Quercus pubescens were examined. Three treatments were applied: testing freshly constructed samples (treatment “0”), exposure to a simulated precipitation event (treatment ”10”), and a two-month exposure to outside weather conditions (treatment “60”). The testing procedure allowed fire behavior testing without disturbing sample structure. Out of the tested species P. halepensis was most affected by the treatments, followed by Q. pubescens. C. silique showed no significant treatment effects. Response to the treatments could be attributed to pore space within the fuel bed, with more pore space relating to more dramatic treatment effects. In the treatment “0” P. halepensis and C. silique exhibited opposing fire behavior, but showed no significant differences in the treatment “60”. The measured effects show that short-term alterations in the fuel bed structure and fire behavior can be substantial, making it an issue that should be addressed in future research.

1. Introduction

Ever since terrestrial vegetation created an oxygen rich atmosphere and provided fuel for combustion, wildland fires are an inseparable part of the Earth system [1]. The Earth is intrinsically flammable, and most of the terrestrial plants can burn under appropriate climatic conditions [2]. Nevertheless, similar climatic conditions and vegetation types can support different fire regimes, depending on the vegetation flammability [3]. Even though definitions of flammability and metrics used to describe it differ between authors [2,4,5,6,7], evidence implies that plant species do differ in their tendency to ignite, to support fire and to facilitate fire spread (e.g., [2,7]). This evidence has been gathered at scales ranging from laboratory testing of small leaf fragments [8] to field experiments [9] and large-scale field surveys [10], encompassing modelling studies [11]. Furthermore, the relationships between plant functional traits and flammability are extensively investigated, with affirmative results [3,10,11,12,13,14].
Even though substantial work has been devoted to the leaf litter, it is mostly conducted on constructed leaf litter beds (sensu [15]) which are tested immediately after preparation. This approach eliminates several aspects of fuel bed dynamics, among which short-term structural changes are the focus of this work. Litter beds are dynamic fuels and their properties are continuously changing. Decomposition [16,17] and particle fragmentation [18,19] are recognized as important processes altering the fire behavior of the leaf litter beds. Another process appears important as well: compaction (i.e., an increase in the bulk density and packing ratio with a decrease in the amount of empty space within the fuel bed) of fuel beds under exposure to local weather condition was previously observed [18], but only recently quantified [20]. To quantify the effects of leaf compaction on fire behavior of the leaf litter beds a novel exposure and testing system was developed. This system enables exposure of standardized fuel beds in environments potentially altering its structure and chemical composition (e.g., in-stand exposure, exposure to outside weather conditions, greenhouse experiments with simulated precipitation events), their retrieval and fire behavior testing without disturbing the sample structure.
Our initial work [20] revealed species specific and potentially large effects of a 30 days winter exposure to outside weather conditions on fuel bed structure and fire behavior of deciduous tree species. Species with high initial bulk density (BD) were less affected by the exposure than species with low initial BD. Due to unexpectedly large effects detected in our initial work (e.g., the most affected species showed a 124.3% increase in BD), we were interested in further examining the matter.
Here, we compared effects of two different exposure periods (i.e., a simulated single precipitation event (treatment ”10”) and a two months exposure to outside weather conditions (treatment “60”)) to the common approach of testing fire behavior immediately after fuel bed preparation (treatment “0”). We tested three species common in the fire prone regions of the Mediterranean Basin: Aleppo pine (Pinus halepensis Mill.), carob (Ceratonia siliqua L.), and downy oak (Quercus pubescens Willd.). Whereas our initial work [20] focused solely on deciduous trees, here we included species belonging to different plant groups (evergreen conifers, evergreen broadleaved species and deciduous broadleaved species, respectively) and provide the first information on compaction of evergreen leaf litter beds. Based on the established relationships between leaf traits and fire behavior of litter beds [2,12,13,17,21,22,23] we expected different fire behaviors and different responses to the treatments for the tested species.
Ormeño and others [21] demonstrated that an increase in the terpene concentration of leaf litter results in higher, faster spreading flames and shorter combustion duration. The same effects were attributed to an increase in particle size, both for conifers [12,24] and broad-leaved species [13,22,23]. For oaks, lobed leaf edges were associated with higher flames and shorter flaming duration, compared to species with entire margins [13]. Furthermore, an increase in tissue density was related to slower flame spread and longer flaming duration [23]. Based on these relationships between plant traits and fire behavior, and the presumption that increasing thickness and density of leaf litter particles result in a more rigid fuel bed structure which would be less prone to compaction, the following hypotheses were established:
(i)
Resin rich, relatively long and thick (compared to broadleaved species) needles of P. halepensis would create leaf litter beds with low initial BD which would burn with high, fast spreading flames, low flaming duration and high fuel consumption, regardless of the treatment.
(ii)
Due to a large proportion of dense and thick leaf stems in the leaf litter and leaflet lamina thicker than those of Q. pubescens leaves, C. siliqua would create leaf litter beds with high initial bulk density. These fuel beds would burn with small, slow spreading flames, long flaming duration and low fuel consumption regardless of the treatment.
(iii)
Larger, thinner, lobed leaves of Q. pubescens would initially (“0” treatment) create leaf litter beds with low BD, which would burn similarly to P. halepensis litter beds.
(iv)
Due to low particle thickness and density Q. pubescens leaf litter would be susceptible to compaction, resulting in a pronounced increase of the BD in the treatments “10” and “60” compared to the treatment “0”.
(v)
The expected increase in BD of Q. pubescens would translate into alterations in the fire behavior, resulting in small, slow spreading flames and long flaming duration (i.e., in a fire behavior comparable to that of C. siliqua) in the treatment “60”.
Confirmation of our hypotheses would indicate that the presumed relationship between particle thickness, density and fuel bed compaction is correct. This would further imply that structural alterations of the leaf litter beds can be predicted based on the particle characteristics. Rejection of our hypotheses would imply that other characteristics have a higher influence on the short term alterations in the fuel bed structure.
Individual authors differently translate the measured fire behavior characteristics into flammability [2,6,7,25,26]. Here, we follow the suggestion given by [7], i.e., we focus on the metrics itself and discuss our results in terms of different fire behavior rather than in terms of a single flammability value.

2. Materials and Methods

2.1. Leaf Litter Handling

Leaf litter was collected by the officers of the Mljet National Park Public Institution, island of Mljet, Croatia (hereafter “Park”), within the territory of the National Park Mljet. P. halepensis litter was randomly collected in a mature forest stand. C. siliqua litter was gathered in old, abandoned, or extensively managed groves. Q. pubescens can be found on the island only as mature, solitary trees. For all species of interest freshly abscised leaf litter of mature trees, with no visible signs of decomposition, was collected, air dried, and initially stored within the Park’s facilities. Samples were sent to the Institute of Landscape and Plant Ecology, University of Hohenheim, Germany, where further processing and testing took place. After arrival at Hohenheim, leaf litter was dried for 72 h at 60 °C and then stored in open plastic boxes in a cold and dry room. Litter was dried once more (24 h at 40 °C) just before individual samples were weighted. After weighing, samples were randomly assigned to a treatment. To characterize fuel particles, 50 random leaf litter particles of P. halepensis and Q. pubescens were taken for detailed morphological measurements, while 50 random leaflets and 10 petioles were measured for C. siliqua.

2.2. Experimental Set-Up

Within the experiment two fuel loads of monospecific leaf litter and different combinations of two-species mixtures were tested (yielding a total of 115 tests). Reporting about all gathered data would exceed the scope of one single paper. Therefore, here we present the results of testing monospecific samples with a weight of 40 ± 0.5 g which were subjected to three different treatments: (i) treatment “0” in which samples were tested immediately after fuel bed construction: (ii) treatment “10” where constructed fuel beds were exposed to a single, simulated precipitation event and left in the greenhouse for 8–12 days before being tested; (iii) treatment “60” in which constructed fuel beds were tested after 59–63 days of exposure to outside conditions. All samples were constructed in the same manner. A small amount of material was dropped into a container; the container was consequently gently shaken to ensure uniform distribution of the litter. Once the whole sample had been transferred, leaf litter was gently pressed. Samples in treatment “0” were constructed directly in the testing cage, while samples in treatments “10” and “60” were established in the exposure construction and transferred to the testing cage prior to testing. Details on the exposure construction, testing cage and transfer process are given in [20]. In brief, the exposure construction was composed of a 20 cm × 20 cm aluminum mesh bottom with an edge 2.5 cm in height, and a fabric enclosure 13 cm in height. The fabric enclosure of the exposure construction was made of fiberglass reinforced PVC and rigid enough to stand on its own. Thus, no additional support was required in the treatment “10”. Treatment “10” samples were established in the greenhouse on planting tables with a mash surface (openings 25 × 25 mm, 2.75 mm wire diameter) (Figure S1). Once all samples were in place, a watering hose with a shower nozzle was used to simulate a single precipitation event. Water was gently and evenly sprinkled over the experimental surface until dripping was observed on the lower side of all samples.
Samples for treatment “60” were established on the grounds of the University of Hohenheim. To suppress vegetation growth a black plastic fabric was spread on a lawn. Washed quartz sand was spread on top of the fabric to ensure drainage and prevent excessive heating of the experimental area. Exposure constructions for samples in treatment “60” were placed on top of the sand and each construction was fixed to the ground with four skewer tent pegs 23 cm in length. To prevent disturbance by animals and foreign material falling into the samples, a protection net covered the whole experiment (Figure S1). Even though established in spring, treatment “60” simulated effects of the prolonged autumn exposure, as spring weather conditions in Stuttgart roughly correspond to autumn/winter weather condition on the island of Mljet (Figure S2). Treatment “10” simulated the effects of a single precipitation event, whereas treatment “0” represented the common approach of testing constructed leaf litter beds immediately after construction (e.g., [12,13,21,22,23,24]).
Biological interactions and fuel drying are site specific [27,28,29]. Thus, to eliminate the possibility of overestimating changes which would occur under Mediterranean conditions, treatments “60” and “10” were designed to promote fast fuel drying and minimize biological interactions. This reduced potential effects of decomposers and detritivores on the exposed material slowing down changes in the fuel bed structure and chemical composition. Consequently, significant effects of the treatments applied here would suggest that even larger effects could be expected if samples were exposed in the native stands under similar weather conditions.
Treatment “60” was established on 15 March 2017, and treatment “10” on 5 May 2017. Samples assigned to treatment “0” were stored in paper bags in a cold, dry room until two days before testing. All treatments were arranged in blocks. Two days before testing one random block of each treatment was placed in the drying cabinet at 40 °C for 24 h. After drying, samples were left in the fire behavior testing facility for 24 h to equilibrate. Mass differences between initial mass and pre-testing mass were low (4.25 ± 0.07%, average ± standard error) and no observable patterns were detected (ANOVA showed no significant treatment or species effects). Thus, we did not include this data into further analysis. Furthermore, as samples were exposed under the same conditions, both decomposition rate [30,31] and moisture adsorption/desorption [32,33] are governed by the intrinsic characteristics of the fuel and can be considered characteristics of the material itself. Position of the samples in the drying cabinet, in the fire behavior testing facility, and testing order were random. One full replicate (all treatment and materials) was tested each day. Fire behavior testing was performed on five consecutive days, starting on 15 May 2017. Temperature and relative humidity were logged (Tinytag TGU-4500 and Tinytag TGP-4017, Gemini Dataloggers Ltd., Chichester, UK) at hourly resolution in all facilities (Figures S2 and S3).

2.3. Fire Behavior Testing

To enable fire behavior testing of the samples formed in the exposure construction without disturbing their structure, a special combustion chamber was developed. For details on the combustion chamber refer to [20]. In brief, the stainless steel combustion chamber has an open front side providing air supply and an unobscured view of the burning samples. It is partially insulated with 2.5 cm thick vermiculite insulation board (V-1100 (700), Skamol, Nykøbing Mors, Denmark). A closable side door allows careful and precise handling of the sample. Within the combustion chamber a frame 2 cm in height was filled with washed and size calibrated dry quartz sand at room temperature, creating a surface of 20.5 cm × 21 cm. The sand surface was flattened and samples were carefully positioned on top of the sand. Samples were tested in a testing cage with an area of 21.0 cm × 21.5 cm and a height of 14.5 cm. The testing cage was covered with a fine stainless steel mesh. The back side of the testing cage could be flipped open, allowing samples to be gently slid inside. Before testing of samples from treatments “10” and “60”, the fabric enclosure of the exposure construction was carefully removed, and samples were placed in the testing cage together with the aluminum bottom of the exposure construction. Thus, the sample structure was preserved. To ensure uniformity of the testing procedure, the same type of aluminum bottom was placed in the testing cage before samples from treatment “0” were constructed. An IR lamp (1000W, 1.4–1.7 µm, 90 kW/m², with golden reflector, SRSystems GmbH, Bruchköbel, Germany), aligned with the lower edge of the litter sample, acted as a standardized linear ignition source. Ignition was piloted using a handheld spark generator. A digital camera (Power Shot SX280HS, Canon, Tokyo, Japan) was positioned in front of the combustion chamber, providing video records for all tests. The testing chamber was placed underneath a hood. No air movement was detected on top of the combustion chamber.
A stopwatch was started simultaneously with turning on the IR lamp. The spark generator was held in the smoke convection plume close to the fuel surface until flames appeared. Once flaming was initiated, the IR lamp was turned off. Times until flame appearance, flame reaching the rear side of the fuel bed, flame extinguishment and last ember extinguishment were recorded. Unburned residues were weighed and heated in the muffle furnace for 8 h at 550 °C to determine the ash content.
To ensure comparability with previous work, we strived to include only commonly used and previously well-defined characteristics [12,13,15]: flaming duration (FD), i.e., the time for which flames are visible, smoldering duration (SD), i.e., the time between flame extinguishment and extinguishment of the last ember, maximum flame height (FH), and rate of spread (RoS), i.e., the length of the fuel bed (20 cm) divided by the time required for the initiated flames to reach the rear side of the fuel bed. FH was determined by frame by frame analysis of the video records. VideoPad video editor software (NCH Software, Greenwood Village, CO) was utilized to extract the frame of interest, and Image J [34] to measure the maximum flame height (Table S1).
Due to the distribution characteristics of our data, we report “unconsumed” (UC), i.e., the percentage of fuel remaining after burning (100%–% consumed), instead of the commonly reported consumed percentage of the fuel. Furthermore, we corrected UC for the ash content [20]. Time was recorded with an accuracy of 0.01 s, masses with an accuracy of 0.01 g, FH was determined with an accuracy of 0.01 cm, and RoS is expressed in cm s−1.

2.4. Fuel Characteristics Measurements

As the chosen species are markedly different, we consider it unnecessary to discuss in detail the differences between morphological characteristics measured at the particle level. Nevertheless, in order to confirm that the relations between species presumed in our hypotheses (i.e., Q. pubescens having thinner, larger, and less dense litter particle that remaining two species, P. halepensis having relatively long needles, C. siliqua having dense and thick petioles and leaflets) are true, details on the measuring procedure and the measured values are provided in the supplementary material (Table S2).
Sample height was measured at three random positions within the fuel bed just before testing. Sample volume was calculated by multiplying sample area (400 cm2) with sample height, and bulk density (BD) as dry mass divided by sample volume. Packing ratio (PR), i.e., the fraction of the fuel array volume that is occupied by fuel, was calculated as BD divided by the average particle density [35].

2.5. Data Analysis

Since fire behavior characteristics tend to be highly correlated [7,13,16,25], principal component analysis (PCA) was used to investigate the association between FD, SD, RoS, FH and UC. The purpose of the PCA was to explore the structure of the fire behavior data, thus fuel bed characteristics (BD, PR) or measurements taken on the particle level were not included. PCA was performed on scaled parameters (mean = 0, standard deviation = 1). If necessary, parameters were transformed before scaling.
Fire behavior parameters with high loadings to the same PC exhibited similar behavior, thus further analyses were conducted on PC scores. K-means clustering was performed to investigate the association between individual samples when scores on both PC-s are taken into account. To check for significance of the effects of treatment, species and their interactions, Two-Way ANOVA with species and treatment as fixed factors was performed on the PC scores, BD and PR. ANOVA was followed by pairwise contrasts with Tukey adjustment for multiple comparisons. Effect size was expressed as partial eta-squared [36].
Finally, to investigate to which extent differences in the fuel bed aeration can explain fire behavior of the leaf litter beds, regression analyses with BD or PR as independent and PC scores as dependent variable were performed. BD and PR both relate negatively to fuel bed aeration [22,24,26,35]) and exhibited similar relationships with PC scores (Figure S4). Thus, only the relationships with BD as independent variable are presented in the main article. Regression analyses were performed on the whole data set and separately for individual species. All measured values were included in all analyses (N = 45 for overall and N = 15 for species-based regression analyses). Results of the same analyses (ANOVA with post hoc test and effect size (Table S3), regressions with BD or PR as independent variables (Figure S5)) conducted on the measured fire behavior characteristics are reported in the supplementary material. The fuel bed structure used and the fire behavior data are also given (Table S4).

3. Results

3.1. Fire Behavior Characteristics and Grouping of Samples

Results of the PCA showed a separation of the parameters related to flaming (FH, RoS, and FD) and fuel consumption (UC) on the two independent axes (Figure 1). PC1, which explained 54.0% of the variation, was characterized by high, positive loading of FH (0.92) and RoS (0.90), and high negative loading of FD (−0.74). Thus, an increase on the PC1 score related to higher and faster spreading flames with lower flame persistence. UC was the only parameter with very high (>0.90) loading on PC2 (0.92), thus a higher PC2 score related to higher UC indicating lower fuel consumption. SD had intermediate, positive loading on both PCs, indicating that an increase of the score on either of the PCs was related to the increase in SD.
Cluster analysis revealed that all but one data point of C. siliqua clustered together (blue cluster) and showed no visible separation between the treatments (Figure 1). The cluster dominated by C. siliqua was characterized by a negative score on PC1 indicating low FH, low RoS, low SD, and high FD (Table S3). The C. siliqua data point clustering within the yellow cluster related to the only sample in which flames extinguished before reaching the rear side of the fuel bed. This sample had exceptionally high UC, and its RoS was assessed based on the flaming duration and the distance flames reached. All other C. siliqua data points had either a low positive or a negative score on the PC2 axis indicating an intermediate to high fuel consumption (i.e., intermediate to low UC).
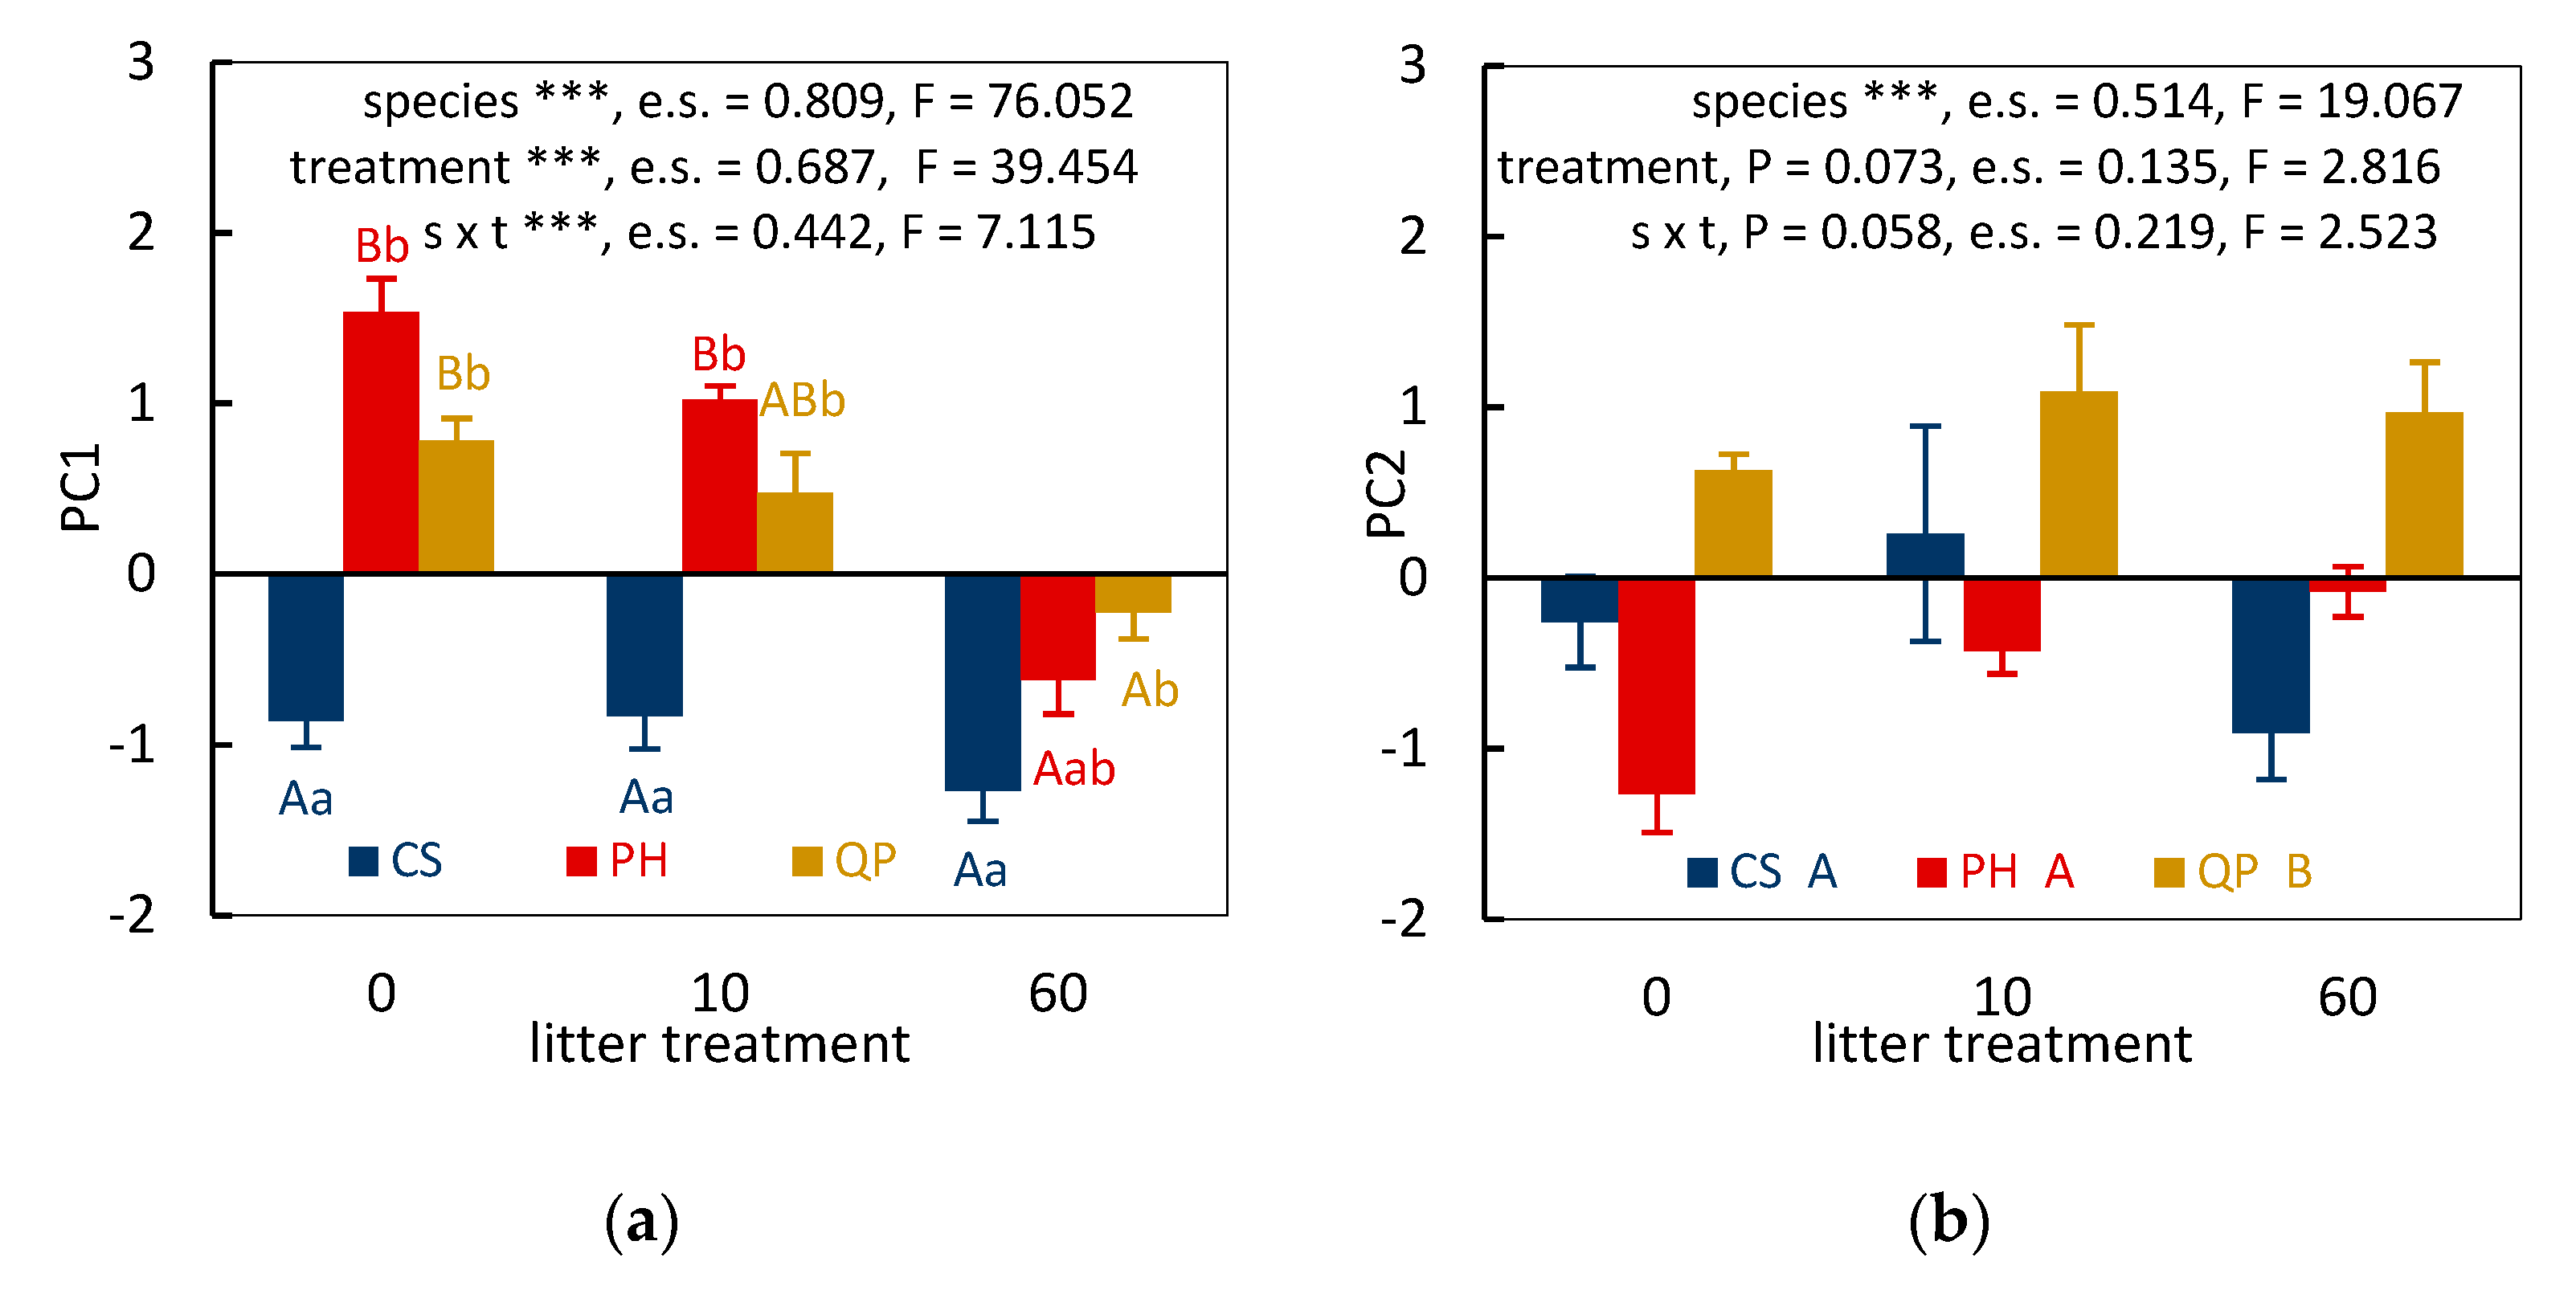
All but one data point of Q. pubescens clustered together (yellow cluster, Figure 1). Compared to the other two clusters, the yellow cluster had higher PC2 scores (e.g., lower consumption) and intermediate scores on the PC1 axis. Unlike C. siliqua, Q. pubescens showed separation of the treatments along the PC1 axis. For Q. pubescens all samples from treatment “0” had PC1 scores higher than 0.4. Samples from treatment “10” exhibited a slight shift towards lower PC1 scores, whereas all Q. pubescens samples from treatment “60” had a PC1 score lower than 0.05. These results indicate decreasing FH and RoS, and increasing FD from treatment “0” to treatment “60” (Table S3).
P. halepensis showed the largest separation of treatments along the PC1 axis. Treatments “0” and “10” of P. halepensis clustered together (red cluster, Figure 1) in a cluster associated with the highest PC1 scores and a negative PC2 score, indicating high FH, high RoS, low FD, and high fuel consumption (low UC) (Table S3). Despite clustering together, treatment “10” exhibited a slight shift towards lower PC1 and higher PC2 values, compared to treatment “0”. Further, a pronounced shift towards lower PC1 scores occurred between treatments “10” and “60”. Within treatment “60” all P. halepensis samples clustered with C. siliqua (blue cluster, Figure 1.), and exhibited low FH, low RoS, low SD, and high FD (Table S3).

3.2. Significance of Treatment Effects

ANOVA results show that PC1 scores were significantly affected by species, treatment and their interactions (Figure 2a), whereas PC2 scores were significantly affected only by the species (Figure 2b). Furthermore, ANOVA results reinforced the separation patterns observed in Figure 1. C. siliqua showed no significant between treatment differences of PC1 scores (Figure 2a) and it was consistently the species with the lowest mean PC1 score. Within species comparisons of PC1 scores for the other two species showed significant between treatment differences. For both P. halepensis and Q. pubescens the mean PC1 score decreased from treatment “0” to treatment “60”, with treatment “10” having an intermediate value. Nevertheless, P. halepensis exhibited a much larger decrease than Q. pubescens. P. halepensis was the species with the highest mean PC1 score in the treatments “0” and “10”, and in these two treatments it grouped with Q. pubescens. In treatment “60” P. halepensis had an intermediate mean PC1 score and did not significantly differ from either Q. pubescens or C. siliqua. The PC1 score of Q. pubescens remained significantly higher than that of the C. siliqua in all treatments. The PC2 score of Q. pubescens was significantly higher than that of the other two species, which did not differ from each other (Figure 2b).
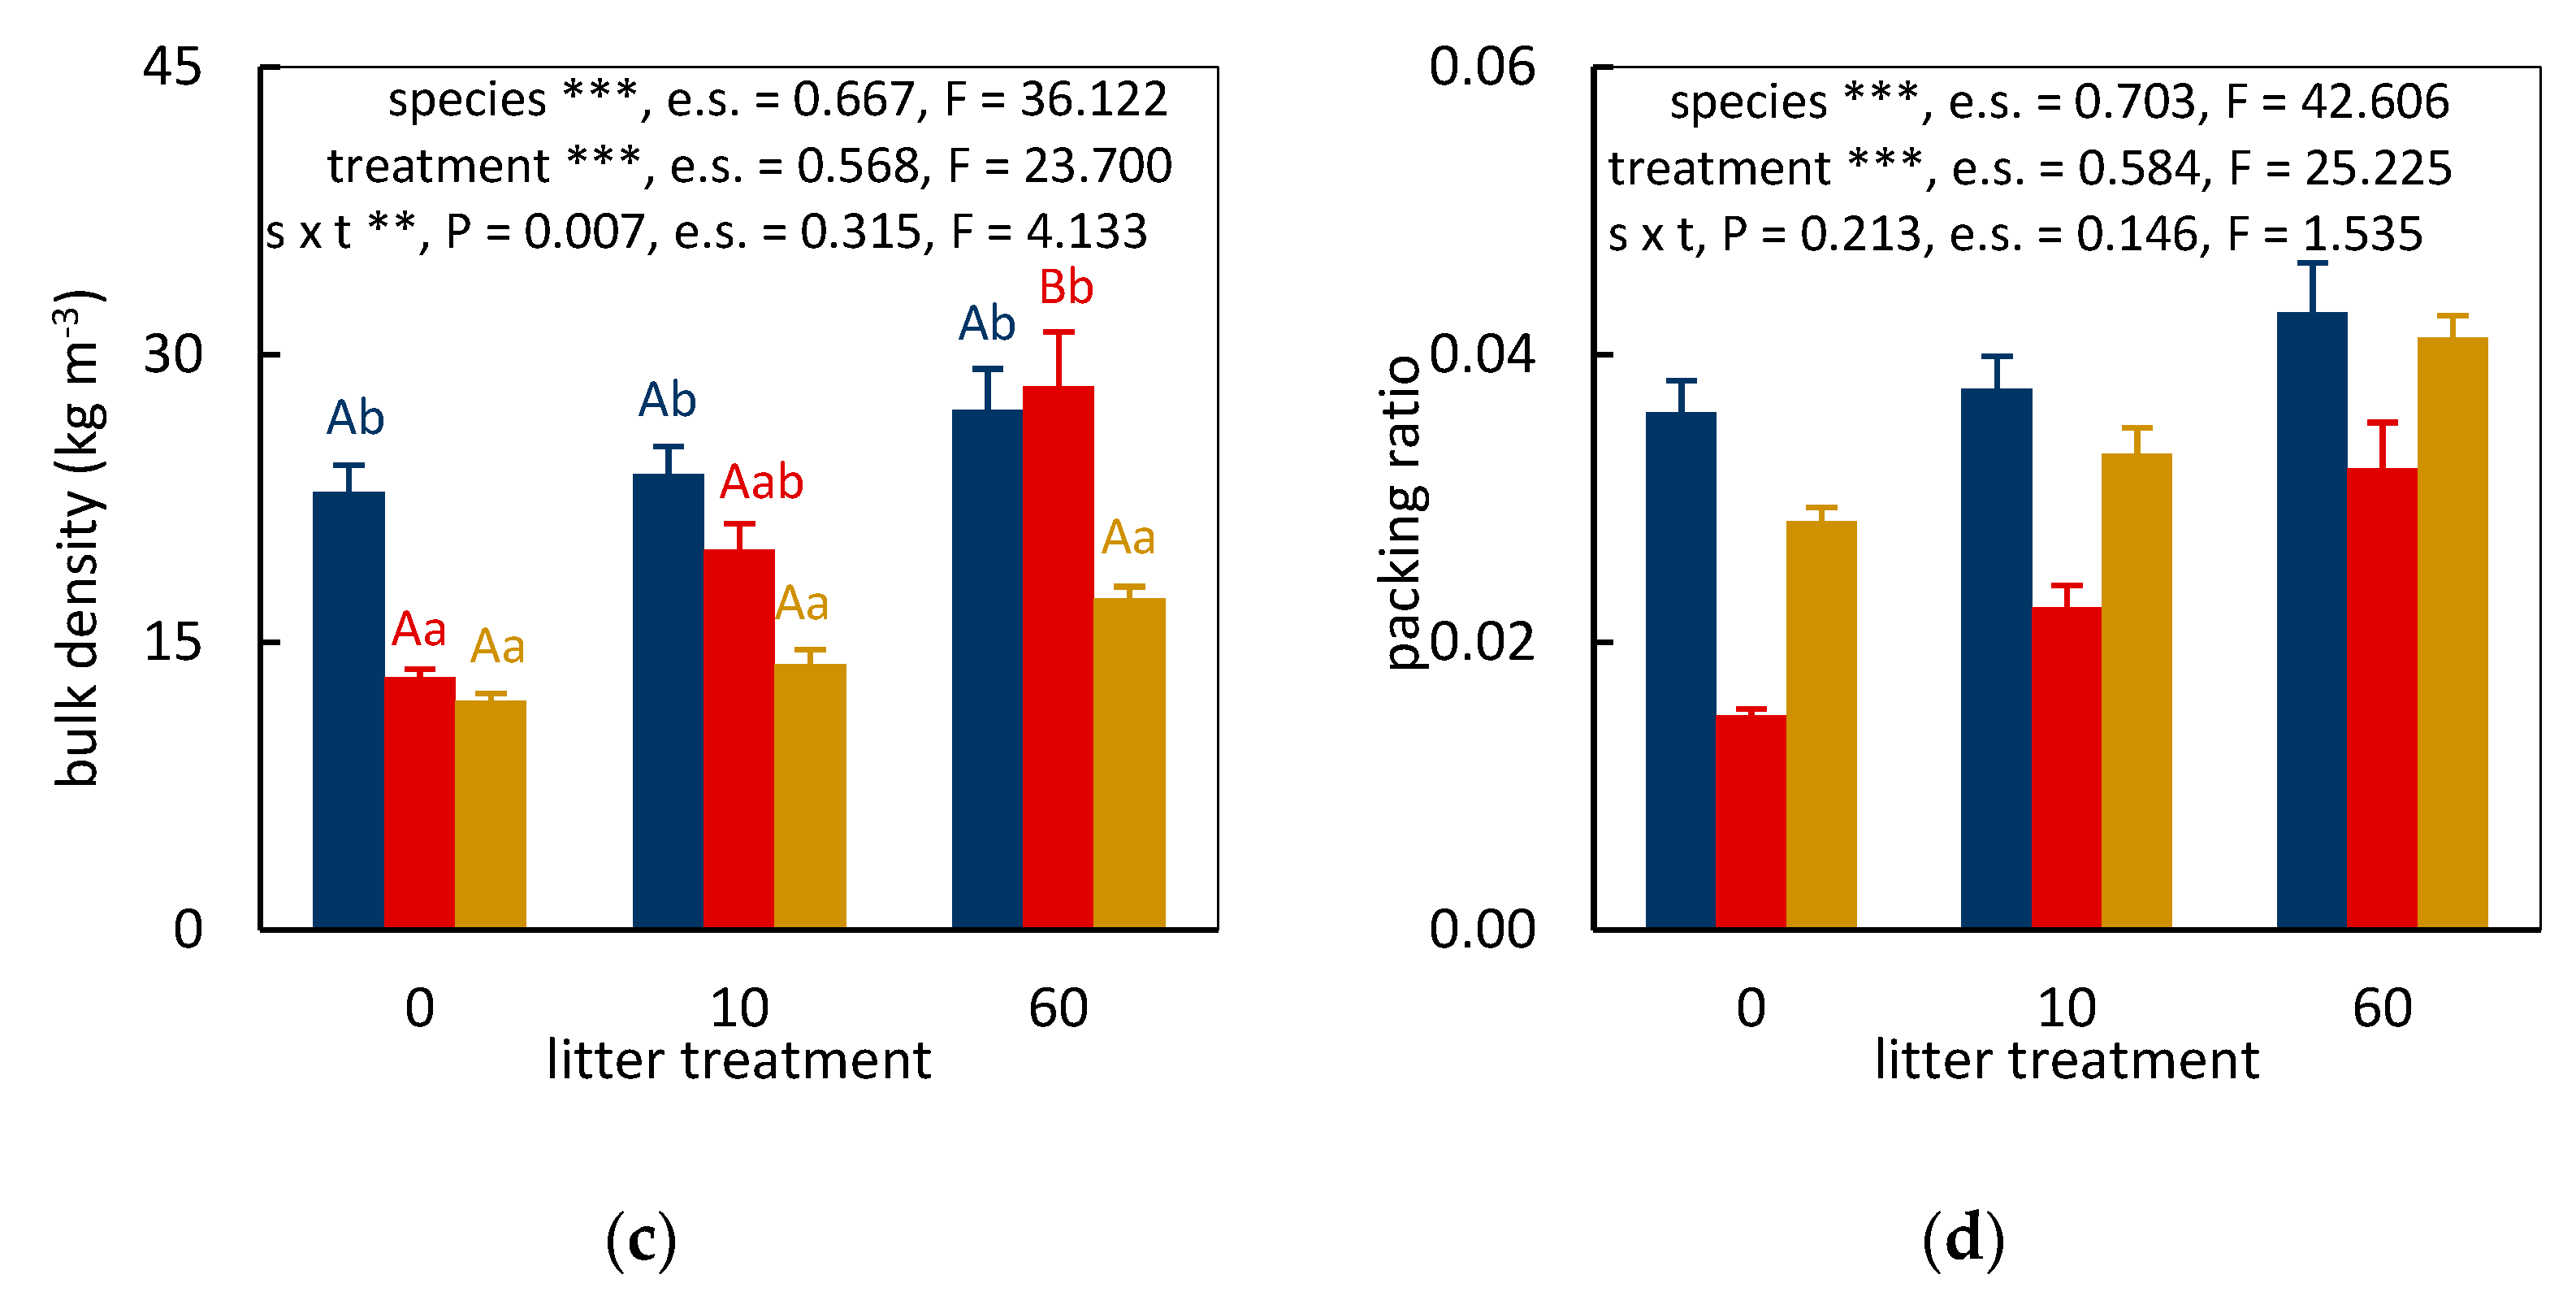
Mean BD and PR increased for all species from treatment “0” to treatment “60”, with treatment “10” having an intermediate value (Figure 2c,d). Nevertheless, the significance of the increase and the ordering of species differ between the structural characteristics employed. BD was significantly affected by species, treatment, and their interactions, whereas PR was significantly affected by species and treatment, but not by their interactions (Figure 2c,d). As interactions were not significant, within species or within treatment comparisons were not conducted for PR. Nevertheless, comparisons on the species and treatment level showed that all species and all treatments significantly differed from each other based on PR. C. siliqua constantly had the highest, Q. pubescens an intermediate and P. halepensis the lowest PR (Figure 2d). C. siliqua maintained a high, and Q. pubescens a low, BD in all treatments. P. halepensis had a low BD in treatment “0” and grouped with Q. pubescens. In treatment “10” the BD of P. halepensis did not significantly differ from either Q. pubescens or C. siliqua. In treatment “60” P. halepensis was the species with the highest average BD, grouping only with C. siliqua. BD of Q. pubescens and C. siliqua significantly differed from each other in all treatments. Furthermore, BD of P. halepensis was significantly higher in treatment “60” than in treatment “0”. Within species comparisons of BD did not show significant between treatment differences for the other two species.

3.3. Fuel Bed Aeration and Fire Behavior of Leaf Litter Beds

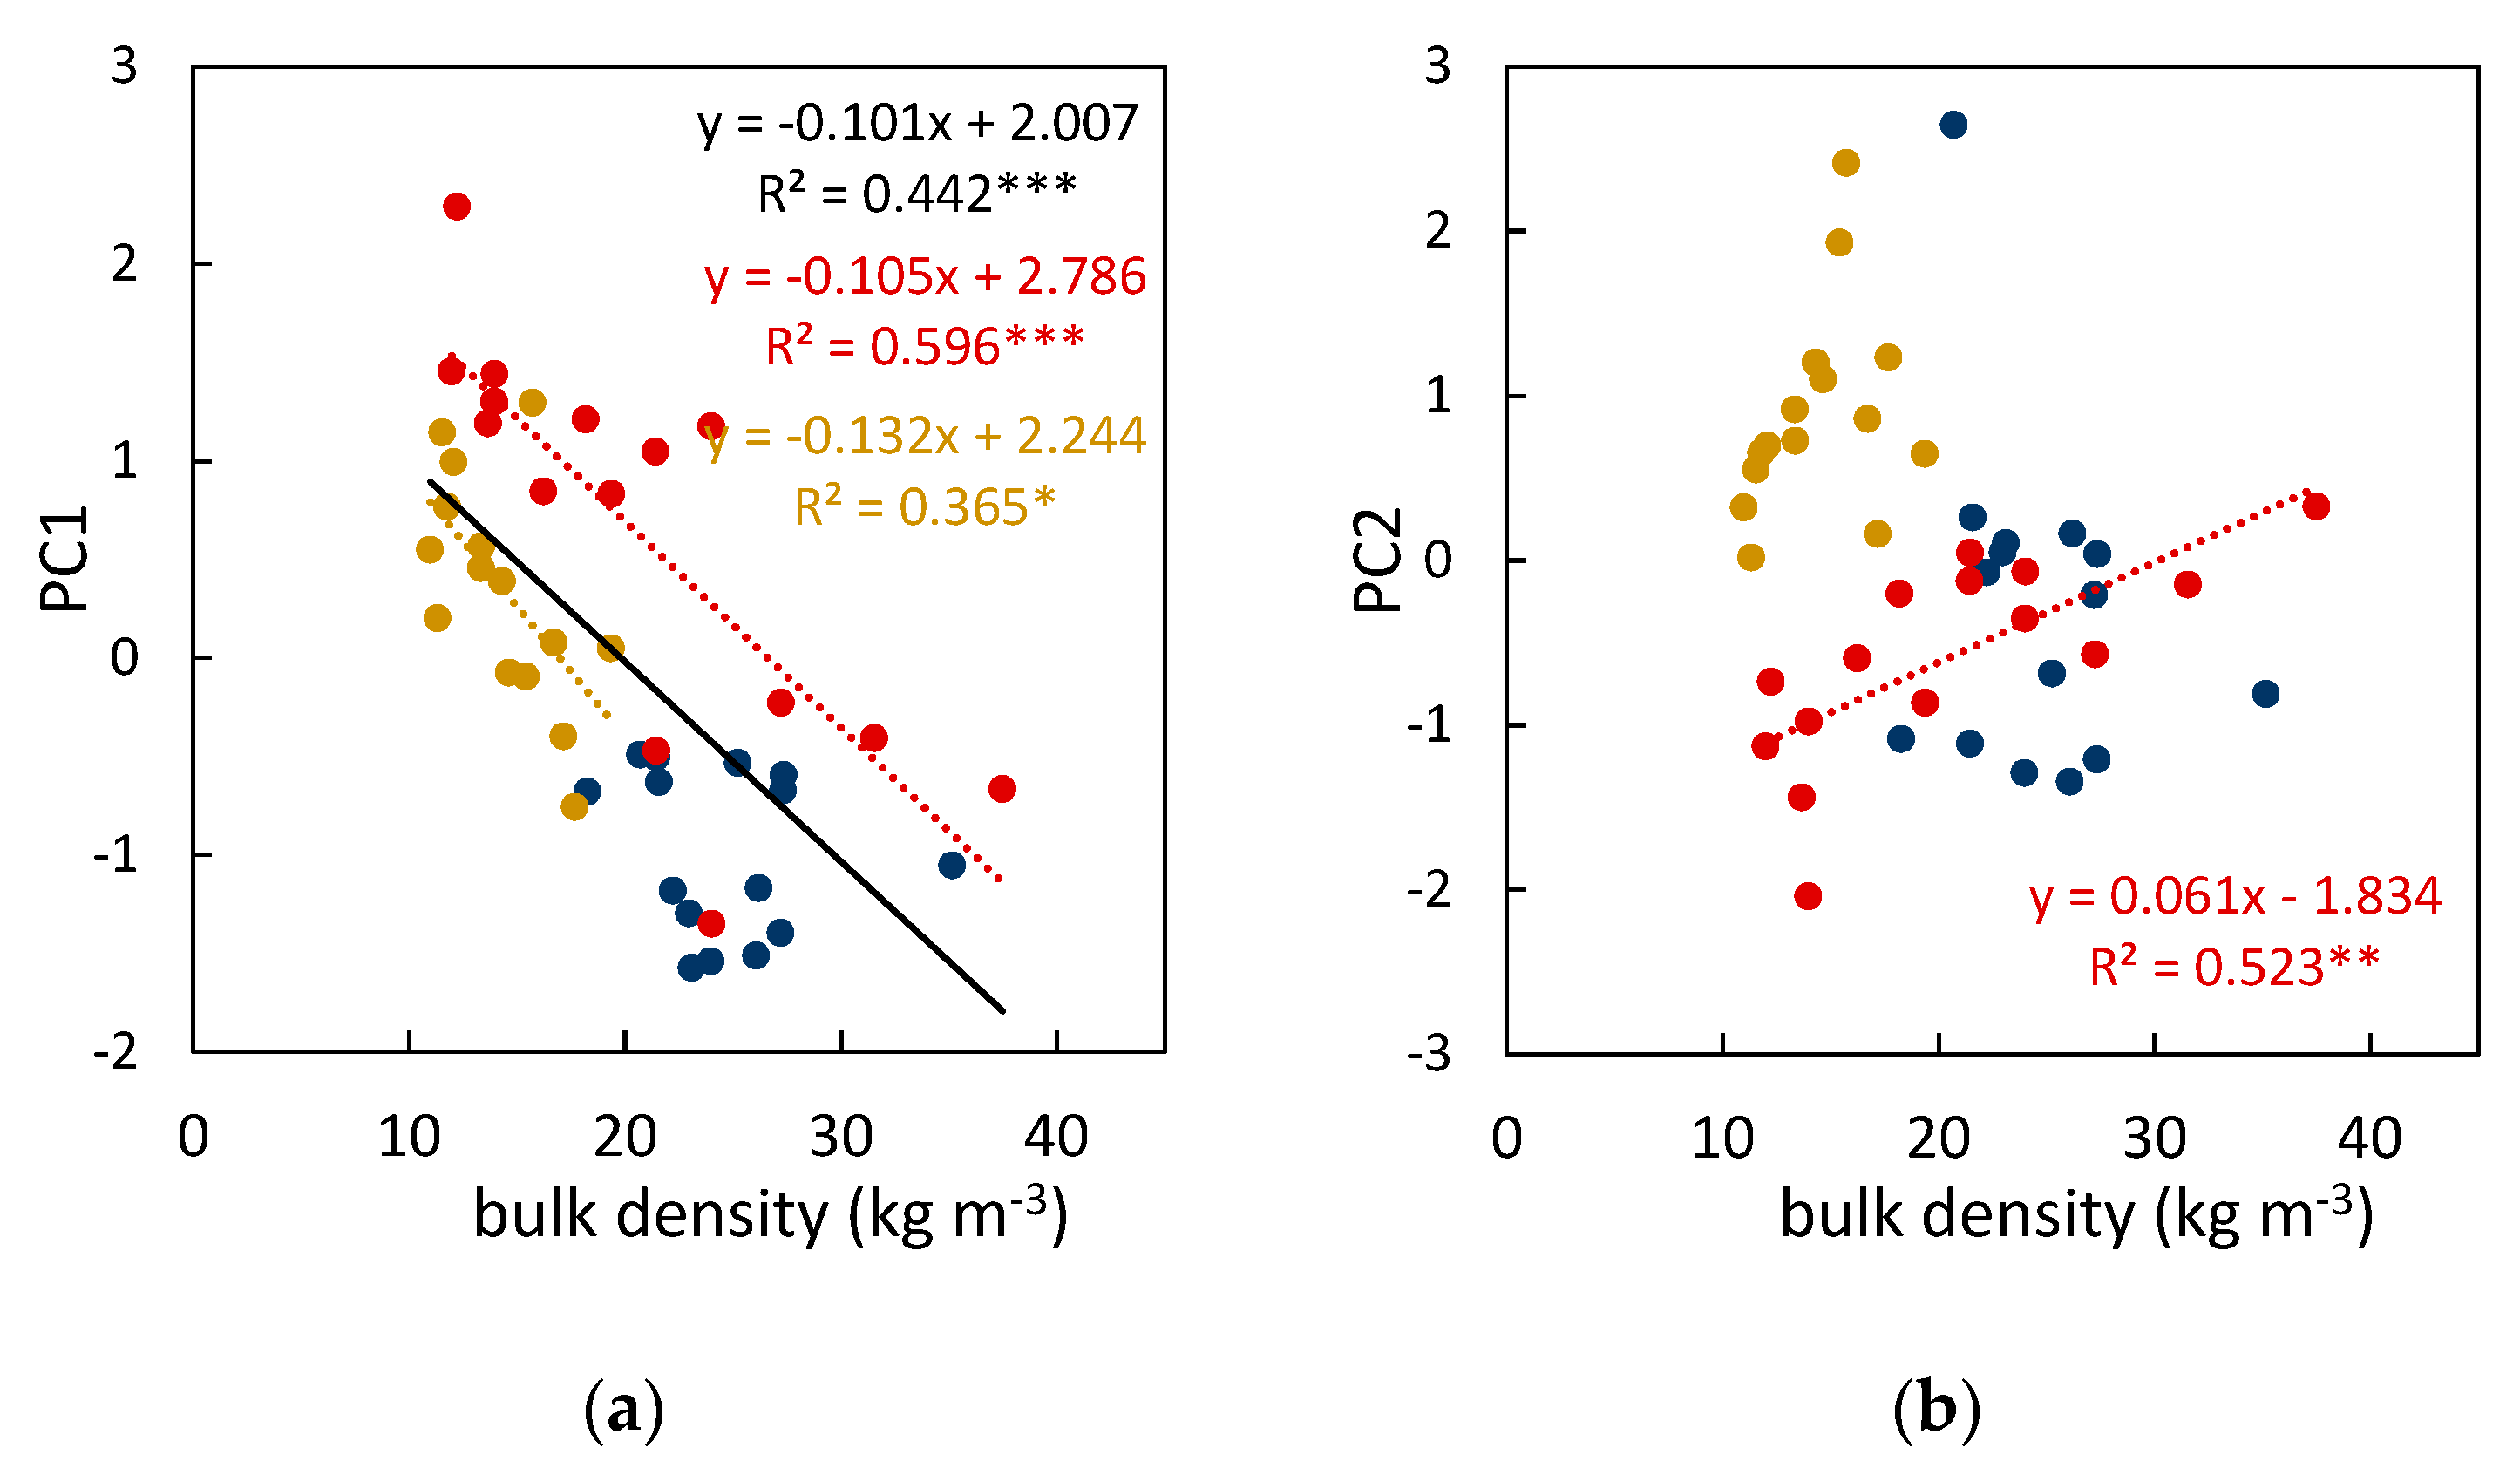
Results of the regression analysis showed a negative linear relationship between BD and PC1 score for the whole data set (R2 = 0.442, p < 0.001), for P. halepensis (R2 = 0.596, p < 0.001) and for Q. pubescens (R2 = 0.340, p < 0.05) (Figure 3a). Only the PC2 score of P. halepensis exhibited significant relationships with BD (Figure 3b). The same relationships which were significant when BD was used as independent variable were significant when PR was used instead. They also exhibited the same direction, thus we chose to include only BD results in the main article and present PR results in the supporting information (Figure S4).

4. Discussion

4.1. Current Understanding of the Fire Behavior of the Leaf Litter

Treatment “0” in our study corresponds to the common approach of testing constructed fuel bed samples directly after sample preparation (e.g., [12,13,21,23,24]). Being both criticized [15,37] and defended [38], testing of freshly-prepared constructed samples represents the basis for establishing relationships between particle characteristics, fuel bed structure and fire behavior of litter fuels (e.g., [7,12,13,17,21,22,23]).
Species tested within treatment “0” behaved in accordance with our hypotheses. High PC1 loading of P. halepensis, relating to high FH, RoS and short FD, could be attributed to relatively long needles creating well aerated fuel beds [12]. Lower PC1 loading of C. siliqua compared to the other two species, indicating lower FH and RoS, and longer FD (Figure 1, Table S3), can be attributed to the high presence of leaf petioles which are characterized by high thickness and density (Table S2). Particle thickness and tissue density were shown to relate negatively to RoS [26] and positively to FD [39]. Furthermore, C. siliqua had higher BD and PR in treatment “0” (Figure 2c,d) than the other two species. Theoretically, increasing BD results in lower fuel bed aeration and reduces heat penetration beyond the upper layers of the fuel bed, resulting in reduced fire intensity and slower fire spread [35]. Experimental studies support the theory and show that an increase in BD (i.e., decrease in sample height, in studies which hold fuel load constant) results in decreasing FH [13,21] and RoS, and increasing combustion duration [23]. The relationship between BD and PC1 (Figure 3a) found here also complies with the theoretical explanation on the effects of BD on fire behavior.

4.2. Which Characteristics Control Fuel Bed Compaction?

Our initial hypotheses were based on the presumption that particle characteristics control the tendency of fuel beds to compact. This presumption implies that needles of P. halepnsis are sufficiently thick and dense to oppose compaction and maintain well aerated fuel beds (low BD and PR) in all treatments, whereas thinner and less dense particles of Q. pubescens are unable to do so. Nevertheless, the opposite was shown to be true (Figure 2c). Both fire behavior (Figure 2a,b) and fuel bed structure characteristics (Figure 2c,d) of P. halepensis were more affected by the treatments than by characteristics of Q. pubescens. Furthermore, the different response to the treatment of P. halepensis and Q. pubescens, two species with no significant differences in BD in treatment “0” (Figure 2c), challenge the previously found negative relationship between initial BD (i.e., the equivalent of BD in treatment “0”) and the tendency of fuel beds to compact [20].
In our previous work [20], BD could be directly related to PR and the amount of empty space within the fuel bed due to low variability of particle densities. Thus, it was concluded that, as the BD increases, the amount of empty space within the fuel bed decreases. Consequently, the contact surface between particles increases providing higher structural support to the fuel bed and reducing its compaction.
Nevertheless, if particle density varies, as in the study presented here, directly relating BD to PR and the amount of empty space within the fuel bed is no longer possible. PR describes the fraction of the fuel array volume that is occupied by fuel, and can be expressed as ration between BD and particle density [35]. P. halepensis and Q. pubescens have comparable BD in treatment “0” (Figure 2c). Nevertheless, lower particle density of Q. pubescens (Table S2) results in higher PR (Figure 3d) and a lower proportion of the empty space within the Q. pubescens fuel bed, making it less susceptible to compaction. Thus, even though our results do not show the negative relationship between BD and the tendency of the fuel bed to compact as found previously, they are in accordance with the explanation that a tendency of the fuel bed to compact is controlled by the amount of the empty space within the fuel bed. As shown, P. halepensis, the species with the lowest PR (Figure 2d) and the highest proportion of empty space within the fuel bed, was the species most affected by the treatment (highest number of significant effects within species pairwise contrasts (Figure 2a,c,d). Q. pubescens with the intermediate PR was less affected than P. halepensis, whereas C. siliqua, the species with the highest PR and the lowest proportion of the empty space within the fuel bed complex, showed no significant within species pairwise contrasts.

4.3. Is the Observed Fuel Bed Compaction a Result of Inadequate Fuel Bed Construction?

We observed unexpectedly large treatments effects for P. halepensis. Therefore, we were concerned whether these effects were a consequence of inadequate fuel bed construction, i.e., constructed fuel beds with too low BD and PR in treatment “0”. To check this, structural characteristics of the fuel beds obtained in our study were compared to previously published work. If PR and BD were not explicitly stated, published information (e.g., sample mass, area and fuel bed height; fuel load and fuel bed height; values read out of graphs using Image J to ensure accuracy) was used to extract one or both of these parameters. BD of P. halepensis in treatment “0” was much lower than BD measured for the whole fuel bed profile of non-constructed fuel beds of P. halepensis stands [15]. It has to be noted, however, that our work focuses only on the Oi-horizon (litter with no visible signs of decomposition), whereas non-constructed fuel beds included fermentation (Oe) and humus (Oa) horizons [15], which can have up to several times higher BD compared to the Oi-horizon alone (e.g., [40,41]). BD of treatment “0” for P. halepensis obtained in our study fell within the range of in-stand measurements of the L-layer BD of North American pines (Pinus sp.) [41]. Furthermore, numerous studies used constructed Pinus sp. fuel beds with structural characteristics similar to those of P. halepensis samples tested in our study in treatments “0” and “10”. The mean BD of 13.16 kg·m−3 of P. halepensis found in our study in treatment “0” is substantially higher than 8.57 kg·m−3 of P. ponderosa used by [42], and somewhat higher than 12.50 kg·m−3 of P. pinaster in [43]. The average BD of P. halepensis in treatment “10” (19.84 kg·m−3) corresponds well to BD of P. pinaster in [21,44] (19.18 kg·m−3 and ~ 20 kg·m−3, respectively), and P. jeffreyii in [24] (20.00 kg·m−3). Reference [12] covered a broad range of PR, with some of the species having a PR lower than 0.022 (mean PR of treatment “10” for P. halepensis samples).
Structural characteristics of Q. pubescens in treatment “0” (mean BD = 11.94 kg·m−3, mean PR = 0.028) were lower than BD determined for the whole organic soil layer found in Mediterranean oak (Quercus sp.) woodlands and scrublands [45], but they also fall within the range of bulk densities measured for the L-layer of North American hardwoods [41] and a range of BDs achieved for freshly constructed Californian oak fuel beds [13].
Information on the fuel bed structure of C. siliqua are scarce, but this species had the highest BD and PR in treatment “0”, and was not affected by the treatments.
Thus, fuel beds with structural characteristics comparable to those obtained here in treatments “0” and “10” appear in nature and were previously used in fire behavior studies. We therefore conclude that treatment effects on the fuel bed structure cannot be attributed to inadequate sample construction.

4.4. Treatment Induced Alterations in the Fire Behavior

Following the premise that fuel bed aeration exerts high control over fire behavior of the fuel bed [12,22] and that treatments “10” and “60” result in fuel bed compaction, treatment effects on fire behavior were attributed to the reduction of fuel bed aeration. The significant relationship between BD and PC1 scores (Figure 3a) supports this argument. Previous studies already showed a significant relationship between BD and fire behavior characteristics loading highly on the PC1 axis (i.e., FD, RoS, and FH) when testing freshly prepared fuel bed samples (e.g., [13,21,23]. Here, both BD and PC1 scores were significantly affected by the treatment (Figure 2 a,c), but the overall relationship between them remained significant for the whole data set (Figure 3a). The relationship between BD and PC1 scores was also significant at the species level for P. halepensis and Q. pubescens. The lack of significant relationships for C. siliqua is not surprising as this species exhibited limited variability of BD.
The possibility that other factors such as decomposition induced mass loss [30] and alterations in the chemical composition [31,46,47], or that varying equilibrium moisture contents [33,48] played a role in altering fire behavior of the fuel bed over time is not excluded. Nevertheless, the fact that these effects were either not detected (e.g., no significant mass loss or moisture content differences) or not measured (e.g., chemical composition) does not diminish the importance of long term control of fuel bed aeration on the fire behavior, as we detected it here.

4.5. Importance of the Observed Changes

Our previous work [20] and the study presented here show that short term exposure to outside weather conditions can lead to varying effects on structure and fire behavior of leaf litter beds, ranging from non-significant to substantial. In our study this led to non-significant differences in fire behavior of P. halepensis and C. siliqua fuel beds after two months exposure to outside weather conditions (treatment “60”), even though these species exhibited significant and large differences in their fire behavior when tested as freshly prepared samples. Fire behavior of P. halepensis and C. siliqua fuel beds in treatment “0” corresponds to the current understanding of the relationships between particle characteristics and fire behavior (see section “Current Understanding of the Fire Behavior of the Leaf Litter”). However, synchronization of their fire behavior after two months exposure to outside weather conditions was unexpected and cannot be related to particle characteristics (see section “Which Characteristics Control Fuel Bed Compaction?”). These results are of paramount importance as most studies investigate fire behavior of leaf litter beds only on freshly prepared samples (e.g., [12,13,17,21,22,23,24,49,50,51]).
As previously stressed [20], it can be presumed that, under natural conditions, the effects of compaction on fuel bed characteristics will depend not only on the susceptibility of the fuel bed to compact, but also on the duration of, and conditions during, the period between leaf abscission and fire. Additionally, differences in the amount of abscised material [52], decomposition rates [53,54], and effects on the understory development (e.g., [55]) would also play a major role in long term alterations of the fuel bed characteristics. The focus of this work is on fuel bed compaction, as it can lead to profound alterations in the fuel bed structure. Here, we measured a differences of 115.5% between the average BD of P. halepensis in treatments “0” and “60” (Figure 2c). Fire behavior also changed within a short time frame (e.g., the mean RoS of P. halepensis) in treatment “60” was only 34.9% of the value obtained in treatment “0”, calculation based on Table S3). Even though these effects cannot be attributed solely to fuel bed compaction, seasonal differences in the BD of leaf litter layer (L-layer) (e.g., [41]) and fire behavior were also measured in forest stands (e.g., [56,57]).
Thus, we do not argue that leaf litter of C. siliqua and P. halepensis would have the same fire behavior under natural conditions or that measurements performed on the freshly prepared fuel beds are meaningless. However, we argue that leaf litter beds are dynamic fuels and that they differ in their tendency to undergo changes, with the compaction upon short-term exposure to outside weather conditions being only one of them. As long as we do not understand the dynamics behind the alterations in the fire behavior of fuel beds, any attempt to quantify it captures only a momentary state of a dynamic system. This might be especially important if the fuel bed characteristics are substantially altered within the fire season. Combining litter bed exposure with laboratory testing of its fire behavior and field observations might help elucidating the effects of individual processes on alterations of the fuel bed characteristics.

Supplementary Materials

The following are available online at https://www.mdpi.com/2571-6255/2/2/33/s1, Figure S1: Established treatments, Figure S2: Average daily temperature, relative humidity and precipitation, Figure S3: Temperature and relative humidity in the fire behavior testing facility at hourly resolution, Figure S4: Pairwise regression analyses showing relationships between packing ration and score to individual principal component, Figure S5: Pairwise regression analyses showing relationships between individual structural fuel bed characteristics and fire behavior characteristics, Table S1: Video frames with the maximum flame height, Table S2: Means and standard errors (in brackets) of the measured morphological characteristics, Table S3: Means and standard errors (in brackets) of the fire behavior characteristics. Table S4: Measured fuel bed structure and fire behavior data.

Author Contributions

conceptualization, Z.K.; methodology, Z.K. and W.D.; formal analysis, Z.K.; investigation, Z.K. and W.D.; resources, A.F.; writing—original draft preparation, Z.K.; writing—review and editing, W.D. and A.F.; visualization, Z.K.; supervision, A.F.; funding acquisition, A.F.

Funding

This research received no external funding.

Acknowledgments

We thank officers and administration of the Mljet National Park Public Institution, Croatia for their indispensable help in providing the tested material. We thank Jakov Nodilo for coordinating the on-sight activities and proving useful insights into the islands ecosystems. We thank Maria Rosa Gutiérrez Cabrera for her valuable help with performing morphological measurements and analyzing video records.

Conflicts of Interest

The authors declare no conflict of interest.

References

  1. Scott, A.C.; Glasspool, I.J. The diversification of Paleozoic fire systems and fluctuations in atmospheric oxygen concentration. Proc. Natl. Acad. Sci. USA 2006, 103, 10861–10865. [Google Scholar] [CrossRef] [PubMed] [Green Version]
  2. Pausas, J.G.; Keeley, J.E.; Schwilk, D.W. Flammability as an ecological and evolutionary driver. J. Ecol. 2017, 105, 289–297. [Google Scholar] [CrossRef]
  3. Archibald, S.; Lehmann, C.E.R.; Belcher, C.M.; Bond, W.J.; Bradstock, R.A.; Daniau, A.-L.; Dexter, K.G.; Forrestel, E.J.; Greve, M.; He, T.; et al. Biological and geophysical feedbacks with fire in the Earth system. Environ. Res. Lett. 2018, 13, 033003. [Google Scholar] [CrossRef] [Green Version]
  4. Anderson, H.E. Forest fuel ignitibility. Fire Technol. 1970, 6, 312–319. [Google Scholar] [CrossRef]
  5. Martin, R.E.; Gordon, D.A.; Gutierrez, M.E.; Lee, D.S.; Molina, D.M.; Schroeder, R.A.; Sapsis, D.B.; Stephens, S.L.; Chambers, M. Assessing the flammability of domestic and wildland vegetation. In Proceedings of the 12th Conference on Fire and Forest Meteorology, Jekyll Island, GA, USA, 26–28 October 1993; Society of American Foresters: Bethesda, MD, USA, 1994; pp. 130–137. [Google Scholar]
  6. Prior, L.; Murphy, B.; Bowman, D. Conceptualizing Ecological Flammability: An Experimental Test of Three Frameworks Using Various Types and Loads of Surface Fuels. Fire 2018, 1, 14. [Google Scholar] [CrossRef]
  7. Varner, J.M.; Kane, J.M.; Kreye, J.K.; Engber, E. The Flammability of Forest and Woodland Litter: A Synthesis. Curr. For. Rep. 2015, 1, 91–99. [Google Scholar] [CrossRef]
  8. Manea, A.; Grootemaat, S.; Leishman, M.R. Leaf flammability and fuel load increase under elevated CO2 levels in a model grassland. Int. J. Wildl. Fire 2015, 24, 819–827. [Google Scholar] [CrossRef]
  9. Ellair, D.P.; Platt, W.J. Fuel composition influences fire characteristics and understorey hardwoods in pine savanna. J. Ecol. 2013, 101, 192–201. [Google Scholar] [CrossRef]
  10. Schwilk, D.W.; Caprio, A.C. Scaling from leaf traits to fire behaviour: Community composition predicts fire severity in a temperate forest. J. Ecol. 2011, 99, 970–980. [Google Scholar] [CrossRef]
  11. Zylstra, P.; Bradstock, R.A.; Bedward, M.; Penman, T.D.; Doherty, M.D.; Weber, R.O.; Gill, A.M.; Cary, G.J. Biophysical Mechanistic Modelling Quantifies the Effects of Plant Traits on Fire Severity: Species, Not Surface Fuel Loads, Determine Flame Dimensions in Eucalypt Forests. PLoS ONE 2016, 11, e0160715. [Google Scholar] [CrossRef]
  12. Cornwell, W.K.; Elvira, A.; van Kempen, L.; van Logtestijn, R.S.P.P.; Aptroot, A.; Cornelissen, J.H.C. Flammability across the gymnosperm phylogeny: The importance of litter particle size. New Phytol. 2015, 206, 672–681. [Google Scholar] [CrossRef] [PubMed]
  13. Engber, E.A.; Varner, J.M. Patterns of flammability of the California oaks: The role of leaf traits. Can. J. For. Res. 2012, 42, 1965–1975. [Google Scholar] [CrossRef]
  14. Simpson, K.J.; Ripley, B.S.; Christin, P.-A.; Belcher, C.M.; Lehmann, C.E.R.R.; Thomas, G.H.; Osborne, C.P. Determinants of flammability in savanna grass species. J. Ecol. 2016, 104, 138–148. [Google Scholar] [CrossRef] [PubMed]
  15. Ganteaume, A.; Jappiot, M.; Curt, T.; Lampin, C.; Borgniet, L. Flammability of litter sampled according to two different methods: Comparison of results in laboratory experiments. Int. J. Wildl. Fire 2014, 23, 1061. [Google Scholar] [CrossRef]
  16. Grootemaat, S.; Wright, I.J.; van Bodegom, P.M.; Cornelissen, J.H.C.; Cornwell, W.K. Burn or rot: Leaf traits explain why flammability and decomposability are decoupled across species. Funct. Ecol. 2015, 29, 1486–1497. [Google Scholar] [CrossRef]
  17. Cornelissen, J.H.C.; Grootemaat, S.; Verheijen, L.M.; Cornwell, W.K.; van Bodegom, P.M.; van der Wal, R.; Aerts, R. Are litter decomposition and fire linked through plant species traits? New Phytol. 2017, 216, 653–669. [Google Scholar] [CrossRef] [Green Version]
  18. Weir, J.R.; Limb, R.F. Seasonal Variation in Flammability Characteristics of Quercus marilandica and Quercus stellata Leaf Litter Burned in the Laboratory. Fire Ecol. 2013, 9, 80–88. [Google Scholar] [CrossRef]
  19. Kauf, Z.; Fangmeier, A.; Rosavec, R.; Španjol, Ž. Seasonal and Local Differences in Leaf Litter Flammability of Six Mediterranean Tree Species. Environ. Manag. 2015, 55, 687–701. [Google Scholar] [CrossRef]
  20. Kauf, Z.; Damsohn, W.; Fangmeier, A. Do relationships between leaf traits and fire behaviour of leaf litter beds persist in time? PLoS ONE 2018, 13, e0209780. [Google Scholar] [CrossRef]
  21. Ormeño, E.; Céspedes, B.; Sánchez, I.A.; Velasco-García, A.; Moreno, J.M.; Fernandez, C.; Baldy, V. The relationship between terpenes and flammability of leaf litter. For. Ecol. Manag. 2009, 257, 471–482. [Google Scholar] [CrossRef]
  22. Scarff, F.R.; Westoby, M. Leaf litter flammability in some semi-arid Australian woodlands. Funct. Ecol. 2006, 20, 745–752. [Google Scholar] [CrossRef]
  23. Grootemaat, S.; Wright, I.J.; van Bodegom, P.M.; Cornelissen, J.H.C. Scaling up flammability from individual leaves to fuel beds. Oikos 2017, 126, 1428–1438. [Google Scholar] [CrossRef]
  24. De Magalhães, R.M.Q.Q.; Schwilk, D.W. Leaf traits and litter flammability: Evidence for non-additive mixture effects in a temperate forest. J. Ecol. 2012, 100, 1153–1163. [Google Scholar] [CrossRef]
  25. Prior, L.D.; Murphy, B.P.; Williamson, G.J.; Cochrane, M.A.; Jolly, W.M.; Bowman, D.M.J.S. Does inherent flammability of grass and litter fuels contribute to continental patterns of landscape fire activity? J. Biogeogr. 2017, 44, 1225–1238. [Google Scholar] [CrossRef]
  26. Van Altena, C.; van Logtestijn, R.S.P.; Cornwell, W.K.; Cornelissen, J.H.C. Species composition and fire: Non-additive mixture effects on ground fuel flammability. Front. Plant Sci. 2012, 3, 63. [Google Scholar] [PubMed]
  27. Nyman, P.; Metzen, D.; Noske, P.J.; Lane, P.N.J.; Sheridan, G.J. Quantifying the effects of topographic aspect on water content and temperature in fine surface fuel. Int. J. Wildl. Fire 2015, 24, 1129. [Google Scholar] [CrossRef]
  28. Baum, C.; Fienemann, M.; Glatzel, S.; Gleixner, G. Overstory-specific effects of litter fall on the microbial carbon turnover in a mature deciduous forest. For. Ecol. Manag. 2009, 258, 109–114. [Google Scholar] [CrossRef]
  29. Berger, T.W.; Berger, P. Greater accumulation of litter in spruce (Picea abies) compared to beech (Fagus sylvatica) stands is not a consequence of the inherent recalcitrance of needles. Plant Soil 2012, 358, 349–369. [Google Scholar] [CrossRef] [PubMed]
  30. Cornelissen, J.H.C. An experimental comparison of leaf decomposition rates in a wide range of temperate plant species and types. J. Ecol. 1996, 84, 573–582. [Google Scholar] [CrossRef]
  31. Berg, B. Decomposition patterns for foliar litter—A theory for influencing factors. Soil Biol. Biochem. 2014, 78, 222–232. [Google Scholar] [CrossRef]
  32. Kreye, J.K.; Varner, J.M.; Hiers, J.K.; Mola, J. Toward a mechanism for eastern North American forest mesophication: Differential litter drying across 17 species. Ecol. Appl. 2013, 23, 1976–1986. [Google Scholar] [CrossRef] [PubMed]
  33. Anderson, H.E. Predicting Equilibrium Moisture Content of Some Foliar Forest Litter in the Northern Rocky Mountains; Research Paper INT-429; U.S. Department of Agriculture, Forest Service, Intermountain Research Station (USA): Ogden, UT, USA, 1990. [Google Scholar]
  34. Schneider, C.A.; Rasband, W.S.; Eliceiri, K.W. NIH Image to ImageJ: 25 years of image analysis. Nat. Methods 2012, 9, 671–675. [Google Scholar] [CrossRef] [PubMed]
  35. Rothermel, R.C. A Mathematical Model for Predicting Fire Spread in Wildland Fuels; U.S. Department of Agriculture, Forest Service, Intermountain Forest and Range Experiment Station: Ogden, UT, USA, 1972. [Google Scholar]
  36. Cohen, J. A power primer. Psychol. Bull. 1992, 112, 155–159. [Google Scholar] [CrossRef] [PubMed]
  37. Fernandes, P.M.; Cruz, M.G. Plant flammability experiments offer limited insight into vegetation-fire dynamics interactions. New Phytol. 2012, 194, 606–609. [Google Scholar] [CrossRef] [PubMed]
  38. Pausas, J.G.; Moreira, B. Flammability as a biological concept. New Phytol. 2012, 194, 610–613. [Google Scholar] [CrossRef] [PubMed] [Green Version]
  39. Parsons, A.L.; Balch, J.K.; de Andrade, R.B.; Brando, P.M. The role of leaf traits in determining litter flammability of south-eastern Amazon tree species. Int. J. Wildl. Fire 2015, 24, 1143. [Google Scholar] [CrossRef]
  40. Dickinson, M.B.; Hutchinson, T.F.; Dietenberger, M.; Matt, F.; Peters, M.P. Litter Species Composition and Topographic Effects on Fuels and Modeled Fire Behavior in an Oak-Hickory Forest in the Eastern USA. PLoS ONE 2016, 11, e0159997. [Google Scholar] [CrossRef] [PubMed]
  41. Ottmar, R.; Andreu, A. Litter and Duff Bulk Densities in the Southern United States Joint Fire Science Program Project #04-2-1-49 Final Report; U.S. Department of Agriculture, Forest Service, Pacific Northwest Research Station: Seattle, WA, USA, 2007. [Google Scholar]
  42. Mutch, R.W. Wildland Fires and Ecosystems—A Hypothesis. Ecology 1970, 51, 1046–1051. [Google Scholar] [CrossRef]
  43. Mendes-Lopes, J.M.C.; Ventura, J.M.P.; Amaral, J.M.P. Flame characteristics, temperature-time curves, and rate of spread in fires propagating in a bed of Pinus pinaster needles. Int. J. Wildl. Fire 2003, 12, 67–84. [Google Scholar] [CrossRef]
  44. Madrigal, J.; Guijarro, M.; Hernando, C.; Díez, C.; Marino, E. Estimation of Peak Heat Release Rate of a Forest Fuel Bed in Outdoor Laboratory Conditions. J. Fire Sci. 2011, 29, 53–70. [Google Scholar] [CrossRef]
  45. Curt, T.; Schaffhauser, A.; Borgniet, L.; Dumas, C.; Estève, R.; Ganteaume, A.; Jappiot, M.; Martin, W.; N’Diaye, A.; Poilvet, B. Litter flammability in oak woodlands and shrublands of southeastern France. For. Ecol. Manag. 2011, 261, 2214–2222. [Google Scholar] [CrossRef]
  46. Sikkink, P.G.; Jain, T.B.; Reardon, J.; Heinsch, F.A.; Keane, R.E.; Butler, B.; Baggett, L.S. Effect of particle aging on chemical characteristics, smoldering, and fire behavior in mixed-conifer masticated fuel. For. Ecol. Manag. 2017, 405, 150–165. [Google Scholar] [CrossRef]
  47. Bueis, T.; Bravo, F.; Pando, V.; Turrión, M.B. Local basal area affects needle litterfall, nutrient concentration, and nutrient release during decomposition in Pinus halepensis Mill. plantations in Spain. Ann. For. Sci. 2018, 75, 21. [Google Scholar] [CrossRef]
  48. Schunk, C.; Leutner, C.; Leuchner, M.; Wastl, C.; Menzel, A. Equilibrium moisture content of dead fine fuels of selected central European tree species. Int. J. Wildl. Fire 2013, 22, 797–809. [Google Scholar] [CrossRef]
  49. Fonda, R.W. Burning characteristics of needles from eight pine species. For. Sci. 2001, 47, 390–396. [Google Scholar]
  50. Mola, J.M.; Varner, J.M.; Jules, E.S.; Spector, T. Altered Community Flammability in Florida’s Apalachicola Ravines and Implications for the Persistence of the Endangered Conifer Torreya taxifolia. PLoS ONE 2014, 9, e103933. [Google Scholar] [CrossRef] [PubMed]
  51. Kane, J.M.; Varner, J.M.; Hiers, J.K. The burning characteristics of southeastern oaks: Discriminating fire facilitators from fire impeders. For. Ecol. Manag. 2008, 256, 2039–2045. [Google Scholar] [CrossRef]
  52. Olson, J.S. Energy Storage and the Balance of Producers and Decomposers in Ecological Systems. Ecology 1963, 44, 322–331. [Google Scholar] [CrossRef] [Green Version]
  53. Alexander, H.D.; Arthur, M.A. Increasing Red Maple Leaf Litter Alters Decomposition Rates and Nitrogen Cycling in Historically Oak-Dominated Forests of the Eastern U.S. Ecosystems 2014, 17, 1371–1383. [Google Scholar] [CrossRef]
  54. García-Plé, C.; Vanrell, P.; Morey, M. Litter fall and decomposition in a Pinus halepensis forest on Mallorca. J. Veg. Sci. 1995, 6, 17–22. [Google Scholar] [CrossRef]
  55. Engber, E.A.; Varner, J.M., III; Arguello, L.A.; Sugihara, N.G. The Effects of Conifer Encroachment and Overstory Structure on Fuels and Fire in an Oak Woodland Landscape. Fire Ecol. 2011, 7, 32–50. [Google Scholar] [CrossRef]
  56. Vander Yacht, A.L.; Keyser, P.D.; Barrioz, S.A.; Kwit, C.; Stambaugh, M.C.; Clatterbuck, W.K.; Simon, D.M. Reversing Mesophication Effects on Understory Woody Vegetation in Mid-Southern Oak Forests. For. Sci. 2019, 65, 289–303. [Google Scholar] [CrossRef]
  57. Sparks, J.C.; Masters, R.E.; Engle, D.M.; Bukenhofer, G.A. Season of Burn Influences Fire Behavior and Fuel Consumption in Restored Shortleaf Pine-Grassland Communities. Restor. Ecol. 2002, 10, 714–722. [Google Scholar] [CrossRef]
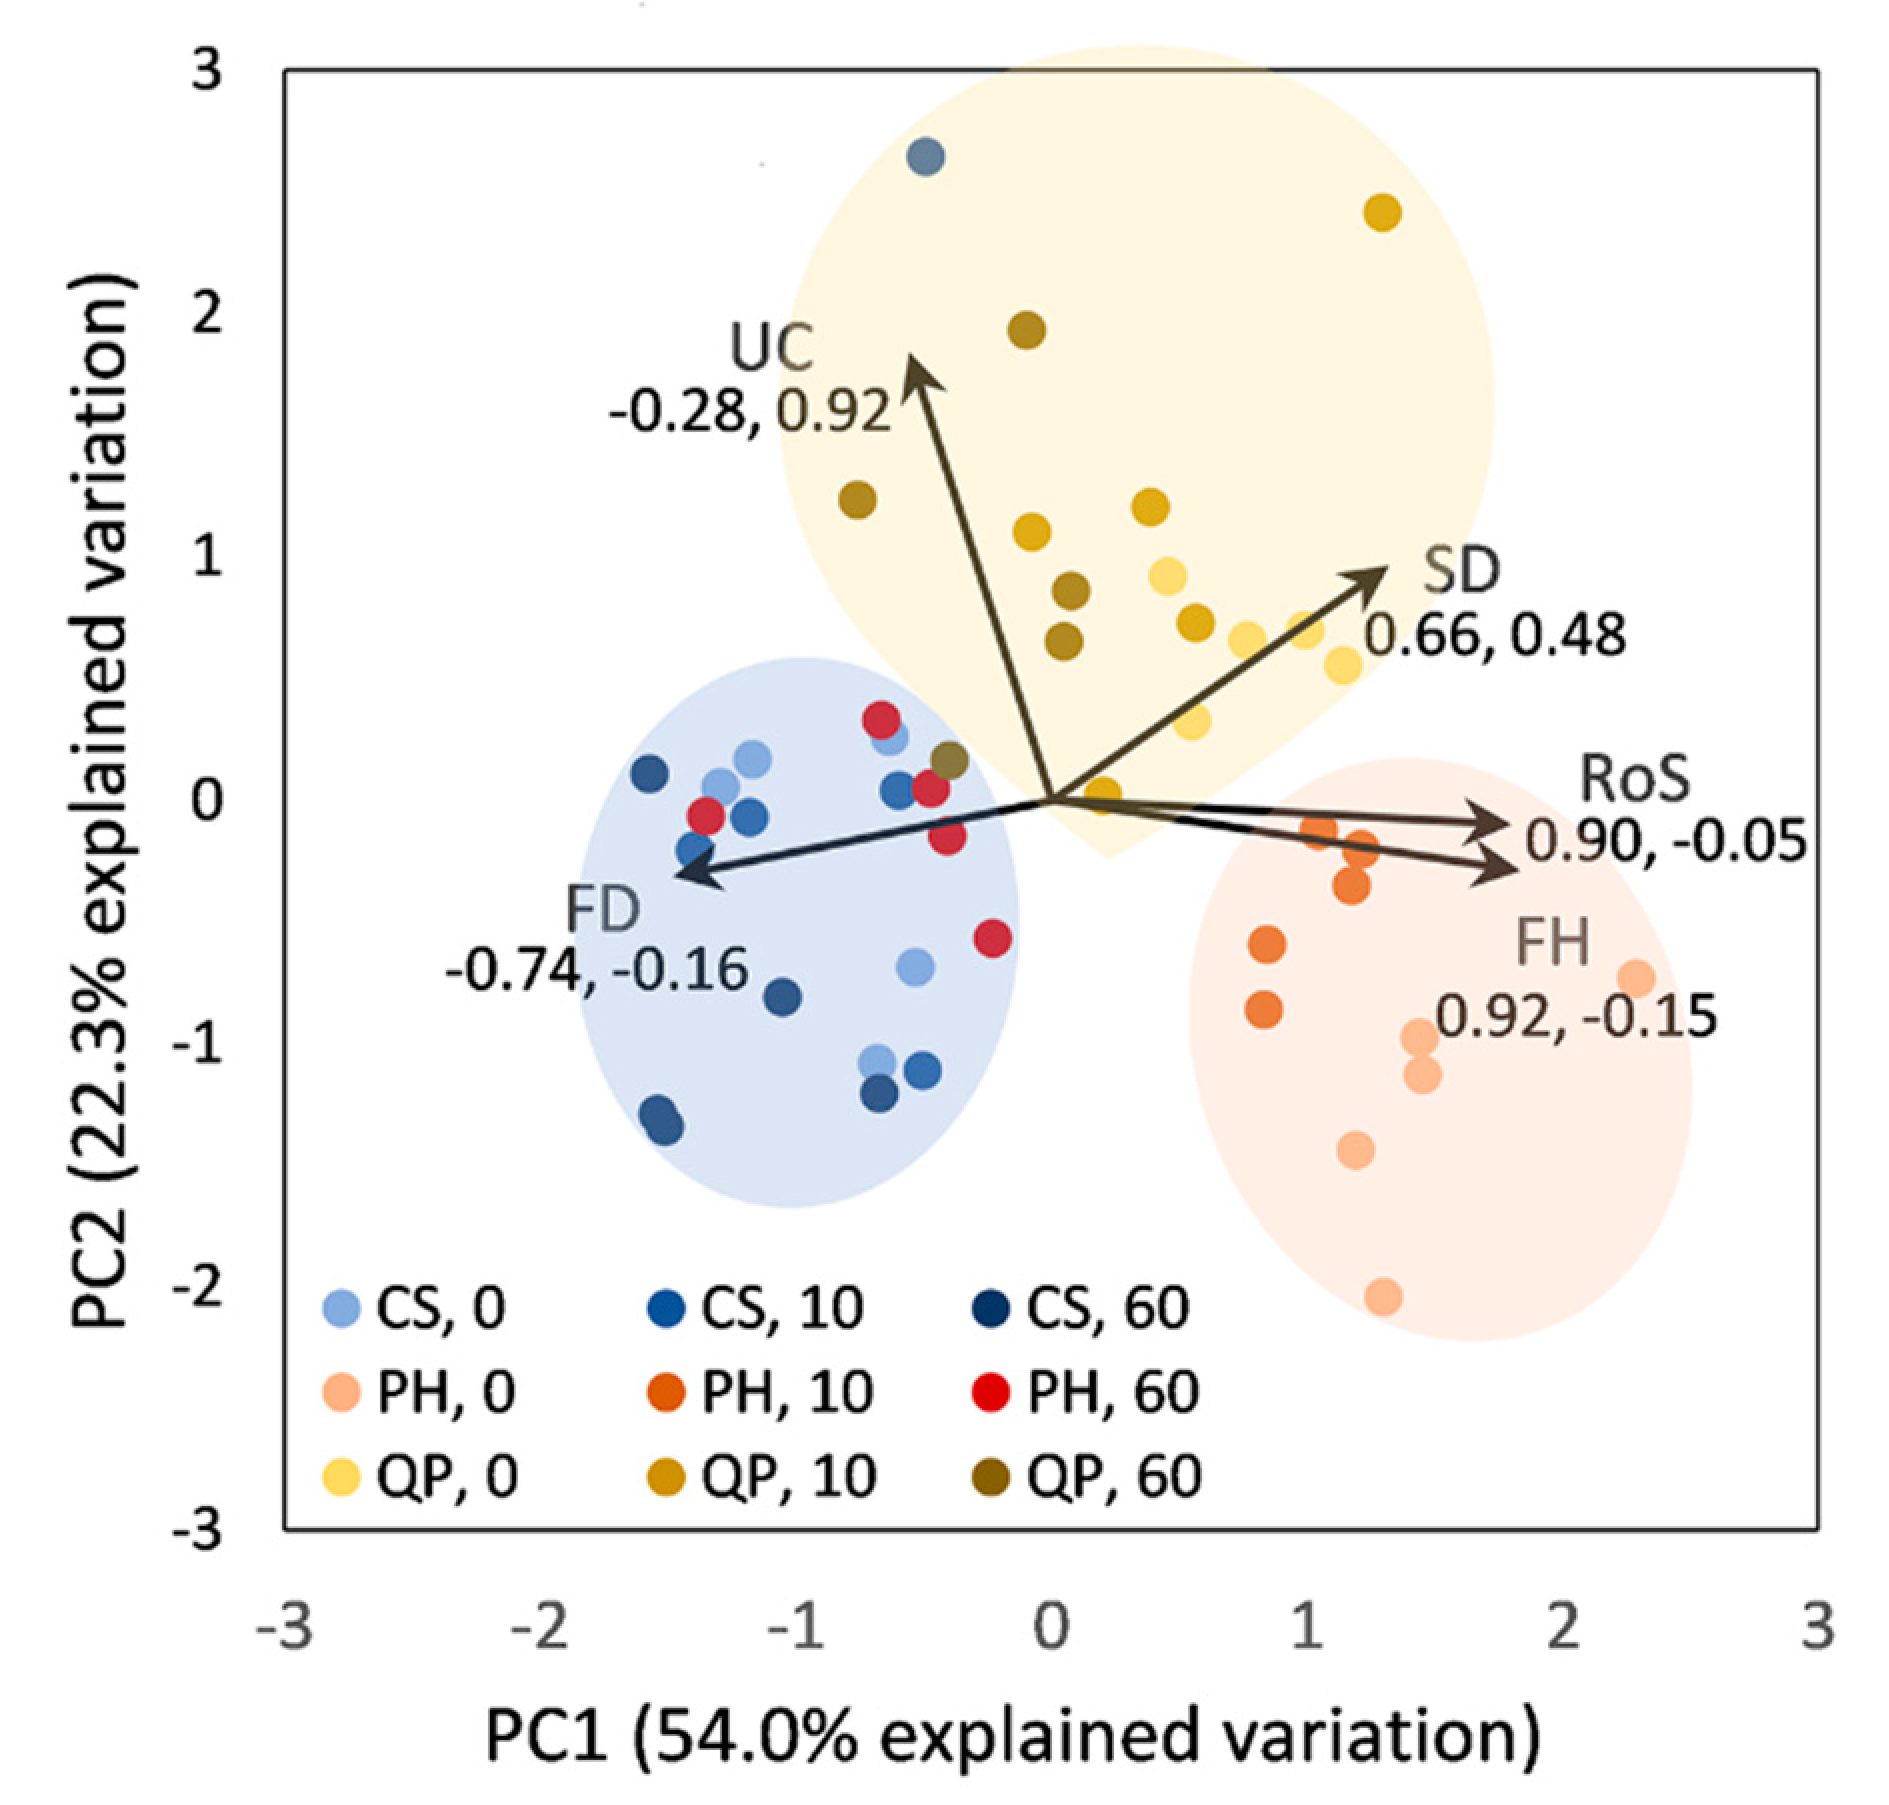
Figure 1. Results of the principal component analysis (PCA) and k-means cluster analysis. Note: Each data point represents an individual sample. Species and treatment combination are color coded. Species abbreviations: CS = Ceratonia siliqua, PH = Pinus halepensis, and QP = Quercus pubescens. Treatments are indicated as defined in the material and methods section. Individual parameters included in the PCA are: rate of spread (RoS), flaming duration (FD), smoldering duration (SD), flame height (FH), and percentage of the fuel remaining upon combustion—unconsumed (UC). Arrows graphically present the loadings of the individual parameters to PC1 and PC2. Exact loading values are given underneath the abbreviations of individual parameters (left—PC1 loading, right—PC2 loading). Clusters are indicated by colored shading.
Fire 02 00033 g001
Figure 2. Means and standard errors with results of the Two-Way ANOVA and pairwise contrasts with Tukey’s adjustment for multiple comparisons. (a) score to the first principal component (PC1), (b) score to the second principal component, (c) bulk density (BD), and (d) packing ratio. Species are consistently shown as indicated in the legend of Figure 2a (CS = Ceratonia, siliqua, PH = Pinus halepensis, and QP = Quercus pubescens). Treatments are indicated as defined in the material and methods section. Significance of the effects of species, treatment, and their interactions (s × t) are indicated. Degrees of freedom were the same in all analyses: 2 for species and treatment, 4 for interactions, and 36 for residuals. The p value is given only if P ≥ 0.01. Different capital letters indicate statistically significant differences (p ≤ 0.05) between treatments within a single species. Different lowercase letters indicate statistically significant differences between species within a single treatment. Exceptionally, for PC2 (b) only species were compared since the effect of the treatment and s × t interactions were not significant, and for PR (d) a comparison was made between species and between treatments separately. For (b), a different capital letter next to the species coding in the legend indicates statistically significant between species differences. In (d) all species and all treatments differed from each other. Effect size (e.s.), calculated as the partial eta-squared, is reported. ** p ≤ 0.01 and *** p ≤ 0.001.
Fire 02 00033 g002aFire 02 00033 g002b
Figure 3. Pairwise regression analyses between: (a) bulk density and score to the first principal component (PC1), (b) bulk density and score to the second principal component (PC2). For each pair of variables, the analyses were conducted on the whole data set (black regression line and equation), and separately for each species. All provided information is consistently color coded: red corresponding to Aleppo pine (Pinus halepensis Mill.), blue to carob (Ceratonia siliqua L.), and yellow to downy oak (Quercus pubescens Willd.). Regression line, regression equation and significance level are only shown if the relationship was significant. * p ≤ 0.05, ** p ≤ 0.01, and *** p ≤ 0.001.
Fire 02 00033 g003