Article

Natural Ventilated Smoke Control Simulation Case Study Using Different Settings of Smoke Vents and Curtains in a Large Atrium

1
School of Mechanical and Manufacturing Engineering, University of New South Wales, Sydney, NSW 2052, Australia
2
Department of Chemical and Materials Engineering, Hefei University, Hefei 230601, China
3
Australian Nuclear Science and Technology Organisation (ANSTO), Locked Bag 2001, Kirrawee DC, NSW 2232, Australia
4
Arch & Fire Professional (Int’l) Ltd., Room 603, CCT Telecom Building, 11 Wo Shing Street, Fo Tan, Hong Kong
*
Author to whom correspondence should be addressed.
Submission received: 23 December 2018 / Revised: 26 January 2019 / Accepted: 28 January 2019 / Published: 30 January 2019

Abstract

:
In this study, a Large Eddy Simulation (LES) based fire field model was applied to numerically investigate the effectiveness of smoke control using smoke vents and curtains within a large-scale atrium fire. Two compartment configurations were considered: the first case with no smoke curtains installed, while the second case included a smoke curtain at the centre of the compartment to trap smoke. Based on the thermocouple results, it was found that the model predicted the gas temperature near the fire particularly well. The time development and heat transfer of the gas temperature predictions were in good agreement with the experimental measurements. Nevertheless, the gas temperature was slightly under-predicted when the thermocouple was further away from the flaming region. Overall, it was discovered that the combination of a smoke curtain and ceiling vents was a highly effective natural smoke exhaust system. However, under the same vent configuration, if the smoke curtain height is not adequate to completely block the spread of smoke, it significantly reduces the pressure differential between the compartment and the exterior, causing reduced flow rates in the outlet vents.

1. Introduction

Sydney is the most highly populated city in Australia with a wide variety of complexity in architecture serving multiple functions. Owing to the rapid advancement of building and construction technology, the complexity of building designs has also drastically increased over the past two decades. In the past, fire safety and protection systems were mainly based on prescriptive codes and they were found to be effective for traditional building developments. Owing to the rapid increase in large-scale constructions, as well as the increase of uniqueness in their designs, it is difficult to apply the prescriptive codes for modern buildings such as shopping malls which may comprise of a large atrium area. This presents potential risk due to smoke and flames spreading. For this reason, fire safety and protection measures based on conventional methods or prescriptive codes (i.e., the Australian Code of Practice for fire protection in buildings [1]) are difficult to implement in such premises. In addition, since buildings nowadays are filled with combustible materials (i.e., communication systems, wires, hazardous chemicals, furniture, etc.), it is common that the outbreak of unwanted fires in these building arcades can easily turn to large-scale uncontrollable fires. Therefore, the design of fire safety and protection systems should be specifically designed for buildings based on their architectural structures. Hence, there is an increase in the popularity of performance-based approaches [2,3,4,5,6].
In structural fires, it is generally agreed that smoke inhalation is the deadliest threat to occupants and that smoke can spread over enormous distances from the fire source [7]. Although building materials nowadays considers bio-based fire retardants which can significantly reduce flame and smoke production [8,9], there are still considerable amounts of other combustible materials, such as furniture, papers, and plastic consumables, which poses a huge threat to fire safety. In particular, smoke dispersion is one of the most lethal hazards in compartment fires, especially for those with an atrium, such as shopping malls or exhibition centres. Smoke reduces visibility and contains asphyxiant gases, such as CO and CO2, which can cause suffocation or respiratory issues to human occupants. It is also a serious concern for evacuation and rescue operations by either fire-fighters or emergency correspondents. Therefore, the design of smoke exhaust systems such as natural venting and dynamic smoke extraction systems with mechanical fans are a major consideration in the fire safety of large structures. It is of great importance to study how the quantity and position of the fire vents affect the smoke movement in building fires. A well-positioned venting system allows for the efficient removal of smoke and heat from the building, reducing the overall severity of the fire on the building structure as well as reducing the chances of human fatalities. Many studies were carried out in the field of fire-induced smoke control in complex structures such as high-rise buildings and subway stations [10,11,12,13,14,15].
The application of computational fluid dynamic (CFD) modelling on building fires has become increasingly popular due to the rapid advancement of numerical methodologies and computational power [16]. The heat and mass transfer, as well as the conservation of gas species and smoke particulates can be aptly computed by CFD models with quality meshing and a good selection of numerical models. CFD predictions can potentially provide other alternative information upon fire experiments. In addition, hypothetic fire scenarios that are costly and difficult to implement in reality can also be achieved in CFD simulations. For instance, a large eddy simulation computational study was performed by Gao et al. [10] to investigate the smoke dispersion within a subway station where both natural and mechanical ventilations were examined. It was demonstrated through numerical simulations that the use of mechanical fans can effectively control the horizontal movement of smoke which could be useful for smoke control systems. Ji et al. [17,18] applied Large Eddy Simulation (LES) to characterise the smoke dispersion within an urban tunnel where both thermal and mechanical driven mechanisms were implemented to control the inertia force that acts on smoke moments.
Numerical models should be compared with experiments in order to assess their applicability and accuracy. A full-scale experimental test provides valuable data to understand the smoke behavior and provide critical validation data for modelling. A series of simulation studies were carried out by Gutiérrez-Montes et al. [19,20,21] in a 20 m cubic super large atrium to numerically examine the smoke extraction via natural and exhaust systems. Through their studies, it was discovered that although the ventilation system was able to extract the heat away from the building, the gaseous products were contained, which might be harmful to occupants. More recently, a comprehensive sensitivity analysis using the same atrium configuration was performed by Ayala et al. [22,23] to assess the influence of different geometrical configurations on the numerical simulations, namely roof geometries, location of the exhaust and fire, and area of the openings. The study demonstrated that with appropriately tuned modelling aspects, the fire model could yield results that agreed well with the experimental data. Other studies with full-scale experimental results include Chow et al. [24] and Hadjisophocleous et al. [25,26]. Chow et al. conducted fire tests in a 27 m high atrium with a heat release rate (HRR) of 1.6 MW to study the natural smoke filling process. The results were compared with calculated results using NFPA 92B [27] and the model from Tanaka and Yamana [28]. Hadjisophocleous conducted an extensive series of atrium fire tests with a range of HRR from 15 to 600 kW under different exhaust rates from 1.94 to 5.13 kg/s, studying the effectiveness of the smoke exhaust system in terms of interface height, smoke layer interface, and CO2 concentration. A two-zone smoke movement model [29] was used to predict the smoke layer height, layer temperature, and CO2 concentration.
Nowadays, numerical simulations using CFD techniques are commonly applied for a wide range of fire safety assessments such as compartment and wildland fires [30,31,32,33], fire forensic investigations [34], solid combustibles [35], toxic gas approximations [36,37], and many other fire phenomenon [38]. Nevertheless, smoke movement and visibility simulations remain the most widely adopted in the construction and fire safety engineering industry. By applying CFD studies, a comprehensive collection of numerical data can be produced that could be useful in designing performance-based fire protection engineering systems.
The temperature of smoke released by the fire source is much higher than that of the surrounding air. The buoyancy caused by the temperature difference can drive the smoke upward. In such cases, roof windows, creating natural ventilation, can be introduced to exhaust the smoke efficiently. This study aims to investigate the smoke propagation under different fire vent and smoke curtain configurations in a large atrium fire scenario. In essence, a large-eddy simulation (LES) based fire field model will be utilised to carry out simulations on the full-scale fire tests conducted by Hägglund and Nireus [39]. The numerical model will be validated by experimental data based on thermocouple measured time profiles, smoke layer thickness, and velocity profiles for opening vents. Once validated, the model will be used to simulate a series of hypothetical cases. The objectives of the present work can be summarised in the following points:
  • Numerical Simulations will be performed using the Large Eddy Simulation based computational model on two large-scale atrium fire experiments.
  • Additional simulations based on hypothetical scenarios will be performed to investigate the effects of different inlet and outlet configurations, as well as different size smoke curtains.
  • The concept of zonings using smoke curtains as well as the control of smoke by pressurisation and natural ventilation via opening vents are investigated through a numerical standpoint.
  • According to comprehensive analysis of the numerical simulation results, the overall smoke movement and flow development within the compartment and across each opening’s vents can be comprehensively analyzed to gain more insights on the influence of the smoke curtain.

2. Mathematical Model

In this numerical study, the Fire Dynamics Simulator (FDS) version 6.7.0 was utilised which is a well-known fire field model that is available in the public domain for compartment fire simulations. It adopts the LES approach, incorporating all essential sub-modelling components including combustion, radiation, and turbulence to account for all essential behaviours and phenomena of non-premixed flames. The combustion model that was used in the current simulations is a fast chemistry mixture fraction model based on the “mixed is burnt’’ assumption. The assumption that the chemistry is ‘‘fast’’ means that the reactions that consume fuel and oxidizer occur so rapidly that the fuel and oxidizer cannot co-exist. The flame sheet is the location where fuel and oxidizer vanish simultaneously [40]. The heat release rate per unit volume is based on oxygen consumption, which was suggested by Huggett [41]. The amount of heat generated as a result of the chemical reactions involved during combustion is feedback as a source term in the energy equation. Smoke generation is modelled base on a soot yield, which is defined as the mass of soot produced per mass of fuel. For this study, a soot yield of 0.01 was adopted, which provides a reasonable assumption for full scale fires in a large compartment where a more precise model is not a necessity. The main focus is on the average smoke generation over a long duration; the model will produce a fair approximation smoke generation and gives insight into the smoke movement in a large atrium. For turbulence modelling of small-scale eddies (i.e., length scale filter equivalent of the size of the grid), the Smagorinsky subgrid-scale (SGS) model [42] is adopted with a Smagorinsky constant of 0.2 and the turbulent Schmidt and Prandtl numbers are prescribed as 0.5, respectively.

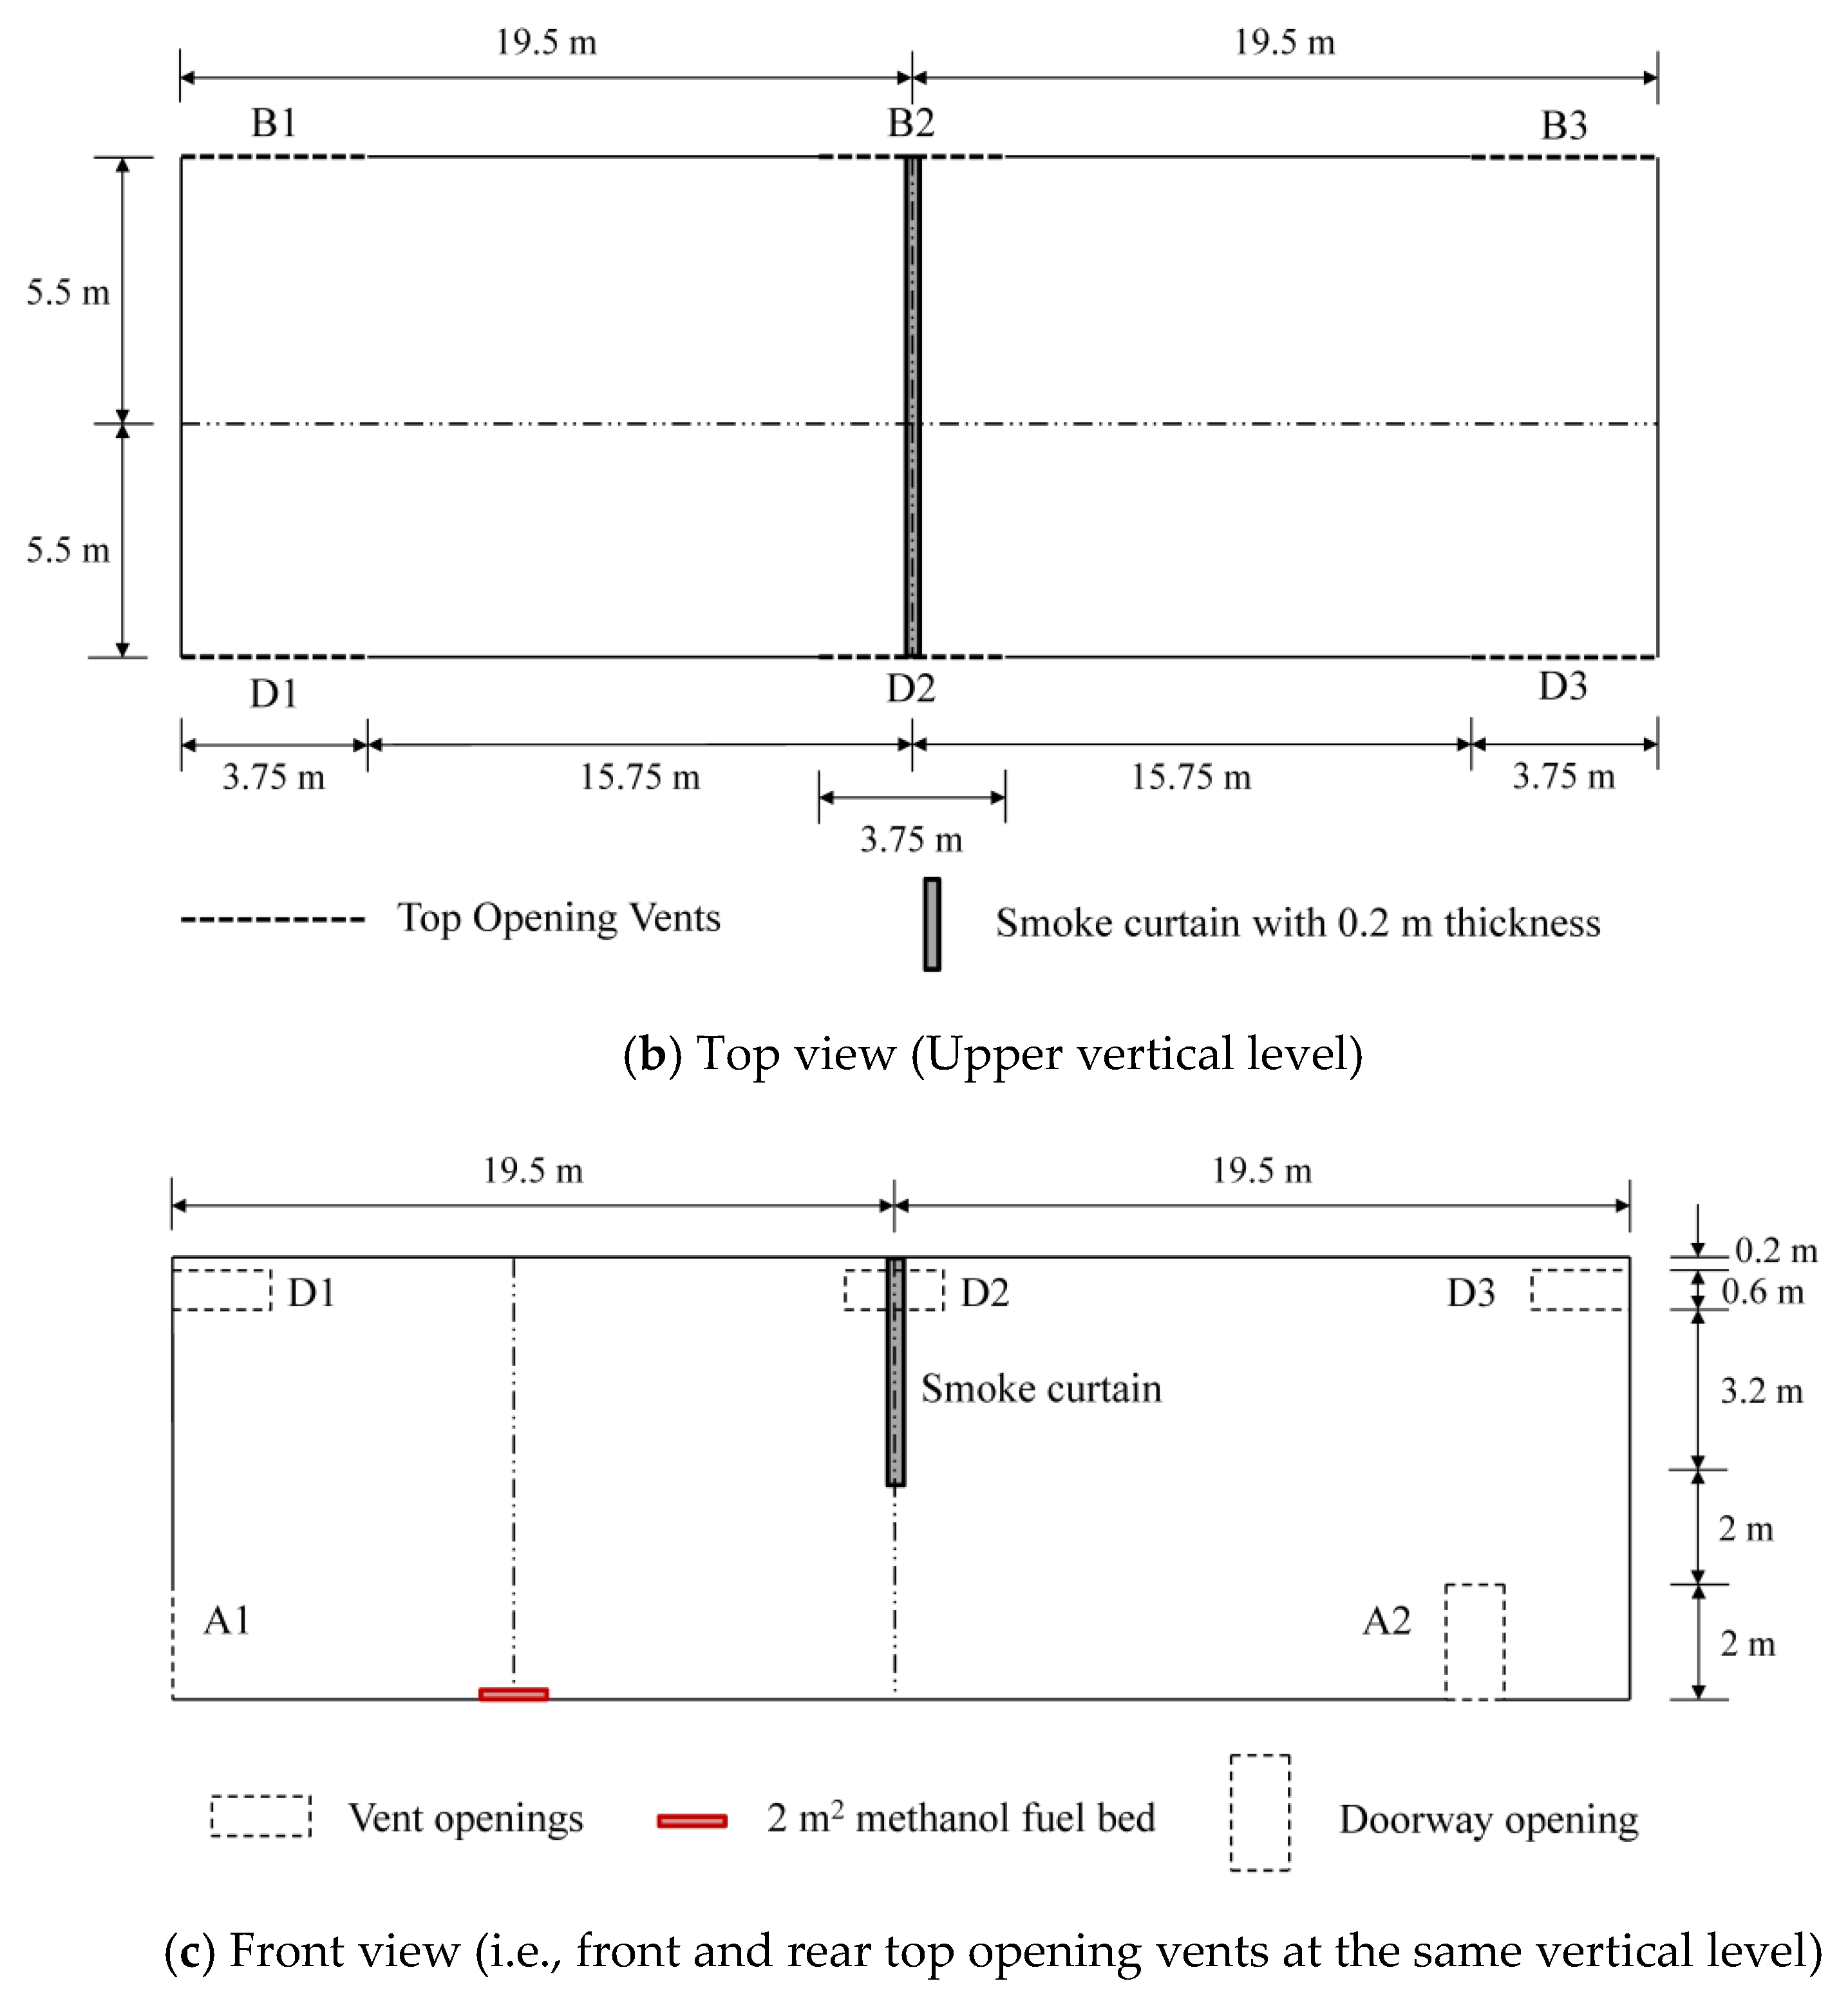
3. Experimental Configuration

The numerical simulations that are presented in this article are based on a series of compartment fire tests that were carried out in a large-scale atrium facility in Stockholm, Sweden by Hägglund and Niresus [39]. The dimension of the building compartment was 39 m by 11 m with a vertical ceiling height of 8 m. The walls and ceiling were constructed using corrugated sheet metal panel and mineral wool, while the building’s floor was made of concrete. The purpose of this experiment was to evaluate the hot gas and smoke layer, as well as studying the movement of smoke within a large atrium under various opening vents configurations.

3.1. Configuration 1 (No Smoke Curtain)

The first case that was considered in this paper corresponds to test 4 of the report by Hägglund [39]. It does not have a smoke curtain installed in the atrium. Figure 1 shows the top and side view of the floor plan. As can be seen in the figures, three outlet vents, labelled D1, D2, and D3 were positioned at the top of the long side of the building. The outlet vents all share the same dimension of 2.2 m × 0.6 m and are positioned 0.2 m below the ceiling level. Two floor level openings A1 and A2 were positioned at ground level on the left and front wall, as shown in Figure 1a,c. The inlets were 1 m wide and 2 m high. A 2 m2 square methanol liquid fuel pool was placed in the left quarter of the test facility (i.e., 9.75 m displacement from the left compartment wall) with a heat release rate (HRR) of 430 kWm−1. The initial environment conditions of the compartment enclosure were 15 °C for the internal air temperature. The external air temperature was 8 °C with negligible wind conditions. Four vertical thermocouple trees, labelled T1 to T4 were placed inside the compartment to measure the internal temperature profiles. The corresponding positions of these thermocouple trees are depicted in Figure 1a. Each tree consists of seven measuring points at height level from 1 m to 7 m, in which the vertical distances in between are 1 m.

3.2. Configuration 2 (With Smoke Curtain)

For Configuration 2, a smoke curtain was installed in the middle of the atrium. Figure 1b shows the top view and side view of the atrium, respectively. Similar to configuration 1, the test was conducted in the same large test hall facility with a base area of 11 m × 39 m, where the 2 m2 methanol liquid fuel pool was placed in the left quarter of the atrium. The major difference for configuration 1 and 2 is that a smoke curtain with 0.2 m thickness was installed at the middle of the compartment, 4 m from the ceiling to the mid vertical level. As illustrated in Figure 1c, three rectangular top opening vents are spatially distributed at the front side of the compartment wall near the ceiling, which are labelled as D1, D2, and D3. These vents share the same dimension of 3.75 m × 0.8 m and were positioned 0.2 m below the roof (i.e., 7.2 m to 7.8 m vertical height level). On the other hand, three rear top opening vents were also positioned at the back wall of the compartment, labeled as B1, B2, and B3, respectively. As depicted in Figure 1b,c, when the smoke curtain existed, the top opening vents, D2 and B2, which overlapped with the smoke curtain, were not opened. Otherwise, a total of four vents labelled as D1, D2, B1, B3 were opened for the smoke curtain case, with two vents on the front and back wall. As illustrated in the figures, the vents are 3.75 m wide with 0.8 m height. The smoke curtain is an 11 m × 0.2 m wall with a height of 4 m from the ceiling. The initial environment conditions of the compartment enclosure were 13 °C for the internal air temperature. The external air temperature was 6 °C with negligible wind conditions. Two vertical thermocouple trees were installed within the atrium labelled as T1 and T4 to measure the internal temperature. The corresponding positions of these thermocouple trees are depicted in Figure 1a. Each tree consists of seven measuring points at height level from 1 m to 7 m, in which the vertical distances in between are 1 m.
Five simulation cases were performed in this study, as summarised in Table 1. The first two cases (i.e., Case 1 and 2) are compared with the experimental measurements to demonstrate the validity of the FDS model. The smoke curtain is installed in Case 2, while Case 1 is without a smoke curtain. The reasons for constructing Cases 3 to 4 were to numerically investigate the influence of the smoke curtain height and whether it can effectively pressurise the flaming zone and avoid smoke leak out to the non-flaming zone. Finally, to study the behaviour of the natural ventilation through the floor level openings, the doorway openings A1 are opened in Case 5 and both A1 and A2 are opened in Case 6.

4. Modelling Configuration and Boundary Conditions

The three-dimensional computational domains of the atrium for Configuration 1 and 2 are shown in Figure 2 and Figure 3, respectively. The atrium is a rectangular box with a size of 39 m by 11 m by 8 m high. The domain for both case studies was extended beyond the test facility to allow the incoming/outgoing flows to be fully modelled around the inlet and outlet vents. For configuration 1, there were two extended regions to consider the flow across the front wall vents (i.e., A2, D1-D3), and a left-sided extended region to consider the flow across the side wall vent (i.e., A1). For configuration 2, two extended regions were added, attaching to the front and rear walls to simulate the flow across the front top vents (i.e., D1 and D3) and the rear top vents (i.e., B1 and B3). For Configuration 1, a rectangular extended region with dimensions 50 m × 10 m × 12 m high was added to the front wall to better predict the flow across the front top openings D1, D2, D3 and floor level doorway opening A2. The domain was also extended 5 m beyond the side wall with inlet A1 with an extended region of 5 m × 12 m × 12 m. In Configuration 2, the outlets were opened on both the front and rear wall. Therefore, the domain was extended on both sides with dimensions 50 m × 10 m × 12 m.
The initial boundary conditions for the numerical compartment model for both cases are summarised in Table 2. Note that there was a substantial difference between the internal room temperature of the test facility and the outside air. The test facility was initialised with the interior temperature in the FDS model.

Mesh Description

In CFD simulations, the definition of mesh resolution plays a vital role as the filter width is related to the size of the grid control volume. Based on the FDS user guideline, the general computational grid size can be determined through the characteristic length analysis that is based on the fire size. In essence, the characteristic length scale D* [44] can be correlated to the heat release rate Q ˙ , expressed as:
D * = ( Q ˙ ρ c p T g ) 2 / 5
According to this characteristic length D*, the mesh resolution can be indicated by the spacial resolution evaluated as R * = Δ l * / D * , where Δ l * is the overall mesh size that is applied in the computational domain. It is suggested from previous studies that the minimum requirement for large-scale fire simulation should demand a range of 1 / 10 < R * < 1 / 15 . Based on these criteria, three mesh systems were constructed, namely coarse, medium, and fine, comprising a total amount of 542000, 1246000, and 3878000 grid cells, respectively. It should be noted that this number includes the amount of meshes covering the extended region, however the grid size of the extended region may not be as fine as the ones within the compartment since those region are not the main focus of this study. An overall mesh size within the compartment of (0.2 m × 0.2 m × 0.2 m), (0.15 m × 0.15 m × 0.15 m), and (0.1 m × 0.1 m × 0.1 m) were applied for the coarse, medium, and fine mesh systems, respectively. A mesh sensitivity test was performed and the results comparing the coarse, medium, and fine mesh systems can be seen below in Figure 4. A significant improvement would result from increasing the mesh from a coarse to medium mesh system, with an overall average relative temperature difference of 15.96%. On the other hand, the temperature difference between the medium and fine mesh system is considerably less, with an overall average relative difference of only 2.18%. Therefore, the medium mesh system was selected for all of the simulation case studies in this numerical assessment for the large test hall simulations.

5. Results and Discussions

5.1. Temperature Predictions versus Thermocouple Measurements (Case 1)

Figure 5a–d shows the temperature predictions compared to the experimental data at thermocouple trees T1 to T4, respectively. The temperatures at 1 m height increased dramatically from 60 s to 240 s, corresponding to the growth phase of the fire. The 2 m2 methanol fire reached a stable release rate of around 860 kW in 100 s. As illustrated in the figures, the temperature results were slightly overpredicted in comparison to the experimental results. However, both simulation and experimental results for the ceiling temperature (i.e., 7 m high) stabilised at approximately 60 °C. The ceiling temperature of 60 °C was reached after 540 s of simulation time, while the experiment took 600 s, a difference of 60 s. The thermocouples at 7 m show a similar pattern with the experimental result. The maximum temperature difference was less than 7 °C. However, for the thermocouples at 3 m and 5 m middle levels, the maximum temperature difference was 15 °C. Finally, at lower levels, the difference reduced to approximately 3 °C. All of the results have shown to be within 15 °C of the experimental data. The temperature trends at different heights within the atrium were in agreement with the observations that were reported in the experiments. Overall, the model predictions are in reasonable agreement with the experimental results for Case 1.

5.2. Temperature Predictions versus Thermocouple Measurements (Case 2)

The temperature predictions and experimental results for Case 2 at thermocouple trees T1 and T5 are displayed in Figure 6. Similar to Case 1, the temperature increased rapidly from 60 s to 120 s. The methanol fire source is slightly smaller than Case 1. The 2 m2 methanol flame reached an HRR of 820 kW in 100 s. As can be observed, the temperature increased at a higher rate in the Case 2 simulation result compared to the experimental result. Both the simulation and experimental results become stable at 53 °C. For the simulation, it takes 330 s, and for the experimental result, it takes 300 s to reach the stable temperature. The thermocouples at 7 m show a similar pattern with the experimental result. The maximum temperature difference was less than 6 °C. However, for the thermocouple at the 3 and 5 m middle level, they have a maximum temperature difference of 13 °C. Finally, at the low level, the difference reduces to 4 °C. Overall, the results show that the FDS model was able to replicate the correct temperature trends and the temperature profiles were predicted with reasonable accuracy.

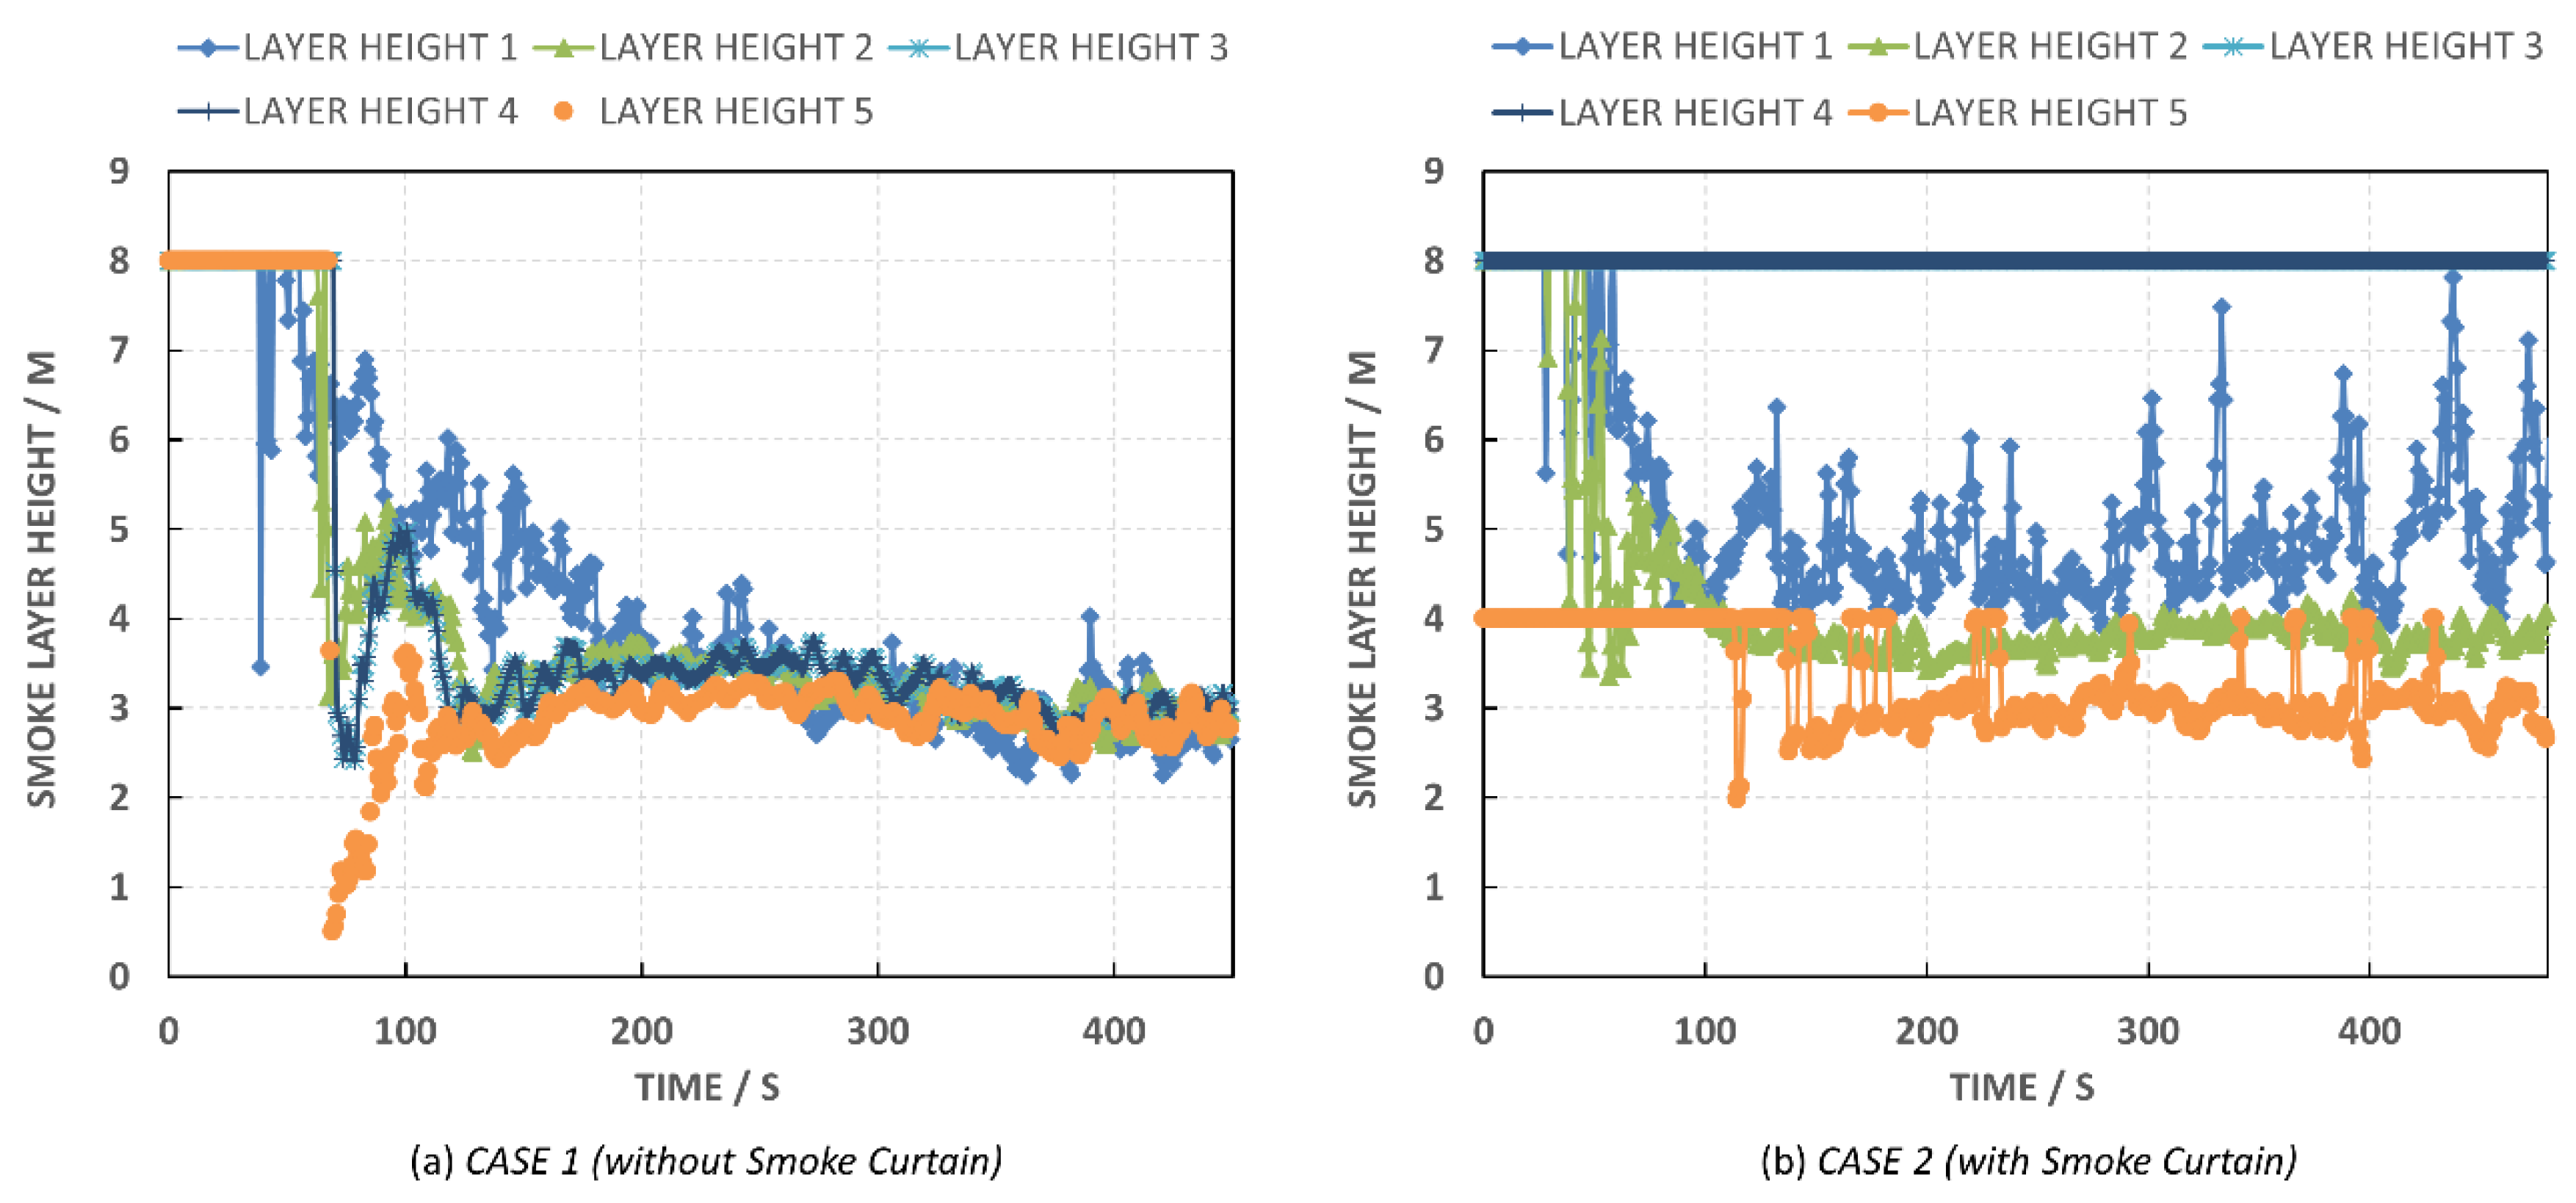
5.3. Compartment Temperature and Smoke Layer Height over Time

The ceiling temperature increases are mainly related to the smoke layer. When the exhaust rate is lower than the smoke generation rate, the smoke will accumulate in the atrium. In FDS, the smoke layer height is estimated from a continuous vertical temperature profile based on a two-layer zone model incorporating the N-percentage rule according to Janssens and Tran [45]. This empirical rule determines the interface as being the height where the temperature rising over the ambient temperature is equal to N % (10% is used in this study) of the maximum rise over the ambient temperature. This methodology was applied in a wide range of studies under different scenarios such as small-scale structures to large atriums and tunnel fires [46,47,48]. All of these studies have yielded predictions that were in good agreement with experimental results. A more recent study by Gao et al. [49] found the N-percentage rule to be more suitable for relatively stable stage of fires compared to cases with poor temperature stratification. To improve upon the weaknesses of two-layer zone models, there has been recent development in multi-layer zone models [50,51]. However, the current most frequently adopted zone models are still the single-layer and two-layer zone models [52].
Figure 7a,b shows the smoke layer height predictions for the left and right section of the test facility for Case 1 and Case 2, respectively. In case 1, the smoke layer stays around the 3 m position throughout the room, which was in agreement with observations that were recorded in the experiment. In Case 2, the smoke layer height on the left side (i.e., the side with the fire) of the smoke curtain accumulates to approximately 3 m height, while the smoke layer at the right side of the smoke curtain remains at 8 m. This indicates that the smoke is trapped in the left side of the room and seldom moves to the right side. The effectiveness of the smoke curtain can be further emphasised in Figure 8, which displays the three-dimensional smoke contour of the simulation compared to the experimental observations that were recorded by Hägglund and Niresus [39] for Case 1 and Case 2, respectively. The introduction of a smoke curtain effectively compartmentalised the smoke to one side of the atrium. In general, the results demonstrated that the smoke movement was accurately predicted by the fire model.

5.4. Hypothetical Cases

The previous cases demonstrated that the CFD model was able to produce reliable predictions for the smoke movement in a large atrium fire. Cases 3 to 5 are hypothetical cases to study the effects of smoke curtain height and different opening vents on the movement of smoke in a large atrium fire.

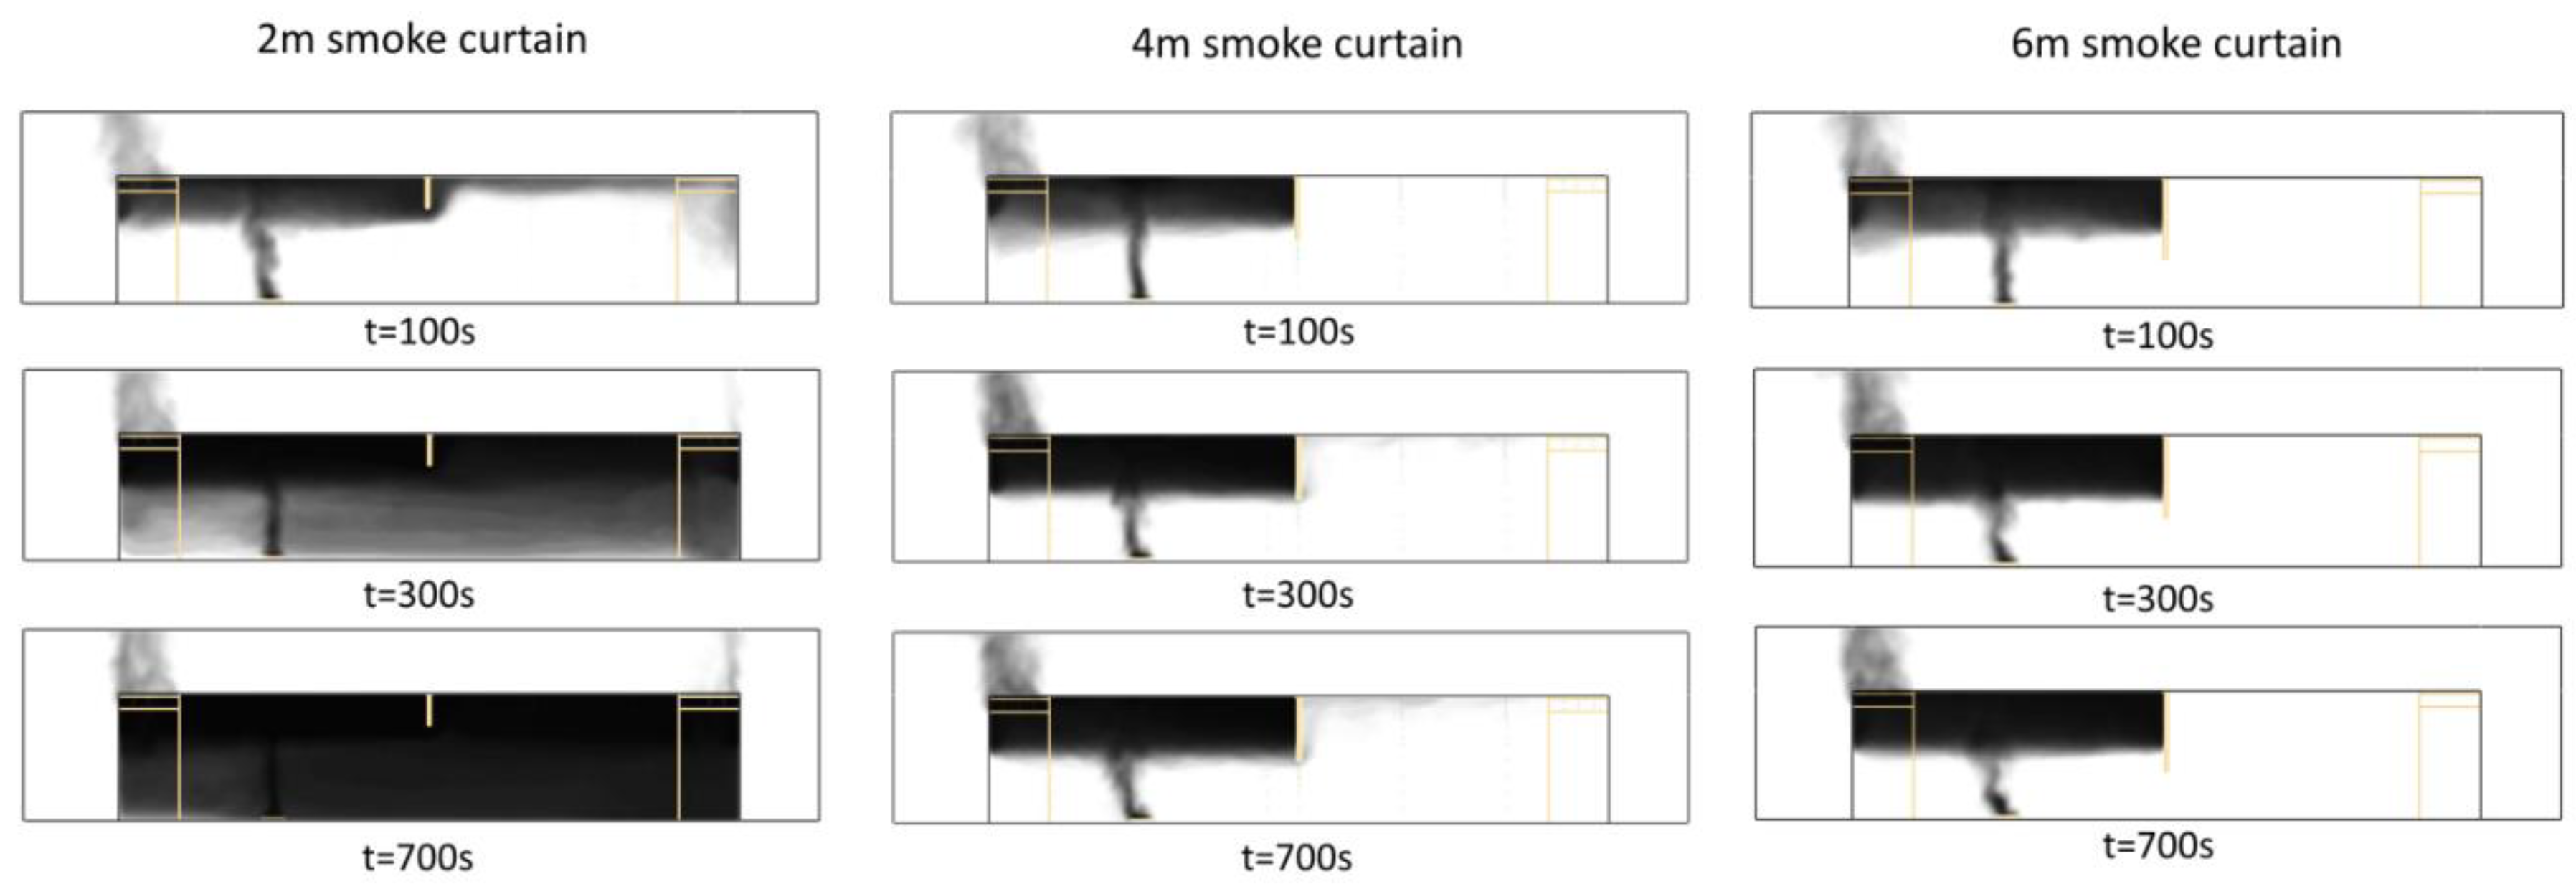
5.4.1. Study of Curtain Height

For Cases 2 to 4, the test facility was divided into two reservoirs by a smoke curtain with a height of 4 m, 2 m, and 6 m, respectively. Figure 9 illustrates the smoke build up at three different time instances (100 s, 300 s, and 700 s) for all three cases. As can be seen in the figure, the 2 m smoke curtain was unable to completely block the smoke from spreading to the right-hand side of the atrium. In addition, the vents were unable to effectively exhaust the smoke, causing the smoke to fill the entire atrium. It is notable that the 2 m smoke curtain did delay the smoke from spreading to the right-hand side by approximately 120 s. The results from the 2 m case are in stark contrast to the 4 m and the 6 m smoke curtain case, where the curtain was able to restrict the smoke to only the left side of the atrium.
Figure 10 shows the pressure contour inside the atrium for the 2 m, 4 m, and 6 m smoke curtain simulations. As can be seen in the figure, the 4 m and the 6 m smoke curtains were able to build a positive pressure of approximately 4.5 Pa and 4.55 Pa, respectively at the left reservoir ceiling region. This positive pressure causes the fire gases to be forced to exhaust through the top outlet vents D1 and B1 and the cold air outside the building to enter at the left vents D3 and B3. In comparison, the 2 m case had the entire ceiling at around 0 pressures. This caused the smoke to exhaust mainly at D1 and B1, and also smaller amounts at vents D3 and B3. In addition, the smaller pressure differential between the interior and outside also caused the flow rate of the outlets to decrease. This effect can be clearly seen in Figure 11 which shows the velocity at all four vents that were opened in the simulation. The average velocity across the surface area of the vents for Case 2 and Case 4 are approximately 1.8 m/s and 1.9 m/s, respectively, whereas Case 3 is approximately 1.2 m/s. This is a significant decrease in the flow rate compared to all the other Cases. On the other hand, extending the smoke curtain from 4 m to 6 m caused a small increase in the flow rate, which was likely due to slightly higher pressure build up near the ceiling vents.
In summary, the smoke curtain not only acts as a physical barrier for the fire gases to spread, however it also led to a pressure increase in the right reservoir. This positive pressure causes a stronger exhaust at vents D1 and B1 and leads the overall airflow to enter from the right. The more substantial exhaust flow was able to control the smoke to the right reservoir effectively. The temperature predictions for Case 2–4 at thermocouple trees T1 and T2 located at the left and right side of the atrium, respectively are illustrated in Figure 12. The values are averaged over 100 s duration after the temperature was stabilised. Overall, the temperatures were lower for both the 4 m and 6 m smoke curtain case compared to the 2 m case at both T1 and T2. Because the 2 m smoke curtain was unable to block the smoke from spreading over to the right side of the compartment, the temperature profile at both sides of the room were higher relative to the other two cases. The maximum temperature was 90 °C at the 7 m thermocouple at T1. Remarkably, Case 2 and 4 which has the 4 m and 6 m smoke curtain has a significantly lower ceiling temperature of approximately 50 °C and only at the right reservoir. In addition, there is a minuscule increase in temperature at the left side of the building; almost the entire left reservoir remains at a room temperature of approximately 10 °C for Case 2 (4 m smoke curtain) and a slightly lower 9 °C for Case 4 (6 m smoke curtain).

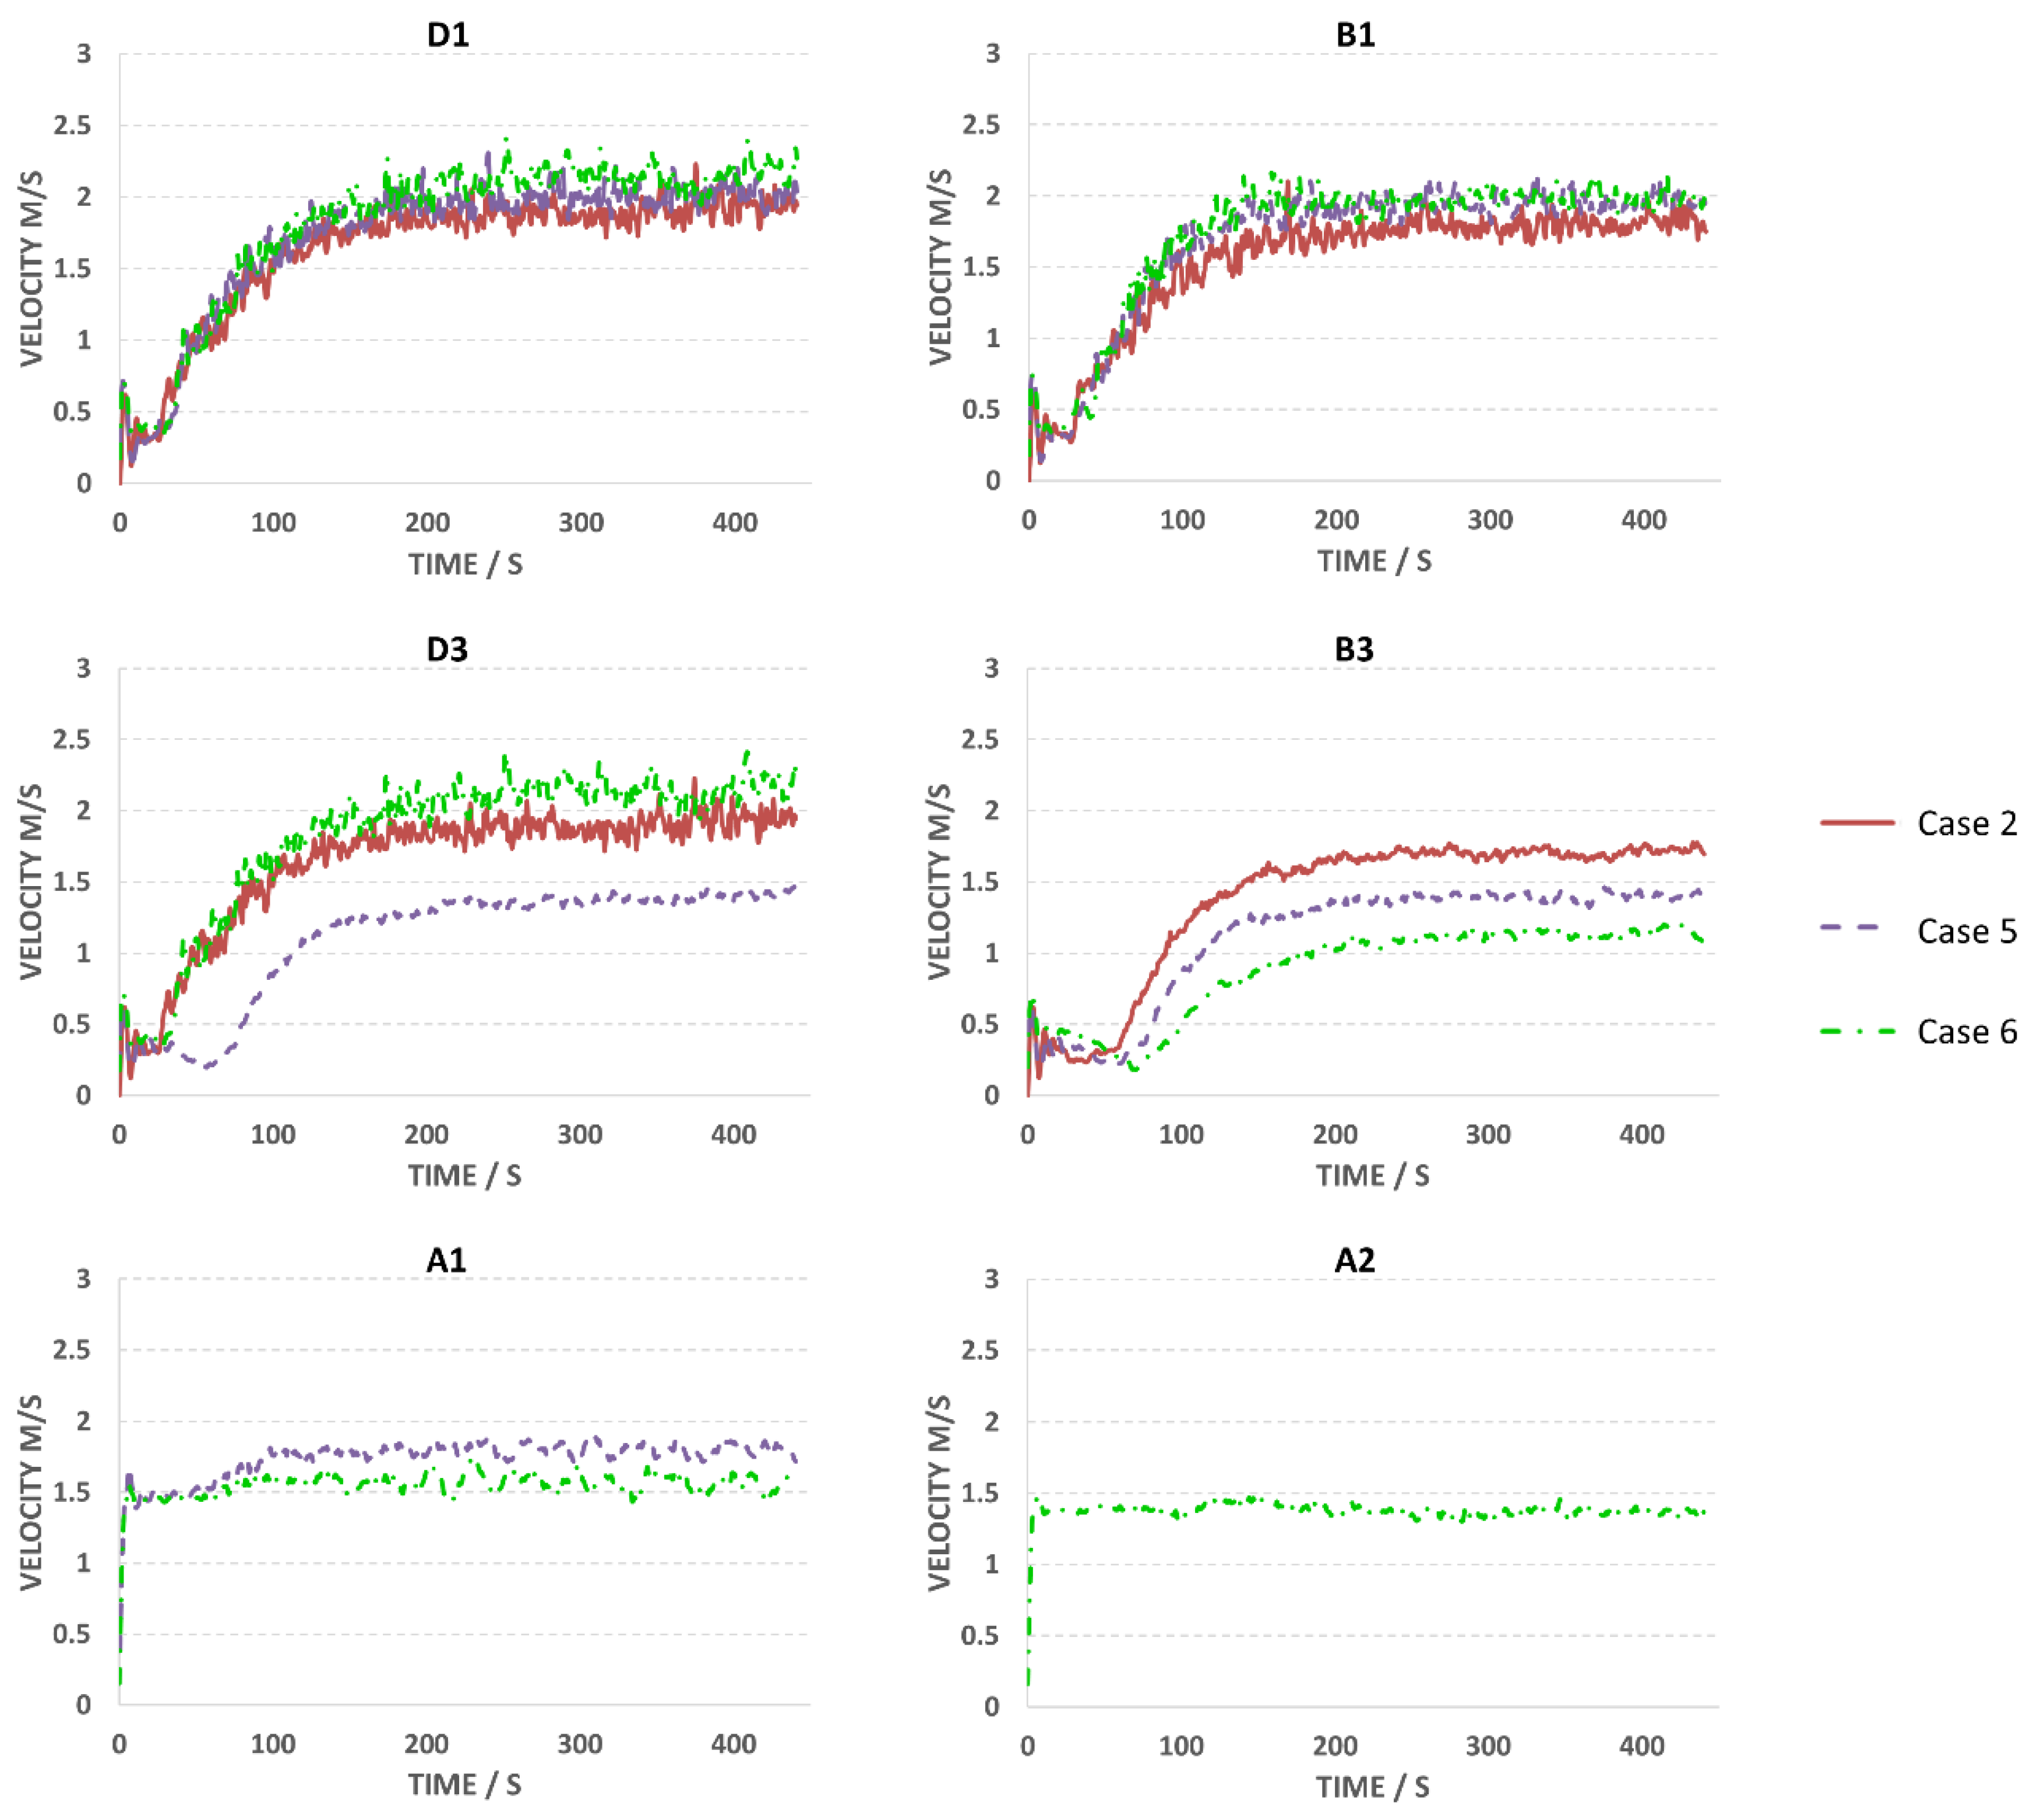
5.4.2. Study of Opening Vents

The numerical results for Case 5 and Case 6 are presented in this section. These two scenarios were based on Case 2, however with one additional floor level opening for Case 5 and two additional openings for Case 6. For these hypothetical cases, the atrium was divided into two reservoirs by a 4 m smoke curtain similar to case 2, however with the addition of doorway A1 and A2. Figure 13 shows the temperature at various thermocouple trees over time for Case 5 and 6. At thermocouple tree T1 and T5 located in the left reservoir, both Case 5 and 6 had very similar temperature profiles with maximum temperatures of 55.8 °C and 54.82 °C, respectively recorded at the 7 m height level. This is approximately 3 °C lower than the ceiling temperature from Case 2. This trend continues at all height levels at T1 and T5. On the other hand, the temperature predictions at the left reservoir were lower for Case 6 compared to Case 5. As can be seen in the temperature plots at T2 and T3 in Figure 13, the average ceiling temperatures for Case 6 was approximately 3 °C lower than Case 5. Temperatures at lower heights at T2 showed very little difference between the two cases. However, at location T3, the temperatures at 1 m, 3 m, and 5 m were also lower for Case 6. This was due to doorway A2 which was located much closer to thermocouple tree T3. Comparing both cases (5 and 6) to Case 2, temperatures at the right reservoir were lower by approximately 1 °C for Case 5 and 3°C for Case 6.
The velocity over time at all the openings that were measured in the fire model for Case 2, Case 5, and Case 6 are displayed in Figure 14. The introduction of doorway A1 and A2 caused a decrease in velocity at vents B3 and D3. Because the doorways are at ground level, the buoyancy effect from the fire gases flowing upward caused both doorways to act as inlets. Therefore, the total inflow of cold air into the building has to be redistributed to take into account the increase in the number of inlets. This is especially the case for Case 6, where A2 is opened directly below inlet B3, causing a substantial drop of around 50% in the flow from B3 when compared to Case 5.
Overall, the result indicates that by opening doorway A1 on the left side wall, this caused a small decrease in temperature to the left reservoir. This is mainly due to cold air entering the atrium from doorway A1 due to the buoyancy effect from the hot fire plume. However, opening A1 has little effect on the temperature of the right reservoir. This may be due to the effectiveness of the 4m smoke curtain in zoning the hot gases to the left reservoir, and the entire right reservoir remains close to the initial room temperature. The addition of doorway A2 showed insignificant changes to the temperature at the left side of the atrium. However, opening A2 caused a much more significant decrease in the temperature at the right reservoir. This is a logical conclusion as it increases the exposure of the right zone to the outside cold air.

6. Conclusions

In this article, the various strategies of smoke control using smoke vents and curtains within a large atrium fire was investigated using LES-based three-dimensional CFD simulations with the consideration of turbulence, combustion, radiation, and the fundamentals of conservation laws. The model was validated by time-dependent thermocouple data that was measured at various vertical height levels in the experiment. Based on the simulated predictions, the smoke layer thickness and transient temperature predictions were in good agreement with the experimental measurements. The maximum temperatures recorded by the thermocouples were decently predicted, especially for the lower layer temperature. Once the model was validated, a series of proposed fire scenarios with different ventilation, opening vents, and smoke curtain configurations were examined by the addressing model. The results showed that the 4 m smoke curtain was highly effective in zoning the fire gases to one side of the atrium, particularly for a fire size of around 800 kW to 1 MW, in this geometry configuration of a 39 m × 11 m × 8 m large test hall. This was mainly due to the two following reasons (i) it acted as a physical barrier to block the dispersion of smoke from one zone to another; (ii) it created a highly pressurised zone which forces smoke to be expelled away from the outlet vents at an increased rate (i.e., where the fire origin is located) and (iii) it lowered the pressure at the side where the fire is not located, causing more air to be entrained from the inlet vents. Reducing the smoke curtain height from 4 m to 2 m drastically reduced the effectiveness of the smoke curtain. The 2 m barrier was only able to delay the smoke from spreading to the other side of the compartment by approximately 120 s and gradually, the smoke layer filled the entire atrium. The simulation results also showed that the additional doorways at ground level caused a small decrease in the temperatures at lower heights. The stack effect that was created by the hot fire plume induced additional air entrainment from the doorways. Through in-depth numerical simulation studies, this provides additional numerical results upon the experiments, including the in-depth smoke movement within the compartment and across the opening vents and the influence of the smoke curtain towards the overall flow pattern, which can be useful data to improve our understanding and enhance the validity of smoke extraction systems. In summary, the following key numerical findings are:
  • Smoke curtains are an effective tool to compartmentalise smoke for large-scale atriums which can significantly increase egress time allowed for occupants during fire situations;
  • With the application of a smoke curtain, although the smoke layer thickness slightly increased, the smoke extraction rate increased via the outlet vents without any installation of a mechanical system;
  • Under the same opening vent configurations, smoke curtains less than 4 m high were not able to completely contain smoke within the fire zone and the overall natural ventilation rate reduced;
  • When the floor opening vent was located near the fire source, it might promote the fire size due to an increase in air entrainment.

Author Contributions

Conceptualization, G.H.Y. and A.C.Y.Y.; methodology, A.C.Y.Y. and G.H.Y.; software, T.B.Y.C. and Q.N.C.; data curation, A.L., formal analysis, T.B.Y.C. and C.W.; investigation, T.B.Y.C. and C.W.; writing—original draft preparation, A.C.Y.Y. and T.B.Y.C.; writing—review and editing, A.L., W.Y., and Q.N.C.; visualization, T.B.Y.C. and A.L.; supervision, G.H.Y. and W.Y.; project administration, A.C.Y.Y. and W.Y.; numerical simulations, M.C.C.; funding acquisition, G.H.Y.

Funding

The article is supported by the Australian Research Council (ARC Industrial Transformation Training Centre IC170100032) and the Australian Government Research Training Program. All financial and technical supports are deeply appreciated by the authors.

Conflicts of Interest

The authors declare no conflict of interest.

References

  1. AS 1851-2012. Routine Service of Fire Protection Systems and Equipment; Standards Australia: Sydney, Australia, 2012. [Google Scholar]
  2. Buchanan, A. The Challenges of Predicting Structural Performance in Fires. Fire Saf. Sci. 2008, 9, 79–90. [Google Scholar] [CrossRef] [Green Version]
  3. Bukowski, R.W.; Babrauskas, V. Developing rational, performance-based fire safety requirements in model building codes. Fire Mater. 1994, 18, 173–191. [Google Scholar] [CrossRef]
  4. Hadjisophocleous, G.; Bénichou, N. Development of performance-based codes, performance criteria and fire safety engineering methods. Int. J. Eng. Perform. Based Fire Codes 2000, 2, 127–142. [Google Scholar]
  5. Meacham, B.; Bowen, R.; Traw, J.; Moore, A. Performance-based building regulation: Current situation and future needs. Build. Res. Inf. 2005, 33, 91–106. [Google Scholar] [CrossRef]
  6. Alvarez, A.; Meacham, B.; Dembsey, N.; Thomas, J. Twenty years of performance-based fire protection design: challenges faced and a look ahead. J. Fire Prot. Eng. 2013, 23, 249–276. [Google Scholar] [CrossRef]
  7. Black, W.Z. Smoke movement in elevator shafts during a high-rise structural fire. Fire Saf. J. 2009, 44, 168–182. [Google Scholar] [CrossRef]
  8. Yang, W.; Tawiah, B.; Yu, C.; Qian, Y.-F.; Wang, L.-L.; Yuen, A.C.-Y.; Zhu, S.-E.; Hu, E.-Z.; Chen, T.B.-Y.; Yu, B.; et al. Manufacturing, mechanical and flame retardant properties of poly(lactic acid) biocomposites based on calcium magnesium phytate and carbon nanotubes. Compos. Part A Appl. Sci. Manuf. 2018, 110, 227–236. [Google Scholar] [CrossRef]
  9. Yang, W.; Yang, W.-J.; Tawiah, B.; Zhang, Y.; Wang, L.-L.; Zhu, S.-E.; Chen, T.B.Y.; Yuen, A.C.Y.; Yu, B.; Liu, Y.-F.; et al. Synthesis of anhydrous manganese hypophosphite microtubes for simultaneous flame retardant and mechanical enhancement on poly(lactic acid). Compos. Sci. Technol. 2018, 164, 44–50. [Google Scholar] [CrossRef]
  10. Gao, R.; Li, A.; Hao, X.; Lei, W.; Deng, B. Prediction of the spread of smoke in a huge transit terminal subway station under six different fire scenarios. Tunn. Undergr. Space Technol. 2012, 31, 128–138. [Google Scholar] [CrossRef]
  11. Rie, D.-H.; Hwang, M.-W.; Kim, S.-J.; Yoon, S.-W.; Ko, J.-W.; Kim, H.-Y. A study of optimal vent mode for the smoke control of subway station fire. Tunn. Undergr. Space Technol. 2006, 21, 300–301. [Google Scholar] [CrossRef]
  12. Gao, R.; Li, A.; Hao, X.; Lei, W.; Zhao, Y.; Deng, B. Fire-induced smoke control via hybrid ventilation in a huge transit terminal subway station. Energy Build. 2012, 45, 280–289. [Google Scholar] [CrossRef]
  13. Capote, J.; Alvear, D.; Abreu, O.; Lazaro, M.; Espina, P. Scale tests of smoke filling in large atria. Fire Technol. 2009, 45, 201. [Google Scholar] [CrossRef]
  14. Kaye, N.; Hunt, G. Smoke filling time for a room due to a small fire: The effect of ceiling height to floor width aspect ratio. Fire Saf. J. 2007, 42, 329–339. [Google Scholar] [CrossRef]
  15. Qin, T.; Guo, Y.; Chan, C.; Lin, W. Numerical simulation of the spread of smoke in an atrium under fire scenario. Build. Environ. 2009, 44, 56–65. [Google Scholar] [CrossRef]
  16. Chen, T.B.Y.; Yuen, A.C.Y.; Yeoh, G.H.; Timchenko, V.; Cheung, S.C.P.; Chan, Q.N.; Yang, W.; Lu, H. Numerical study of fire spread using the level-set method with large eddy simulation incorporating detailed chemical kinetics gas-phase combustion model. J. Comput. Sci. 2018, 24, 8–23. [Google Scholar] [CrossRef]
  17. Ji, J.; Guo, F.; Gao, Z.; Zhu, J. Effects of ambient pressure on transport characteristics of thermal-driven smoke flow in a tunnel. Int. J. Therm. Sci. 2018, 125, 210–217. [Google Scholar] [CrossRef]
  18. Ji, J.; Tan, T.; Gao, Z.; Wan, H.; Zhu, J.; Ding, L.J.F.T. Numerical Investigation on the Influence of Length–Width Ratio of Fire Source on the Smoke Movement and Temperature Distribution in Tunnel Fires. Fire Technol. 2019. [Google Scholar] [CrossRef]
  19. Gutiérrez-Montes, C.; Sanmiguel-Rojas, E.; Kaiser, A.S.; Viedma, A. Numerical model and validation experiments of atrium enclosure fire in a new fire test facility. Build. Environ. 2008, 43, 1912–1928. [Google Scholar] [CrossRef] [Green Version]
  20. Gutiérrez-Montes, C.; Sanmiguel-Rojas, E.; Viedma, A. Influence of different make-up air configurations on the fire-induced conditions in an atrium. Build. Environ. 2010, 45, 2458–2472. [Google Scholar] [CrossRef] [Green Version]
  21. Gutiérrez-Montes, C.; Sanmiguel-Rojas, E.; Viedma, A.; Rein, G. Experimental data and numerical modelling of 1.3 and 2.3 MW fires in a 20 m cubic atrium. Build. Environ. 2009, 44, 1827–1839. [Google Scholar] [CrossRef]
  22. Ayala, P.; Cantizano, A.; Gutiérrez-Montes, C.; Rein, G.J.E. Influence of atrium roof geometries on the numerical predictions of fire tests under natural ventilation conditions. Energy Build. 2013, 65, 382–390. [Google Scholar] [CrossRef]
  23. Ayala, P.; Cantizano, A.; Sánchez-Úbeda, E.; Gutiérrez-Montes, C.J.F.T. The use of fractional factorial design for atrium fires prediction. Fire Technol. 2017, 53, 893–916. [Google Scholar] [CrossRef]
  24. Chow, W.K.; Li, Y.Z.; Cui, E.; Huo, R. Natural smoke filling in atrium with liquid pool fires up to 1.6 MW. Build. Environ. 2001, 36, 121–127. [Google Scholar] [CrossRef]
  25. Hadjisophocleous, G.V.; Fu, Z.; Lougheed, G. Experimental study and zone modeling of smoke movement in a model atrium. ASHRAE Trans. 2002, 108, 868–874. [Google Scholar]
  26. Lougheed, G.D.; Hadjisophocleous, G.V.; McCartney, C.; Taber, B.C. Large-scale physical model studies for an atrium smoke exhaust system. ASHRAE Trans. 1999, 105, 1–23. [Google Scholar]
  27. National Fire Protection Association. NFPA 92B. Guide for Smoke Management Systems in Atria, Covered Malls, and Large Areas; National Fire Protection Association: Quincy, MA, USA, 2005. [Google Scholar]
  28. Tanaka, T.; Yamana, T. Smoke control in large scale spaces—Part 1. Fire Sci. Technol. 1985, 5, 31–40. [Google Scholar] [CrossRef]
  29. Fu, Z.; Hadjisophocleous, G.V. A Two-zone fire growth and smoke movement model for multi-compartment buildings. Fire Saf. J. 2000, 34, 257–285. [Google Scholar] [CrossRef]
  30. Yuen, A.C.Y.; Yeoh, G.H.; Yuen, R.K.K.; Chen, T. Numerical Simulation of a Ceiling Jet Fire in a Large Compartment. Procedia Eng. 2013, 52, 3–12. [Google Scholar] [Green Version]
  31. Yuen, A.C.Y.; Yeoh, G.H. Numerical Simulation of an Enclosure Fire in a Large Test Hall. Comput. Therm. Sci. Int. J. 2013, 5, 459–471. [Google Scholar] [CrossRef]
  32. Dupuy, J.-L.; Larini, M. Fire spread through a porous forest fuel bed: A radiative and convective model including fire-induced flow effects. Int. J. Wildland Fire 1999, 9, 155–172. [Google Scholar] [CrossRef]
  33. Chen, T.B.Y.; Yuen, A.C.Y.; Wang, C.; Yeoh, G.H.; Timchenko, V.; Cheung, S.C.P.; Chan, Q.N.; Yang, W. Predicting the fire spread rate of a sloped pine needle board utilizing pyrolysis modelling with detailed gas-phase combustion. Int. J. Heat Mass Transf. 2018, 125, 310–322. [Google Scholar] [CrossRef]
  34. Yuen, A.C.Y.; Yeoh, G.H.; Alexander, B.; Cook, M. Fire scene investigation of an arson fire incident using computational fluid dynamics based fire simulation. Build. Simul. 2014, 7, 477–487. [Google Scholar] [CrossRef]
  35. Yuen, A.C.Y.; Chen, T.B.Y.; Yeoh, G.H.; Yang, W.; Cheung, S.C.-P.; Cook, M.; Yu, B.; Chan, Q.N.; Yip, H.L. Establishing pyrolysis kinetics for the modelling of the flammability and burning characteristics of solid combustible materials. J. Fire Sci. 2018. [Google Scholar] [CrossRef]
  36. Yuen, A.C.Y.; Yeoh, G.H.; Timchenko, V.; Cheung, S.C.P.; Barber, T.J. Importance of detailed chemical kinetics on combustion and soot modelling of ventilated and under-ventilated fires in compartment. Int. J. Heat Mass Transf. 2016, 96, 171–188. [Google Scholar] [CrossRef]
  37. Yuen, A.C.Y.; Yeoh, G.H.; Timchenko, V.; Chen, T.B.Y.; Chan, Q.N.; Wang, C.; Li, D.D. Comparison of detailed soot formation models for sooty and non-sooty flames in an under-ventilated ISO room. Int. J. Heat Mass Transf. 2017, 115, 717–729. [Google Scholar] [CrossRef]
  38. Yuen, A.C.Y.; Yeoh, G.H.; Cheung, S.C.P.; Chan, Q.N.; Chen, T.B.Y.; Yang, W.; Lu, H. Numerical study of the development and angular speed of a small-scale fire whirl. J. Comput. Sci. 2018, 27, 21–34. [Google Scholar] [CrossRef]
  39. Hägglund, B.; Niresus, K.; Werling, P. Effects of Inlets on Natural Fire Vents: An Experimental Study; National Deference Reserach Establishment, Department of Weapons and Protection: Stockholm, Sweden, 1996. [Google Scholar]
  40. Magnussen, B.F.; Hjertager, B.H. On mathematical modeling of turbulent combustion with special emphasis on soot formation and combustion. Symp. (Int.) Combust. 1977, 16, 719–729. [Google Scholar] [CrossRef]
  41. Huggett, C. Estimation of rate of heat release by means of oxygen consumption measurements. Fire Mater. 1980, 4, 61–65. [Google Scholar] [CrossRef] [Green Version]
  42. Smagorinsky, J. General circulation experiments with the primitive equations: I. The basic experiment. Mon. Weather Rev. 1963, 91, 99–164. [Google Scholar] [CrossRef]
  43. Yuen, A.C.Y.; Yeoh, G.H.; Timchenko, V.; Cheung, S.C.P.; Chan, Q.N.; Chen, T. On the influences of key modelling constants of large eddy simulations for large-scale compartment fires predictions. Int. J. Comput. Fluid Dyn. 2017, 31, 324–337. [Google Scholar] [CrossRef]
  44. DiNenno, P.J.; Drysdale, D.; Beyler, C.L.; Walton, D.W. SFPE Handbook of Fire Protection Engineering, 3rd ed.; National Fire Protection Association: Quincy, MA, USA, 2002. [Google Scholar]
  45. Janssens, M.; Tran, H. Data reduction of room tests for zone model validation. J. Fire Sci. 1992, 10, 528–555. [Google Scholar] [CrossRef]
  46. Zhang, J.; Zhou, X.; Xu, Q.; Yang, L. The inclination effect on CO generation and smoke movement in an inclined tunnel fire. Tunn. Undergr. Space Technol. 2012, 29, 78–84. [Google Scholar] [CrossRef]
  47. Tilley, N.; Rauwoens, P.; Merci, B. Verification of the accuracy of CFD simulations in small-scale tunnel and atrium fire configurations. Fire Saf. J. 2011, 46, 186–193. [Google Scholar] [CrossRef] [Green Version]
  48. Chow, W.K.; Gao, Y. Oscillating behaviour of fire-induced air flow through a ceiling vent. Appl. Therm. Eng. 2009, 29, 3289–3298. [Google Scholar] [CrossRef]
  49. Gao, Z.H.; Ji, J.; Fan, C.G.; Li, L.J.; Sun, J.H. Determination of smoke layer interface height of medium scale tunnel fire scenarios. Tunn. Undergr. Space Technol. 2016, 56, 118–124. [Google Scholar] [CrossRef]
  50. Chen, X.; Yang, L.; Dend, Z.; Fan, W. A multi-layer zone model for predicting fire behavior in a fire room. Fire Saf. J. 2005, 40, 267–281. [Google Scholar] [CrossRef]
  51. Suzuki, K.; Harada, K.; Tanaka, T. A multi-layer zone model for predicting fire behavior in a single room. Fire Saf. J. 2003, 7, 851–862. [Google Scholar] [CrossRef]
  52. Zhang, X.; Hadjisophocleous, G. An improved two-layer zone model applicable to both pre- and post-flashover fires. Fire Saf. J. 2012, 53, 63–71. [Google Scholar] [CrossRef]
Figure 1. Configuration of the large atrium for Configuration 1 (no smoke curtain), (a) Top view at the lower level, showing the locations of the fuel bed, doorway openings, and thermal couple trees, (b) Top view at the upper level, showing locations of the top opening vents and smoke curtain (c) Side view showing the vent openings (figure modified after previous work [43]).
Fire 02 00007 g001aFire 02 00007 g001b
Figure 2. Isomeric view of the computational domain for Configuration 1.
Fire 02 00007 g002
Figure 3. Isomeric view of the computational domain for Configuration 2.
Fire 02 00007 g003
Figure 4. ThermocoupleT1 at 7m vertical height level transient simulation result comparisons for coarse, medium, and fine mesh systems.
Fire 02 00007 g004
Figure 5. Comparison of the numerical prediction against the experiment temperature measurements for Case 1 at thermocouple trees (a) T1, (b) T2, (c) T3, and (d) T4.
Fire 02 00007 g005
Figure 6. Comparison of the numerical prediction against the experiment temperature measurements for Case 2 at thermocouple trees (a) T1 and (b) T5.
Fire 02 00007 g006
Figure 7. Smoke layer height prediction over time for (a) Case 1 and (b) Case 2 at locations T1–T5.
Fire 02 00007 g007
Figure 8. Smoke Comparison between the numerical simulation and the experimental observations from Hägglund and Niresus [39] for (a) Case 1 and (b) Case 2.
Fire 02 00007 g008
Figure 9. Smoke contour of 2 m (case 3), 4 m (case 2), and 6 m (case 4) smoke curtain case at times: 100 s, 300 s, and 700 s.
Fire 02 00007 g009
Figure 10. Pressure contour of 2 m (case 3), 4 m (case 2), and 6 m (case 4) smoke curtain case at times: 100 s, 300 s, and 700 s.
Fire 02 00007 g010
Figure 11. Average velocity over time at opening vents D1, B1, D3, and B3 for Case 2, 3, and 4.
Fire 02 00007 g011
Figure 12. Temperature measurement at location thermocouple trees T1 and T2 for Case 2, 3, and 4.
Fire 02 00007 g012
Figure 13. Temperature measurements at thermocouple tree T1, T2, T3, and T5 for Case 2, 5, and 6.
Fire 02 00007 g013
Figure 14. Average velocity measurements over time at various openings for Cases 2, 5, and 6.
Fire 02 00007 g014
Table 1. Numerical simulation cases and configurations for the fuel bed, opening vents, and smoke curtain.
CaseHRR (Heat Release Rate)Floor Level Openings (A)Front Top Opening Vents (D)Rear Top Opening Vents (B)Smoke Curtain
A1A2D1D2D3B1B2B3
1 (test5)880 kWN. A.
2 (test42)820 kW4 m
3(proposed)820 kW2 m
4(proposed)820 kW6 m
5(proposed)820 kW4 m
6(proposed)820 kW4 m
Table 2. Boundary condition of the fuel bed for Case Study 1 and Case 2.
Case 1Case 2
Heat release rate, kW860820
Internal temperature, K288.0286.0
External temperature, K281.0279.0
Fuel typeMethanolMethanol
Molar mass of fuel, kgmol−13232
Heat of combustion of fuel, kJg−120.020.0
Area of fuel boundary, m222
Mass loss rate, kgs−10.0430.041

