Technical Note

A Device for Instantaneously Estimating Duff Moisture Content Is also Effective for Grassland Fuels

by
Devan Allen McGranahan
School for Natural Resource Sciences—Range Science Program, North Dakota State University, Fargo, ND 58108, USA
Submission received: 31 January 2019 / Revised: 20 February 2019 / Accepted: 21 February 2019 / Published: 27 February 2019

Abstract

:
Fine-fuel moisture is an important variable in the wildland fire environment, but measuring live fuel moisture is time-consuming. There is a strong incentive to develop technologies that provide instantaneous measurements of fine-fuel moisture. Campbell Scientific, Inc. markets a device that uses dielectric permittivity to measure the moisture content of duff fuels in forests; this Duff Moisture Meter (DMM600) might also be applied to herbaceous grassland fuels but its effectiveness has not been tested. This paper describes how grassland fuel samples collected for the DMM600 do well to represent the broader fuelbed, and that the dielectric permittivity values of the DMM600 correlate well with the actual moisture content of uncured grassland fuels. Results suggest the DMM600 can effectively estimate moisture content in uncured grassland fuels, including the overall fuelbed as well as live herbaceous fuels and well-aggregated samples of the grassland litter layer. Calibration equations and tips to ensure representative data are provided.

1. Introduction

Fuel moisture is one of the most important variables in the wildland fire environment. Fuel is a component of both the flame and fire behavior triangles [1], and thus, fuel properties are critical in determining at fine scales (individual combustion reactions) whether ignition occurs, and at broad scales (landscapes), whether and how fire spreads across landscapes. Moisture content is a critical component at each scale. At fine scales, high fuel moisture content slows fire spread [2], as explained by steady-state models of energy transfer [3]: fuel moisture acts as a heat sink in the reaction zone, preventing combustion if reaction energy isn’t sufficient to first dry a fuel particle and continue heating it to kindling temperature. At the landscape scale, high fuel moisture reduces fire intensity [4].
Wildland fuels are broadly separated into dead and live categories and into broad size classes, fine and coarse, depending on whether the particle is less than or greater than 6mm in diameter, respectively. (This paper focuses exclusively on fine-fuels and mostly on the live component, i.e., partially- or completely-uncured fine fuels.) Drivers of moisture content vary between fuel types  [5]. The term curing is often used to refer to fine-fuel moisture content, and for functional purposes (e.g., fire behavior models) is broken into categories [6,7]. Fine dead fuel moisture—or degree of curing—is driven by moisture in the environment, including atmospheric moisture (humidity), soil moisture, and precipitation. thus, fine dead fuel moisture is to varying degrees correlated with broad environmental variables that can be measured remotely, modelled, and predicted, such as drought indices and diurnal changes in relative humidity [8,9,10,11]. Live fuel moisture, though, varies more seasonally, depending on the biology of the plant species [12]. While progress has been made in measuring live fuel moisture at broad scales with proxies like soil moisture and via remote sensing [12,13,14,15], obtaining real-time data on live fuel moisture within specific burn units remains a challenge even as wildland fire scientists increasingly recognize the influence of live fuel moisture on fire behavior [16,17].
Live fuel moisture is of particular interest in temperate grasslands because managers are increasingly interested in growing season burns, when a lower proportion of fine-fuels are cured because vegetation is photosynthetically active [18]. Asynchronous fuel moisture also causes exotic, cool-season invasive grasses to increase the proportion of live fuels in grassland fuelbeds; such species are photosynthetically active—and have live high fuel moisture—during the dormant period of native warm-season communities when fuels are typically cured and prescribed burns conventionally conducted [19]. Two exotic cool-season grasses of particular concern in the Northern Great Plains of North America are Bromus inermis Leyss. (smooth brome) and Poa pratensis L. (Kentucky bluegrass) [20]. Patches of high-moisture, live fuels can impede fire spread [21,22], and thus, knowledge of live fuel moisture content prior to prescribed burns can inform broad Go/No-go decisions, inform specific ignition plans, and explain variability in fire behavior and fire effects.
Using day-of live fuel moisture information in wildland fire management is challenging because data collection is time-consuming. Live fuel moisture content is typically determined by clipping and weighing fuel samples, drying samples to a constant mass in a drying oven, and weighed again to determine the mass of lost water, which typically requires 12–24 h although microwave ovens can reduce the time to 20–30 min [23,24]. Especially when wildland fire managers lack access to microwave ovens, data on day-of live fuel moisture content is thus, unavailable without an instantaneous solution.
There are, however, technologies capable of making instantaneous moisture content measurements, and devices have been designed for field applications. These field instruments are based on time and frequency domain reflectometry (TDR/FDR), in which a specific type of electric pulse is emitted through material, sensed by a receiver, and only then immediately emitted again. The travel time of the pulses determines their frequency, and the travel time is determined by the dielectric permittivity of the material. Because water has a constant dielectric permittivity an order of magnitude above organic materials, the dielectric permittivity—and thus, the frequency of TDR/FDR pulses—of organic materials is highly sensitive to moisture content. thus, measuring the frequency (MHz) of TDR/FDR pulses is a robust way to measure water content. The relationship between dielectic permittivity and moisture content has been applied in industries like grain processing for decades [25,26,27], and many farmers use handheld moisture meters to determine when they can harvest or whether they should dry stored grain. But applying dielectric permittivity in the wildland context is difficult because materials aren’t uniform; while grain density is fairly constant and kernels can easily fill a given volume, the density and structure of vegetative material varies widely. Researchers with the US Forest Service developed a portable device—25 cm long weighing 1.7 kg—that uses a screw-driven, spring-sensed compression system to reduce airspace and improve conductivity in heterogeneous organic material [28]. The device is manufactured and marketed by Campbell Scientific, Inc. of Logan, Utah, USA as the DMM600 Duff Moisture Meter.
The DMM600 has been shown to effectively measure the moisture content of organic forest soils (duff) [28,29]. Theoretically, however, it could also be applied as a solution to obtain instantaneous data on fine-fuel moisture content, including live herbaceous fuel moisture. But to my knowledge its effectiveness in other wildland fuel types has yet to be determined. Upon purchasing a DMM600 Duff Moisture Meter from Campbell Scientific, I pursued the following research objectives:
  • Determine whether moisture content of samples collected for the DMM600 represent the moisture content of the broader grassland fuelbed,
  • Determine efficacy and accuracy of the DMM600 in estimating grassland fuel moisture, and
  • Fit an equation for calibrating the DMM600 to return grassland-specific moisture percentages.

2. Materials and Methods

2.1. Sample Collection

To ensure a sufficient gradient in fuel moisture to test the DMM600, I sampled fuel moisture for two exotic cool-season grasses—Bromus inermis (smooth brome) and Poa pratensis (Kentucky bluegrass)—and native warm-season stands 10 times at regular intervals during spring (17 April–16 May) and fall (16–30 October) fire seasons in 2016. Sampling locations included three semi-natural areas with grassland habitat in Fargo, ND, USA. Within each location, three areas of the grassland habitat at least 75 m apart were identified, from which three individual samples were collected during each visit. The three sampling locations and three areas within each location were consistent for the duration of the study, and form the structure of the spatially-hierarchical design described below. At each sampling area, three points were identified: one with a stand of nearly 100% B. inermis cover, another with a stand of nearly 100% P. pratensis cover, and a third stand dominated by native warm-season grass (warm season grass data were not included in this analysis due to being fully cured during the duration of the study).
Basic operation of the DMM600 consists of loading the sample chamber and compressing the sample until the unit beeps, at which point the LCD provides the dielectric permittivity as freq, in MHz, and a % moisture content (volumetric water content, VWC, by default). The user can simply unscrew the top and discard the sample, or if a bulk density measurement is desired, the user counts the turns taken to decompress the sample (to measure sample volume; the top is printed with 1/8-increment markings to assist the user in counting turns) and retains the sample for drying and weighing (to determine the mass of the sample). See [28] for a thorough description of the DMM600 and its operation, complete with photographs .
In the field, I handled samples (three from each sampling area) in the following manner:
  • A handful of sample material, collected as above, was clumped into a loose ball and stuffed into the DMM600 sample chamber, with no material allowed to hang over the edges.
  • The top of the DMM600 was fixed into place, the device switched on, and the sample compressed via the screw.
  • Once the device beeped, I recorded the freq and % VWC on the display.
  • Number of rotations to decompress the sample were counted and recorded.
  • The sample was put in a uniquely-identified envelope.
Collecting these samples proceeded slightly differently in the spring and in the fall, and when data are combined, they represent a broad gradient in fine-fuel moisture for these grassland fuels. In the spring, the fresh emergence of green, live shoots made hand-sorting live and dead fuel components easy. Thus, at each sampling point, three handfuls of live fuel for each species was collected and handled as above, along with three handfuls of litter for each species; these comprise the “live” and “litter” types in the analyses that begin with Section 3.1.2. Then, I placed three random 0.10 m2 quadrats in each species’ stand and sampled the litter layer by clipping and discarding all plant material standing above the top of the litter layer, then clipping and collecting the litter layer to within 2 cm of mineral soil. These samples comprise the “litter” component in Section 3.1.1 (Figure 1).
Two developments prompted an altered sampling protocol in the fall. First, after a full growing season, hand-separating the fine leaves of live P. pratensis in the field became onerous. Second, preliminary analysis of litter moisture content indicated that the handfuls of litter used in the DMM600 had substantially lower moisture than clipped samples, which suggested hand-sampling only pulled lofted, drier litter from the top of the litter layer and did not capture higher-moisture material deeper in the litter layer. Thus, I adjusted sampling to begin with the random placement of 0.10 m2 quadrats, which were clipped to within 2 cm of mineral soil and all collected plant biomass aggregated in a small, sturdy vinyl reusable shopping bag, from which I extracted a handful sub-sample for the DMM600. These fall samples comprise the “total” fuel type in the figures and analyses below.
All sampled material was retained to determine moisture content. To assess how well the DMM600 measured the moisture content of the sub-samples used in the chamber (accuracy of moisture content estimation), sub-samples used in the DMM600 were placed in individual envelopes, and biomass clipped from the quadrats was used to compare how well the sub-samples represented fuelbed moisture as it would normally be sampled via the oven-dry method (comparison of methods). Samples were stored out of the sun and weighed on a portable balance within 1 h of collection to get wet mass, then dried in a forced-air oven at 60 C for 48 h and weighed again. While a recent nominal standard temperature for oven-drying fuel is 105 C [30], errors associated with 60 C were minimal as the effect of the differences between the two temperatures is realized at low fuel moisture contents (e.g., <10%). Furthermore, 60 C as used here lies between higher temperatures (95–145 C) used to determine moisture content in forest fuels [30,31] and lower temperates (45–55 C) used in other rangeland fuel moisture measurements [32,33,34]. Water content is expressed on a dry-weight basis.

2.2. Data Analysis

2.2.1. Calculating Bulk Density of Compressed Samples

The DMM600 manual describes how users can convert VWC based on the bulk density of compressed samples (Note that this is the bulk density of fuel samples when compressed in the chamber and has no relationship to the bulk density of fuels in the fuelbed, a frequent parameter in fire behavior models.). Bulk density is a function of the volume the compressed sample occupies and the mass of the sample. The DMM600 manual describes how the compressed sample volume can be calculated as the difference between the total sample chamber volume and the portion of the sample chamber not occupied by the sample, which is pretty ingeniously determined by counting the number of rotations of the compression screw required to decompress the sample and entering this into an equation provided in the manual. Sample mass is determined from the oven-dry weight of the sample, which I measured anyway to determine actual moisture content.

2.2.2. Statistical Analysis

Prior to analysis I divided the calibration data into two datasets using the holdout method [35]: ⅔ of the data went to a training dataset, for empirical model fitting, and ⅓ was withheld as a validation dataset to test model performance. Because the three individual sampling points within each sampling area/location were randomly identified, I parsed the data by simply subsetting samples labeled “3” into the validation dataset. I found no statistical difference between the training and validation datasets ( χ 2 = 0.09, p = 0.76) using a linear mixed-effect regression model as described below.
The spatially-hierarchical and repeated-measures design of sampling meant that I used linear mixed-effect regression (LMER) models when testing for statistical significance. LMER  models were fit with the lmer function in the lme4 package [36] for the R statistical environment [37]. Tests  for statistical significance between LMER models employed the base anova function, while statistical tests for individual terms in LMER models was performed with the Anova function from the car package [38]. In each case the returned test statistic is a χ 2 value for deviance. To generate a calibration equation for converting DMM600 raw dielectic permittivity data to WC, I extracted regression coefficients using the fixef function in lme4. Goodness-of-fit statistics (R2) for LMER models were calculated as the marginal (fixed-effect) statistic using the r.squaredGLMM function in package MuMIn [39] for R.

3. Results and Discussion

3.1. Duff Moisture Meter Performance

3.1.1. Samples Used in the DMM600 Represent the Grassland Fuelbed

Before laboring over whether the values returned by the DMM600 are accurate and how they can be improved, it is important to ensure that the small samples required for DMM600 operation actually represent the broader fuelbed. To test this, DMM600 samples were compared to aggregated biomass samples obtained by clipping first herbaceous litter only, and then total aboveground herbaceous biomass, from quadrats as in the standard clip-weigh-dry-weigh method.
There was good fit between fuel moisture content of sub-samples used in the DMM600 and the total aboveground plant biomass of the clipped quadrat samples from which the sub-samples were drawn (R2 = 0.64, Figure 1), although when litter alone was compared, the DMM600 samples tended to underestimate fuel moisture content. These data underscore the importance of aggregating biomass samples prior to using the DMM600. There is a temptation to just reach down, grab a handful of fuel, and stuff it into the DMM600, but I strongly recommend users lay a random quadrat, clip and collect fine-fuels to bare mineral soil, and shake them up in a bag before taking a handful for the DMM600.
The two species were also statistically significantly different (p < 0.01), although the test statistic for the main effect was two orders of magnitude greater than for the species term ( χ 2 142 vs. 8.81, respectively). It is not clear from Figure 1 what might account for differences between species, except for perhaps greater underestimation of litter-only fuel moisture higher up on the gradient. Overall trends, especially for total biomass, support combining data for these species—which are structurally quite different, with B. inermis having much more stem tissue than P. pratensis—going forward. However the significance of the species term suggests using the DMM600 in grassland fuelbeds with considerably different composition might warrant preliminary data collection following the methods used here.

3.1.2. Dielectric Permittivity Correlates Well with Fine-Fuel Moisture Content

As its name suggests, the Duff Moisture Meter was designed for ground-layer forest fuels (duff), and previous field tests of the DMM600 focused on the duff layer [28,29]. thus, it remains an open question whether this device could be used to determine the moisture content of fine-fuels in grassland. Data from this study suggest that the technology in the DMM600—which is based on dielectric permittivity—does well to estimate fine-fuel moisture content in grasslands (Figure 2A). The LMER model testing the main effect and fuel type was the best fit (R2 = 0.86, χ 2 = 60.3, p < 0.001). Species added no explanatory value in LMER models ( χ 2 = 0.48, p = 0.49) and thus, species data were combined (Figure 2). Unsurprisingly the fuel type term was significant ( χ 2 = 36.4, p < 0.001) because the fuel types clustered to specific regions of the fuel moisture gradient (Figure 2A).
A caveat is that accurate fuel moisture estimation with dielectric permittivity does require some degree of moisture in the fuel. I found no fit between the DMM600’s freq reading and fuel moisture content for samples of highly-cured native warm-season grasses, which were consistently well below 20% and often under 10% (data not shown). But this has little bearing on the application of the DMM600; recall that the initial interest that prompted this inquiry pertained to the moisture content of live herbaceous fuels, which by definition and data have moisture content above 30%. Thus, the DMM600 can categorically identify cured fuels below 30% moisture (Table 1), but will not provide accurate fine dead fuel moisture readings when those fuels are fully cured.
Finally, it is unlikely that the DMM600 is useful for measuring fuel moisture content of coarse rangeland fuels, which will diminish its utility in the eyes of some potential adopters. For example, encroaching Juniperus species are often a target of prescribed fire in the US Great Plains, and evidence suggests substantial differences in mortality on either side of a fuel moisture threshold [40], so managers have a clear interest in knowing whether the moisture content of Juniperus needle-leaves are below the mortality threshold before they burn. But in the course of this study I also tested many samples of Juniperus needle-leaves from three locations in the DMM600 and determined actual moisture content as above. Despite a substantial gradient in actual WC, the DMM600 measured no variability in freq (data not shown). This is probably because the needle-leaves could not be sufficiently compressed to reduce airspace in the sample chamber such that electricity could be exposed to, and resisted by, moisture in the plant material. Perhaps a pre-processing step like chopping or grinding could increase the sample density of coarse rangeland fuels like Juniperus needle-leaves, but this remains to be tested.

3.2. DMM600 Equations for Grassland Fuels

The DMM600 reports two values for each sample: the raw dielectric permittivity frequency, freq, and a percent moisture from a standard calibration equation that returns volumetric moisture content, not the desired metric moisture content used in wildland fire applications. Given that the standard calibration fits grassland fuels so poorly (Figure A2A), users have two options: use the raw freq values or upload a custom calibration equation to convert the default %VWC to %WC. Based on the exotic cool-season grass data collected in this study, I present equations for each approach below.

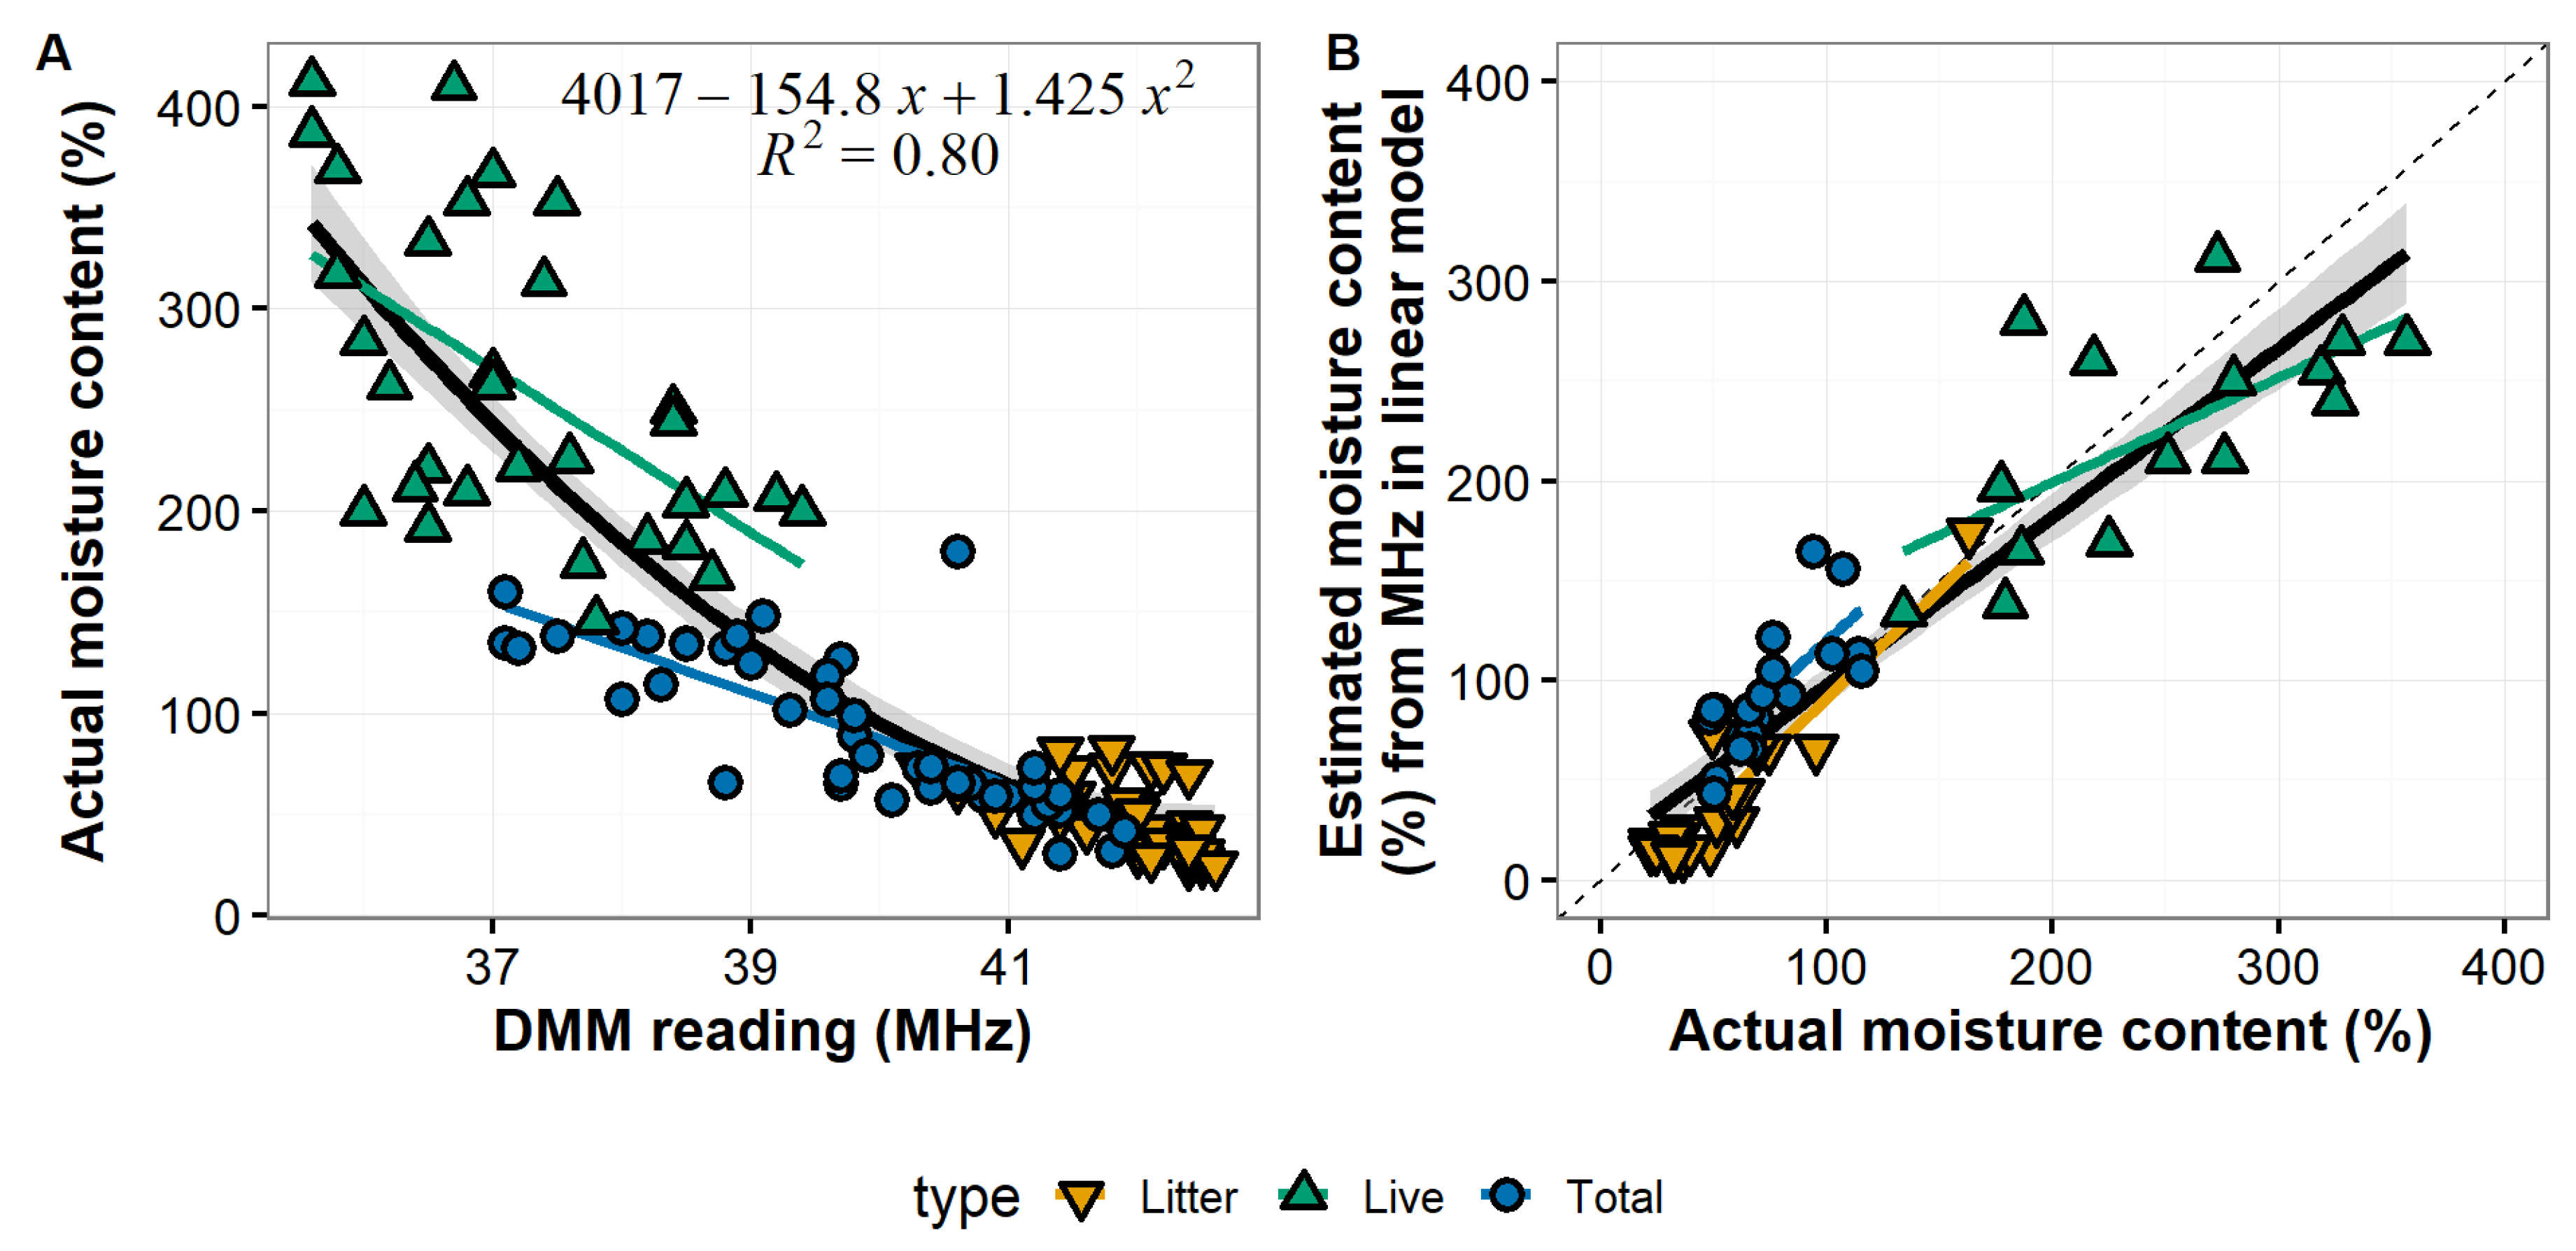
3.2.1. Using the Raw Dielectric Permittivity Values (freq)

Two equations support the application of the DMM600 in grassland fuels. First, I derived a second-order polynomial regression equation from the fit between the raw dielectric permittivity values (freq) given by the DMM600 and actual oven-dry moisture content of tested samples (Figure 2A):
F u e l m o i s t u r e = 4017 154.8 f r e q + 1.43 f r e q 2
The polynomial regression fit the training dataset well (R2 = 0.80). Users can input the raw freq from the unit into Equation (1) on a computer or smartphone to get real-time values, or fit the equation to freq on the computer later if data are being used for research or documentation purposes. Table 1 gives approximate freq cutoffs for various categories of fuel curing.
Equation (1) performed well when tested on the validation data (Figure 2B) held back from model fitting (Figure 2A). The linear relationship was significant and highly correlated (R2 = 0.87, χ 2 = 114, p < 0.001). Fuel type was a statistically-significant term ( χ 2 = 8, p = 0.02). Interestingly, model fit was better for these grass fuels than duff fuels in a previous test of the DMM600 [29].

3.2.2. Programming a Custom Calibration Equation

As described above, the DMM600 comes programmed with a standard calibration equation to convert the raw dielectric permittivity values, freq, to volumetric moisture content (VWC), which appears on the unit’s LCD screen as Std Cal:xx%. The factory calibration for the DMM600 is
V W C = 5.288 + 5.905 f r e q 0.142 f r e q 2
The DMM600 allows users to upload custom calibration equations so the the unit’s LCD reports WC instead of VWC. Converting VWC to WC requires information on the bulk density of the compressed sample. The coefficients in Equation (2) are divided by the bulk density, and users are ready to upload their custom equation to the DMM600 using PC software that ships with the unit.
I found bulk density to vary little among the exotic cool-season grass species and types of plant matter reported here (Figure A3) and thus, used a mean bulk density of 0.072 g/cm3 to derive a single calibration equation for the grassland fuels, but the equation produced by dividing coefficients in Equation (2) by 0.072 substantially overpredicted WC (Figure A2). Thus, I manually adjusted the bulk density parameter until the trendline for estimated WC tracked closely to the 1:1 relationship between estimated and actual WC. The result ( Figure 3) is based on a bulk density parameter of 0.11 g/cm3, which produces the following calibration equation suitable for programming the DMM600:
W C = 48.1 + 53.7 f r e q 1.29 f r e q 2
Equation (3) also performed well when tested on the validation dataset (Figure 3). In this case, the fuel type term was statistically significant ( χ 2 = 19.8, p < 0.001), and the linear relationship was significant and highly correlated (R2 = 0.89, χ 2 = 61.3, p < 0.001). The effect of fuel type on model fit is potentially confounding, because a single LMER model without the fuel type term had a significantly poorer fit to the data ( χ 2 = 9.3, p < 0.01) and had a lower goodness-of-fit (R2 = 0.85).

3.2.3. So Which Calibration Approach Should One Use?

The DMM600 manual describes how one can improve the % moisture content readout by creating a calibration equation for specific fuel types by dividing the coefficients in the standard calibration equation (Equation (2)) by the bulk density of samples. I derived a separate equation (Equation (1)) that converts the raw dielectic permittivity values given by the DMM600, freq, to WC. To my knowledge this latter approach is novel, which might have both a negative as well as positive value. An additional critique is that this approach is based on an empirical derivation and the capacity for extrapolation is unknown (although it did perform well against the validation dataset).
Besides being the recommended approach in the DMM600 manual, converting VWC to WC based on bulk density is more processed-based—the same correction approach is used widely in soil moisture sensor systems, many of which rely on the same dielectic permittivity technology. However, accuracy is still inherently limited to sample material with the same bulk density. Users especially interested in accurate bulk density-derived calibrations for each reading can simply record freq, count and record the number of rotations of the screw upon decompression, retain the sample, dry and weigh later, and plug freq and bulk density into Equation (2), although this obviously does not serve the primary purpose of providing instantaneous fuel moisture measurements.
Finally, three issues with the bulk density-derived calibration (Equation (3)) emerge from these data:
  • Plant material type—litter vs. standing material vs. both combined—was a significant term in the model fitting estimated WC to actual WC using the bulk density-corrected equation. This suggests that the relationship could be less generalizeable, although the overall linear relationship still had a good fit (R2 = 0.85). Users do not likely need to account for these differences, however…
  • There is a slight curvilinear pattern in the relationship between estimated WC and actual WC using the bulk density-corrected equation. It is quite apparent when the entire dataset is plotted (Figure A2B), and appears to be caused by a tendency for bulk density-derived WC estimations to slightly under-predict moisture content at low and high ends of the gradient. This curvilinear pattern is not apparent in WC estimations in the training dataset based on the empirically-derived equation (Equation (1)).
  • The under-prediction by Equation (3) at the low end of the moisture gradient actually produces a few negative WC values (Figure 3). This is likely fine for users who only need a categorical determination of fuel moisture content in cured and partially-cured fuels, but such illogical values obviously create an issue for anyone who needs precise estimations.

3.3. How to Collect Good Samples for the DMM600

I suggest the following protocols for sample collection to ensure good results from the DMM600:
  • Live fuel moisture—Simply cut enough live, green material to fill the sample chamber from as small of an area as possible, clipping tillers as low to the ground as possible.
  • Litter moisture—Place random quadrats in areas of representative fuels. Cut and discard all live plants and woody or forb stems. Standing dead grass can be included or analyzed separately depending on intent. Clip remaining biomass to within 2 cm of mineral soil and collect in a bag (anything will do, but one that more or less holds itself open and will withstand repeated use makes life easier). Aggregate well. Grab a handful for the DMM600 chamber. Depending on the amount of biomass in the bag, one can repeat for added precision in fuel moisture estimation. Bear in mind that the DMM600 won’t work well on fully-cured stands, but why measure moisture if the stand is obviously cured?
  • Overall stand fuel moisture—Place random quadrats in areas of representative fuels, cut and discard woody and forb stems, and clip and collect everything into the sample aggregation bag. Sub-sample handfuls for the DMM600. Again, don’t expect good results from the DMM600 on fully-cured fuels.

4. Conclusions

Based on this analysis, there is substantial evidence that Campbell Scientific’s Duff Moisture Meter (DMM600) accurately measures the moisture content of non-fully-cured grass fuels (Figure 2A), apparently even better than some duff-type fuels for which it was designed [29]. With attention to how the small samples used in the DMM600 are collected, DMM600 measurements also represent the grassland fuelbed well (Figure 1). Users have options in obtaining % moisture values as metric water content: either determine sample bulk density and upload a custom calibration equation as the manual suggests, or use an empirically-derived equation that converts raw output (freq) to WC. The  differences likely depend on how precise of data users desire, and how much work the user wishes to put into determining their calibration. Determining bulk density does require users to complete a number of steps after using the device, including retaining, drying, and weighing samples after using the DMM600 to determine sample dry mass, part of the bulk density calculation. Empirically deriving an equation requires the same steps but with (1) a greater number of samples along the full moisture gradient, and (2) closer attention to moisture loss from samples and an additional weighing step prior to drying (to determine sample moisture content, as well as dry mass).
In the data presented here, the empirically-derived equation seemed to offer better alignment between estimated and observed moisture content along the full moisture gradient. This might be the preferred route for researchers who desire precise values, whereas users incorporating real-time fuel moisture data into fire management decisions might be content with broad estimations of fuel curedness and would likely prefer the more direct readout provided by a unit loaded with a custom equation. In either case the DMM600 appears capable of providing useful, instantaneous fuel moisture estimations in partially-cured and live herbaceous grassland fuels, although the more familiar users are with the unit’s performance in their specific plant communities the more confidence they can have in the accuracy of their values.

Funding

This work was supported by National Institute of Food and Agriculture Hatch Project 1009910 and the North Dakota State Agricultural Experiment Station.

Conflicts of Interest

The author declares no conflict of interest. The author has no affiliation with Campbell Scientific, Inc. and purchased the equipment reported on herein himself at the full quoted price.

Abbreviations

DMM600Campbell Scientific’s Duff Moisture Meter
LCDLiquid Crystal Display
LMERLinear Mixed-Effect Regression model, fit in R with lme4::lmer
freqShorthand for raw dielectic permittivity values given by the DMM600 as frequency (MHz)
VWCVolumetric Water Content
WCmetric Water Content
TDR/FDRTime Domain Reflectometry/Frequency Domain Reflectometry

Appendix A. Additional Data and Figures

Appendix A.1. Data Distribution for Fuel Curing Categories

Figure A1. Distributions of the data underlying the categories reported in Table 1. The categories are denoted as vertical lines above. As freq (MHz) has an inverse relationship with moisture content, higher-moisture samples occur on the left of the graph (darker green). The lines denote the point where 95% of freq values within a category occur to the left of the line, and thus, sample moisture content is at most the denoted value to the right of each line. although there is some error associated with the 95% cut-off.
Fire 02 00012 g0a1

Appendix A.2. Performance of “Standard” DMM600 Calibration Equation Options

The DMM600 has two “default” options for reporting moisture content on a percentage basis. First, there is a standard equation loaded by default (Equation (2)), but it returns moisture content on a volumetric basis, while wildland fire professionals deal with moisture content on a metric basis (Figure A2A). Campbell Scientific includes software with the DMM600 so that users can upload a custom calibration equation and have the unit report a metric % moisture content. The recommended approach is to divide the coefficients in Equation (2) by sample bulk density, but even this equation performs poorly (Figure A2B). I made manual adjustments for these fuels; see Equation (3).
Figure A2. (A) Standard calibration of the DMM600, which returns volumetric water content, against actual, oven-dried metric water content of sampled grassland fuels. (B) Campbell Scientific’s recommended procedure for ensuring the DMM600 reports WC instead of the default VWC is to divide the coefficients in Equation (2) by sample bulk density (0.072 g/cm3, Figure A3) substantially overpredicts grassland fuel moisture content. Adjustments are made in Equation (3) and Figure 3.
Fire 02 00012 g0a2

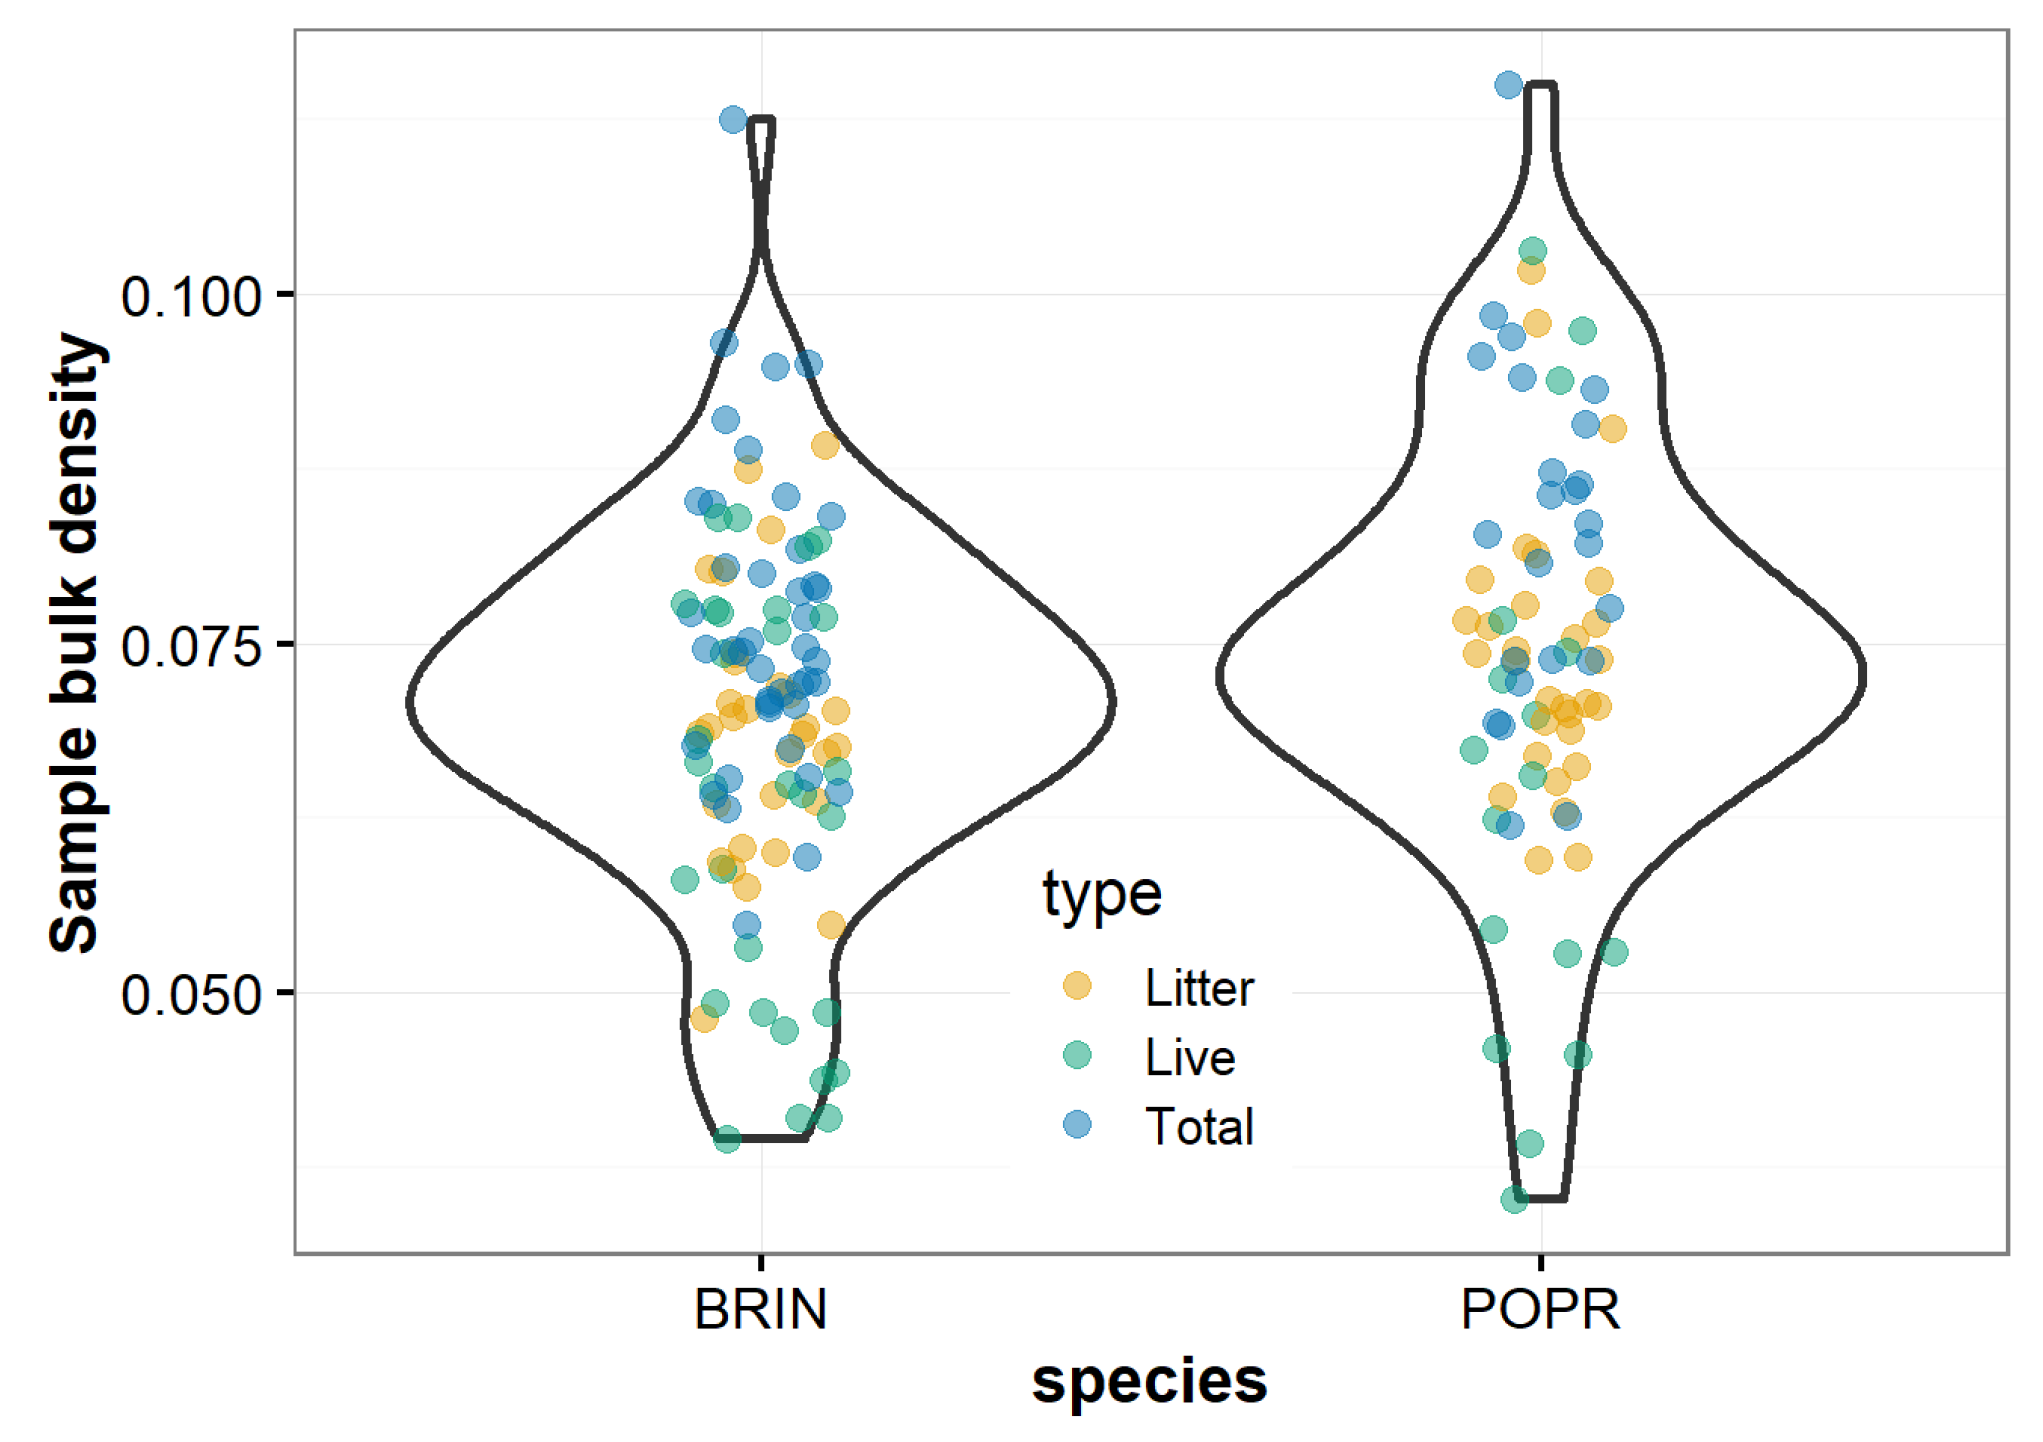
Appendix A.3. Bulk Density of Compressed Samples

Figure A3. Regardless of species and plant matter type, bulk density was similar across grassland fuel samples and had a mean value of 0.072 g/cm3. BRIN = Bromus inermis, POPR = Poa pratensis.
Fire 02 00012 g0a3

References

  1. Parisien, M.A.; Moritz, M.A. Environmental Controls on the Distribution of Wildfire at Multiple Spatial Scales. Ecol. Monogr. 2009, 79, 127–154. [Google Scholar] [CrossRef]
  2. Rossa, C.G. A Generic Fuel Moisture Content Attenuation Factor for Fire Spread Rate Empirical Models. For. Syst. 2018, 27, e009. [Google Scholar] [CrossRef]
  3. Sullivan, A.L. Inside the Inferno: Fundamental Processes of Wildland Fire Behaviour: Part 2: Heat Transfer and Interactions. Curr. For. Rep. 2017, 3, 150–171. [Google Scholar] [CrossRef]
  4. Kreye, J.K.; Kobziar, L.N.; Zipperer, W.C. Effects of Fuel Load and Moisture Content on Fire Behaviour and Heating in Masticated Litter-Dominated Fuels. Int. J. Wildland Fire 2013, 22, 440. [Google Scholar] [CrossRef]
  5. Finney, M.A.; Cohen, J.D.; McAllister, S.S.; Jolly, W.M. On the Need for a Theory of Wildland Fire Spread. Int. J. Wildland Fire 2013, 22, 25–36. [Google Scholar] [CrossRef]
  6. Scott, J.H.; Burgan, R.E. Standard Fire Behavior Fuel Models: A Comprehensive Set for Use with Rothermel’s Surface Fire Spread Model; Technical Report General Technical Report RMRS-GTR-153; United States Department of Agriculture, Forest Service: Fort Collins, CO, USA, 2005; p. 66.
  7. Kidnie, S.; Cruz, M.G.; Gould, J.; Nichols, D.; Anderson, W.; Bessell, R. Effects of Curing on Grassfires: I. Fuel Dynamics in a Senescing Grassland. Int. J. Wildland Fire 2015, 24, 828–837. [Google Scholar] [CrossRef]
  8. Catchpole, E.A.; Catchpole, W.R.; Viney, N.R.; McCaw, W.L.; Marsden-Smedley, J.B. Estimating Fuel Response Time and Predicting Fuel Moisture Content from Field Data. Int. J. Wildland Fire 2001, 10, 215–222. [Google Scholar] [CrossRef]
  9. Fosberg, M.A. Theory of Precipitation Effects on Dead Cylindrical Fuels. For. Sci. 1972, 18, 98–108. [Google Scholar]
  10. Matthews, S. Dead Fuel Moisture Research: 1991–2012. Int. J. Wildland Fire 2014, 23, 78. [Google Scholar] [CrossRef]
  11. Marsden-Smedley, J.B.; Catchpole, W.R. Fire Modelling in Tasmanian Buttongrass Moorlands. III* Dead Fuel Moisture. Int. J. Wildland Fire 2001, 10, 241–253. [Google Scholar] [CrossRef]
  12. Jolly, W.M.; Hadlow, A.M.; Huguet, K. De-Coupling Seasonal Changes in Water Content and Dry Matter to Predict Live Conifer Foliar Moisture Content. Int. J. Wildland Fire 2014, 23, 480. [Google Scholar] [CrossRef]
  13. Qi, Y.; Dennison, P.E.; Spencer, J.; Riaño, D. Monitoring Live Fuel Moisture Using Soil Moisture and Remote Sensing Proxies. Fire Ecol. 2012, 8, 71–87. [Google Scholar] [CrossRef]
  14. Sow, M.; Mbow, C.; Hély, C.; Fensholt, R.; Sambou, B. Estimation of Herbaceous Fuel Moisture Content Using Vegetation Indices and Land Surface Temperature from MODIS Data. Remote Sens. 2013, 5, 2617–2638. [Google Scholar] [CrossRef] [Green Version]
  15. Krueger, E.S.; Ochsner, T.E.; Engle, D.M.; Carlson, J.; Twidwell, D.; Fuhlendorf, S.D. Soil Moisture Affects Growing-Season Wildfire Size in the Southern Great Plains. Soil Sci. Soc. Am. J. 2015, 79, 1567–1576. [Google Scholar] [CrossRef]
  16. Rossa, C.; Fernandes, P. Live Fuel Moisture Content: The ‘Pea Under the Mattress’ of Fire Spread Rate Modeling? Fire 2018, 1, 43. [Google Scholar] [CrossRef]
  17. Rossa, C.; Fernandes, P. An Empirical Model for the Effect of Wind on Fire Spread Rate. Fire 2018, 1, 31. [Google Scholar] [CrossRef]
  18. Engle, D.M.; Bidwell, T.G. The Response of Central North American Prairies to Seasonal Fire. J. Range Manag. 2001, 54, 2–10. [Google Scholar] [CrossRef]
  19. McGranahan, D.A.; Engle, D.M.; Fuhlendorf, S.D.; Miller, J.R.; Debinski, D.M. An Invasive Cool-Season Grass Complicates Prescribed Fire Management in a Native Warm-Season Grassland. Nat. Areas J. 2012, 32, 208–214. [Google Scholar] [Green Version]
  20. DeKeyser, E.S.; Meehan, M.; Clambey, G.; Krabbenhoft, K. Cool Season Invasive Grasses in Northern Great Plains Natural Areas. Nat. Areas J. 2013, 33, 81–90. [Google Scholar] [CrossRef]
  21. McGranahan, D.A.; Engle, D.M.; Miller, J.R.; Debinski, D.M. An Invasive Grass Increases Live Fuel Proportion and Reduces Fire Spread in a Simulated Grassland. Ecosystems 2013, 16, 158–169. [Google Scholar] [CrossRef]
  22. McGranahan, D.A.; Archibald, S.; Kirkman, K.P.; O’Connor, T.G. A Native C3 grass alters fuels and fire spread in montane grassland of South Africa. Plant Ecol. 2018, 219, 621–632. [Google Scholar] [CrossRef]
  23. Nyström, J.; Dahlquist, E. Methods for Determination of Moisture Content in Woodchips for Power Plants—A Review. Fuel 2004, 83, 773–779. [Google Scholar] [CrossRef]
  24. Anwar, S.I. Determination of Mositure Content of Bagasse of Jaggery Unit Using Microwave Oven. J. Eng. Sci. Technol. 2010, 5, 472–478. [Google Scholar]
  25. Nelson, S.; Soderholm, L.; Yung, F. Determining the Dielectric Properties of Grain. Agric. Eng. 1953, 34, 608–610. [Google Scholar]
  26. Nelson, S.O. Dielectric Properties of Agricultural Products-Measurements and Applications. IEEE Trans. Electr. Insul. 1991, 26, 845–869. [Google Scholar] [CrossRef]
  27. Nelson, S.; Kraszewski, A.; Trabelsi, S.; Lawrence, K. Using Cereal Grain Permittivity for Sensing Moisture Content. IEEE Trans. Instrum. Meas. 2000, 49, 470–475. [Google Scholar] [CrossRef]
  28. Robichaud, P.R.; Gasvoda, D.S.; Hungerford, R.D.; Bilskie, J.; Ashmun, L.E.; Reardon, J. Measuring Duff Moisture Content in the Field Using a Portable Meter Sensitive to Dielectric Permittivity. Int. J. Wildland Fire 2004, 13, 343–353. [Google Scholar] [CrossRef]
  29. Engber, E.A.; Varner, J.M.; Dugaw, C.J.; Quinn-Davidson, L.N.; Hiers, J.K. Utility of an Instantaneous Moisture Meter for Duff Moisture Prediction in Long-Unburned Longleaf Pine Forests. South. J. Appl. For. 2013, 37, 13–17. [Google Scholar] [CrossRef]
  30. Matthews, S. Effect of Drying Temperature on Fuel Moisture Content Measurements. Int. J. Wildland Fire 2010, 19, 800–802. [Google Scholar] [CrossRef]
  31. Jolly, W.M.; Hadlow, A.M. A Comparison of Two Methods for Estimating Conifer Live Foliar Moisture Content. Int. J. Wildland Fire 2012, 21, 180–185. [Google Scholar] [CrossRef]
  32. Gillen, R.L.; Tate, K.W. The Constituent Differential Method for Determining Live and Dead Herbage. J. Range Manag. 1993, 46, 142–147. [Google Scholar] [CrossRef]
  33. Vermeire, L.T.; Ganguli, A.C.; Gillen, R.L. A Robust Model for Estimating Standing Crop across Vegetation Types. J. Range Manag. 2002, 55, 494–497. [Google Scholar] [CrossRef]
  34. Starns, H.D.; Fuhlendorf, S.D.; Elmore, R.D.; Twidwell, D.; Thacker, E.T.; Hovick, T.J.; Luttbeg, B. Recoupling Fire and Grazing Reduces Wildland Fuel Loads on Rangelands. Ecosphere 2019, 10, e02578. [Google Scholar] [CrossRef]
  35. Kohavi, R. A Study of Cross-Validation and Bootstrap for Accuracy Estimation and Model Selection. In Proceedings of the International Joint Conference on Artificial Intelligence, Montreal, QC, Canada, 20–25 August 1995; Volume 14, pp. 1137–1145. [Google Scholar]
  36. Bates, D.; Mächler, M.; Bolker, B.; Walker, S. Fitting Linear Mixed-Effects Models Using Lme4. J. Stat. Softw. 2015, 67, 1–48. [Google Scholar] [CrossRef]
  37. R Core Team. R: A Language and Environment for Statistical Computing; R Foundation for Statistical Computing: Vienna, Austria, 2017. [Google Scholar]
  38. Fox, J.; Weisberg, S. An R Companion to Applied Regression, 2nd ed.; Sage: Thousand Oaks, CA, USA, 2011. [Google Scholar]
  39. Barton, K. MuMIn: Multi-Model Inference, R package version 1.42.1; R Package: Boston, MA, USA, 2018. [Google Scholar]
  40. Twidwell, D.; Fuhlendorf, S.D.; Taylor, C.A.; Rogers, W.E. Refining Thresholds in Coupled Fire-Vegetation Models to Improve Management of Encroaching Woody Plants in Grasslands. J. Appl. Ecol. 2013, 50, 603–613. [Google Scholar] [CrossRef]
Figure 1. Actual (oven-dried) moisture content of grass fuel samples collected for the Campbell Scientific Duff Moisture Meter (DMM600) plotted against actual moisture content of clipped quadrats meant to represent fine-fuels, generally, for two exotic cool-season grasses in the Northern Great Plains. Overall model R2 = 0.70, χ 2 = 142, p < 0.001. Both factor terms were statistically different: fuel type ( χ 2 = 38, p < 0.001) and species ( χ 2 = 8.8, p < 0.01). Dotted lines plot the 1:1 relationship at which variables would be perfectly correlated. Data are divided into total fuelbed and litter alone.
Fire 02 00012 g001
Figure 2. Fits for the training (A) and validation (B) datasets, in which points are plotted as three fuel types with linear regression lines for each. B. inermis and P. pratensis are combined. (A) Actual (oven-dried) moisture content of grass fuel samples tested in the Campbell Scientific Duff Moisture Meter (DMM600) plotted against permittivity values, the raw data generated by the DMM600. A second-order polynomial line, in black, is fit to the entire training dataset, for which the regression equation is given in the upper right corner. Overall statistical significance was tested via LMER. The main trend between WC and freq was significant and highly correlated (R2 = 0.86, χ 2 = 60.3, p < 0.001). LMER model with fuel type term was significantly different ( χ 2 = 36.4, p < 0.001) but species term was not ( χ 2 = 0.48, p = 0.49). (B) Estimated moisture content in a holdout validation dataset as a percentage of dry weight derived by fitting DMM600 permittivity values into the polynomial regression equation from (A), plotted against actual (oven-dried) moisture content of DMM600 samples (R2 = 0.87, χ 2 = 114, p < 0.001). The dotted line shows the 1:1 relationship at which variables would be perfectly correlated.
Fire 02 00012 g002
Figure 3. An adjusted bulk density parameter (0.11 g/cm3) improved fit between estimated and actual WC; coefficients in Equation (3) reflect this adjustment. The original calibration equation in which Equation (2) coefficients were divided by mean bulk density (0.072 g/cm3) substantially overpredicted WC (Figure A2). Dotted line shows the 1:1 relationship at which variables would be perfectly correlated.
Fire 02 00012 g003
Table 1. Live fuel moisture categories and the 95% quantile of freq values (MHz) for each category. These categories and the descriptions of vegetation stages are modified from Table 6 in the National Wildfire Coordinating Group’s Fireline Handbook Appendix B (https://www.nwcg.gov/publications/410-2), which supports fire behavior estimation in the field. Note the very slight difference in freq between fully-cured and partially cured fuels, which highlights the lack of sensitivity of the DMM600 to low-moisture fuels. Note that values in the freq column are to some degree probabilistic, as they represent the point at which 95% of freq values are equal or greater. Figure A1 shows the distribution of these categories.
Moisture Content (%)DMM600 Reading (MHz)Vegetative Development Stage
30038.6Fresh foliage. Early in the growing cycle.
20039.8Maturing foliage. Still developing, full turgor.
10042.1Mature foliage. New growth
complete & similar to old growth.
6042.5Partially cured. Entering dormancy.
3042.6Fully cured. Treat as fine dead fuel.

