Article

Changes in Lightning Fire Incidence in the Tasmanian Wilderness World Heritage Area, 1980–2016

Discipline of Geography and Spatial Sciences, School of Technology, Environments and Design, University of Tasmania, Hobart, TAS 7001, Australia
*
Author to whom correspondence should be addressed.
Submission received: 26 September 2018 / Revised: 15 October 2018 / Accepted: 17 October 2018 / Published: 19 October 2018

Abstract

:
The Tasmanian Wilderness World Heritage Area (TWWHA) has globally significant natural and cultural values, some of which are dependent on the absence of fire or the presence of particular fire regimes. Planned burning is currently used to reduce the risk of loss of world heritage values from unplanned fires, but large and damaging fires still occur, with lightning as the primary ignition source. Lightning-caused fire was rare in the TWWHA before 2000. There has since been an increase in both the number of fires following lightning storms and the area burnt by these fires. In the absence of a direct measurement of lightning strike incidence, we tested whether changes in rainfall, soil dryness and fuel load were responsible for these changes in fire incidence and extent. There were no relationships between these variables and the incidence of fires associated with lightning, but the variability in the Soil Dryness Index and the mean of 25% of driest values did predict both the number and area of fires. Thus, it appears that an increase in the proportion of lightning strikes that occur in dry conditions has increased ignition efficiency. These changes have important implications for the management of the TWWHA’s values, as higher projected fuel loads and drier climates could result in a further increase in the number of fires associated with lightning.

1. Introduction

The Tasmanian Wilderness World Heritage Area (TWWHA) has been listed by the World Heritage Committee for its globally significant natural and cultural values [1]. The TWWHA encompasses areas of great natural beauty, has globally significant Aboriginal cultural heritage and conserves globally significant geodiversity and biodiversity [2]. The globally significant palaeoendemic plants of the TWWHA are concentrated in places where fire has been rare or absent [3]. However, fire-intolerant plant communities sit within a matrix of globally significant moorland vegetation, which is dependent on frequent fire to maintain species richness and structural diversity [4]. Frequent low-intensity prehistoric anthropogenic fire in moorlands both maintained pyrophilic moorlands and protected pyrophobic vegetation. Prehistoric fires in pyrophobic rainforests, subalpine and alpine areas were likely to have been the result of natural ignition and/or escapes [5,6,7].
Following the forced removal of Aboriginal people from the region, the fire regime changed to periods of a few small fires followed by a very extensive fire. The available evidence indicates that three such cycles have occurred since the 1830s with extensive fires occurring in 1850/51, 1897/98 and 1933/34. These very extensive fires were the direct result of efforts by government employees and private individuals to open up the country to make access easier, expose mineral deposits and make areas more suitable for farming [6]. Since the 1930s, while there have been some medium-sized fires, including the ecologically devastating 1960/61 Central Plateau fire and the large but ecologically benign 2012/13 Giblin River fire, there have been no extensive fires in the TWWHA [5,6,8,9].
Changing climatic conditions are impacting on fire regimes and risk in many parts of the world [10,11,12,13]. Since the 1990s, there has been a surge in the incidence of large, uncontrolled fires around the world, with fire-fighting capacity and tactics inadequate to cope [14]. Although planned burns and the prevention of unplanned ignition by humans has so far managed to prevent extensive fires in the TWWHA, there is nevertheless a high risk of such fires.
The probability of catastrophic fires could increase as a result of an increase in ignitions from lightning. Lightning fires can be difficult to suppress as they are more likely to occur in remote areas than human-caused fires [15]. In sparsely populated areas, such as western Tasmania, lightning-caused fire ignitions may remain undetected for some time, until changes in weather conditions cause the fire to spread. Due to the time it takes to access remote areas, the fire may also grow to a size where fire suppression is difficult or impractical [15]. In addition, a lightning storm may result in multiple ignitions, overwhelming the capacity of fire management agencies to suppress these fires [16].
Bowman and Jackson [17] estimated that lightning fires were responsible for about 0.1% of fires and about 0.01% of the area that was burnt in the 1970s, an estimate strongly supported by later work [5,6]. Since the late twentieth century, there has been a notable increase in the number of fires associated with lightning within the TWWHA [18]. It has not been established whether the increase in fires that have followed lightning strikes is a result of increased lightning incidence, increased dry lightning, drier conditions when lightning strikes occur or an increased fuel load.
In the present paper, we provide data on recent changes in fire incidence and extent related to lightning, test whether these changes are related to the climate or fuel and discuss implications of these data and climate change projections for fire management. The area studied by this paper is the TWWHA along with the areas on its immediate western boundary which are managed for conservation. This region has an area of 1.79 million hectares, of which 1.58 million hectares is within the TWWHA (Figure 1).

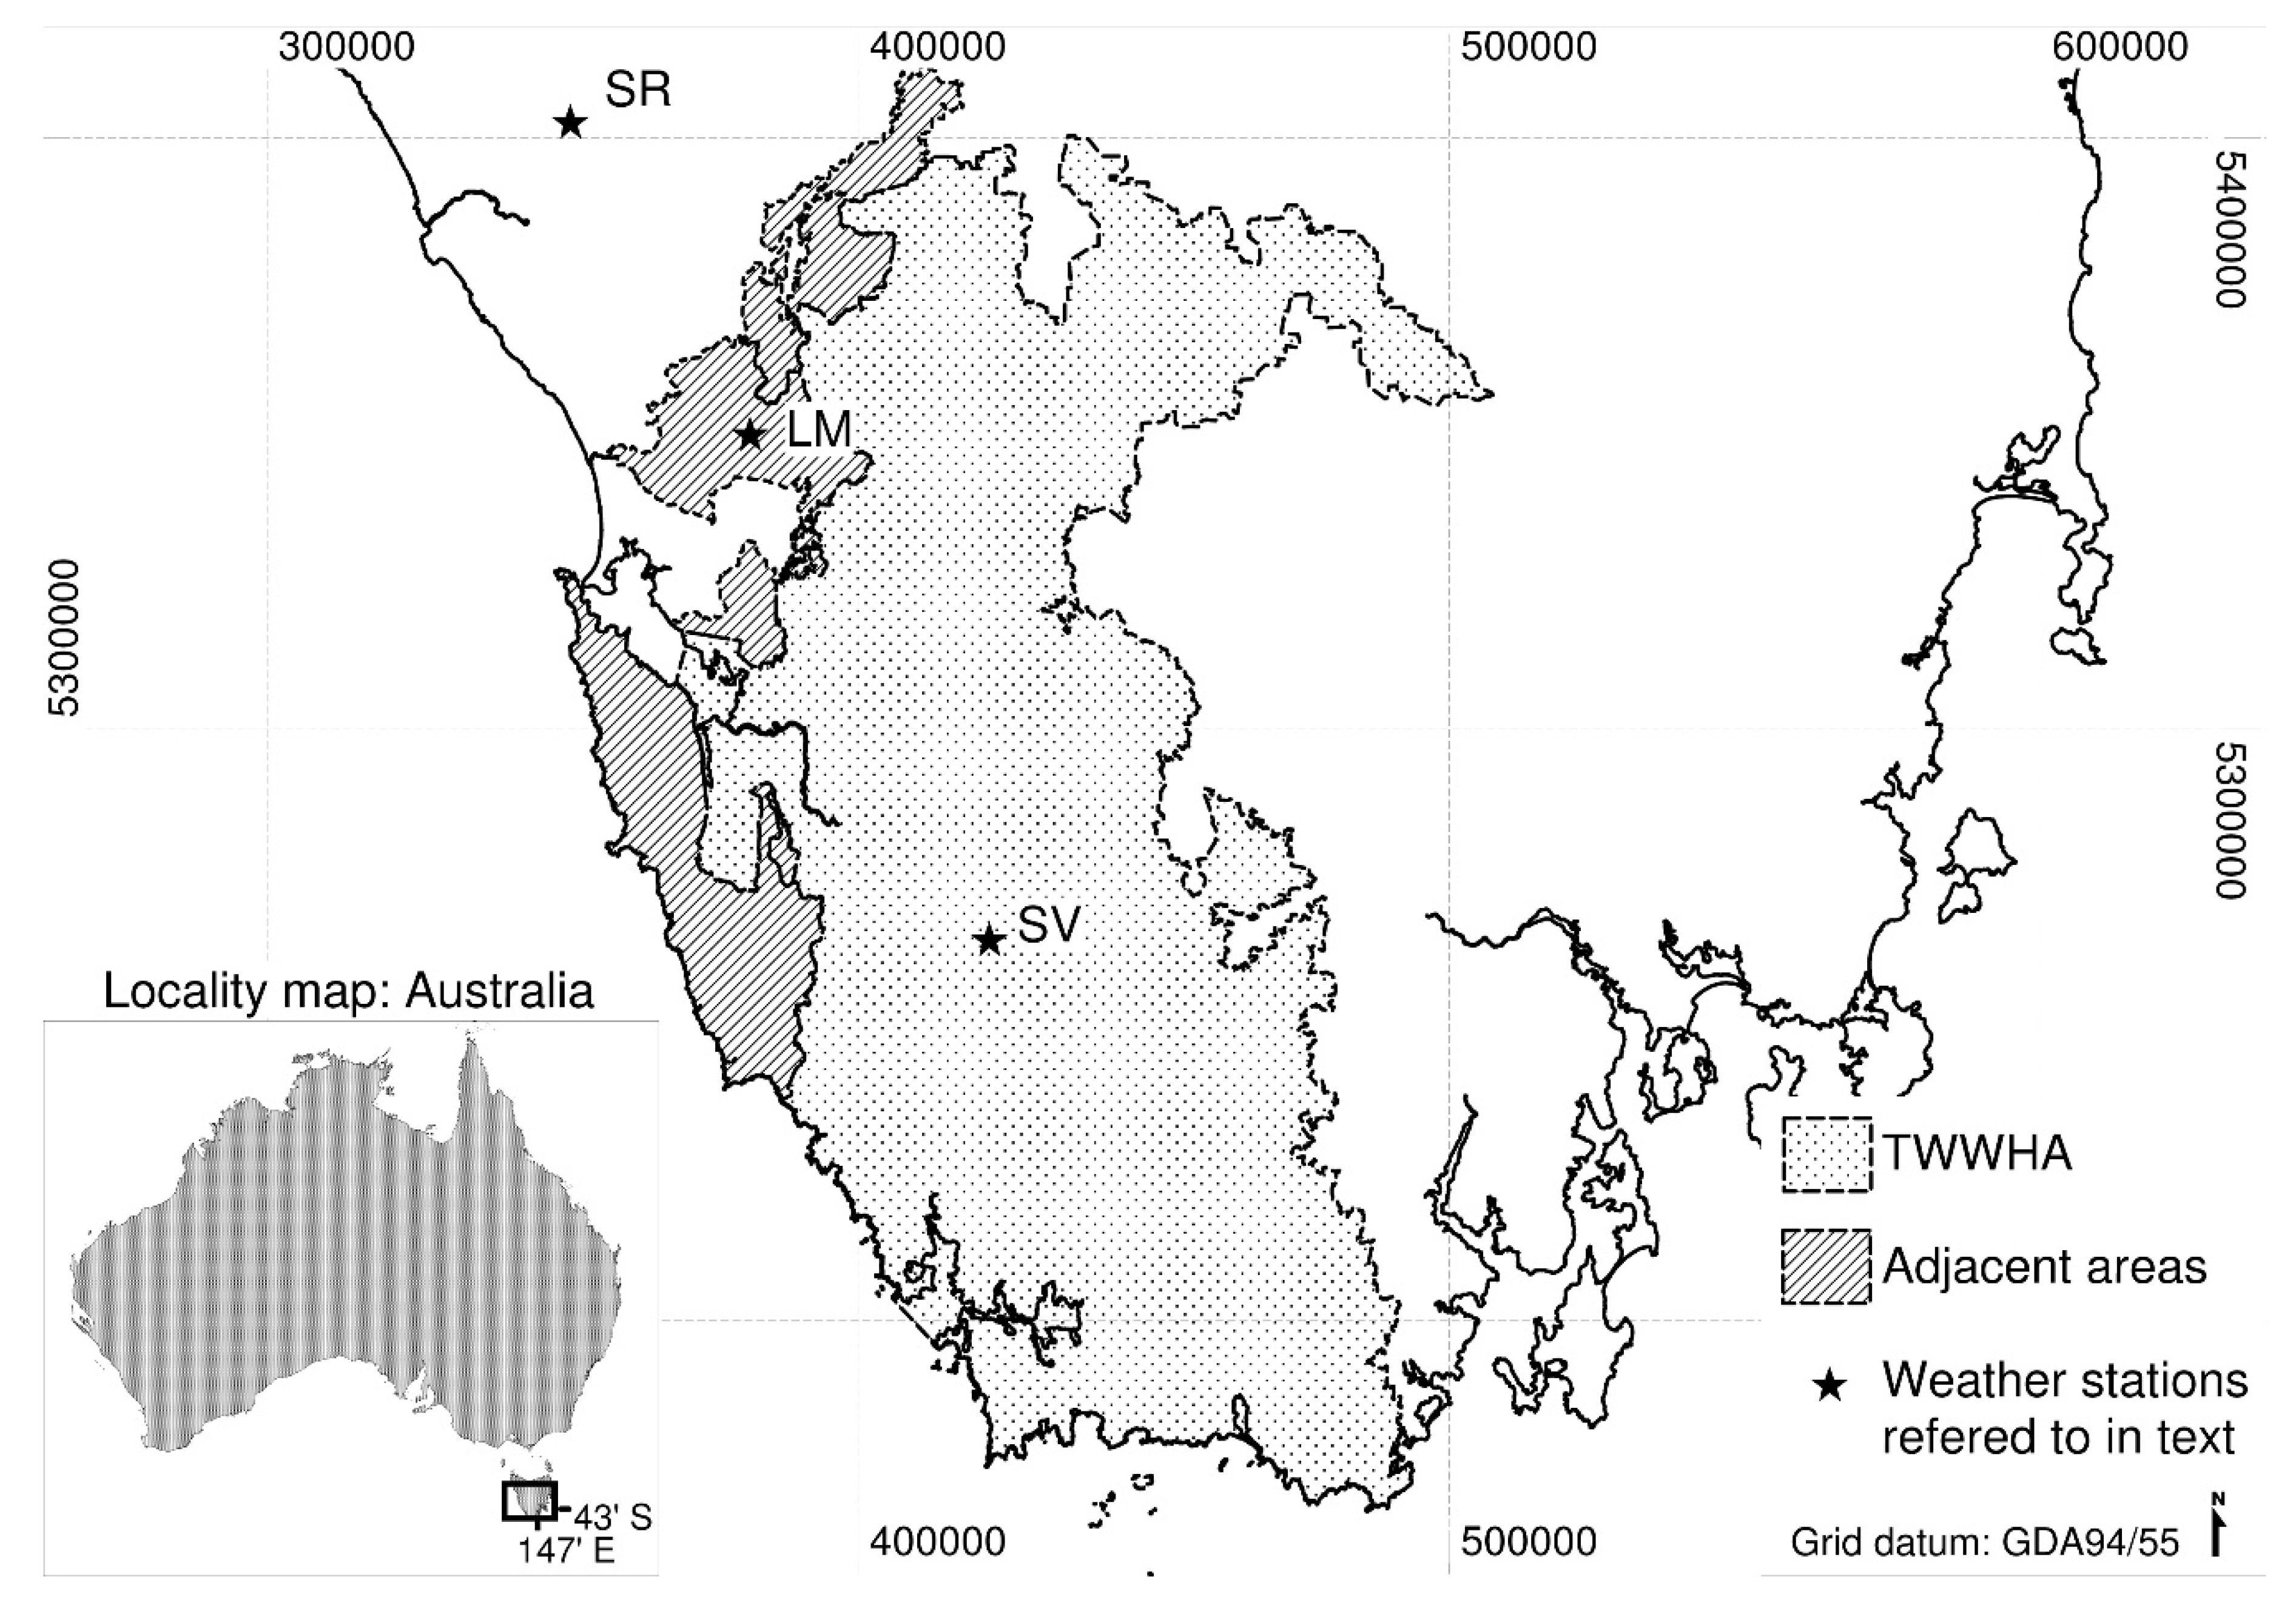
2. Materials and Methods
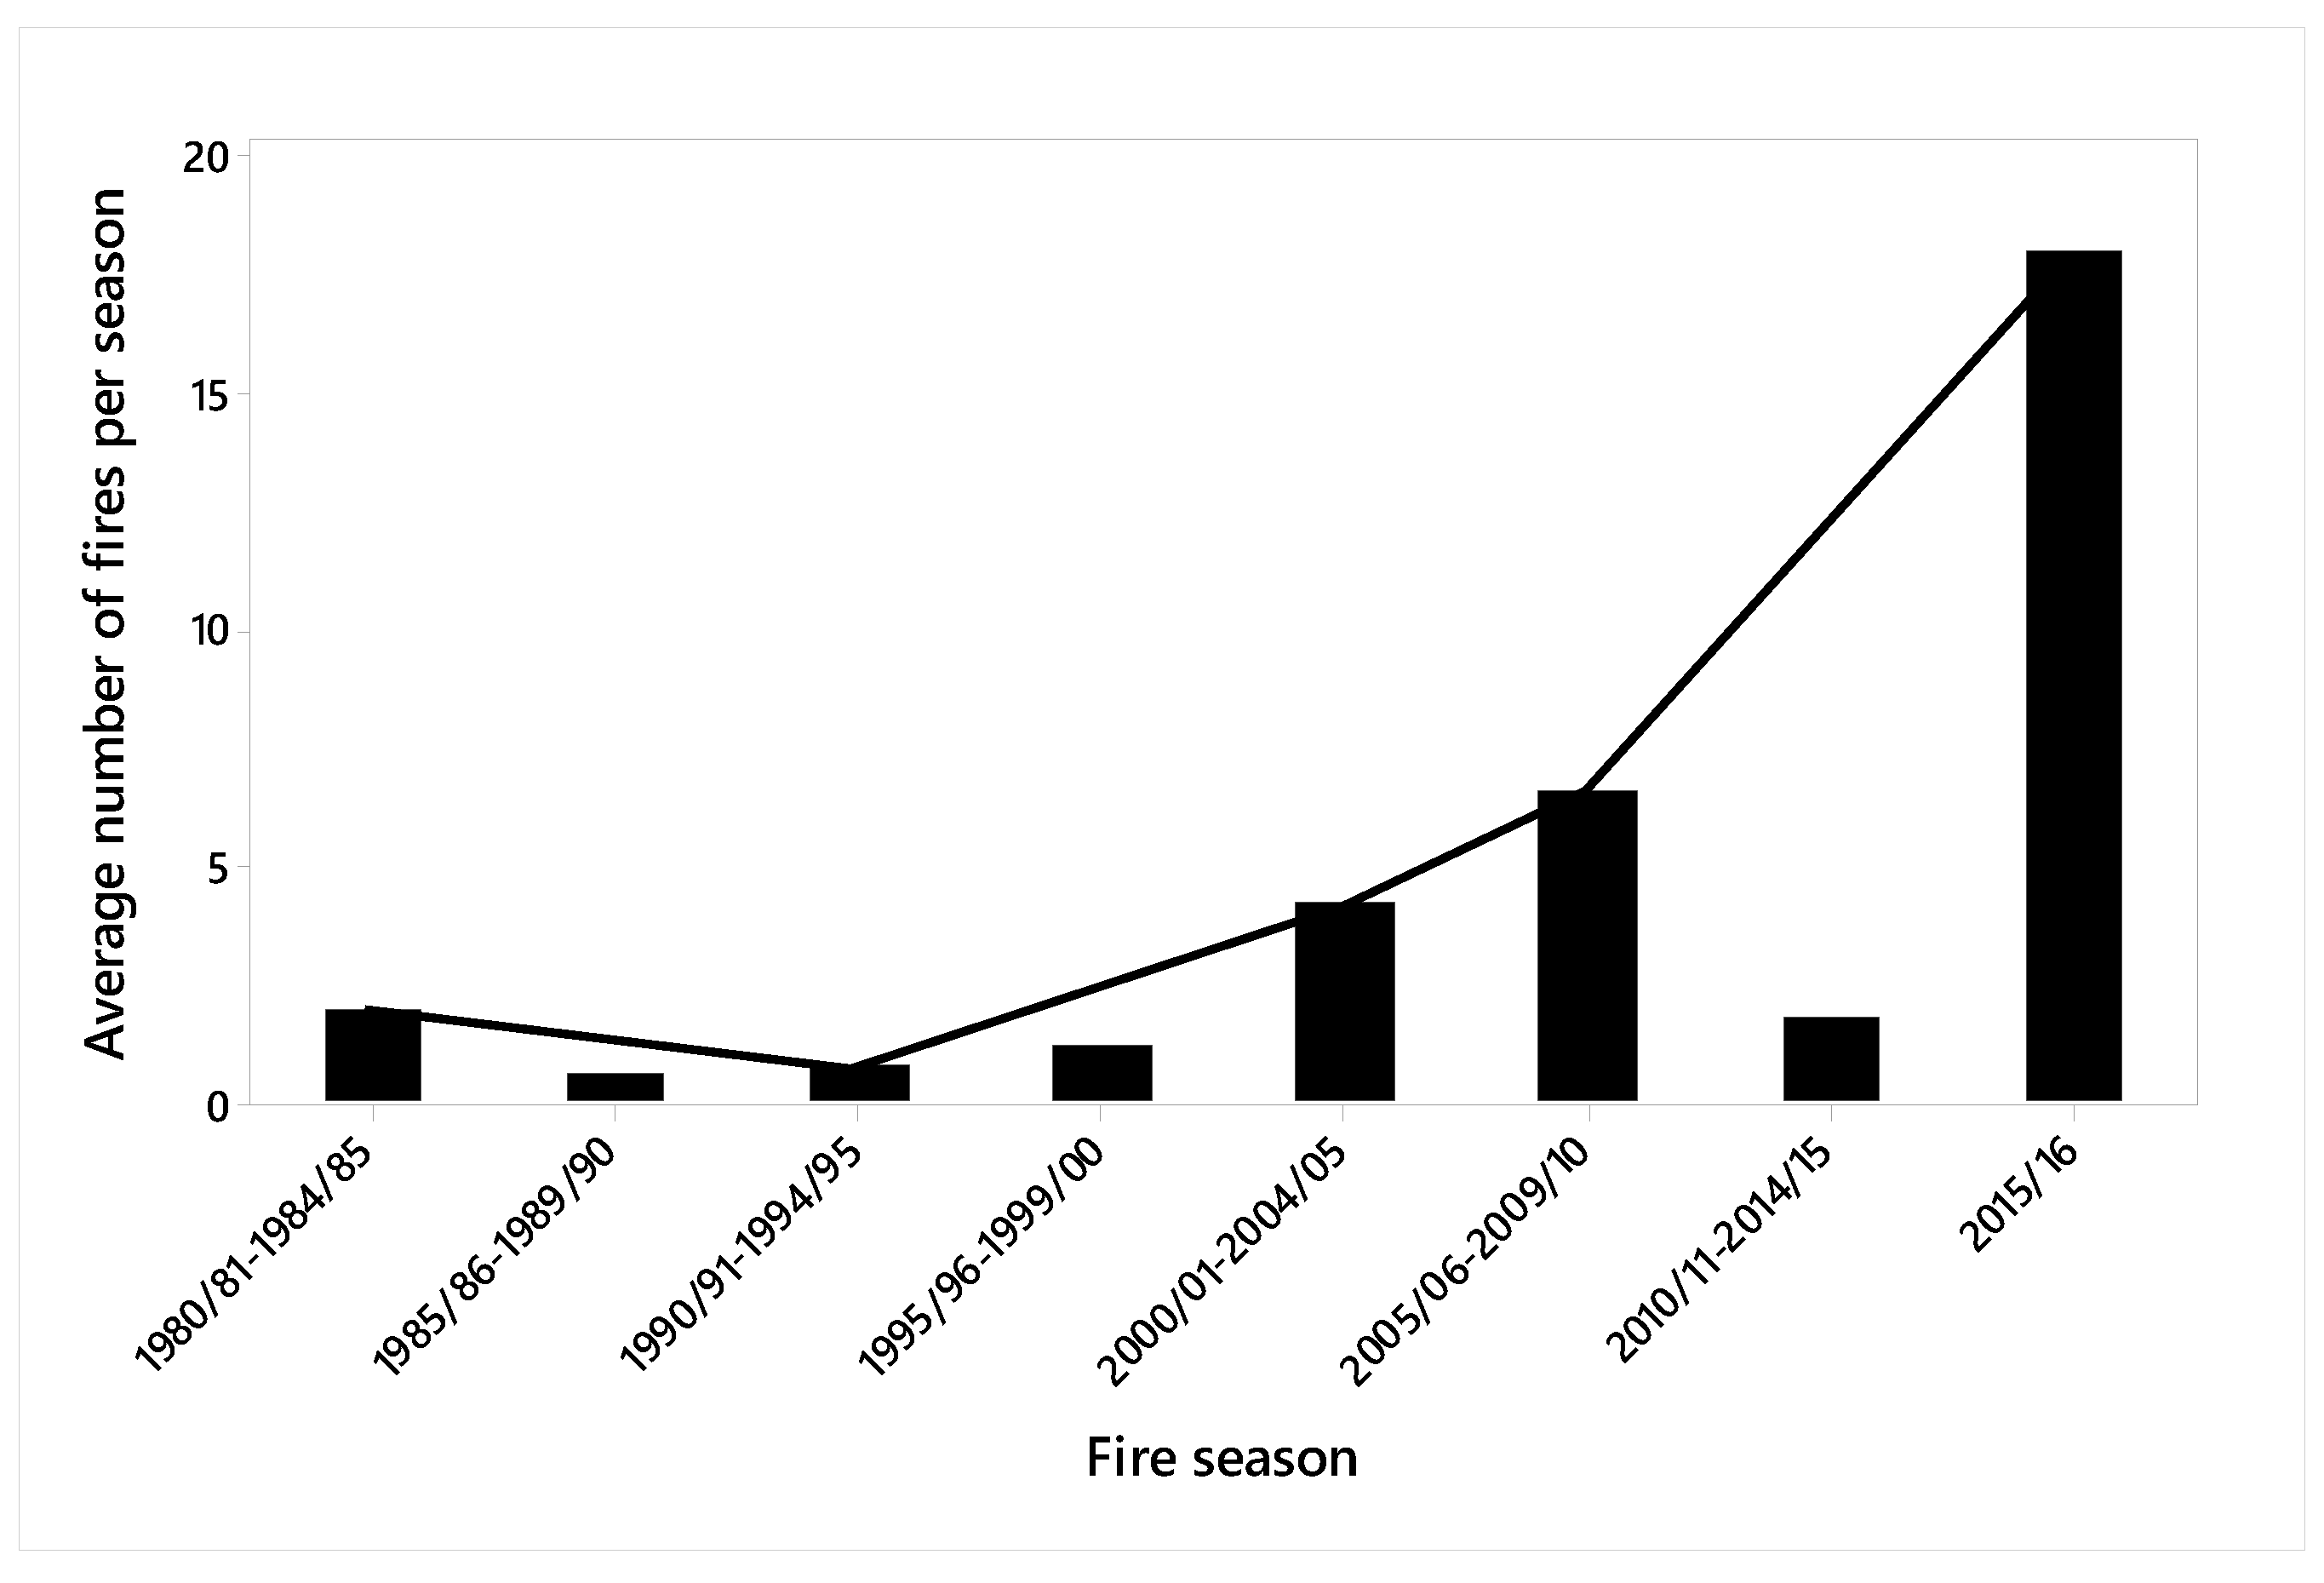
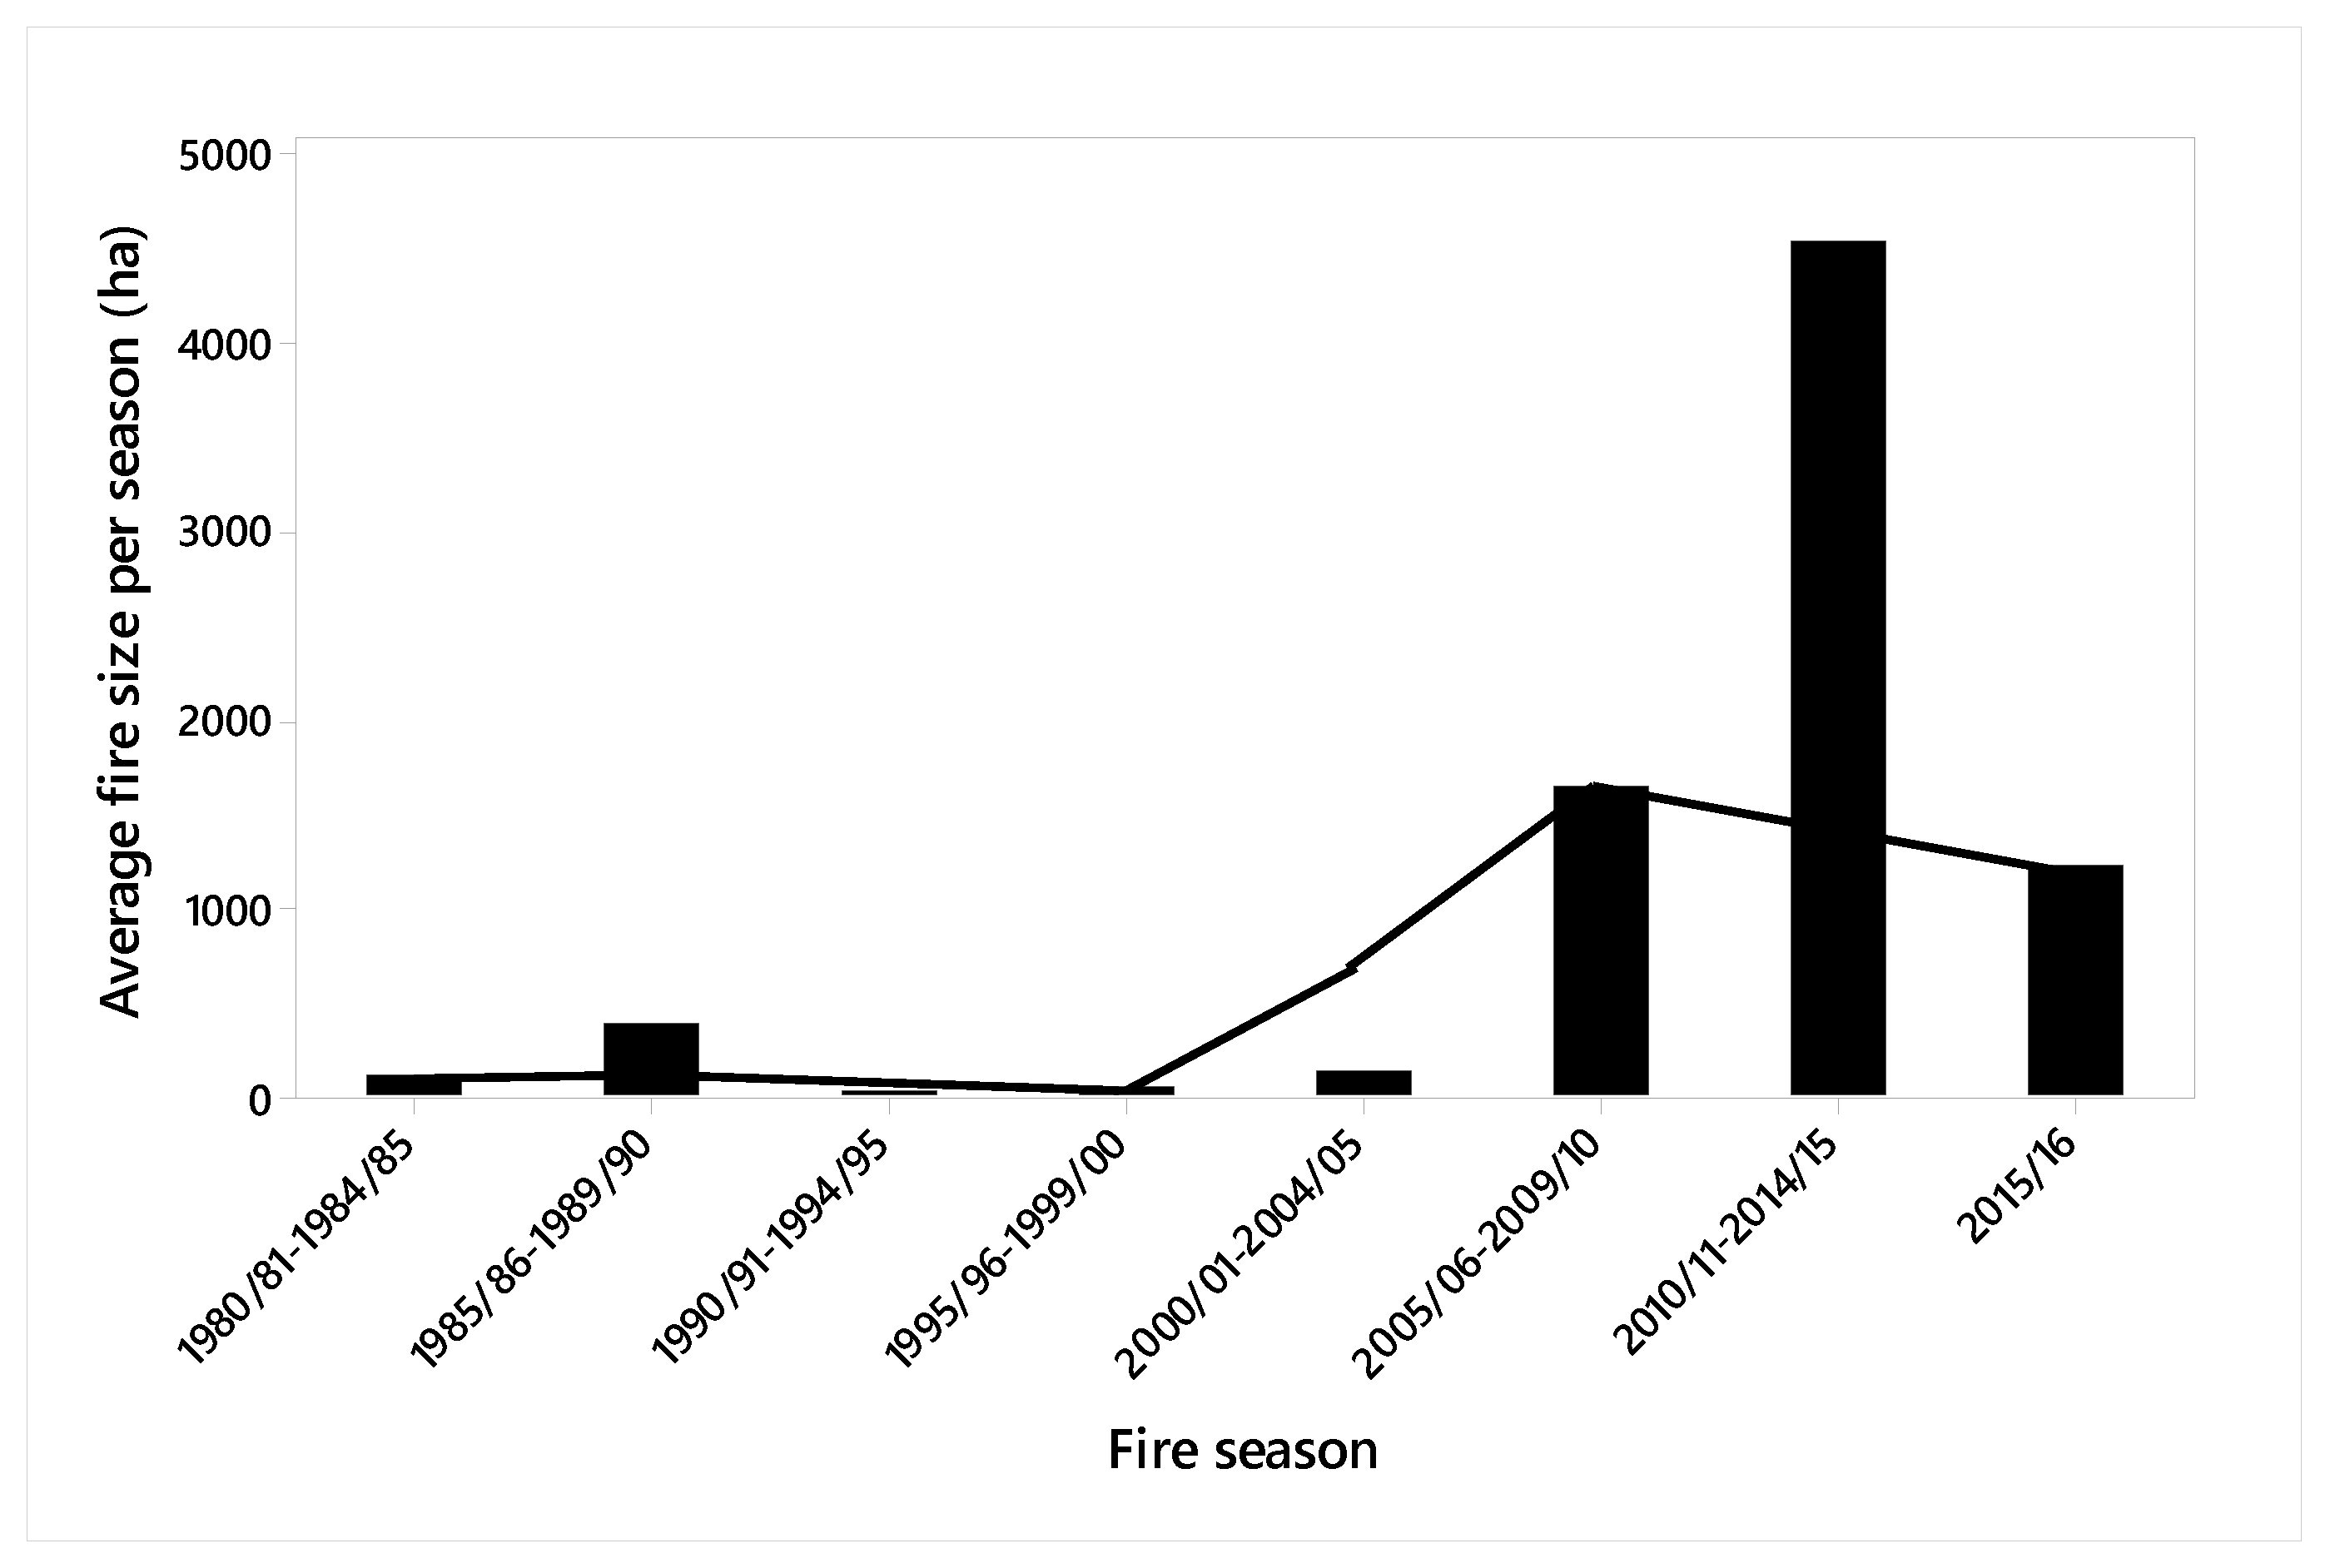
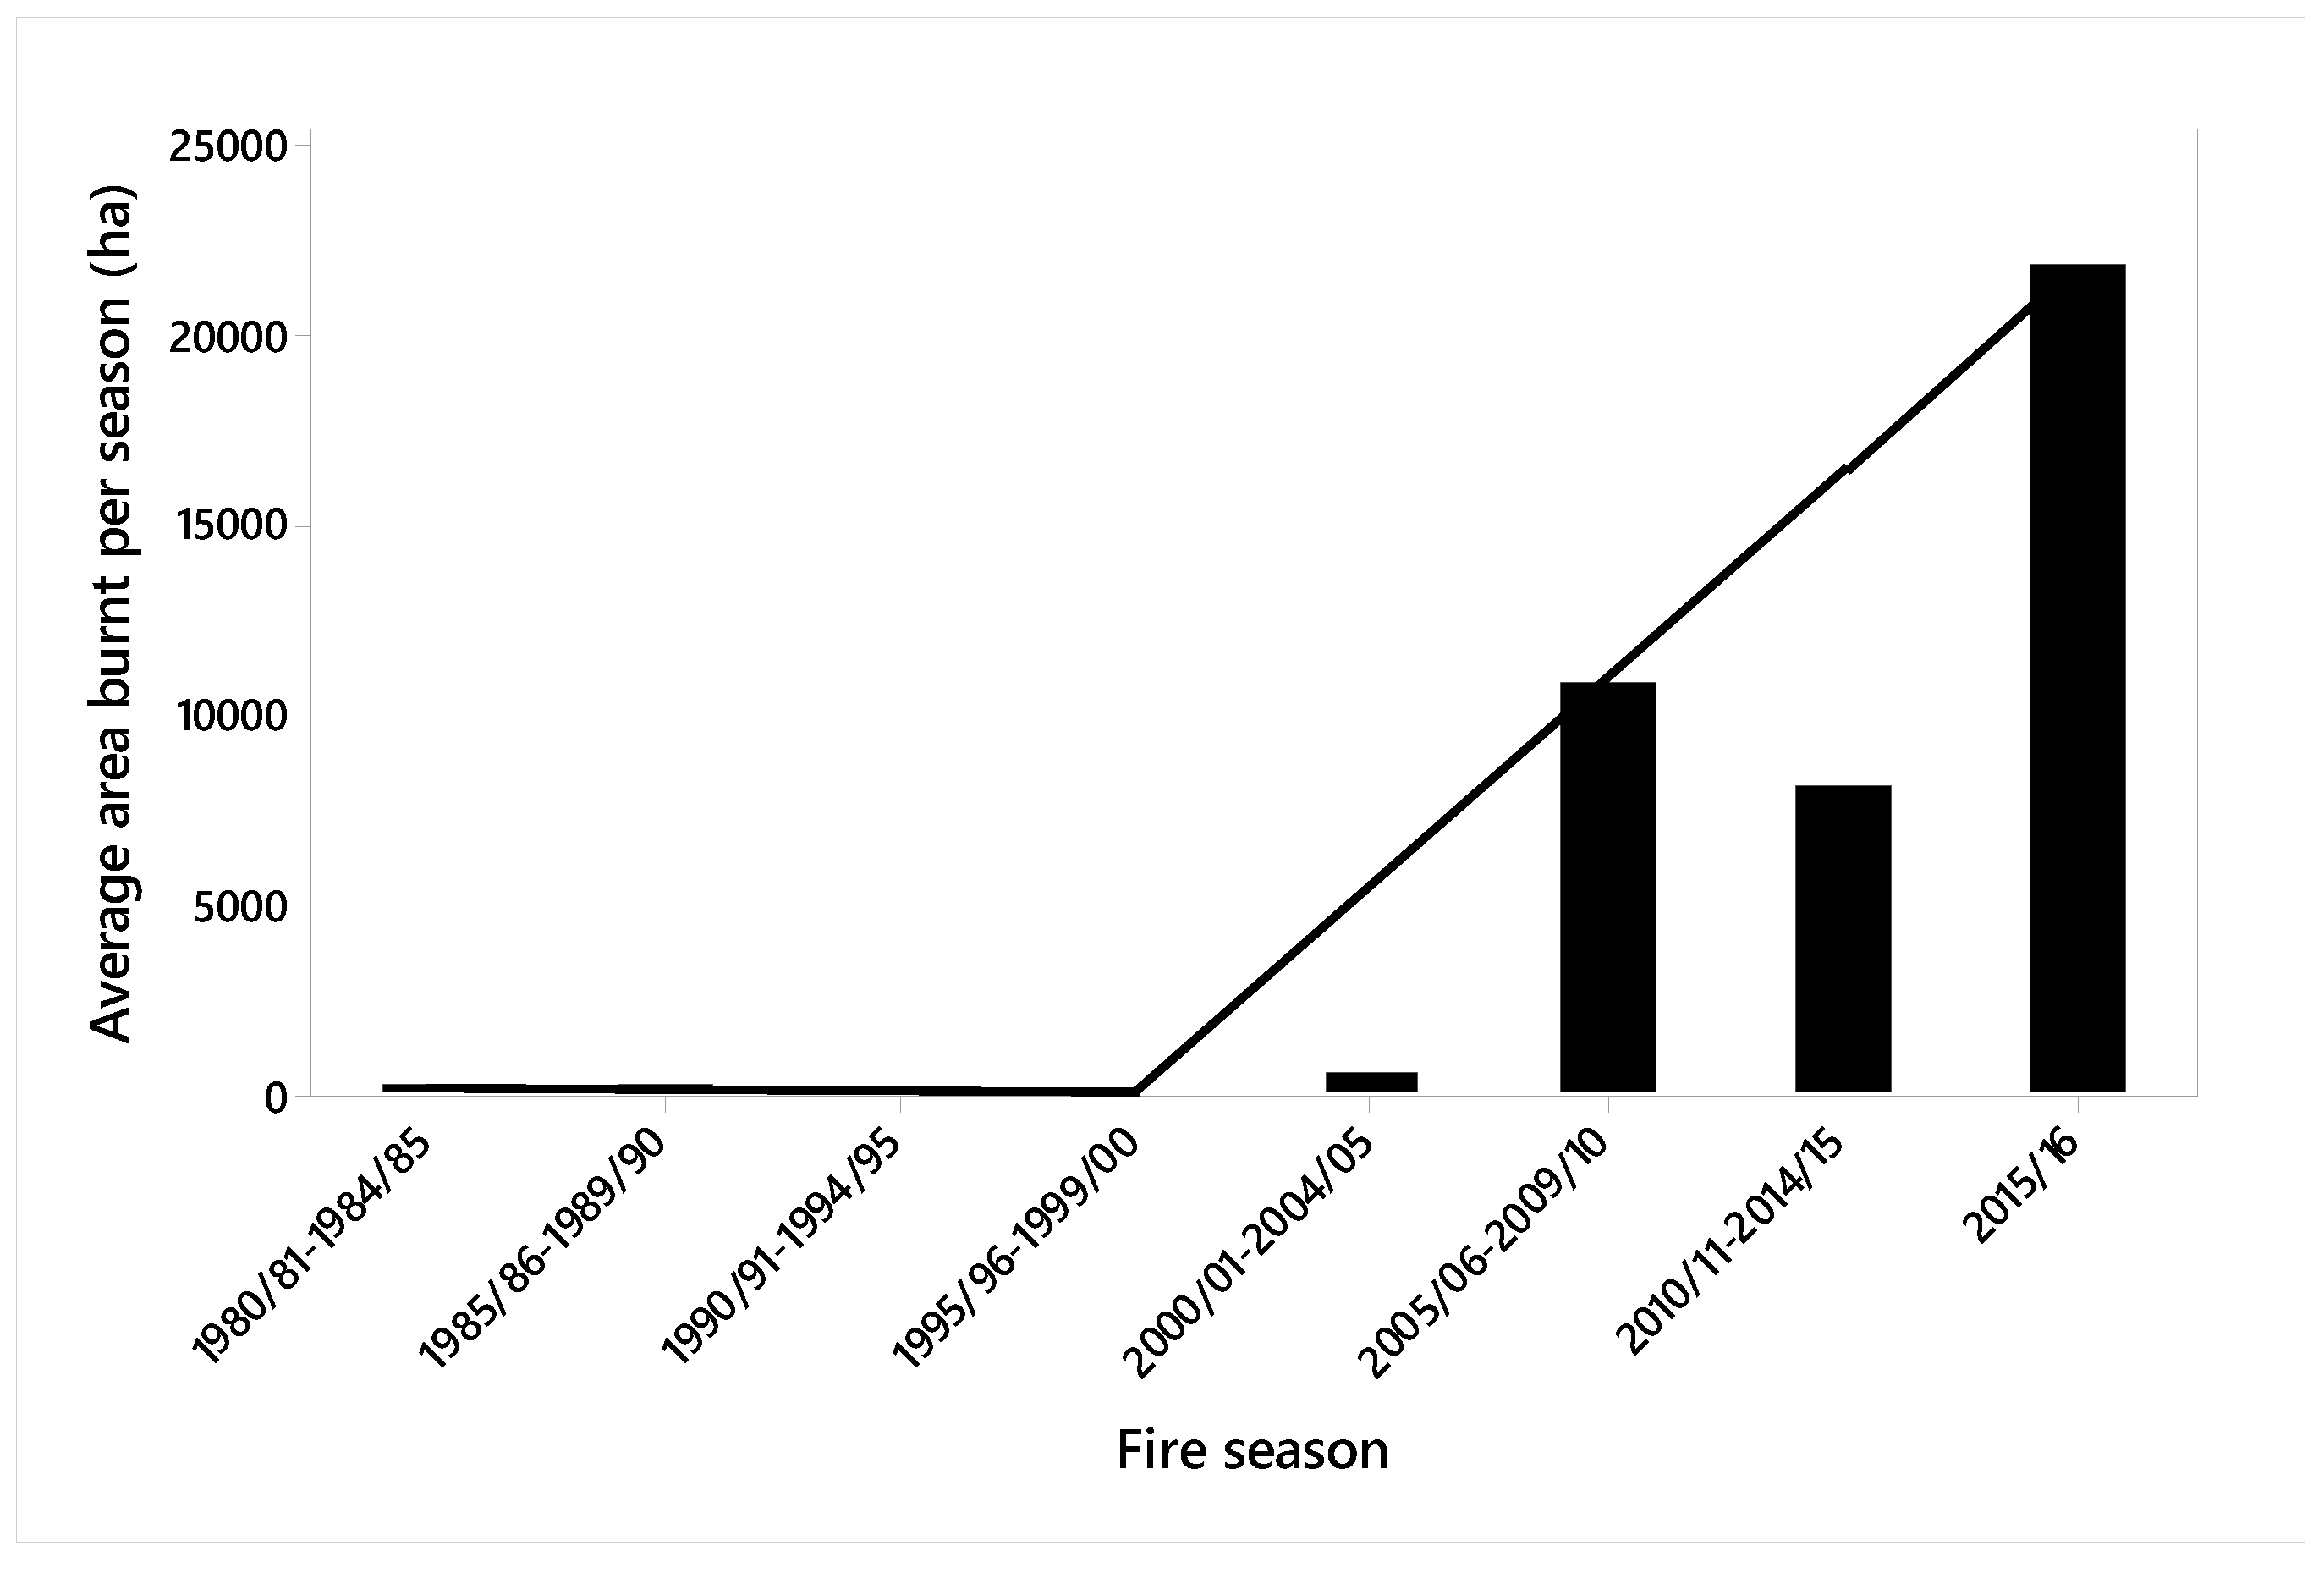
There is no reliable historically available lightning strike data for western Tasmania as changes in lightning detection sensors and their operational status over time have led to temporal inconsistency. Even contemporary data fails to accurately map and detect lightning in this remote corner of the world, thus, our data relates to fires that follow lightning strikes and are believed to have been caused by lightning, according to land management authorities.
From the early 1980s, mapped fire history records, including fire cause, were collected by the Tasmania Parks and Wildlife Service (PWS) and Forestry Tasmania. We reviewed the area and cause for all fires that occurred between 1980/81 and 2004/05 using aerial observation and/or on-the-ground checking of burnt areas (note that one of us, JM-S, was a fire management officer responsible for the TWWHA for most of this period). Since 2005/06, the PWS have kept detailed records of fire cause, which we have accepted. We allocated each fire to a fire season (July to June) with the number of fires, size and areas burnt averaged over five-year periods. The 2015/16 fire season was kept separate as it fell at the end of our study period but incorporated the most historically significant lightning fire events recorded in western Tasmania.
The average spring and summer rainfall (1 September to 28 February) for each season between 1979 and 2016 was calculated for three western Tasmanian Bureau of Meteorology (BoM) stations (Strathgordon Village, Lake Margaret and Savage River).
The Soil Dryness Index (SDI) was calculated for each station for the summer months between 1978 and 2016, using the interception loss class B, which best fits buttongrass moorland [19]. The SDI requires input values for maximum temperature, minimum temperature and rainfall. Where temperature values were missing, the monthly average maximum or minimum temperature for a nearby station was substituted.
Climate data from stations in western Tasmania, particularly before the establishment of Automatic Weather Stations in the 1980s and 1990s, are patchy, with numerous interruptions and stations regularly decommissioned. Many stations have historic records for either temperature or rainfall, but rarely both. Temperature data were available for Savage River until 1989. From 1990–1995 temperature data were taken from the nearby BoM station at Waratah and from 1996–2015 temperature data were taken from the nearby BoM station at Luncheon Hill. There was no need to substitute for the other two stations.
Spearman’s rank correlation coefficient was used to test the relationship between the number of lightning fires from 1980/81 to 2015/16 and SDI for the three BoM stations, and the total area burnt by lightning fires from 1980/81 to 2015/16 and the SDI for the three BoM stations.
The standard error of the SDI was calculated for the Strathgordon Village BoM station to test for the influence of variability in rainfall within fire seasons on fires ascribed to lightning. Spearman’s rank correlation coefficient was used to test the relationship between SDI variability and the number of fires and total area burnt for each fire season. The means of the 75–100th percentile of SDI values were tested with the Spearman’s rank correlation coefficient to examine the relationship between the driest quarter means and the number of fires and total area burnt.
We calculated the amount of sustaining buttongrass moorlands fuel for each fire season from 1980/81 to 2015/16. We used buttongrass moorlands (dominated by the sedge Gymnoschoenus sphaerocephalus) as this is the vegetation type that is most likely to sustain a lightning ignition and result in fire spread. The amount of fire-sustaining buttongrass was calculated by subtracting from the total area of buttongrass in the study area (1,872,459.39 ha) the amount of buttongrass that had burnt in the previous four fire seasons, asmost buttongrass moorlands will not sustain burning due to their very low amounts of dead fuel when younger than four years, except under extreme conditions [20,21].

3. Results

In the 1980s and 1990s there were frequent anecdotal observations of lightning storms, including observations made by the authors of this paper, however, only a few sustaining fires following lightning were recorded [5,6,9]. This situation changed by the year 2000, when there were increasing numbers of reports of lightning causing fires (Figure 2). In addition, there was an increase in the average size of lightning fires (Figure 3, Appendix A) resulting in a marked increase in the area burnt (Figure 4, Appendix A). There were major lightning-caused fires in 2000/2001, 2006/2007, 2012/2013 and 2015/2016.
During this period, annual summer rainfall and spring rainfall at Savage River and Strathgordon did not decline (p > 0.05). Spring rainfall at Lake Margaret did decline (Table 1).
The average summer SDI calculated from the Lake Margaret BoM station showed a significant relationship with area burnt, but not with the number of fires per fire season. Both other BoM stations showed no relationship to the number of fires or area burnt in each fire season between 1980/81 and 2015/16 and the SDI (Table 2).
There was no relationship between the available burnable area (buttongrass older than four years) and the number of fires per season or the area burnt per season (Spearman’s rank correlation coefficient: Number of fires = −0.084, p-value = 0.638; area burnt = −0.147, p-value = 0.391).
There was a strong relationship between the variability in SDI values for Strathgordan Village and the number of fires and area burnt in each fire season (Table 3). Analysis of the quarter driest SDI values in each fire season for Strathgordan Village showed a significant relationship with the number of fires and area burnt per fire season (Table 3).

4. Discussion

Increases in lightning activity due to climate change have been observed across the globe or are projected to occur across the globe [10,16,22,23,24,25], with lightning strike rate correlated with temperature on short time scales [10]. Lightning is now responsible for the majority of the area burned in the TWWHA and adjacent areas (Appendix A).
It is possible that the increase in lightning fires observed in the TWWHA since the 1990s may be the result of an increase in dry lightning strikes, an increase in the overall amount of lightning, an increase in fuel dryness, an increase in the fuel load, or a combination of all four factors. Although lightning strikes are a prerequisite for lightning fires, not all lightning strikes will result in sustaining fires. For an ignition to occur from lightning, it must strike a fuel source. The lightning ignition efficiency [26] will be governed by fuel availability, fuel moisture and accompanying rainfall. Rainfall may be sufficient to suppress an ignition, or it may extinguish a successful ignition [11]. Lightning that is accompanied by insufficient rain to suppress or extinguish ignitions is referred to as dry lightning [27]). Unlike in many other parts of the world where a direct relationship can be drawn between lightning strikes and ignitions, the absence of any usable long-term lightning detection data for western Tasmania means we cannot determine if the observed increase in lightning fires is the result of an increase in the number of lightning strikes or an increase in the number of successful ignitions. Our analyses showed no change in overall summer rainfall, and a slight decrease in spring rainfall at only one station, indicating that it is the lightning pressure that has increased rather than the lightning ignition efficiency. However, analysis of the variation in the Soil Dryness Index for the summer months show increased variability in rainfall over time, suggesting there are extreme dry and wet periods within fire seasons, which are masked by the unchanged total summer rainfall. Dry periods can lead to soil hydrophobicity [28] and intense rainfall can result in increased flash runoff [29]. These factors alone and in combination will result in a lowering of the soil and fuel moisture, increasing the lightning ignition efficiency. Changes in summer rainfall patterns to less frequent, more intense rainfall events resulting in more periods of drier fuel and soil conditions is the most likely cause of the increase in lightning fires.
The lightning ignition efficiency will also increase with high fuel loads. High fuel loads in buttongrass moorlands, the TWWHA’s most common vegetation type, will also decrease the probability that fires will self-extinguish [21]. This combination will result in both a greater number of fires and a larger fire size. Although there is a negative fuel feedback [25], particularly in moorlands, where large fires reduce the fuel load for future fires, this process is more complicated in the wet forests of Western Tasmania. For example, fire in rainforests will create a more favourable microclimate for drying fuels and allows a pathway for more flammable species to establish [30]. In regrowth wet eucalypt forests there is a non-linear fire severity, with stands between 7–36 years following disturbance found to be the most flammable [31]. In addition, buttongrass moorland is fast growing and can support a fire as soon as four years after the last burn [20], with fire intensity increasing with higher fuel loads [32]. The loss of Aboriginal patch burning in this community is likely to have resulted in a more flammable and continuous fuel load, enabling more ignition opportunities and a chance for larger fires. However, the amount of available burnable area (buttongrass older than four years) over the study period showed no relationship with the total number of lightning fires or the total area burnt in lighting fires. This result indicates that it is not a change in the fuel load that is responsible for either the greater number of fires associated with lightning, or the increased area burnt in lightning fires. It is possible that there have been changes in the lightning regime over the last four decades but without historic lightning records we cannot say for certain.

Future Outlook

The incidence of human ignited fires has decreased in the TWWHA through successful education campaigns and a ‘fuel stove only’ policy, leaving lightning as the main ignition source. Although a shift towards more human-ignited fires in the United States was found to expand the ‘fire niche’ by enabling fires to establish under higher fuel moisture conditions as a result of the more sustained ignition pressure [33], this has not been the case in Western Tasmania, where human ignited fires are now the exception.
Love et al. [34] project very large increases in dryness along with minor decreases in dry lightning potential. The increase in dryness is projected using the Soil Dryness Index (SDI) [19] and rainfall. These factors can be used to predict rainforest flammability from the number of days in a season when the SDI exceeds the critical threshold of 50 [18] and the number of times in a season when there are greater than 30 days in succession with less than 50 mm of precipitation in total [35]. Love et al. [34] suggest that compared to the time period of 2010 to 2030, the conditions conducive to rainforest burning are predicted to approximately double in temporal incidence by mid-century (i.e., 2040 to 2060), and more than triple by the end of the century (i.e., 2080 to 2100).
Love et al. [34] projected minor increases in dry lightning between 1980 and 2030, followed by a slight decrease in subsequent time periods, which they attributed to the southward movement of the subtropical high-pressure zone. Kirkpatrick et al. [36] found no change in air pressure over Tasmania, with observed increases in atmospheric instability since the mid-1980s due to changes in the pressure to the north and south of the island, resulting in a steeper pressure gradient. The degree to which the subtropical high-pressure belt can move south, rather than intensify, in a warming globe will be critical in determining future patterns of climate change in Western Tasmania.
The worst scenario for world heritage values is the realization of a projected tendency towards drier summers, continuing high fuel loads in buttongrass moorlands and a continued high level of increase in dry lightning incidence. In such an environment, the consequences of any ignitions on values relates to the rapidity of the fire suppression response, as there is only a brief temporal window for fire suppression following ignition in the TWWHA, after which efforts can only be concentrated on containment. A reduction in fuel load through a comprehensive planned burning regime [37] could also assist in the protection of the fire-threatened, globally significant values.

Author Contributions

Conceptualization, J.S., J.M.-S. and J.K.; methodology, J.S., J.M.-S. and J.K.; Formal analysis, J.S., J.M.-S. and J.K.; Investigation, J.S, J.M.-S. and J.K.; Resources, J.S., J.M.-S. and J.K.; Data curation, J.S., J.M.-S. and J.K.; Writing—original draft preparation, J.S., J.M.-S. and J.K.; Writing—review and editing, J.S., J.M.-S. and J.K.; Project administration, J.S., J.M.-S. and J.K.

Funding

This research received no external funding.

Acknowledgments

The Fire Management Section of the Tasmanian Parks and Wildlife Service provided access to the fire history and fire-attributes vegetation databases. Staff in the Tasmanian Climate Change Office provided resources and assistance with producing this paper. In particular, we would like to thank Shona Prior, Tony Press, Jane Colton and Adrian Pyrke. Finally, helpful discussions regarding the issues in this paper were had with Maj-Britt di Folco, Kath Storey, Paul Fox-Hughes and Peter Love.

Conflicts of Interest

The authors declare no conflict of interest.

Appendix A

Table A1. Recorded fires in the Tasmanian Wilderness World Heritage Area and adjacent areas between 1980/81 and 2015/16.
1980/81–1984/851985/86–1989/901990/91–1994/951995/96–1999/002000/01–2004/052005/06–2009/102010/11–2014/152015/16Total
Arson
Number222423181514160132
Area1514437979.21360.61001.66450.1269.82250.2064455.5
Av size688.41582.559.255.643019.3140.60488.3
Escaped campfires and stoves
Number325011031052
Area7921.786.3456.700.250.108470
Av size2640.643.191.300.20.500162.9
Escaped management burns
Number1502111011
Area1763.941849.605412.84729.9429.51.2054186.9
Av size1763.98369.902706.44729.9429.51.204926.1
Lightning
Number103462133918104
Area1089.11177.7123.9298.52747.853991.740733.221897.2122059.1
Ave size108.9392.63149.8130.81636.14525.91216.51173.6
Planned burns
Number1099223752270166
Area9904.41506.3794.13522.7976710976.718102.7054573.9
Av size990.4167.488.2160.1264211.1670.50328.8
Miscellaneous
Number2540451021
Area157.33018.8158.602829.170.206171
Av size78.6603.800707.31.40.20293.9
Total, all fire types
Number48484548791158518486
Area35980.485617.92893.910235.626524.165679.761087.621897.2309916.4
Av size6270.811159.3269.72971.96262.22297.95338.41216.5637.7

References

  1. Australian Government. Available online: http://www.environment.gov.au/ (accessed on 7 September 2018).
  2. DPIPWE. Tasmanian Wilderness World Heritage Area Management Plan 2016; Department of Primary Industries, Parks, Water and Environment: Hobart, TAS, Australia, 2016. [Google Scholar]
  3. Jordan, G.J.; Harrison, P.A.; Worth, J.R.P.; Williamson, G.J.; Kirkpatrick, J.B. Palaeoendemic plants provide evidence for persistence of open, well-watered vegetation since the Cretaceous. Glob. Ecol. Biogeogr. 2016, 25, 127–140. [Google Scholar] [CrossRef]
  4. Balmer, J.; Storey, D. A Review of Vegetation Responses to Fire in Buttongrass Moorland; Buttongrass Moorland Management Workshop: Hobart, TAS, Australia, 2010. [Google Scholar]
  5. Johnson, K.A.; Marsden-Smedley, J.B. Fire history of the northern part of the Tasmanian Wilderness World Heritage Area and its associated regions. Pap. Proc. R. Soc. Tasman. 2002, 136, 145–152. [Google Scholar] [CrossRef]
  6. Marsden-Smedley, J.B. Changes in southwestern Tasmanian fire regimes since the early 1800s. Pap. Proc. R. Soc. Tasman. 1998, 132, 15–29. [Google Scholar] [CrossRef]
  7. Marsden-Smedley, J.B.; Kirkpatrick, J.B. Fire management in Tasmania’s Wilderness World Heritage Area: Ecosystem restoration using Indigenous-style fire regimes? Ecol. Manag. Restor. 2000, 1, 195–203. [Google Scholar] [CrossRef]
  8. Marsden-Smedley, J.B. Tasmanian wildfires January–February 2013: Forcett-Dunalley, Repulse, Bicheno, Giblin River, Montumana, Molesworth and Gretna; Report prepared for the Tasmania Fire Service and Bushfire Co-operative Research Centre: Hobart, TAS, Australia, 2014. [Google Scholar]
  9. Black, P. Personal Communication; Tasmania Parks and Wildlife Service: Hobart, TAS, Australia, 2018. [Google Scholar]
  10. Krause, A.; Klostner, S.; Wilkenskjeld, S.; Paeth, H. The sensitivity of global wildfires to simulated past, present, and future lightning frequency. J. Geophys. Res. Biogeosci. 2014, 119, 312–322. [Google Scholar] [CrossRef] [Green Version]
  11. Paz, S.; Inbar, M.; Kutiel, H.; Malkinson, D.; Tessler, N.; Wittenberg, L. Wildfires in the eastern Mediterranean as a result of lightning activity – A change in the conventional knowledge. Int. J. Wildland Fire 2016, 25, 592–596. [Google Scholar] [CrossRef]
  12. Woolford, D.G.; Dean, C.B.; Martell, D.L.; Cao, J.; Wotton, B.M. Lightning-caused forest fire risk in Northwestern Ontario, Canada, is increasing and associated with anomalies in fire weather. Environmetrics 2014, 25, 406–416. [Google Scholar] [CrossRef]
  13. Wotton, B.M.; Nock, C.A.; Flannigan, M.D. Forest fire occurrence and climate change in Canada. Int. J. Wildland Fire 2010, 19, 253–271. [Google Scholar] [CrossRef]
  14. Bowman, D.M.J.S.; Balch, J.K.; Artaxo, P.; Bond, W.J.; Carlson, J.M.; Cochrane, M.A.; D’Antonio, C.M.; DeFries, R.S.; Doyle, J.C.; Harrison, S.P. Fire in the Earth system. Science 2009, 324, 481–484. [Google Scholar] [CrossRef] [PubMed]
  15. Flannigan, M.D.; Wotton, B.M. Lightning-ignited forest fires in northwestern Ontario. Can. J. For. Res. 1991, 21, 277–287. [Google Scholar] [CrossRef]
  16. Flannigan, M.D.; Krawchuk, M.A.; de Groot, W.J.; Wotton, B.M.; Gowman, L.M. Implications of changing climate for global wildland fire. Int. J. Wildland Fire 2009, 18, 483–507. [Google Scholar] [CrossRef]
  17. Bowman, D.M.J.S; Jackson, W.D. Vegetation succession in southwest Tasmania. Search 1981, 12, 358–362. [Google Scholar]
  18. Marsden-Smedley, J.B. Planned Burning in Tasmania: Operational Guidelines and Review of Current Knowledge; Parks and Wildlife Service, Department of Primary Industries, Parks, Water and Environment: Hobart, TAS, Australia, 2009. [Google Scholar]
  19. Mount, A.B. The Derivation and Testing of a Soil Dryness Index Using Run-Off Data; Bulletin no. 4; Tasmanian Forestry Commission: Hobart, TAS, Australia, 1972. [Google Scholar]
  20. Marsden-Smedley, J.B.; Rudman, T.; Pyrke, A.; Catchpole, W.R. Buttongrass moorland fire-behaviour prediction and management. Tasforests 1999, 11, 87–107. [Google Scholar]
  21. Marsden-Smedley, J.B.; Catchpole, W.R.; Pyrke, A. Fire modelling in Tasmanian buttongrass moorlands. IV. Sustaining versus non-sustaining fires. Int. J. Wildland Fire 2001, 10, 255–262. [Google Scholar] [CrossRef]
  22. Michalon, N.; Nassif, A.; Saouri, T.; Royer, J.F.; Pontikis, C.A. Contribution to the climatological study of lightning. Geophys. Res. Lett. 1999, 26, 3097–3100. [Google Scholar] [CrossRef] [Green Version]
  23. Price, C.; Rind, D. Possible implications of global climate change on global lightning distributions and frequencies. J. Geophys. Res. 1994, 99, 823–831. [Google Scholar] [CrossRef]
  24. Romps, D.M.; Seeley, J.T.; Vollaro, D.; Molinari, J. Projected increase in lightning strikes in the United States due to global warming. Science 2014, 346, 851–854. [Google Scholar] [CrossRef] [PubMed]
  25. Veraverbeke, S.; Rogers, B.M.; Goulden, M.L.; Jandt, R.R.; Miller, C.E.; Wiggins, E.B.; Randerson, J.T. Lightning as a major driver of recent large fire years in North American boreal forests. Nat. Clim. Chang. 2017, 7, 529–534. [Google Scholar] [CrossRef]
  26. Abatzoglou, J.T.; Kolden, C.A.; Balch, J.K.; Bradley, B.A. Controls on interannual variability in lightning-caused fire activity in the western US. Environ. Res. Lett. 2016, 11, 045005. [Google Scholar] [CrossRef] [Green Version]
  27. Hall, B. Precipitation associated with lightning-ignited wildfires in Arizona and New Mexico. Int. J. Wildland Fire 2007, 16, 242–254. [Google Scholar] [CrossRef]
  28. Burch, G.J.; Moore, I.D.; Burns, J. Soil hydrophobic effects on infiltration and catchment runoff. Hydrol. Process. 1989, 3, 211–222. [Google Scholar] [CrossRef]
  29. Liu, H.; Lei, T.W.; Zhao, J.; Yuan, C.P.; Fan, Y.T.; Qu, L.Q. Effects of rainfall intensity and antecedent soil water content on soil infiltrability under rainfall conditions using the run off-on-out method. J. Hydrol. 2011, 396, 24–32. [Google Scholar] [CrossRef]
  30. Hill, R.S.; Read, J. Post-fire regeneration of rainforest and mixed forest in Western Tasmania. Aust. J. Bot. 1984, 32, 481–493. [Google Scholar] [CrossRef]
  31. Taylor, C.; McCarthy, M.A.; Lindenmayer, D.B. Nonlinear Effects of Stand Age on Fire Severity. Conserv. Lett. 2014, 7, 355–370. [Google Scholar] [CrossRef] [Green Version]
  32. Marsden-Smedley, J.B.; Catchpole, W.R. Fire behaviour modelling in Tasmanian buttongrass moorlands. I. Fuel characteristics. Int. J. Wildland Fire 1995, 5, 203–214. [Google Scholar] [CrossRef]
  33. Balch, J.K.; Bradley, B.A.; Abatzoglou, J.T.; Nagy, R.C.; Fusco, E.J.; Mahood, A.L. Human-started wildfires expand the fire niche across the United States. Proc. Natl. Acad. Sci. USA 2017, 114, 2946–2951. [Google Scholar] [CrossRef] [PubMed]
  34. Love, P.T.; Fox-Hughes, P.; Harris, R.; Remenyi, T.; Bindoff, N. Impact of Climate Change on Weather-Related fire Risk Factors in the TWWHA: Interim Report; Tasmania Climate Change Office: Hobart, TAS, Australia, 2016. [Google Scholar]
  35. Styger, J.K.; Kirkpatrick, J.B. Less than 50 millimetres of rainfall in the previous month predicts fire in Tasmanian rainforest. Pap. Proc. R. Soc. Tasman. 2015, 149, 1–5. [Google Scholar] [CrossRef] [Green Version]
  36. Kirkpatrick, J.B.; Nunez, M.; Bridle, K.L.; Parry, J.; Gibson, N. Causes and consequences of variation in snow incidence on the high mountains of Tasmania, 1983–2013. Aust. J. Bot. 2017, 65, 214–224. [Google Scholar] [CrossRef]
  37. King, K.J.; Cary, G.J.; Bradstock, R.A.; Chapman, J.; Pyrke, A.; Marsden-Smedley, J.B. Simulation of prescribed burning strategies in south-west Tasmania, Australia: effects on unplanned fires, fire regimes, and ecological management values. Int. J. Wildland Fire 2006, 15, 527–540. [Google Scholar] [CrossRef]
Figure 1. Tasmanian Wilderness World Heritage Area (TWWHA). SR = Savage River, LM = Lake Margaret and SV = Strathgordon Village.
Fire 01 00038 g001
Figure 2. Average number of lightning fires per fire season for five-year periods between 1980/1981, 2014/2015 and 2015/2016. Lowess (segmented regression) line is shown.
Fire 01 00038 g002
Figure 3. Average size (ha) of lightning fires per fire season for five-year periods between 1980/1981, 2014/2015, and 2015/2016. Lowess (segmented regression) line is shown.
Fire 01 00038 g003
Figure 4. Average area burnt per fire season (ha) by lightning fires for five yearly periods between 1980/1981–2014/2015 and 2015/2016. Lowess (segmented regression) line is shown.
Fire 01 00038 g004
Table 1. Mean summer rainfall, R-squared value and p-value for linear regressions of summer rainfall against year for Strathgordon Village, Lake Margaret and Savage River Bureau of Meteorology stations, 1980/81–2015/16.
StationMean RainfallR-sq (%)p-Value
Summer
  Strathgordon447.03.70.261
  Lake Margaret525.92.30.375
  Savage River 284.00.60.650
Spring
  Strathgordon711.11.90.427
  Lake Margaret807.011.50.043
  Savage River485.18.80.078
Table 2. Spearman’s rank correlation coefficient for the number of lightning fires and area burnt in the Tasmanian Wilderness World Heritage Area between 1980/81 and 2015/16 and the average summer Soil Dryness Index calculated for three Bureau of Meteorology stations in western Tasmania.
Number of FiresArea Burnt
Spearman Valuep-ValueSpearman Valuep-Value
Strathgordon0.2870.090−0.3080.068
Lake Margaret0.2410.1570.3750.024
Savage River0.2730.1070.3120.064
Table 3. Spearman’s rank correlation coefficient for the standard error and average of the 75–100th percentile of the Soil Dryness Index for the Strathgordon Village Bureau of Meteorology station and the number of fires and area burnt for each fire season.
Standard Error of SDI75–100th Percentile of SDI
Spearman Valuep-ValueSpearman Valuep-Value
Number of fires0.714<0.0010.695<0.001
Area burnt0.620<0.0010.605<0.001

