Did Fine Particulate Matter from the Summer 2016 Landscape Fires in Tasmania Increase Emergency Ambulance Dispatches? A Case Crossover Analysis

 ,
,  ,
,
Abstract
1. Introduction
2. Materials and Methods
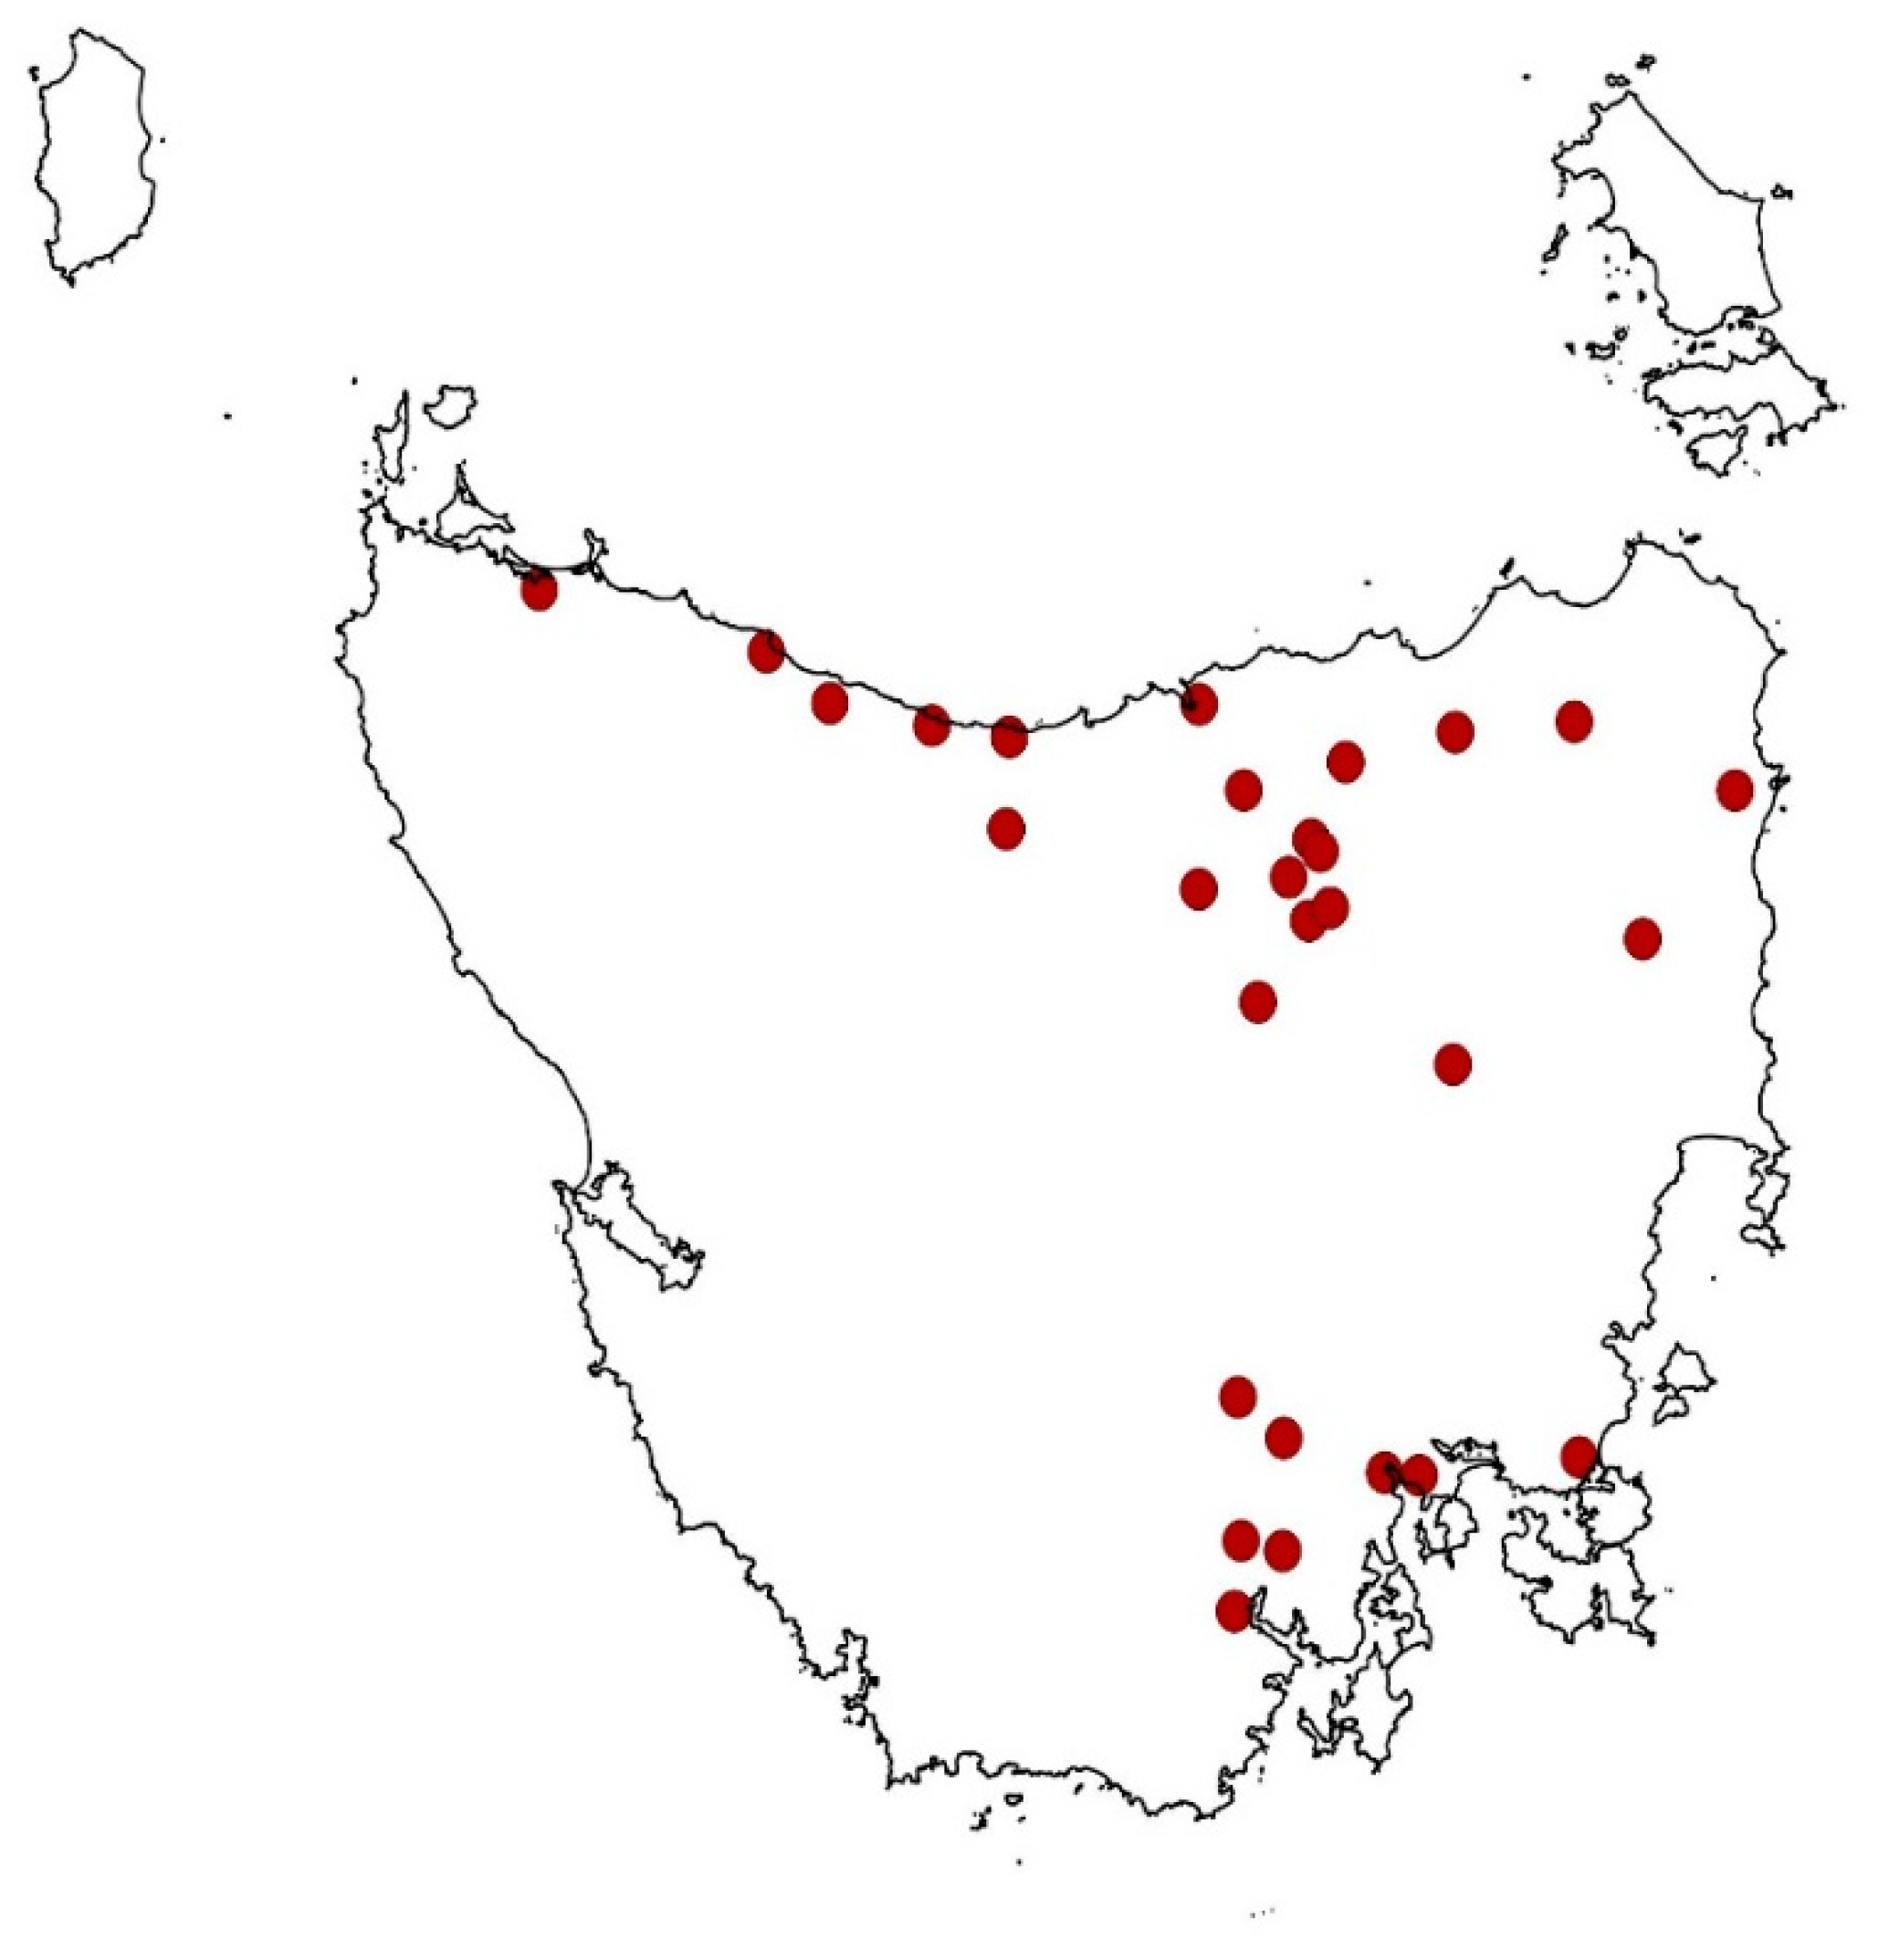
2.1. Setting
2.2. Study Design
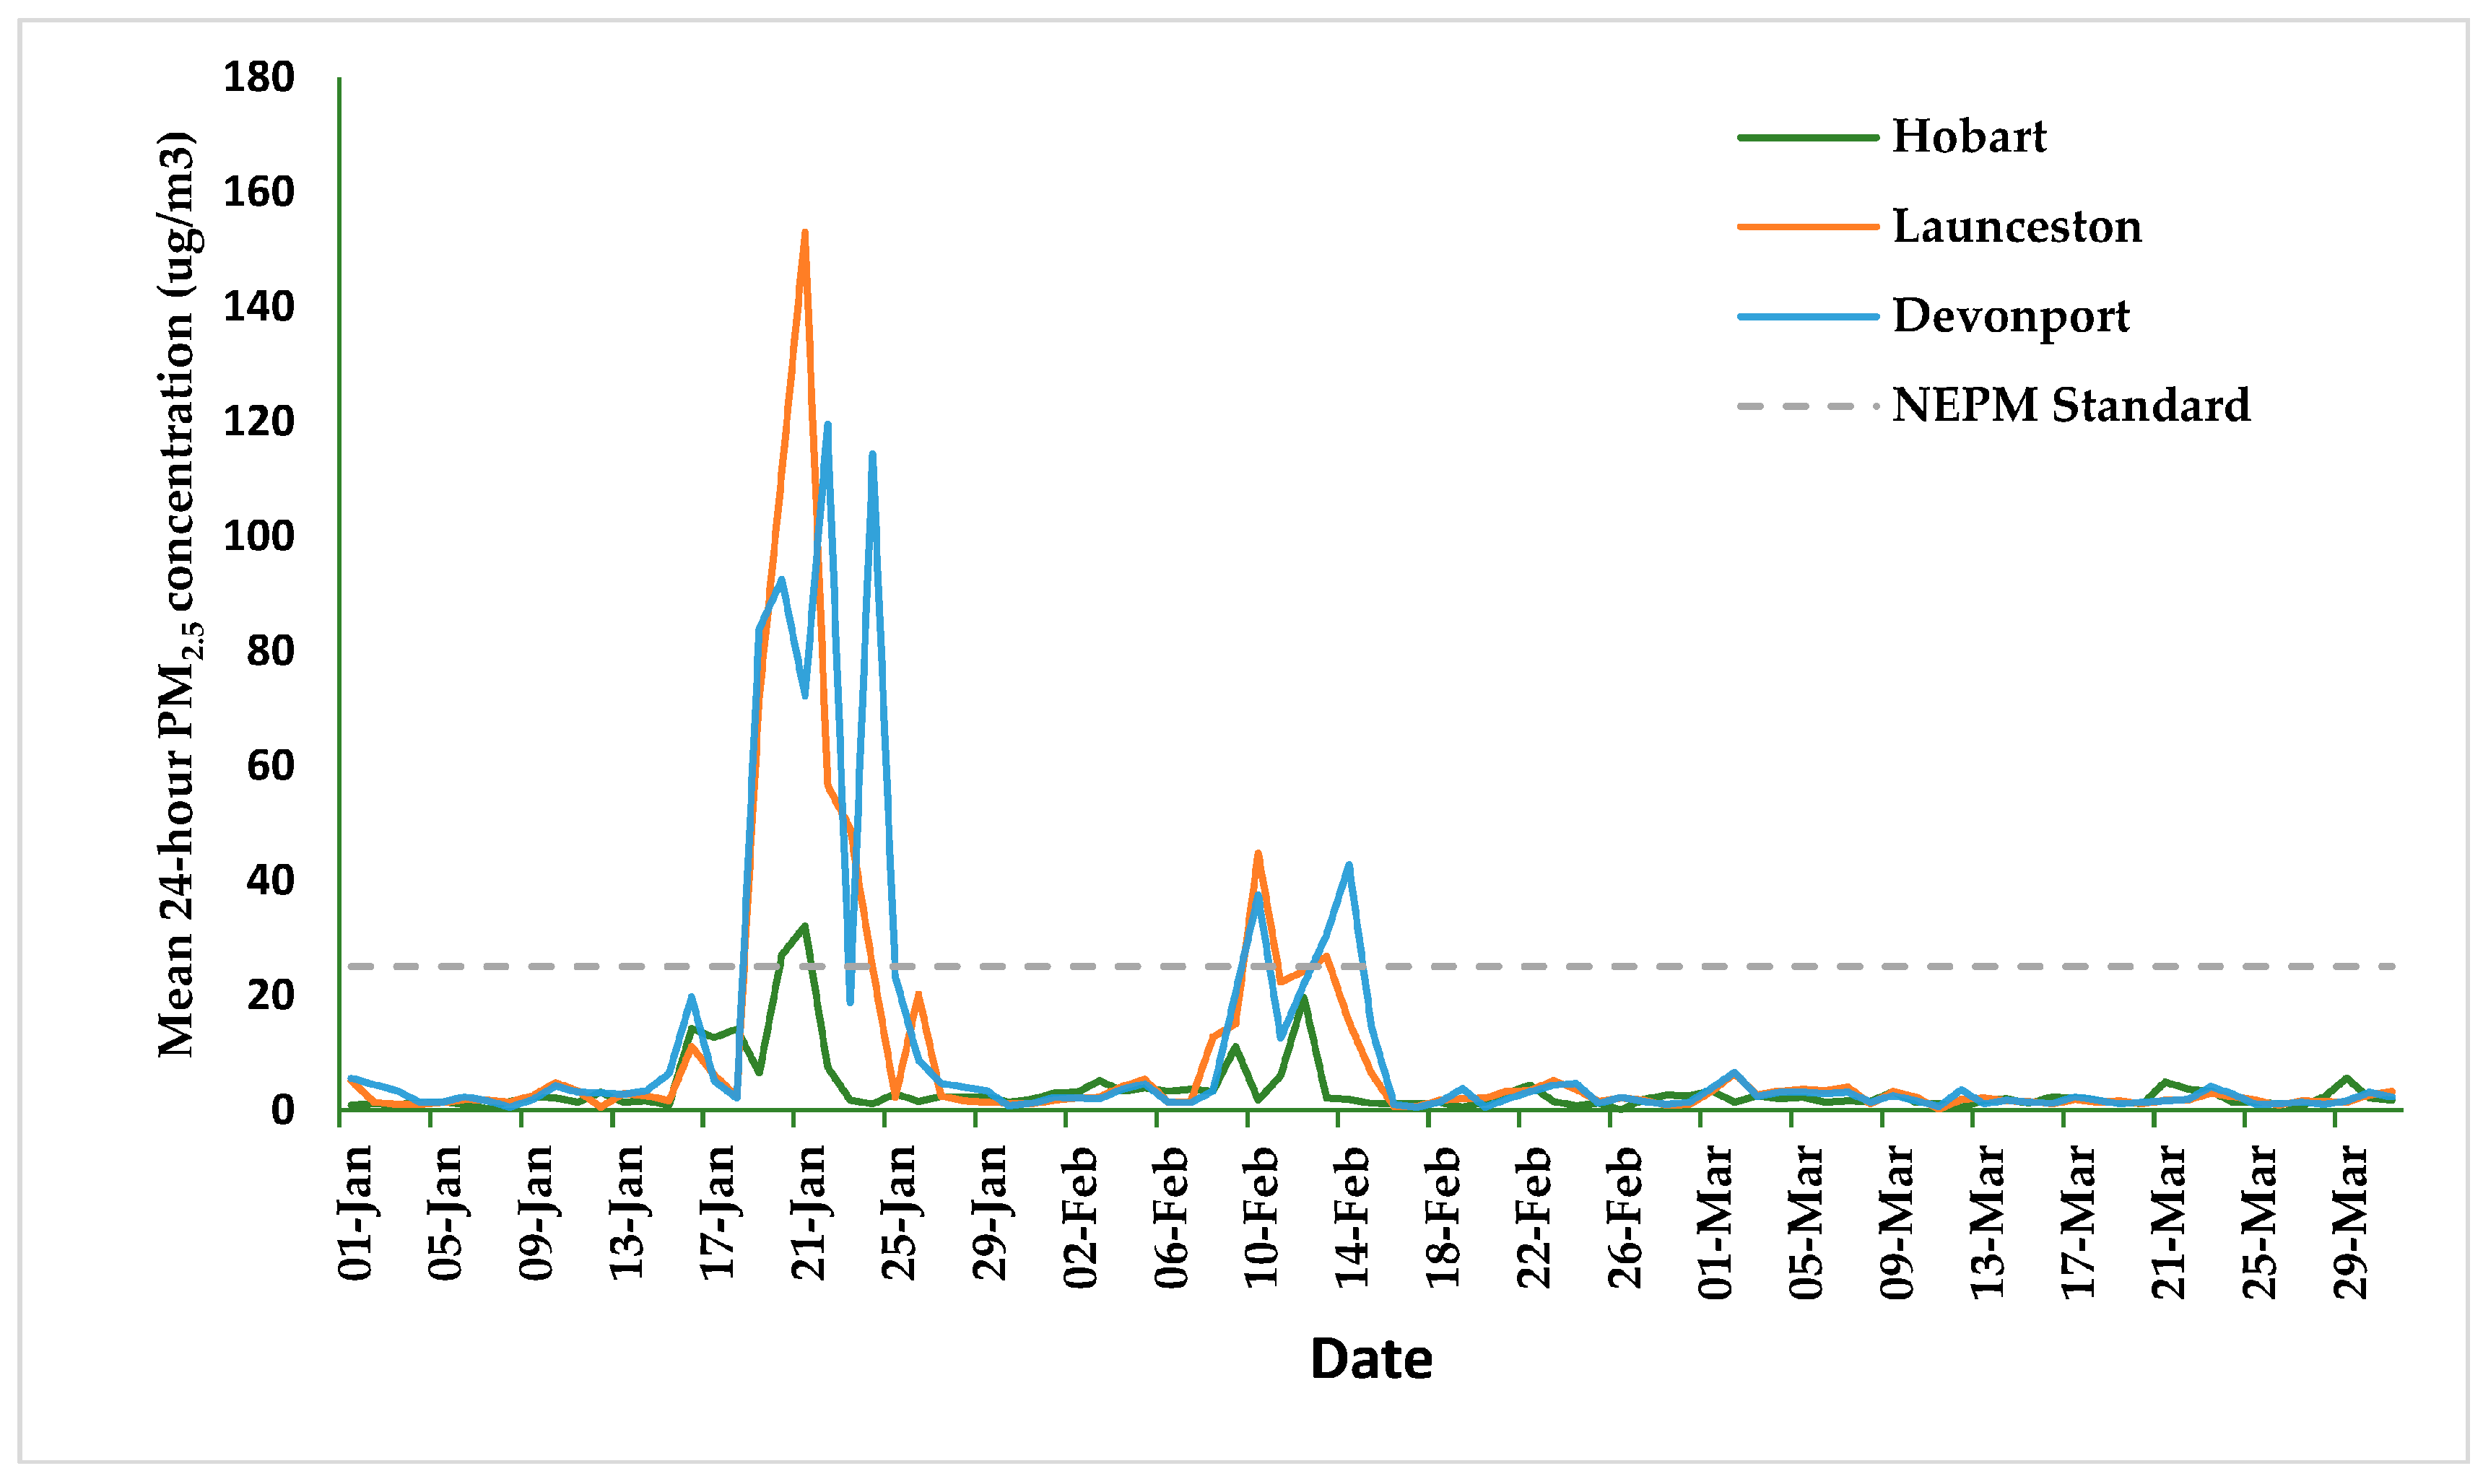
2.3. Exposure Data
2.4. Outcome Data
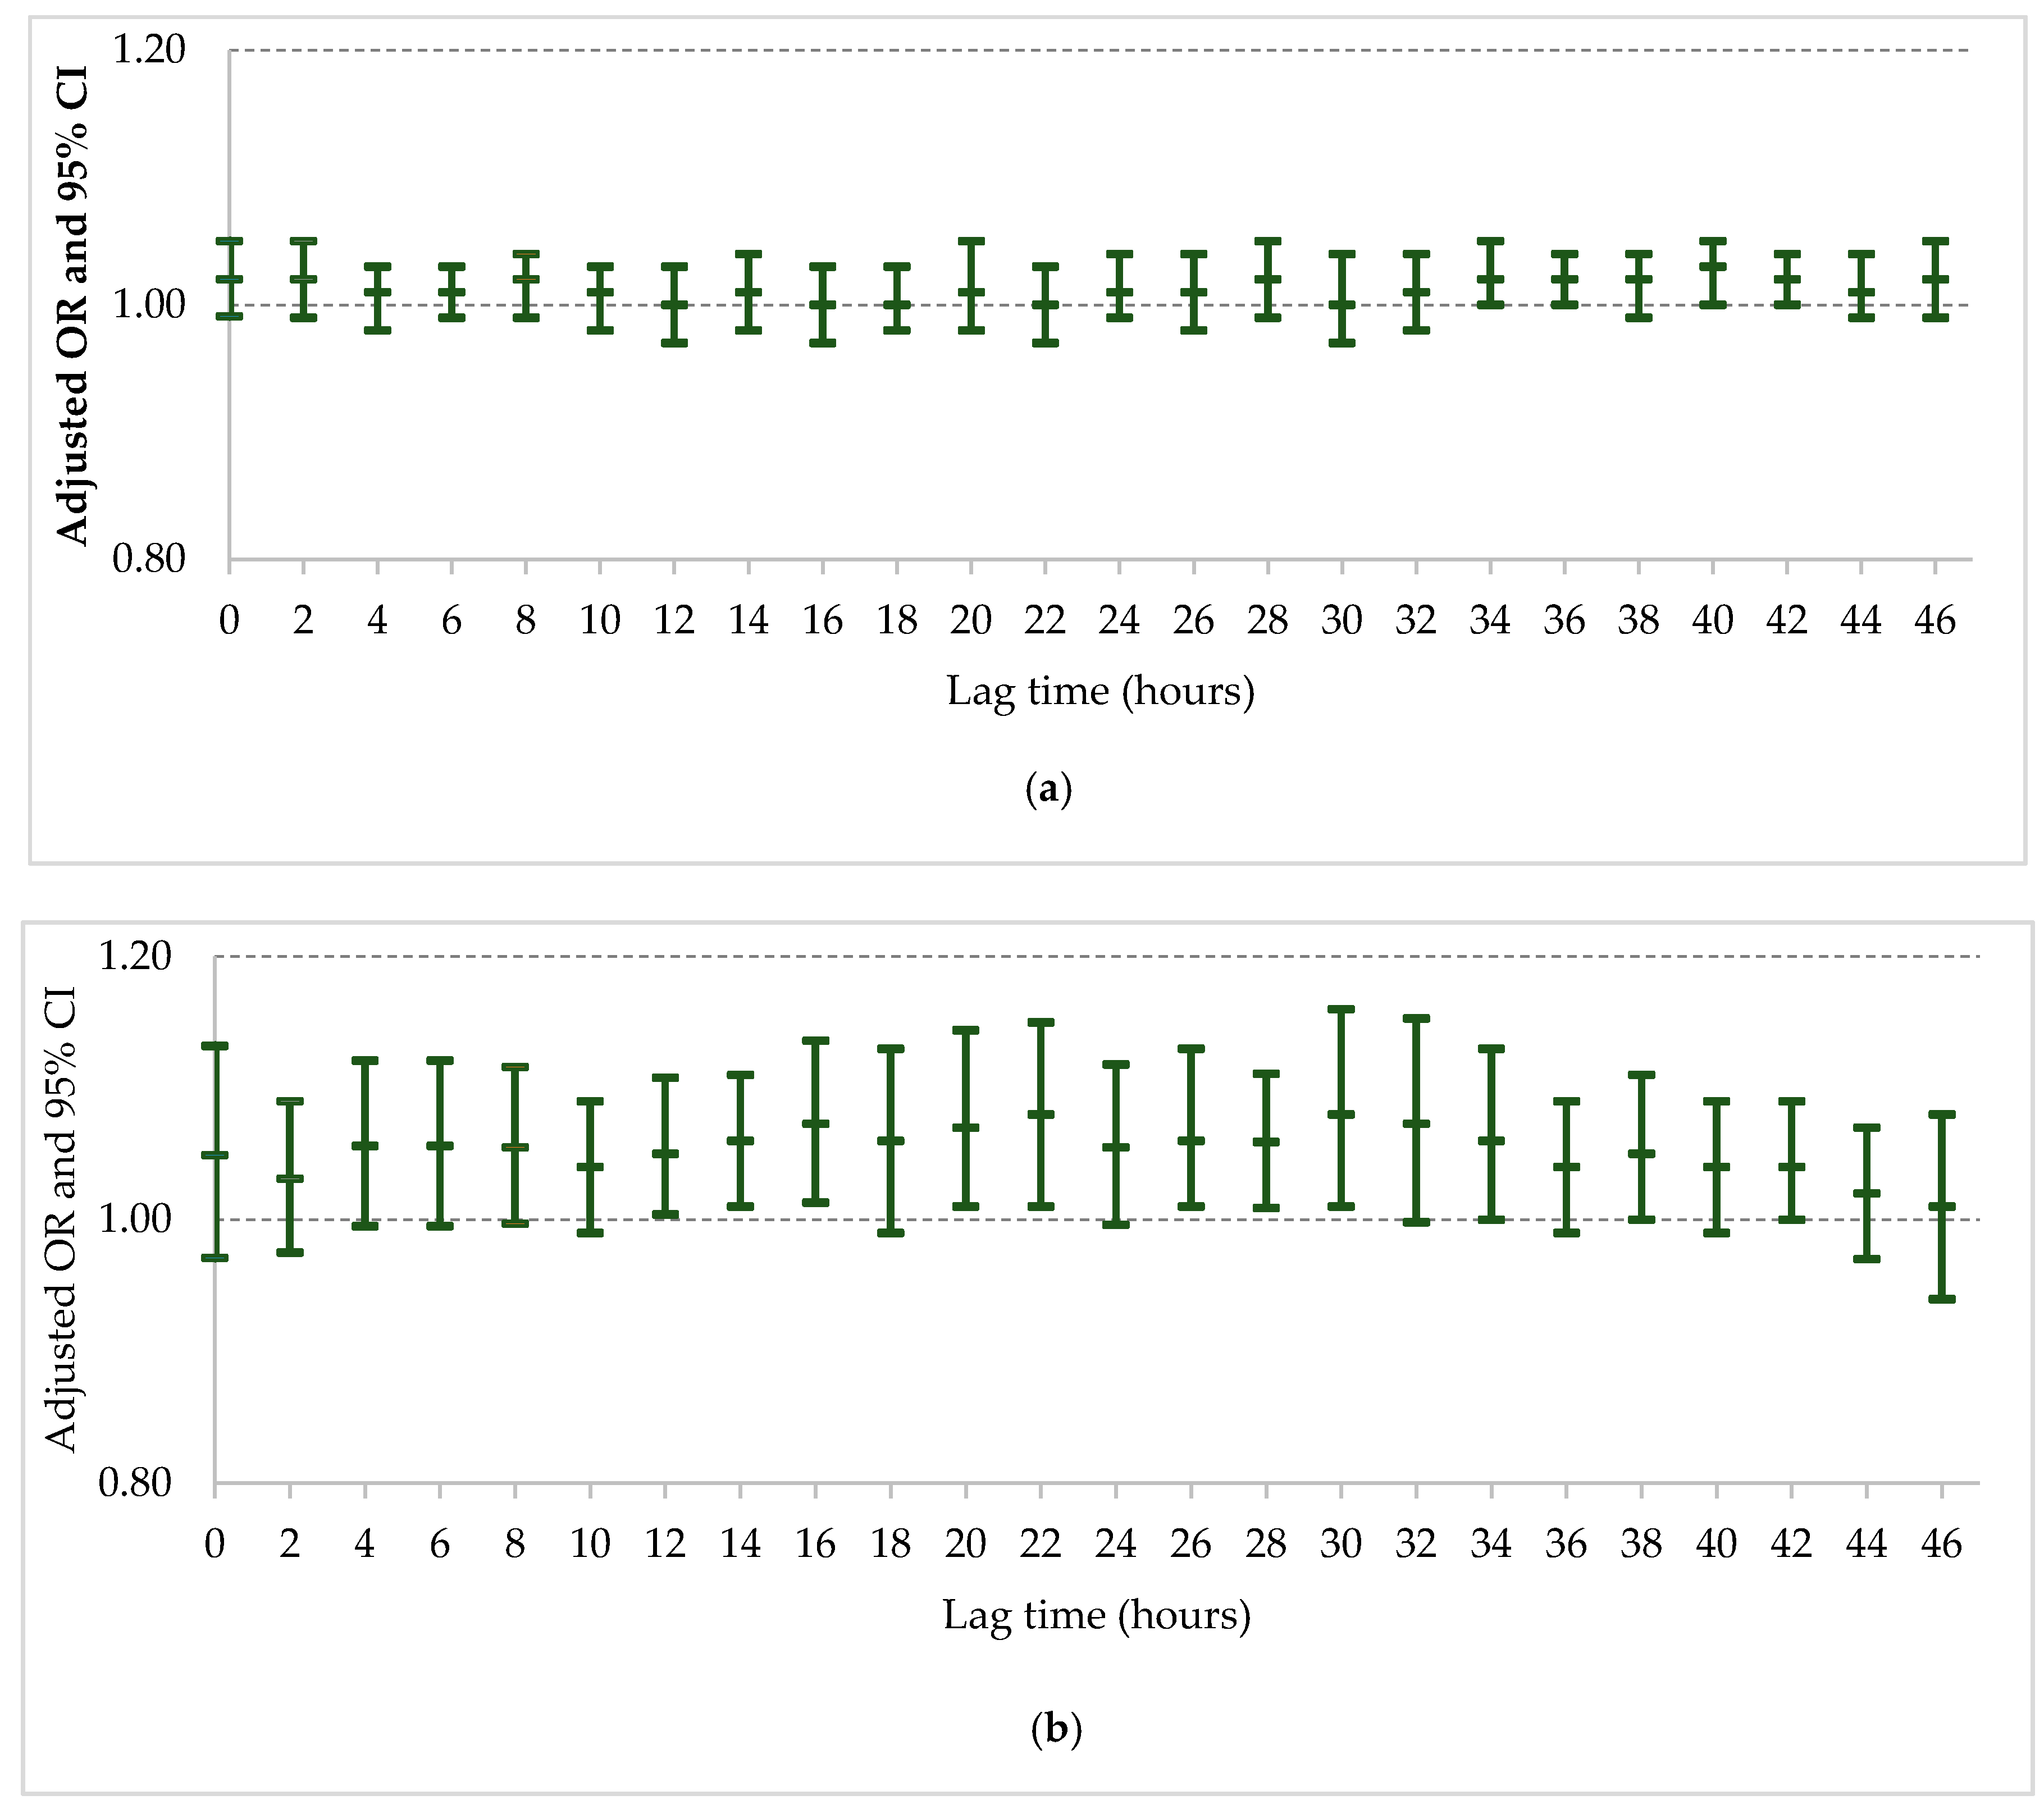
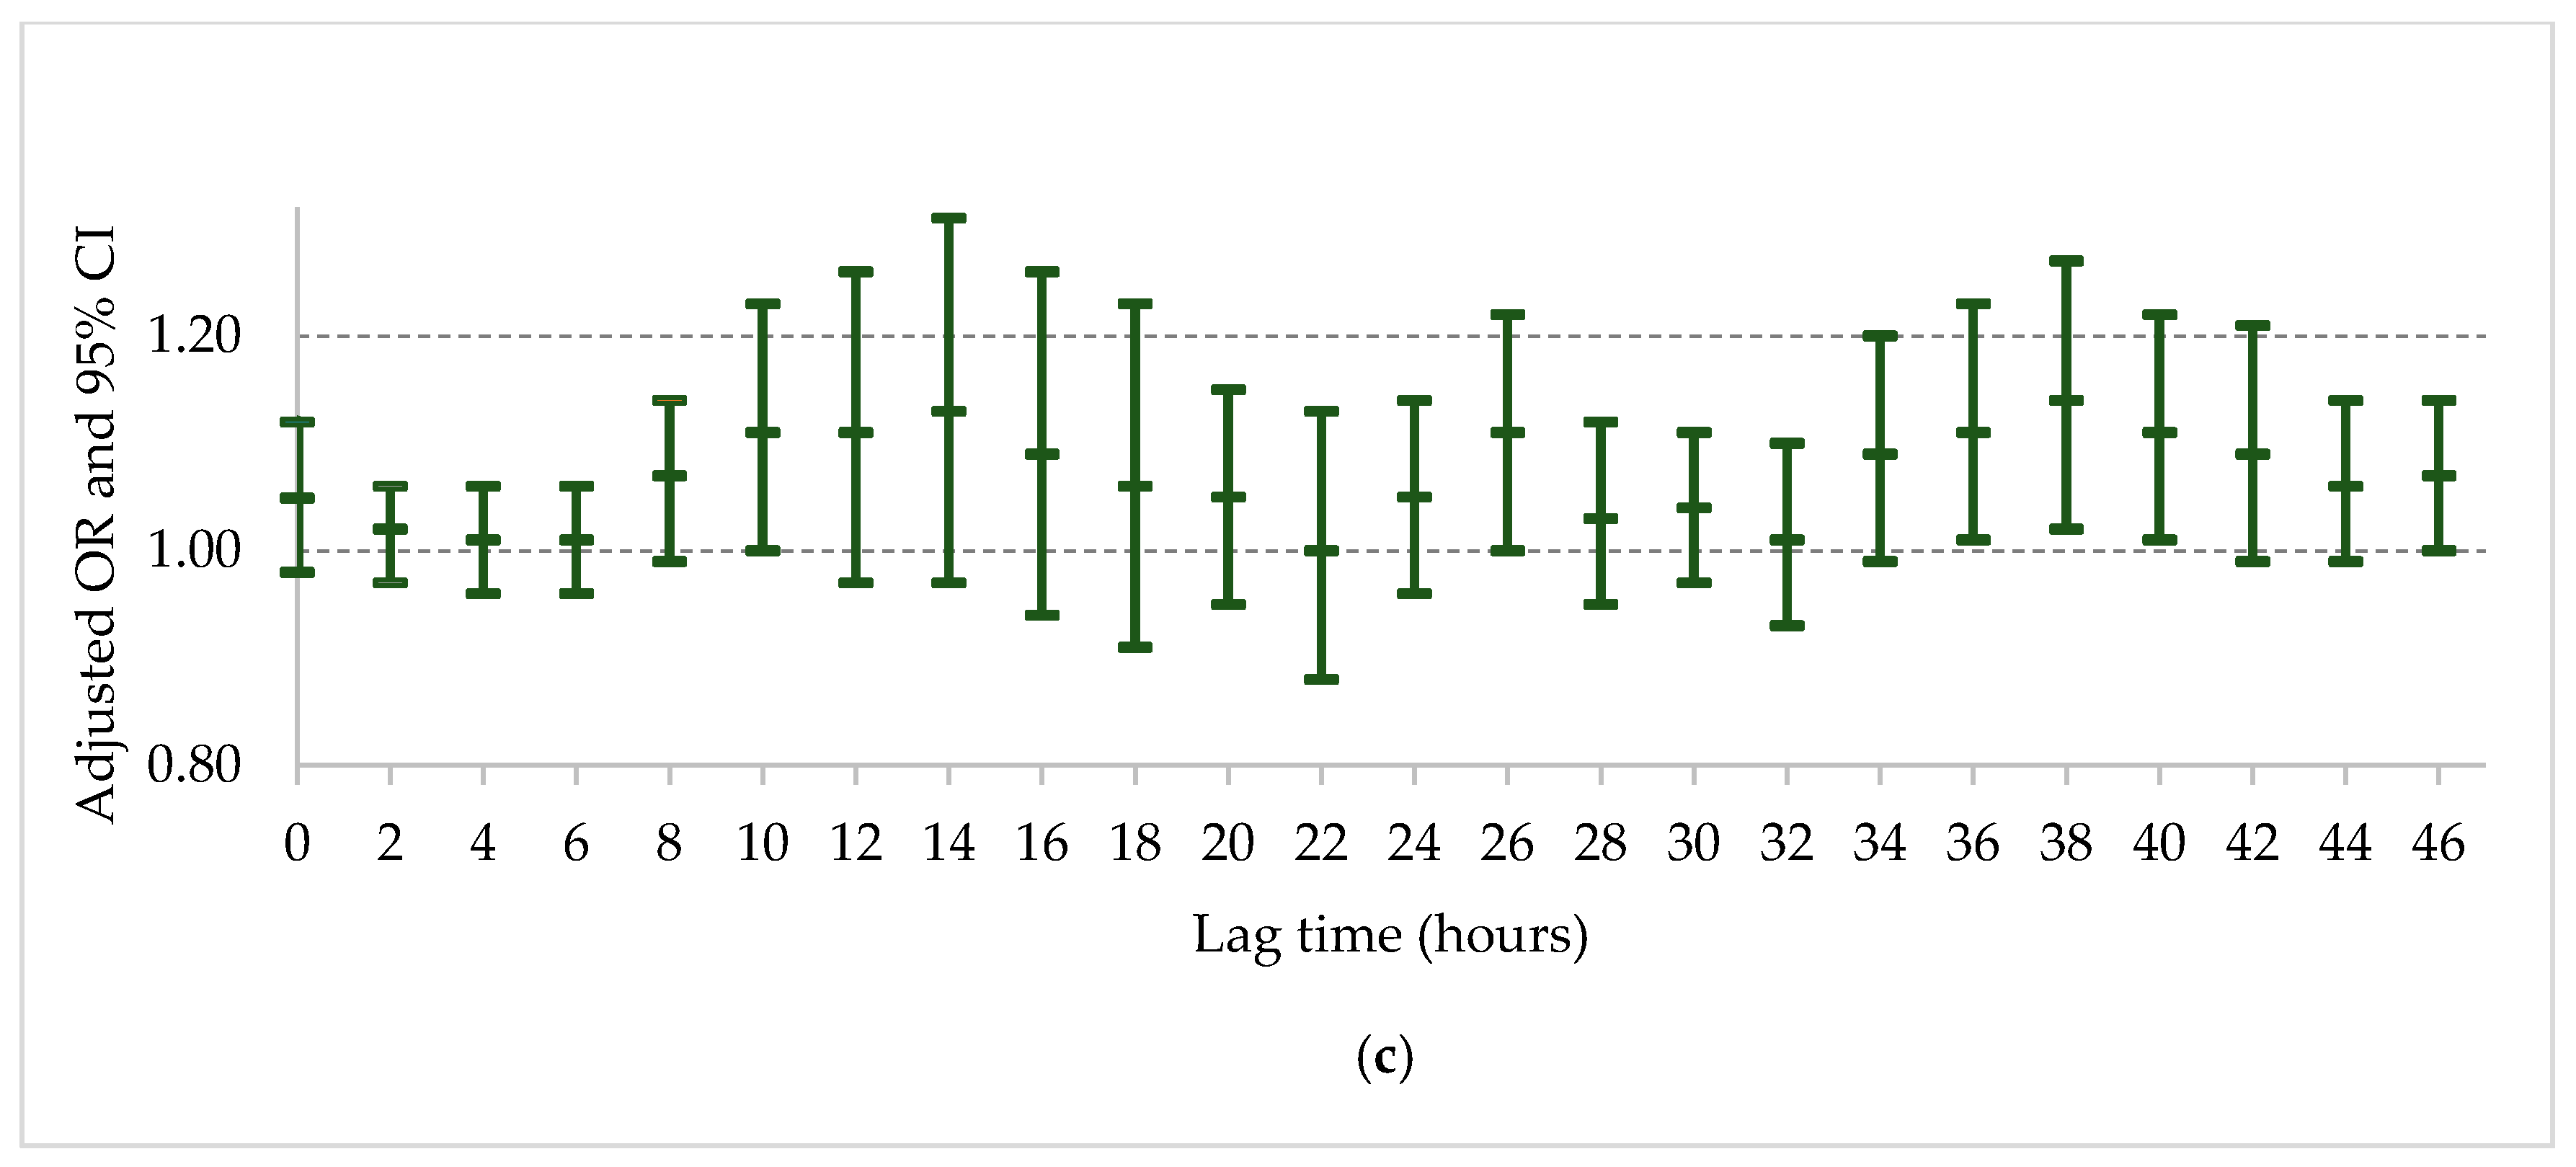
2.5. Statistical Analysis
2.6. Ethics
3. Results
4. Discussion
5. Conclusions
Author Contributions
Funding
Acknowledgments
Conflicts of Interest
References
- Reid, C.E.; Brauer, M.; Johnston, F.H.; Jerrett, M.; Balmes, J.R.; Elliott, C.T. Critical Review of Health Impacts of Wildfire Smoke Exposure. Environ. Health Perspect. 2016, 124, 1334–1343. [Google Scholar] [CrossRef] [PubMed]
- Cohen, A.J.; Brauer, M.; Burnett, R.; Anderson, H.R.; Frostad, J.; Estep, K.; Balakrishnan, K.; Brunekreef, B.; Dandona, L.; Dandona, R.; et al. Estimates and 25-year trends of the global burden of disease attributable to ambient air pollution: An analysis of data from the Global Burden of Diseases Study 2015. Lancet 2017, 389, 1907–1918. [Google Scholar] [CrossRef]
- Johnston, F.H.; Henderson, S.B.; Chen, Y.; Randerson, J.T.; Marlier, M.; Defries, R.S.; Kinney, P.; Bowman, D.M.; Brauer, M. Estimated global mortality attributable to smoke from landscape fires. Environ. Health Perspect. 2012, 120, 695–701. [Google Scholar] [CrossRef] [PubMed]
- Adetona, O.; Reinhardt, T.E.; Domitrovich, J.; Broyles, G.; Adetona, A.M.; Kleinman, M.T.; Ottmar, R.D.; Naeher, L.P. Review of the health effects of wildland fire smoke on wildland firefighters and the public. Inhal. Toxicol. 2016, 28, 95–139. [Google Scholar] [CrossRef] [PubMed]
- Haikerwal, A.; Reisen, F.; Sim, M.R.; Abramson, M.J.; Meyer, C.P.; Johnston, F.H.; Dennekamp, M. Impact of smoke from prescribed burning: Is it a public health concern? J. Air Waste Manag. Assoc. 2015, 65, 592–598. [Google Scholar] [CrossRef] [PubMed]
- Haikerwal, A.; Akram, M.; Del Monaco, A.; Smith, K.; Sim, M.R.; Meyer, M.; Tonkin, A.M.; Abramson, M.J.; Dennekamp, M. Impact of Fine Particulate Matter (PM2.5) Exposure During Wildfires on Cardiovascular Health Outcomes. J. Am. Heart Assoc. 2015, 4, e001653. [Google Scholar] [CrossRef] [PubMed]
- Johnston, F.H.; Purdie, S.; Jalaludin, B.; Martin, K.L.; Henderson, S.B.; Morgan, G.G. Air pollution events from forest fires and emergency department attendances in Sydney, Australia 1996–2007: A case-crossover analysis. Environ. Health 2014, 13, 105. [Google Scholar] [CrossRef] [PubMed]
- Cascio, W.E. Wildland fire smoke and human health. Sci. Total Environ. 2017, 624, 586–595. [Google Scholar] [CrossRef] [PubMed]
- Johnston, F.H. Understanding and managing the health impacts of poor air quality from landscape fires. Med. J. Aust. 2017, 207, 229–230. [Google Scholar] [CrossRef] [PubMed]
- Broome, R.A.; Fann, N.; Cristina, T.J.; Fulcher, C.; Duc, H.; Morgan, G.G. The health benefits of reducing air pollution in Sydney, Australia. Environ. Res. 2015, 143, 19–25. [Google Scholar] [CrossRef] [PubMed]
- GBD Compare: Deaths Attributable to Ambient Particulate Matter Pollution. Available online: https://vizhub.healthdata.org/gbd-compare/ (accessed on 15 April 2018).
- Straney, L.; Finn, J.; Dennekamp, M.; Bremner, A.; Tonkin, A.; Jacobs, I. Evaluating the impact of air pollution on the incidence of out-of-hospital cardiac arrest in the Perth Metropolitan Region: 2000–2010. J. Epidemiol. Community Health 2014, 68, 6–12. [Google Scholar] [CrossRef] [PubMed]
- Dennekamp, M.; Akram, M.; Abramson, M.J.; Tonkin, A.; Sim, M.R.; Fridman, M.; Erbas, B. Outdoor air pollution as a trigger for out-of-hospital cardiac arrests. Epidemiology 2010, 21, 494–500. [Google Scholar] [CrossRef] [PubMed]
- Dennekamp, M.; Straney, L.D.; Erbas, B.; Abramson, M.J.; Keywood, M.; Smith, K.; Sim, M.R.; Glass, D.C.; Del Monaco, A.; Haikerwal, A.; et al. Forest Fire Smoke Exposures and Out-of-Hospital Cardiac Arrests in Melbourne, Australia: A Case-Crossover Study. Environ. Health Perspect. 2015, 123, 959–964. [Google Scholar] [CrossRef] [PubMed]
- Salimi, F.; Henderson, S.B.; Morgan, G.G.; Jalaludin, B.; Johnston, F.H. Ambient particulate matter, landscape fire smoke, and emergency ambulance dispatches in Sydney, Australia. Environ. Int. 2017, 99, 208–212. [Google Scholar] [CrossRef] [PubMed]
- Michikawa, T.; Ueda, K.; Takeuchi, A.; Kinoshita, M.; Hayashi, H.; Ichinose, T.; Nitta, H. Impact of short-term exposure to fine particulate matter on emergency ambulance dispatches in Japan. J. Epidemiol. Community Health 2015, 69, 86–91. [Google Scholar] [CrossRef] [PubMed]
- Phung, V.L.H.; Ueda, K.; Kasaoka, S.; Seposo, X.; Tasmin, S.; Yonemochi, S.; Phosri, A.; Honda, A.; Takano, H.; Michikawa, T.; et al. Acute Effects of Ambient PM2.5 on All-Cause and Cause-Specific Emergency Ambulance Dispatches in Japan. Int. J. Environ. Res. Public Health 2018, 15, 307. [Google Scholar] [CrossRef] [PubMed]
- Youngquist, S.T.; Hood, C.H.; Hales, N.M.; Barton, C.C.; Madsen, T.E.; Arden Pope, C. Association between EMS calls and fine particulate air pollution in Utah. Air Qual. Atmos. Health 2016, 9, 887–897. [Google Scholar] [CrossRef]
- Liu, R.; Zeng, J.; Jiang, X.; Chen, J.; Gao, X.; Zhang, L.; Li, T. The relationship between airborne fine particle matter and emergency ambulance dispatches in a southwestern city in Chengdu, China. Environ. Pollut. 2017, 229, 661–667. [Google Scholar] [CrossRef] [PubMed]
- Zauli Sajani, S.; Alessandrini, E.; Marchesi, S.; Lauriola, P. Are day-to-day variations of airborne particles associated with emergency ambulance dispatches? Int. J. Occup. Environ. Health 2014, 20, 71–76. [Google Scholar] [CrossRef] [PubMed]
- Environment Protection Authority. Tasmanian Air Monitoring Report 2013; Environment Protection Authority: Hobart, Australia, 2014. [Google Scholar]
- Jaakkola, J.J. Case-crossover design in air pollution epidemiology. Eur. Respir. J. Suppl. 2003, 40, 81s–85s. [Google Scholar] [CrossRef] [PubMed]
- Graler, B.; Pemesma, E.; Heuvelink, G. Spatio-temporal interpolation using gstat. R. J. 2016, 8, 204–218. [Google Scholar]
- Clawson, J.; Olola, C.; Heward, A.; Patterson, B.; Scott, G. Profile of emergency medical dispatch calls for breathing problems within the medical priority dispatch system protocol. Prehosp. Disaster Med. 2008, 23, 412–419. [Google Scholar] [CrossRef] [PubMed]
- Atkinson, R.W.; Kang, S.; Anderson, H.R.; Mills, I.C.; Walton, H.A. Epidemiological time series studies of PM2.5 and daily mortality and hospital admissions: A systematic review and meta-analysis. Thorax 2014, 69, 660–665. [Google Scholar] [CrossRef] [PubMed]
- Cesaroni, G.; Forastiere, F.; Stafoggia, M.; Andersen, Z.J.; Badaloni, C.; Beelen, R.; Caracciolo, B.; de Faire, U.; Erbel, R.; Eriksen, K.T.; et al. Long term exposure to ambient air pollution and incidence of acute coronary events: Prospective cohort study and meta-analysis in 11 European cohorts from the ESCAPE Project. BMJ 2014, 348, f7412. [Google Scholar] [CrossRef] [PubMed]
- Guarnieri, M.; Balmes, J.R. Outdoor air pollution and asthma. Lancet 2014, 383, 1581–1592. [Google Scholar] [CrossRef]
- Shao, J.; Wheeler, A.J.; Chen, L.; Strandberg, B.; Hinwood, A.; Johnston, F.H.; Zosky, G.R. The pro-inflammatory effects of particulate matter on epithelial cells are associated with elemental composition. Chemosphere 2018, 202, 530–537. [Google Scholar] [CrossRef] [PubMed]
- Simkhovich, B.Z.; Kleinman, M.T.; Kloner, R.A. Air Pollution and Cardiovascular Injury: Epidemiology, Toxicology, and Mechanisms. J. Am. Coll. Cardiol. 2008, 52, 719–726. [Google Scholar] [CrossRef] [PubMed]
- Pradeau, C.; Rondeau, V.; Leveque, E.; Guernion, P.Y.; Tentillier, E.; Thicoipe, M.; Brochard, P. Air pollution and activation of mobile medical team for out-of-hospital cardiac arrest. Am. J. Emerg. Med. 2015, 33, 367–372. [Google Scholar] [CrossRef] [PubMed]
- Broome, R.A.; Johnston, F.H.; Horsley, J.; Morgan, G.G. A rapid assessment of the impact of hazard reduction burning around Sydney, May 2016. Med. J. Aust. 2016, 205, 407–408. [Google Scholar] [CrossRef] [PubMed]
- Environment and Communications References Committee. Responses to, and Lessons Learnt from, the January and February 2016 Bushfires in Remote Tasmanian Wilderness; The Senate: Canberra, Australia, 2016. [Google Scholar]
- White, C.; Remenyi, T.; McEvoy, D.; Trundle, A.; Corney, S. Tasmania State Natural Disaster Risk Assessment; University of Tasmania: Hobart, Australia, 2016. [Google Scholar]


| Cases | Tasmania | |
|---|---|---|
| Number (%) | Number (%) | |
| Total EAD | 14,476 (100) | NA |
| Median Age (Years) | 57 | 42 |
| Sex | ||
| Female | 7216 (49.8) | 255,728 (49.4) |
| Male | 7174 (49.6) | 261,860 (50.6) |
| Unspecified | 86 (0.6) | |
| Region | ||
| North | 3747 (26.0) | 143,537 (27.7) |
| Northwest | 3145 (21.8) | 111,566 (22.0) |
| South | 7513 (52.1) | 262,485 (50.7) |
| MPDS Category | Number (%) |
|---|---|
| Sick person | 1925 (13.3) |
| Chest pain (non-traumatic) | 1788 (12.4) |
| Falls | 1585 (10.9) |
| Breathing problems | 1292 (8.9) |
| Unconscious/fainting | 961 (6.6) |
| Abdominal pain/problems | 913 (6.3) |
| Evaluation—interfacility | 743 (5.1) |
| Traffic/transportation accidents | 579 (4.0) |
| Traumatic injury | 485 (3.4) |
| Convulsions/fitting | 446 (3.1) |
| Hemorrhage/lacerations | 421 (2.9) |
| Overdose/poisoning | 406 (2.8) |
| Stroke | 365 (2.5) |
| Psychiatric/abnormal behavior or suicidal | 350 (2.4) |
| Back pain | 333 (2.3) |
| Heart problems (non-chest pain) | 325 (2.2) |
| Allergies/envenomation | 323 (2.2) |
| Headache | 236 (1.6) |
| Unknown problem | 194 (1.3) |
| Assault/sexual attack | 187 (11.3) |
| Diabetic problems | 157 (1.1) |
| Cardiac or respiratory arrest/death | 128 (0.9) |
| Pregnancy/childbirth/miscarriage | 127 (0.9) |
| Other * | 207 (1.5) |
| Total | 14,476 |
| Dispatch Category | Number (%) | Same Day Lag (0–24 h) | 1 Day Lag (24–48 h) | ||||
|---|---|---|---|---|---|---|---|
| Odds Ratio | 95% CI | p-Value | Odds Ratio | 95% CI | p-Value | ||
| All causes | 14,476 (100) | 1.00 | 0.99–1.01 | 0.88 | 1.00 | 0.99–1.02 | 0.59 |
| Non-trauma causes | 9219 (63.7) | 0.99 | 0.98–1.01 | 0.37 | 1.00 | 0.98–1.01 | 0.77 |
| Chest pain (non-traumatic) | 1788 (12.4) | 0.98 | 0.95–1.02 | 0.34 | 0.99 | 0.95–1.03 | 0.49 |
| Breathing problems | 1292 (8.9) | 1.02 | 0.98–1.05 | 0.36 | 1.04 | 01.00–1.08 | 0.06 |
| Unconscious/fainting | 961 (6.6) | 0.99 | 0.95–1.03 | 0.59 | 0.99 | 0.95–1.04 | 0.70 |
| Stroke | 364 (2.5) | 1.10 | 1.02–1.19 | 0.01 | 1.10 | 1.02–1.18 | 0.02 |
| Heart problems (non-chest pain) | 325 (2.2) | 0.99 | 0.91–1.08 | 0.84 | 0.95 | 0.86–1.06 | 0.37 |
| Diabetic problems | 157 (1.1) | 1.07 | 0.96–1.18 | 0.21 | 1.10 | 0.99–1.22 | 0.08 |
| Cardiac or respiratory arrest/death | 128 (0.9) | 0.98 | 0.83–1.14 | 0.76 | 1.00 | 0.88–1.13 | 0.98 |
© 2018 by the authors. Licensee MDPI, Basel, Switzerland. This article is an open access article distributed under the terms and conditions of the Creative Commons Attribution (CC BY) license (http://creativecommons.org/licenses/by/4.0/).
Share and Cite
Edwards, L.J.; Williamson, G.; Williams, S.A.; Veitch, M.G.K.; Salimi, F.; Johnston, F.H. Did Fine Particulate Matter from the Summer 2016 Landscape Fires in Tasmania Increase Emergency Ambulance Dispatches? A Case Crossover Analysis. Fire 2018, 1, 26. https://doi.org/10.3390/fire1020026
Edwards LJ, Williamson G, Williams SA, Veitch MGK, Salimi F, Johnston FH. Did Fine Particulate Matter from the Summer 2016 Landscape Fires in Tasmania Increase Emergency Ambulance Dispatches? A Case Crossover Analysis. Fire. 2018; 1(2):26. https://doi.org/10.3390/fire1020026
Chicago/Turabian StyleEdwards, Laura J., Grant Williamson, Stephanie A. Williams, Mark G. K. Veitch, Farhad Salimi, and Fay H. Johnston. 2018. "Did Fine Particulate Matter from the Summer 2016 Landscape Fires in Tasmania Increase Emergency Ambulance Dispatches? A Case Crossover Analysis" Fire 1, no. 2: 26. https://doi.org/10.3390/fire1020026
APA StyleEdwards, L. J., Williamson, G., Williams, S. A., Veitch, M. G. K., Salimi, F., & Johnston, F. H. (2018). Did Fine Particulate Matter from the Summer 2016 Landscape Fires in Tasmania Increase Emergency Ambulance Dispatches? A Case Crossover Analysis. Fire, 1(2), 26. https://doi.org/10.3390/fire1020026