The 2017 North Bay and Southern California Fires: A Case Study


Abstract
:1. Introduction
2. Datasets
3. Overview of Fire Impacts and Progression
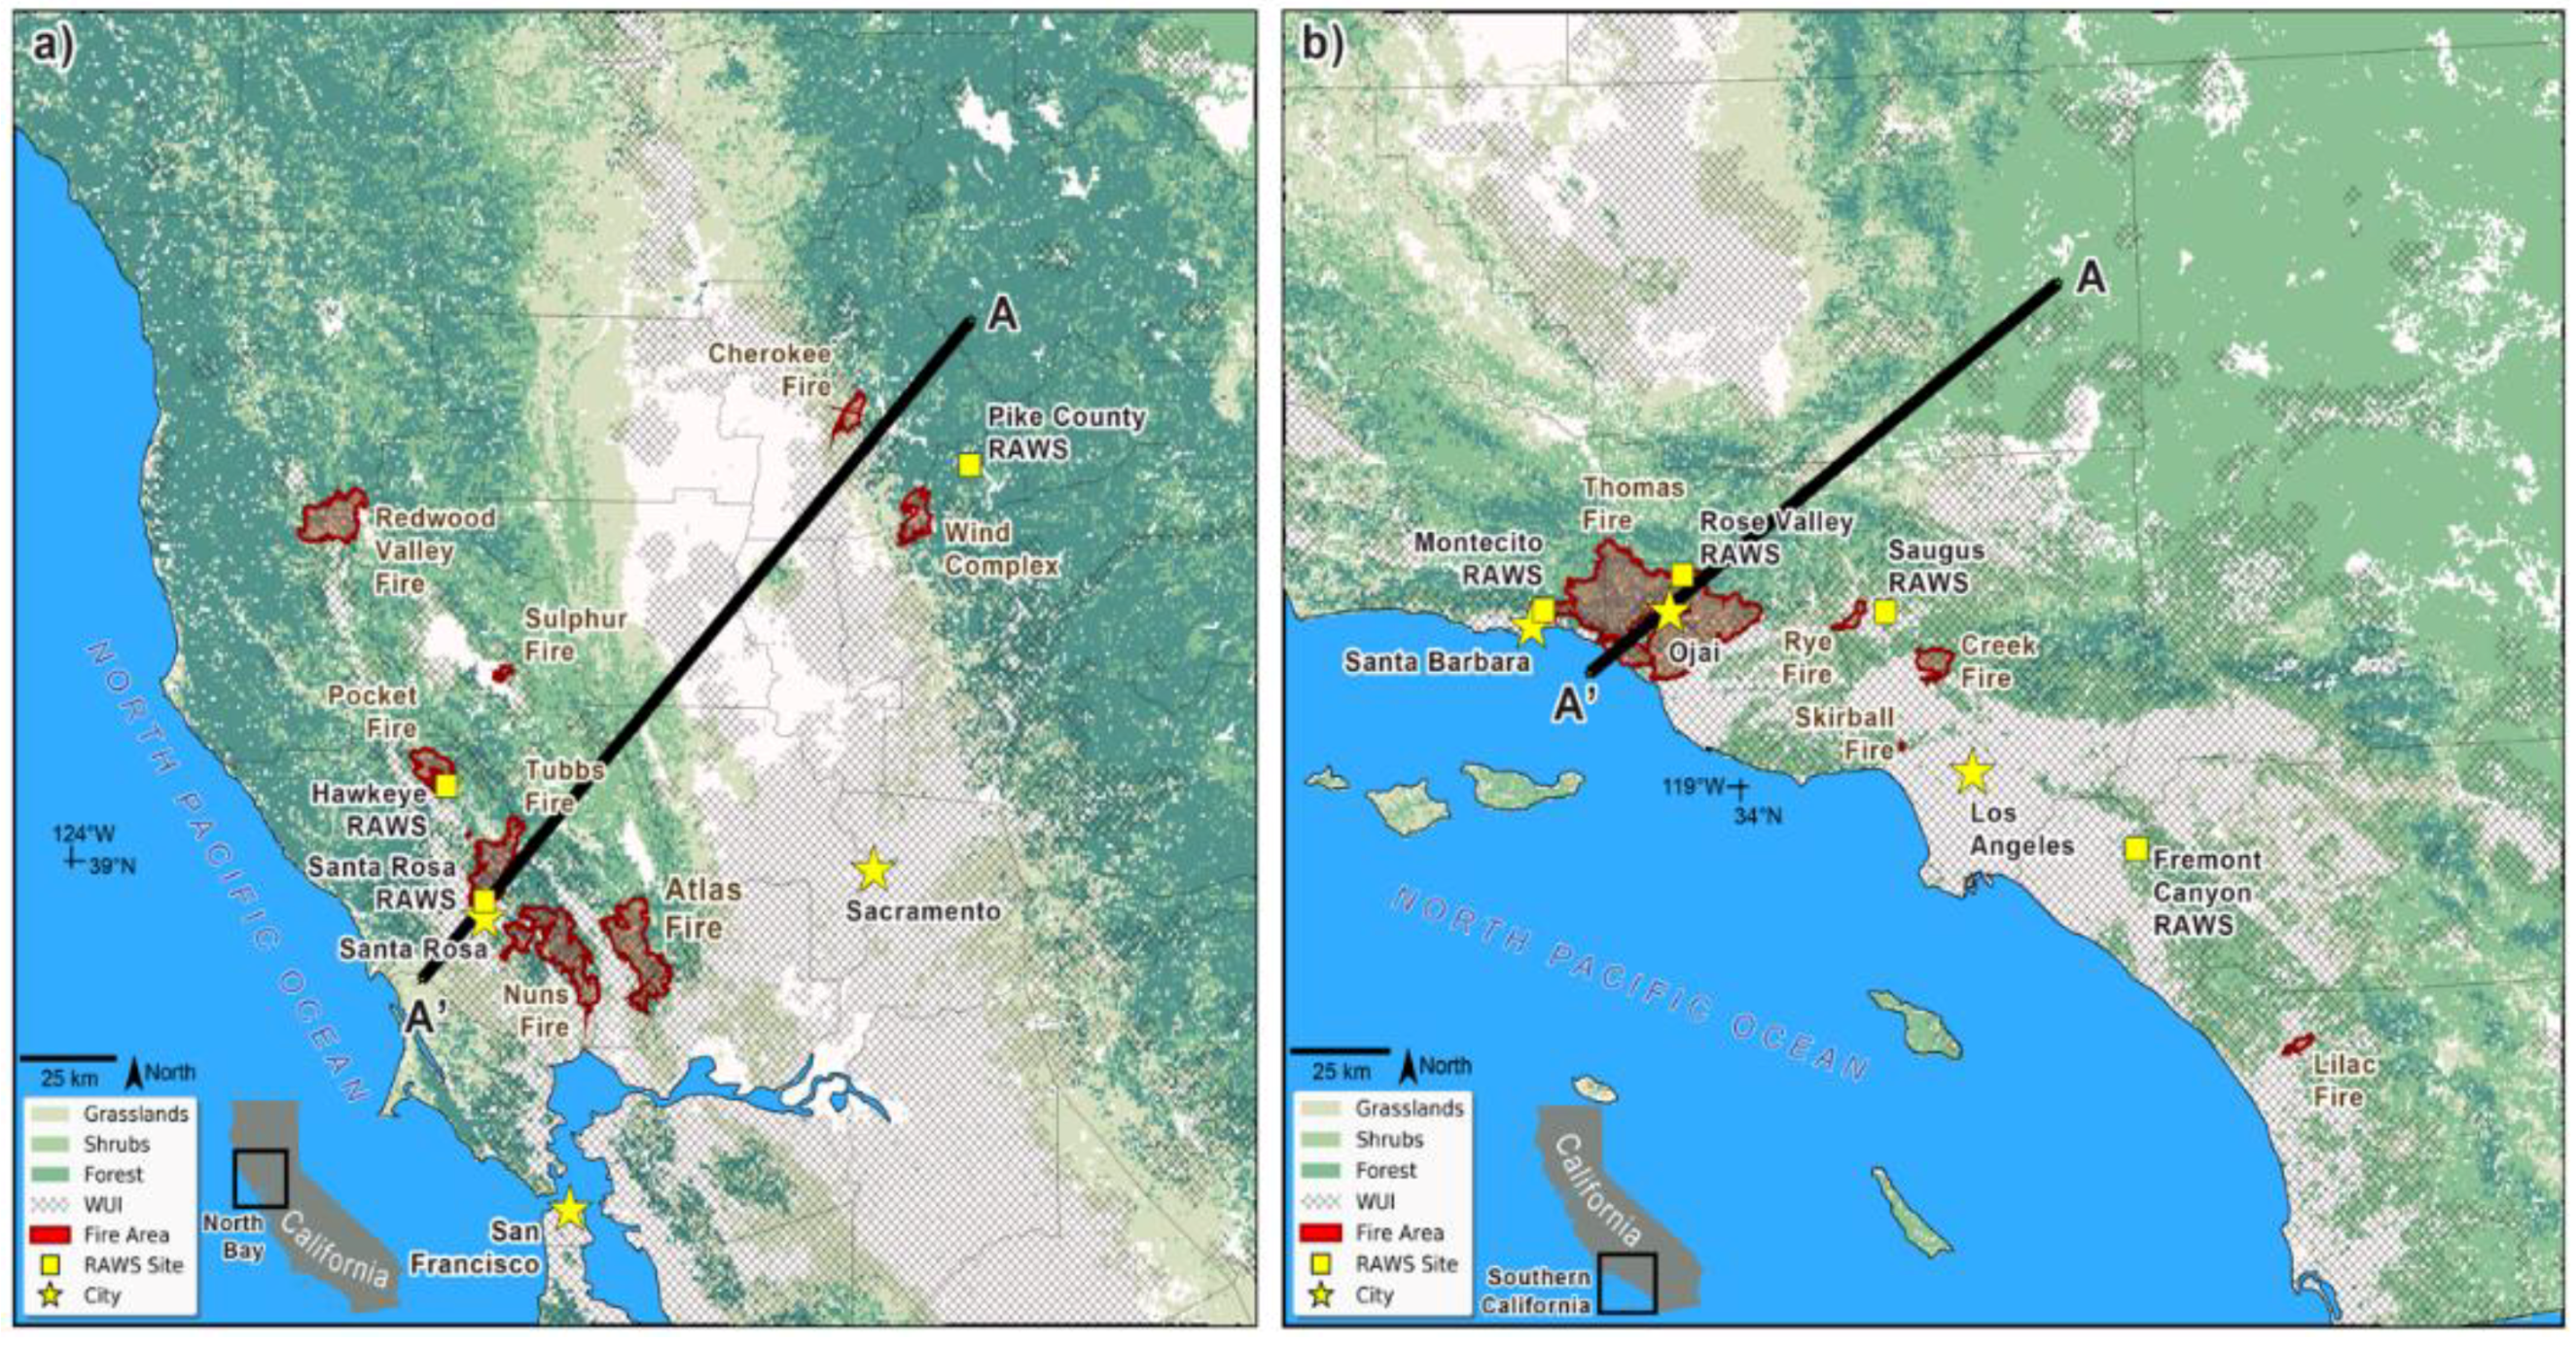
3.1. North Bay Fires
3.2. Southern California Fires
4. Meteorological Conditions
4.1. North Bay Fire Weather
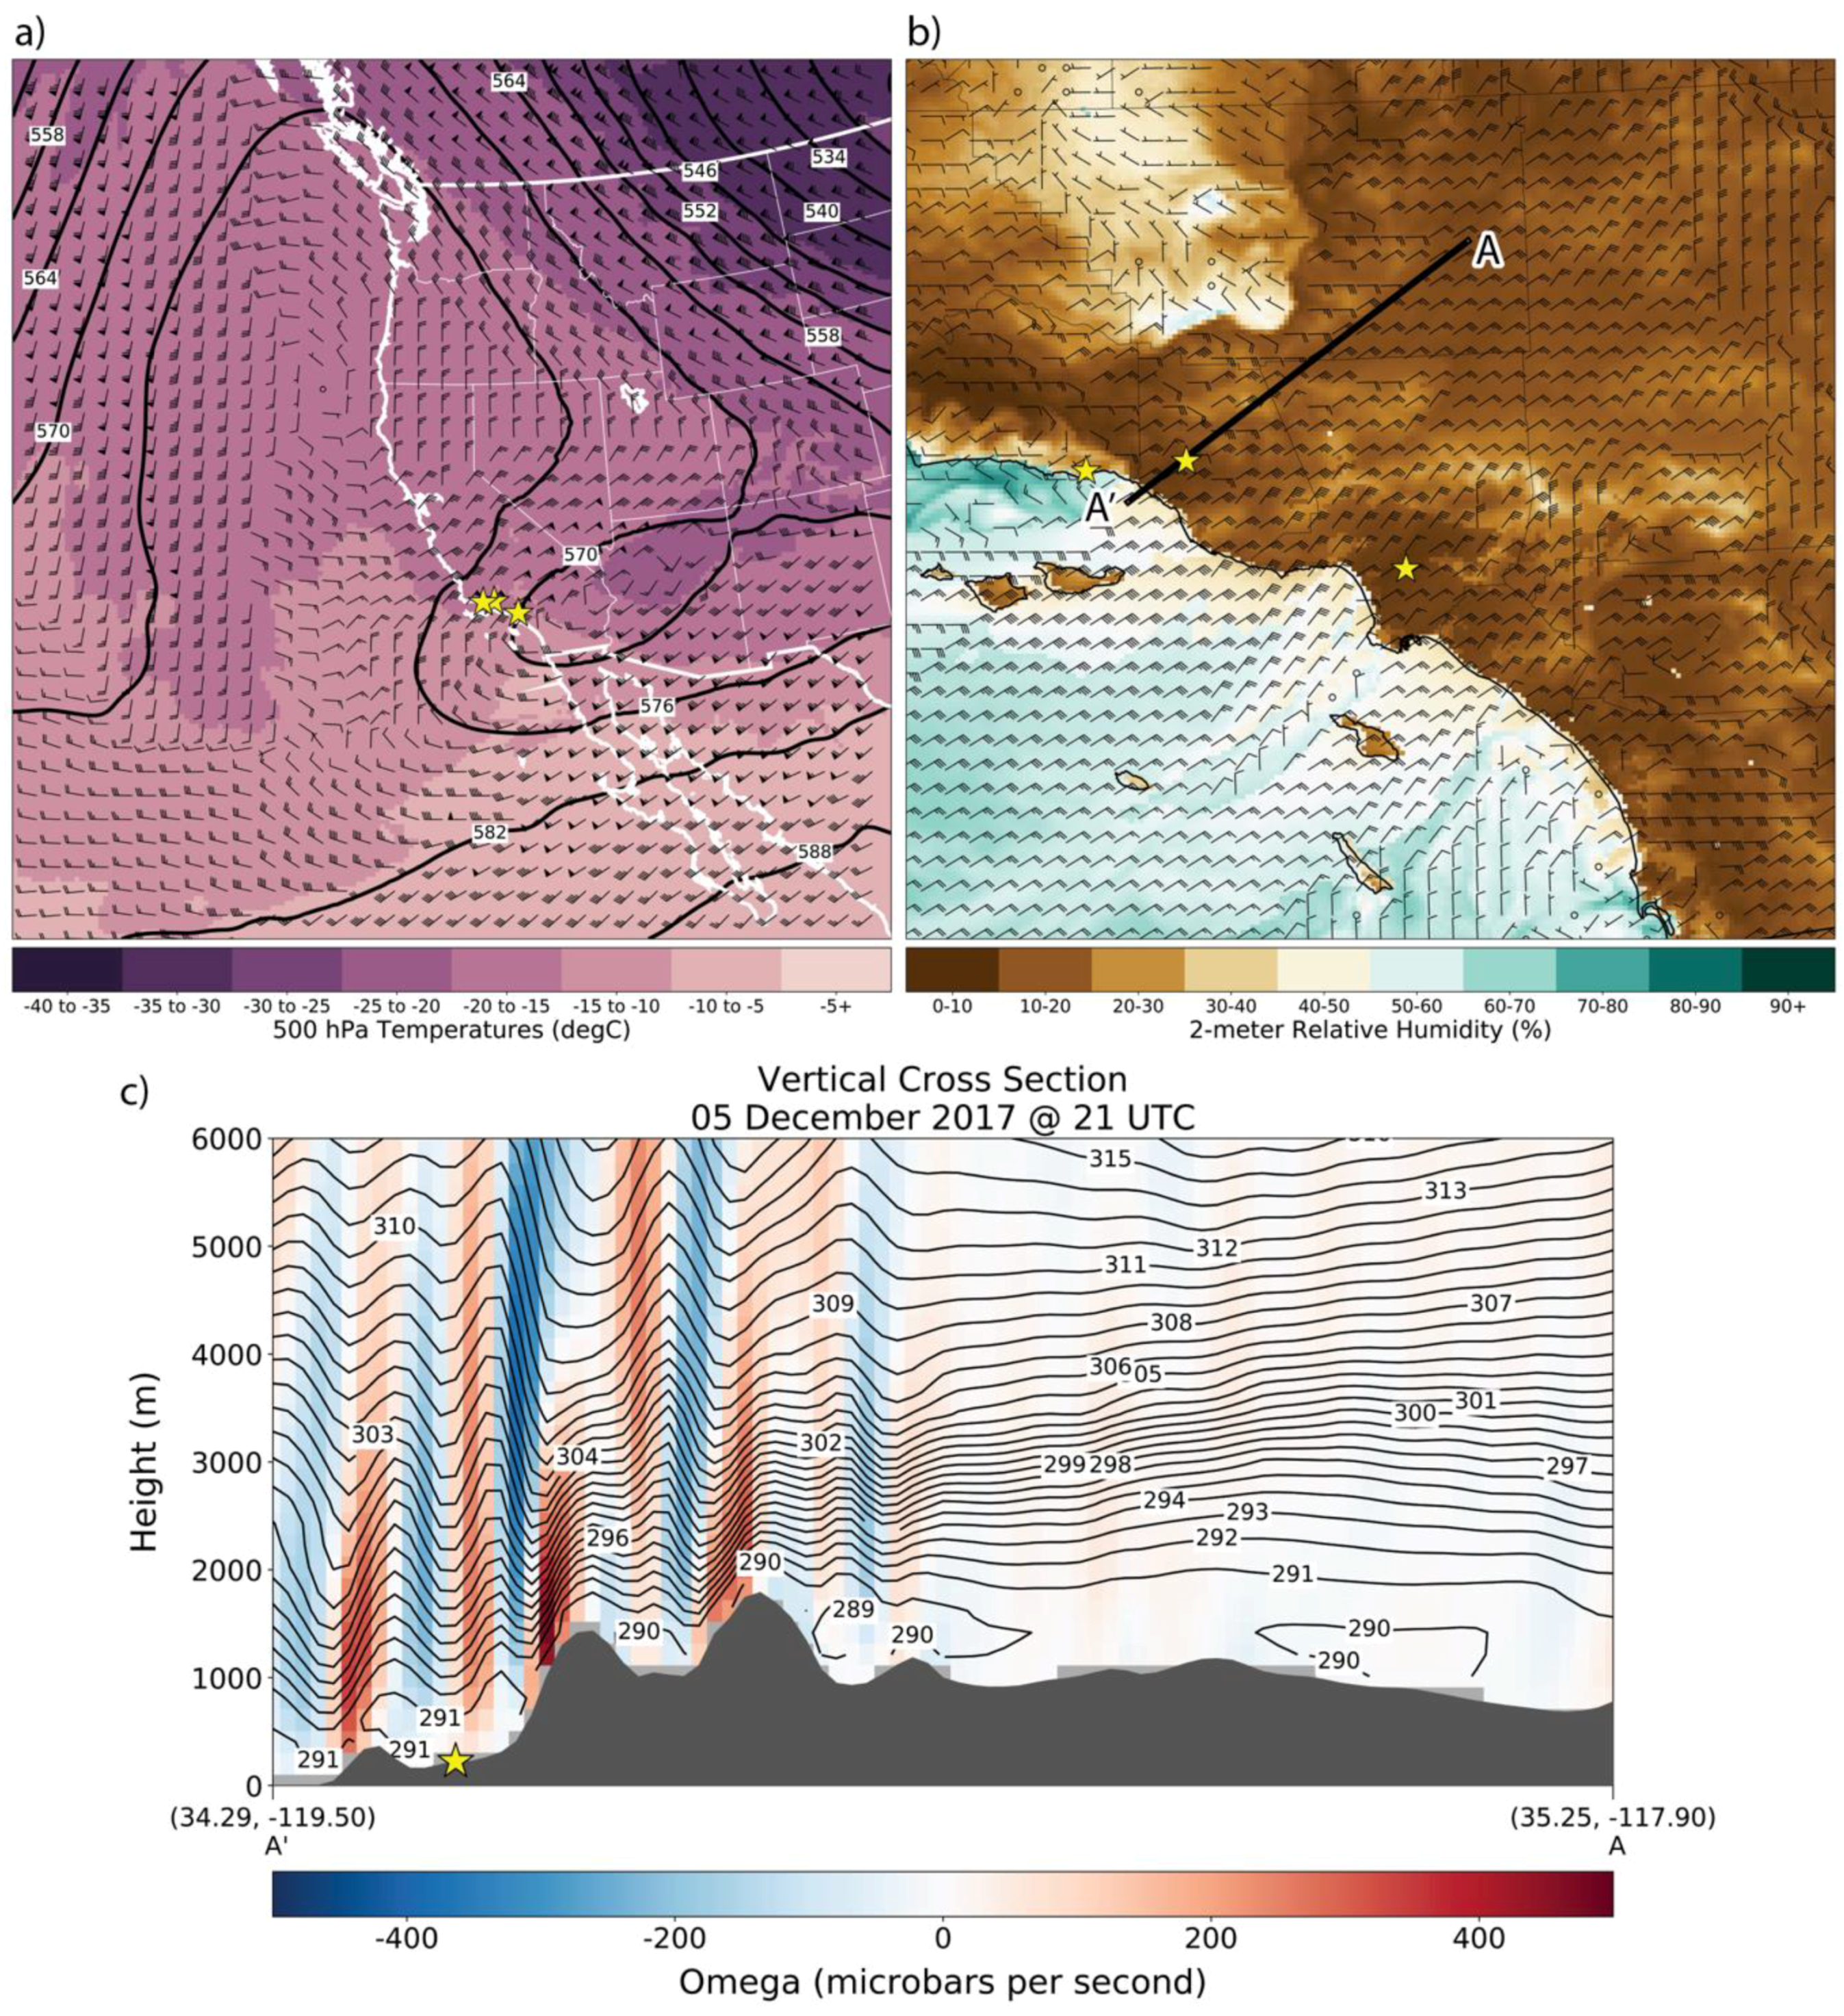
4.2. Southern California Fire Weather
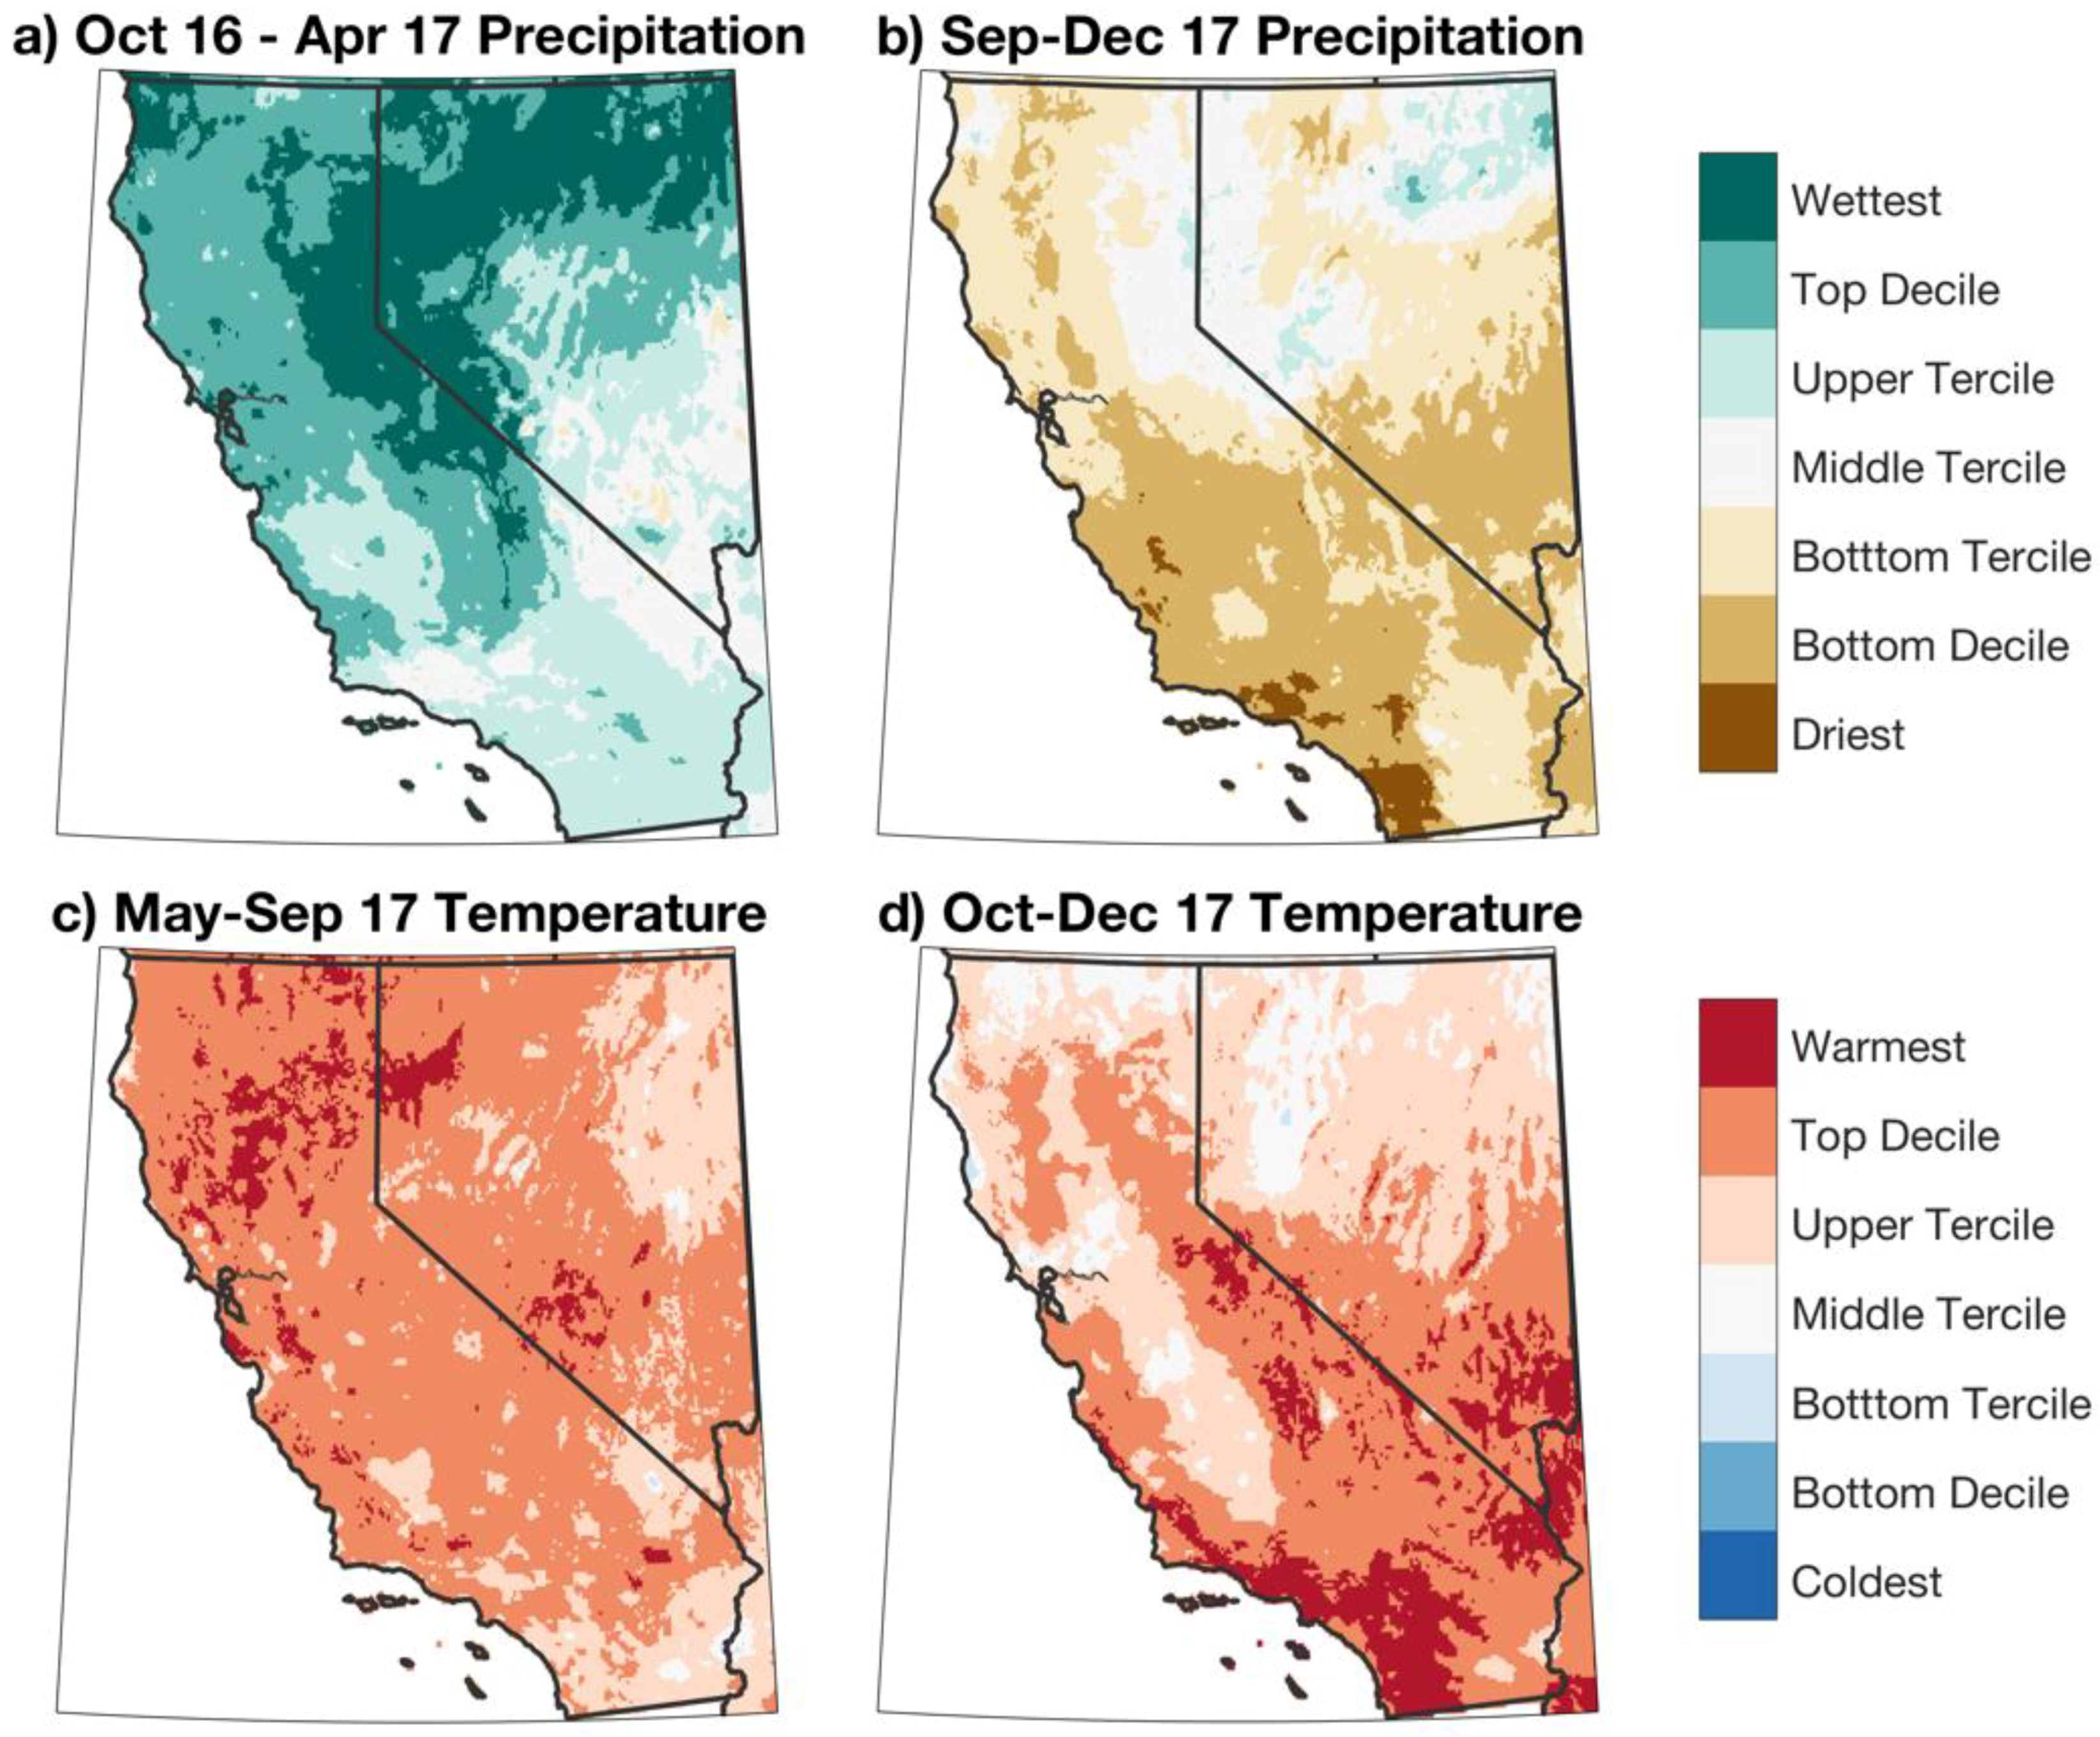
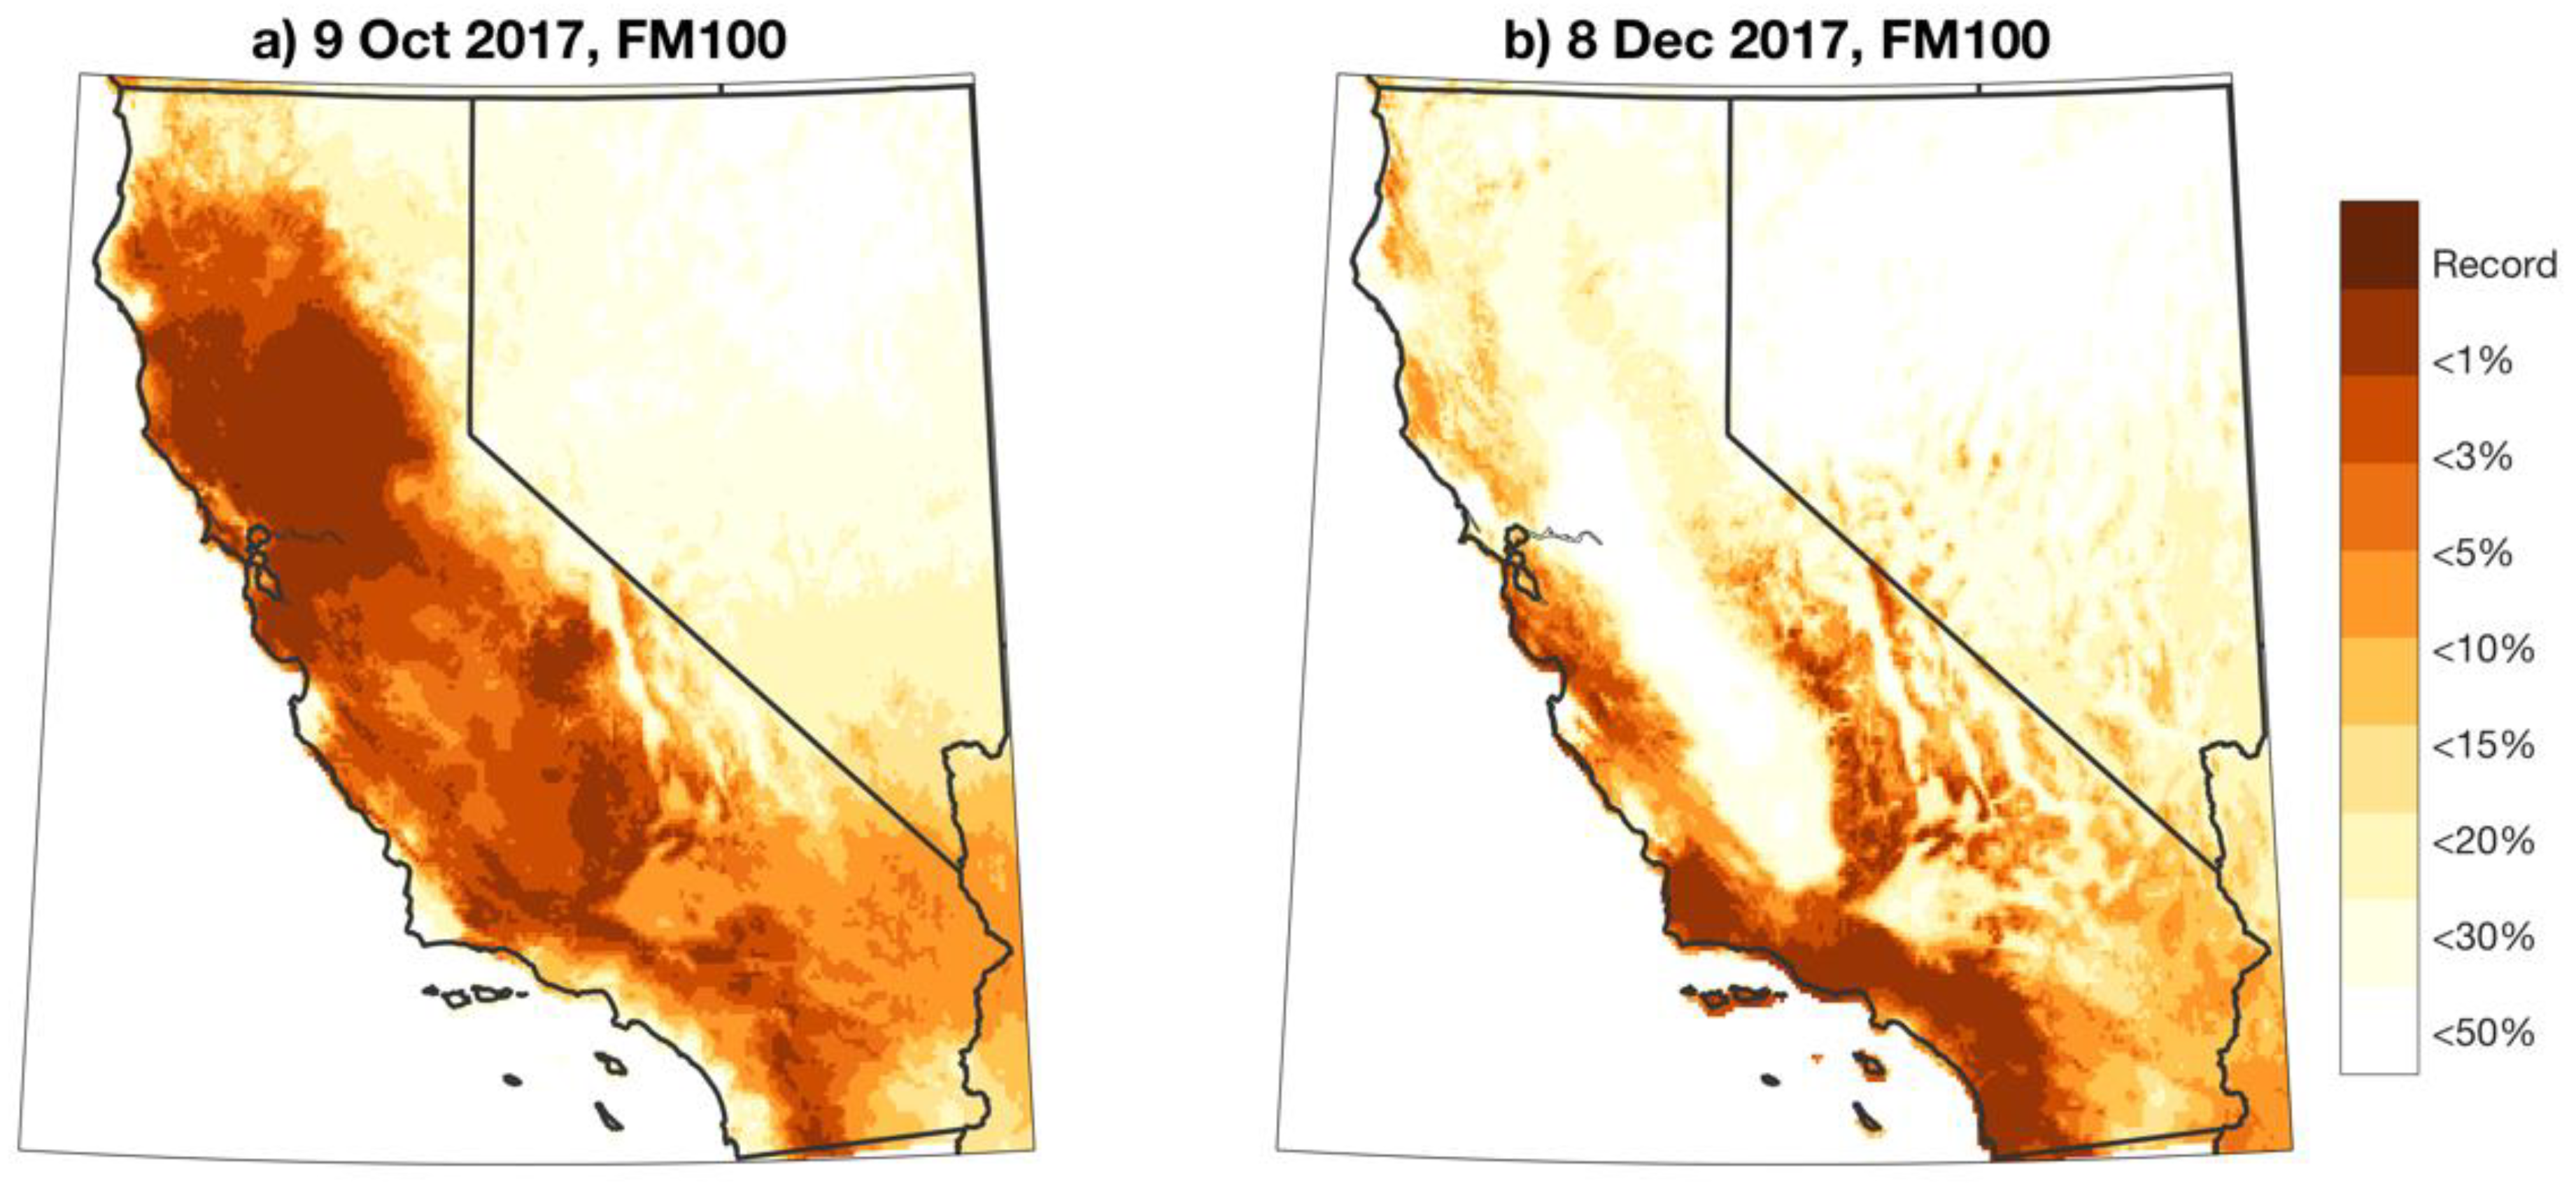
5. Climatic Basis
6. Summary and Conclusions
Supplementary Materials
Author Contributions
Acknowledgments
Conflicts of Interest
References
- Keeley, J.E.; Fotheringham, C.J.; Moritz, M.A. Lessons from the october 2003. Wildfires in Southern California. J. For. 2004, 102, 26–31. [Google Scholar] [CrossRef]
- Keeley, J.E.; Safford, H.; Fotheringham, C.J.; Franklin, J.; Moritz, M. The 2007 southern California wildfires: Lessons in complexity. J. For. 2009, 107, 287–296. [Google Scholar]
- Jin, Y.; Randerson, J.T.; Capps, S.; Hall, A.; Faivre, N.; Goulden, M.L. Contrasting controls on wildland fires in Southern California during periods with and without Santa Ana events. J. Geophys. Res. Biogeosci. 2014, 119, 432–450. [Google Scholar] [CrossRef]
- Moritz, M.A.; Moody, T.J.; Krawchuk, M.A.; Hughes, M.; Hall, A. Spatial variation in extreme winds predicts large wildfire locations in chaparral ecosystems. Geophys. Res. Lett. 2010, 37, L04801. [Google Scholar] [CrossRef]
- Werth, P.A.; Potter, B.E.; Clements, C.B.; Finney, M.; Goodrick, S.L.; Alexander, M.E.; Cruz, M.G.; Forthofer, J.A.; McAllister, S.S. Synthesis of Knowledge of Extreme Fire Behavior: Volume I for Fire Managers; United States Department of Agriculture: Portland, OR, USA, 2011; Volume PNW-GTR-85. [Google Scholar]
- Abatzoglou, J.T.; Barbero, R.; Nauslar, N.J. Diagnosing Santa Ana winds in Southern California with synoptic-scale analysis. Weather Forecast. 2013, 28, 704–710. [Google Scholar] [CrossRef]
- Syphard, A.D.; Radeloff, V.C.; Keuler, N.S.; Taylor, R.S.; Hawbaker, T.J.; Stewart, S.I.; Clayton, M.K. Predicting spatial patterns of fire on a southern California landscape. Int. J. Wildl. Fire 2008, 17, 602–613. [Google Scholar] [CrossRef]
- Radeloff, V.C.; Hammer, R.B.; Stewart, S.I.; Fried, J.S.; Holcomb, S.S.; McKeefry, J.F. The wildland–urban interface in the United States. Ecol. Appl. 2005, 15, 799–805. [Google Scholar] [CrossRef]
- Radeloff, V.C.; Helmers, D.P.; Kramer, H.A.; Mockrin, M.H.; Alexandre, P.M.; Bar-Massada, A.; Butsic, V.; Hawbaker, T.J.; Martinuzzi, S.; Syphard, A.D.; et al. Rapid growth of the US wildland-urban interface raises wildfire risk. Proc. Natl. Acad. Sci. USA 2018. [Google Scholar] [CrossRef] [PubMed]
- Hammer, R.B.; Stewart, S.I.; Radeloff, V.C. Demographic trends, the wildland–urban interface, and wildfire management. Soc. Nat. Resour. 2009, 22, 777–782. [Google Scholar] [CrossRef]
- Keeley, J.E.; Fotheringham, C.J. Historic fire regime in southern California shrublands. Conserv. Biol. 2001, 15, 1536–1548. [Google Scholar] [CrossRef]
- Moritz, M.A. Spatiotemporal analysis of controls of shrubland fire regimes: Age dependency and fire hazard. Ecology 2003, 84, 351–361. [Google Scholar] [CrossRef]
- United States Department of Agriculture Forest Service. The Rising Cost of Wildfire Operations: Effects on the Forest Service’s Non-Fire Work; 2015. Available online: https://www.fs.fed.us/sites/default/files/2015-Fire-Budget-Report.pdf (accessed on 25 May 2018).
- Dennison, P.; Brewer, S.; Arnold, J.; Moritz, M. Large wildfire trends in the western United States, 1984–2011. Geophys. Res. Lett. 2014, 41, 2928–2933. [Google Scholar] [CrossRef]
- Abatzoglou, J.T.; Williams, A.P. Impact of anthropogenic climate change on wildfire across western US forests. Proc. Natl. Acad. Sci. USA 2016, 113, 11770–11775. [Google Scholar] [CrossRef] [PubMed] [Green Version]
- Syphard, A.D.; Keeley, J.E.; Abatzoglou, J.T. Trends and drivers of fire activity vary across California aridland ecosystems. J. Arid Environ. 2017, 144, 110–122. [Google Scholar] [CrossRef]
- Keeley, J.E.; Syphard, A.D. Different historical fire–climate patterns in California. Int. J. Wildl. Fire 2017, 26, 253–268. [Google Scholar] [CrossRef]
- Balch, J.K.; Bradley, B.A.; Abatzoglou, J.T.; Nagy, R.C.; Fusco, E.J.; Mahood, A.L. Human-started wildfires expand the fire niche across the United States. Proc. Natl. Acad. Sci. USA 2017, 114, 2946–2951. [Google Scholar] [CrossRef] [PubMed]
- Syphard, A.D.; Keeley, J.E.; Pfaff, A.H.; Ferschweiler, K. Human presence diminishes the importance of climate in driving fire activity across the United States. Proc. Natl. Acad. Sci. USA 2017, 114, 13750–13755. [Google Scholar] [CrossRef] [PubMed]
- Abatzoglou, J.T.; Kolden, C.A. Relationships between climate and macroscale area burned in the western United States. Int. J. Wildl. Fire 2013, 22, 1003–1020. [Google Scholar] [CrossRef]
- Williams, A.P.; Gentine, P.; Moritz, M.A.; Roberts, D.; Abatzoglou, J.T. Effect of reduced summer cloud shading on evaporative demand and wildfire in coastal southern California. Geophys. Res. Lett. 2018. [Google Scholar] [CrossRef]
- Pausas, J.G.; Ribeiro, E. The global fire–productivity relationship. Glob. Ecol. Biogeogr. 2013, 22, 728–736. [Google Scholar] [CrossRef]
- McKenzie, D.; Littell, J.S. Climate change and the eco-hydrology of fire: Will area burned increase in a warming western U.S.? Ecol. Appl. 2017, 27, 26–36. [Google Scholar] [CrossRef] [PubMed]
- National Interagecy Fire Center. Total Wildland Fires and Acres (1960–2017); National Interagecy Fire Center: Boise, ID, USA, 2017. [Google Scholar]
- Abatzoglou, J.T.; McEvoy, D.J.; Redmond, K.T. The West Wide Drought Tracker: Drought Monitoring at Fine Spatial Scales. Bull. Am. Meteorol. Soc. 2017, 98, 1815–1820. [Google Scholar] [CrossRef]
- Balch, J.K.; Schoennagel, T.; Williams, A.P.; Abatzoglou, J.T.; Cattau, M.; Mietkiewicz, N.; St. Denis, L. Switching on the big burn of 2017. Fire 2018, 1. [Google Scholar] [CrossRef]
- Tedim, F.; Leone, V.; Amraoui, M.; Bouillon, C.; Coughlan, R.M.; Delogu, M.G.; Fernandes, M.P.; Ferreira, C.; McCaffrey, S.; McGee, K.T.; et al. Defining Extreme Wildfire Events: Difficulties, Challenges, and Impacts. Fire 2018, 1. [Google Scholar] [CrossRef]
- Homer, C.; Dewitz, J.; Yang, L.; Jin, S.; Danielson, P.; Xian, G.; Coulston, J.; Herold, N.; Wickham, J.; Megown, K. Completion of the 2011 National Land Cover Database for the conterminous United States–Representing a decade of land cover change information. Photogramm. Eng. Remote Sens. 2015, 81, 345–354. [Google Scholar] [CrossRef]
- National Interagecy Fire Center. Remote Automated Weather Stations. Available online: https://raws.nifc.gov (accessed on 28 May 2018).
- Western Regional Climate Center. Bangor RAWS. Available online: https://wrcc.dri.edu/cgi-bin/rawMAIN.pl?caCBGR (accessed on 28 May 2018).
- Daly, C.; Halbleib, M.; Smith, J.I.; Gibson, W.P.; Doggett, M.K.; Taylor, G.H.; Curtis, J.; Pasteris, P.P. Physiographically sensitive mapping of climatological temperature and precipitation across the conterminous United States. Int. J. Climatol. 2008, 28, 2031–2064. [Google Scholar] [CrossRef] [Green Version]
- Abatzoglou, J.T. Development of gridded surface meteorological data for ecological applications and modelling. Int. J. Climatol. 2013, 33, 121–131. [Google Scholar] [CrossRef]
- CAL FIRE Incident Information. Available online: http://cdfdata.fire.ca.gov/incidents/ (accessed on 24 February 2018).
- CAL FIRE Top 20 Deadliest California Wildfires. Available online: http://calfire.ca.gov/communications/downloads/fact_sheets/Top20_Deadliest.pdf (accessed on 24 February 2018).
- CAL FIRE Top 20 Most Destructive California Wildfires. Available online: http://www.fire.ca.gov/communications/downloads/fact_sheets/Top20_Destruction.pdf (accessed on 24 February 2018).
- National Weather Service. National Weather Service Instruction 10-401. Fire Weather Services Product Specification. Available online: http://www.nws.noaa.gov/directives/sym/pd01004001curr.pdf (accessed on 28 May 2018).
- National Interagecy Coordination Center. Incident Management Situation Report Archives; National Interagency Coordination Center: Boise, ID, USA, 2018. Available online: https://www.predictiveservices.nifc.gov/intelligence/archive.htm (accessed on 24 May 2018).
- Kasler, D. Wine country wildfires costs now top $9 billion, costliest in California’s history. The Sacramento Bee 2017. [Google Scholar]
- Watkins, D.; Griggs, T.; Lee, J.C.; Park, Haeyoun, S.A.; Wallace, T.; Ward, T. How California’s Most Destructive Wildfire Spread, Hour by Hour. Available online: https://www.nytimes.com/interactive/2017/10/21/us/california-fire-damage-map.html (accessed on 21 February 2018).
- Oakley, N.S.; Lancaster, J.T.; Kaplan, M.L.; Ralph, F.M. Synoptic conditions associated with cool season post-fire debris flows in the Transverse Ranges of southern California. Nat. Hazards 2017, 88, 327–354. [Google Scholar] [CrossRef] [Green Version]
- Livingston, M.; Grad, S. California’s Largest on Record, Finally 100% Contained. Available online: http://www.latimes.com/local/lanow/la-me-thomas-fire-contained-20180112-story.html (accessed on 21 February 2018).
- Clark, T.L.; Farley, R.D. Severe downslope windstorm calculations in two and three spatial dimensions using anelastic interactive grid nesting: A possible mechanism for gustiness. J. Atmos. Sci. 1984, 41, 329–350. [Google Scholar] [CrossRef]
- Smith, R.B. On severe downslope winds. J. Atmos. Sci. 1985, 42, 2597–2603. [Google Scholar] [CrossRef]
- CANSAC. CANSAC Model Output. Available online: https://cansac.dri.edu (accessed on 10 February 2018).
- Hatchett, B.J.; Smith, C.M.; Nauslar, N.J.; Kaplan, M.L. Brief Communication: Synoptic-scale differences between Sundowner and Santa Ana wind regimes in the Santa Ynez Mountains, California. Nat. Hazards Earth Syst. Sci. 2018, 18, 419. [Google Scholar] [CrossRef]
- Blier, W. The sundowner winds of Santa Barbara, California. Weather Forecast. 1998, 13, 702–716. [Google Scholar] [CrossRef]
- Horel, J.D.; Dong, X. An evaluation of the distribution of Remote Automated Weather Stations (RAWS). J. Appl. Meteorol. Climatol. 2010, 49, 1563–1578. [Google Scholar] [CrossRef]
- Dettinger, M.D.; Ralph, F.M.; Das, T.; Neiman, P.J.; Cayan, D.R. Atmospheric rivers, floods and the water resources of California. Water 2011, 3, 445–478. [Google Scholar] [CrossRef]
- Griffin, D.; Anchukaitis, K.J. How unusual is the 2012–2014 California drought? Geophys. Res. Lett. 2014, 41, 9017–9023. [Google Scholar] [CrossRef]
- Williams, A.P.; Seager, R.; Abatzoglou, J.T.; Cook, B.I.; Smerdon, J.E.; Cook, E.R. Contribution of anthropogenic warming to California drought during 2012–2014. Geophys. Res. Lett. 2015, 42, 6819–6828. [Google Scholar] [CrossRef]
- Asner, G.P.; Brodrick, P.G.; Anderson, C.B.; Vaughn, N.; Knapp, D.E.; Martin, R.E. Progressive forest canopy water loss during the 2012–2015 California drought. Proc. Natl. Acad. Sci. USA 2016, 113, E249–E255. [Google Scholar] [CrossRef] [PubMed]
- Littell, J.S.; McKenzie, D.; Peterson, D.L.; Westerling, A.L. Climate and wildfire area burned in western U.S. ecoprovinces, 1916–2003. Ecol. Appl. 2009, 19, 1003–1021. [Google Scholar] [CrossRef] [PubMed]
- Littell, J.S.; Peterson, D.L.; Riley, K.L.; Liu, Y.; Luce, C.H. A review of the relationships between drought and forest fire in the United States. Glob. Chang. Biol. 2016, 22, 2352–2369. [Google Scholar] [CrossRef] [PubMed]
- Westerling, A.L.; Cayan, D.R.D.; Brown, T.T.J.; Hall, B.L.; Riddle, L.G. Climate, Santa Ana winds and autumn wildfires in southern California. Eos Trans. Am. Geophys. Union 2004, 85, 289–296. [Google Scholar] [CrossRef]
- Cruz, M.G.; Sullivan, A.L.; Gould, J.S.; Sims, N.C.; Bannister, A.J.; Hollis, J.J.; Hurley, R.J. Anatomy of a catastrophic wildfire: The Black Saturday Kilmore East fire in Victoria, Australia. For. Ecol. Manag. 2012, 284, 269–285. [Google Scholar] [CrossRef]
- Abatzoglou, J.T.; Balch, J.K.; Bradley, B.A.; Kolden, C.A. Human-related ignitions concurrent with high winds promote large wildfires across the USA. Int. J. Wildl. Fire 2018. [Google Scholar] [CrossRef]
- Bessie, W.C.; Johnson, E.A. The relative importance of fuels and weather on fire behavior in subalpine forests. Ecology 1995, 76, 747–762. [Google Scholar] [CrossRef]
- Bowman, D.M.J.S.; Williamson, G.J.; Abatzoglou, J.T.; Kolden, C.A.; Cochrane, M.A.; Smith, A.M.S. Human exposure and sensitivity to globally extreme wildfire events. Nat. Ecol. Evol. 2017, 1, 58. [Google Scholar] [CrossRef] [PubMed]
- Parisien, M.-A.; Moritz, M.A. Environmental controls on the distribution of wildfire at multiple spatial scales. Ecol. Monogr. 2009, 79, 127–154. [Google Scholar] [CrossRef]
- Sharples, J.J.; Mills, G.A.; McRae, R.H.D.; Weber, R.O. Foehn-like winds and elevated fire danger conditions in southeastern Australia. J. Appl. Meteorol. Climatol. 2010, 49, 1067–1095. [Google Scholar] [CrossRef]
- Westerling, A.; Bryant, B.; Preisler, H. Climate change and growth scenarios for California wildfire. Clim. Chang. 2011. [Google Scholar] [CrossRef]
- Polade, S.D.; Pierce, D.W.; Cayan, D.R.; Gershunov, A.; Dettinger, M.D. The key role of dry days in changing regional climate and precipitation regimes. Sci. Rep. 2014, 4, 4364. [Google Scholar] [CrossRef] [PubMed]
- Hughes, M.; Hall, A.; Kim, J. Human-induced changes in wind, temperature and relative humidity during Santa Ana events. Clim. Chang. 2011, 109, 119–132. [Google Scholar] [CrossRef]
- Miller, N.L.; Schlegel, N.J. Climate change projected fire weather sensitivity: California Santa Ana wind occurrence. Geophys. Res. Lett. 2006, 33. [Google Scholar] [CrossRef] [Green Version]
- Velez, A.-L.K.; Diaz, J.M.; Wall, T.U. Public information seeking, place-based risk messaging and wildfire preparedness in southern California. Int. J. Wildl. Fire 2017, 26, 469–477. [Google Scholar] [CrossRef]
- Stephens, S.L.; Adams, M.A.; Handmer, J.; Kearns, F.R.; Leicester, B.; Leonard, J.; Moritz, M.A. Urban–wildland fires: How California and other regions of the US can learn from Australia. Environ. Res. Lett. 2009, 4, 14010. [Google Scholar] [CrossRef]
- Quarles, S.L.; Valachovic, Y.; Nakamura, G.M.; Nader, G.A.; de Lasaux, M.J. Home Survival in Wildfire-Prone Areas: Building Materials and Design Considerations; ANR Publication 8393; ANR Publication 8393; University of California, Agriculture and Natural Resources: Richmond, CA, USA, 2010; Available online: https://escholarship.org/uc/item/4vt8w5qk (accessed on 24 February 2018).
- Smith, A.M.S.; Kolden, C.A.; Paveglio, T.B.; Cochrane, M.A.; Bowman, D.M.J.S.; Moritz, M.A.; Kliskey, A.D.; Alessa, L.; Hudak, A.T.; Hoffman, C.M.; et al. The Science of Firescapes: Achieving Fire-Resilient Communities. Bioscience 2016, 66, 130–146. [Google Scholar] [CrossRef] [PubMed] [Green Version]


| Names of Wildfires and Complexes | Area Burned (ha) | Structures Destroyed/Damaged | Start Date and Time (UTC) |
|---|---|---|---|
| Tubbs | 14,895 | 5636/317 | 9 October 2017 04:45 |
| Nuns | 22,877 | 1355/172 | 9 October 2017 05:00 |
| Atlas | 20,892 | 120/783 | 9 October 2017 04:52 |
| 7024 | 6/2 | 9 October 2017 10:30 | |
| Redwood Valley (Mendocino Lake Complex) | 14,780 | 546/44 | 9 October 2017 06:36 |
| Sulphur (Mendocino Lake Complex) | 893 | 162/8 | 9 October 2017 06:59 |
| Cascade (Wind Complex) | 4042 | 264/10 | 9 October 2017 06:03 |
| LaPorte (Wind Complex) | 2489 | 74/2 | 9 October 2017 07:57 |
| Cherokee | 3406 | 6/1 | 9 October 2017 04:45 |
| Wildfire Names | Area Burned (ha) | Structures Destroyed/Damaged | Start Date and Time (UTC) |
|---|---|---|---|
| Thomas | 114,078 | 1063/280 | 5 December 2017 02:28 |
| Creek | 6321 | 123/81 | 5 December 2017 11:44 |
| Rye | 2448 | 6/3 | 5 December 2017 19:31 |
| Lilac | 1659 | 157/64 | 7 December 2017 19:15 |
| Santa Rosa RAWS | Hawkeye RAWS | Pike County Lookout RAWS | |
|---|---|---|---|
| FFWI/Percentile | 78/99th | 128/(MAX) | 77/99th |
| Surface Relative Humidity/Percentile | 7%/1st | 12%/2nd | 17%/2nd |
| Surface Wind Gust/Percentile | 27.3 ms−1/99th | 35.3 ms−1/99th | 21.9 ms−1/99th |
| Surface Wind/Percentile | 11.6 ms−1/99th | 21.5 ms−1/99th | 13.9 ms−1/99th |
| 10-h Fuel Moisture/Percentile | 12.8%/5th | 3.8%/5th | 5.4%/9th |
| Observation Time (UTC) | 11:00 9 October | 07:00 9 October | 12:00 9 October |
| Period of Record (Month/Year) | 01/1992–10/2017 | 01/1994–10/2017 | 01/1992–10/2017 |
| Saugus RAWS | Fremont Canyon RAWS | Rose Valley RAWS | Montecito RAWS | |
|---|---|---|---|---|
| FFWI | 22.2% (5.5%) | 57.1% (13.0% | 8.3% (3.0%) | 3.4% (0%) |
| Surface Relative Humidity | 66.8% (25.2%) | 67.0% (12.5%) | 39.6% (12.2%) | 80.4% (62.1%) |
| Surface Wind Gust | 12.7% (0%) | 38.2% (0%) | 10.5% (0.6%) | 0.9% (0.6%) |
| Surface Wind Speed | 15.2% (2.5%) | 46.3% (9.7%) | 4.2% (1.1%) | 1.2% (0%) |
| 10-h Fuel Moisture | 0% (0%) | 55.4% (22.2%) | 46.0% (12.7%) | N/A |
| Period of Record (Month/Year) | 01/1995–12/2017 | 01/1992–12/2017 | 01/1994–12/2017 | 01/1997–12/2017 |
© 2018 by the authors. Licensee MDPI, Basel, Switzerland. This article is an open access article distributed under the terms and conditions of the Creative Commons Attribution (CC BY) license (http://creativecommons.org/licenses/by/4.0/).
Share and Cite
Nauslar, N.J.; Abatzoglou, J.T.; Marsh, P.T. The 2017 North Bay and Southern California Fires: A Case Study. Fire 2018, 1, 18. https://doi.org/10.3390/fire1010018
Nauslar NJ, Abatzoglou JT, Marsh PT. The 2017 North Bay and Southern California Fires: A Case Study. Fire. 2018; 1(1):18. https://doi.org/10.3390/fire1010018
Chicago/Turabian StyleNauslar, Nicholas J., John T. Abatzoglou, and Patrick T. Marsh. 2018. "The 2017 North Bay and Southern California Fires: A Case Study" Fire 1, no. 1: 18. https://doi.org/10.3390/fire1010018
APA StyleNauslar, N. J., Abatzoglou, J. T., & Marsh, P. T. (2018). The 2017 North Bay and Southern California Fires: A Case Study. Fire, 1(1), 18. https://doi.org/10.3390/fire1010018