Article

Geometrical Analysis of the Stagnation Zone in Laterally Colliding Plasmas: Effects of Plasma Plume Separation and Ablating Target Material

by
Haider M. Al-Juboori
1,* and
Tom McCormack
2
1
Department of Electronic Engineering and Communication, South East Technological University, R93 V960 Carlow, Ireland
2
School of Physics, University College Dublin, D04 N2E5 Dublin, Ireland
*
Author to whom correspondence should be addressed.
Plasma 2023, 6(2), 198-211; https://doi.org/10.3390/plasma6020015
Submission received: 14 February 2023 / Revised: 27 March 2023 / Accepted: 28 March 2023 / Published: 30 March 2023
(This article belongs to the Special Issue Feature Papers in Plasma Sciences)

Abstract

:
The influence of an ablating target’s atomic mass on the development and growth of the interaction zone in laterally colliding plasmas has been investigated. As diagnostic tools, fast imaging and optical emission techniques were used to evaluate the characteristics of the seed plasma as well as the interaction zone created by different target materials (i.e., aluminum and silicon). The current findings show that the dynamical, spectral, and geometrical properties of the generated interaction zone are affected by the features of the ablated species and the geographical separation of the interacting plumes. The interaction of aluminum plume species results in a sharper, more intense, and more directed stagnation zone than that reported for silicon targets using a 450 nm filter. Furthermore, the investigation of the interaction area emission from both regions for aluminum (Al) and silicon (Si) plasma explains the variation in plasma properties in the stagnation zone. As a part of this work’s description, a comparative study of the dynamics and characteristics of the homogenous interaction region produced by colliding plasma plumes by laser ablation of flat Al and Si targets has been presented, which can provide deep insight into the characterization of colliding laser-produced plasma expansion and related physical and technical properties.

1. Introduction

Laser-induced plasma has attracted the scientific community’s interest due to its usefulness in fundamental research and in a variety of applications. Extensive theoretical and experimental investigations on this topic have been published in a variety of experimental situations [1,2]. Laser ablation is used in many fields, such as material engineering, including laser-induced breakdown spectroscopy (LIBS), pulsed laser deposition (PLD), and ion/neutral particle formation [3,4,5].
In recent years, there has been a lot of interest in the creation of an interaction zone in colliding plasma plumes. The interaction between two spatially distant plasma plumes generated by laser ablation results in the formation of a well-defined interaction area between them. Due to the unique properties of the generated interaction zone and the underlying physics of colliding plasmas, the study of colliding plasmas is significant. Several authors have explored it over a wide range of plasma characteristics in the context of laser ion source applications, thin film deposition, laser-induced breakdown spectroscopy (LIBS), and inertial fusion confinement [2,4,5,6,7,8]. The interaction of plasma plumes produced by the ablation of solid targets or thin films has been examined over a wide range of laser intensities (109–1014 W/cm2) and collision geometries (e.g., head-on, with an angle, and lateral collision) [9,10,11,12].
Principally, the geometrical shape and variation of the interacting plumes and the intensity of the ablating laser strongly influence the development and growth of the interaction zone in colliding plasmas. Despite various investigations on the development and dynamics of the interaction zone, little attention has been paid to the function of the target material’s features and its atomic mass at different visible filter bandwidths.
In light of the foregoing, a systematic experiment was carried out to better understand the development and dynamics of the stagnation zone caused by the interaction of plume species from two different material features. In the current study, aluminum and silicon were employed. The geometrical shape and associated properties, as well as the expansion attributes of the stagnation region, the sharpness of the zone, and their reliance on the target materials, are discussed in this paper. The interaction region’s dependency on the geometric separation of two interacting plumes has also been investigated. These experiments provide valuable information about the effect of spatial separation and laser fluence on the ionic yield in the visible region that can support numerous applications in different areas, such as plasma oxidation and materials science.

2. Materials and Methods

Figure 1 explains the concepts of the experimental setup and the general mechanism for the colliding laser-produced plasma (CLPP) experiment used in this work. The plasma plumes of the solid target materials were created using an Nd:YAG laser (Continuum Surelite III-10; λ = 1064 nm; pulse width ~5.36 ± 0.28 ns FWHM). The architecture, setup, and analytical tracking technique of the CLPP are characterized in detail in [13].
The laser beam is divided into two beams by a wedge prism and focused on the target surface by a plano-convex lens (focal length f = 100 mm or 125 mm, i.e., separation distance D = 1.66 mm or 2.16 mm). During the experiment, the pressure within the ablation chamber is kept constant at ~0.5 × 10⁻⁶ mbar (i.e., vacuum). Due to the variation in their structural features and atomic masses, aluminum and silicon were chosen as the target materials. Aluminum and silicon solid plates with dimensions of 75 × 30 × 1 mm3 were employed. Using a vacuum-compatible feed-through holding system, the target plates are put in a stainless steel vacuum chamber.
Using the linear scale on the feedthrough, the target positions are shifted by 2 mm to a new surface after each subsequent two shots. The experiment is carried out in the single-shot laser mode, and the necessary fluence at the target surface is obtained by placing a half-wave plate in front of the wedge prism. The focusing lens was replaced to change the spacing between the two beams (separation distance D = 1.66 mm or 2.16 mm). Images of the plume are captured using an ICCD camera (intensified charge-coupled device; ~0.05 nanoseconds; Hamamatsu Inc. , Tsukuba City, Japan), with a temporal resolution of 0.2 ns. The plume’s temporal development is captured by adjusting the time delay between the ICCD’s gate opening time and the trigger pulse. The ICCD gate time is 10 ns.

3. Results and Discussions

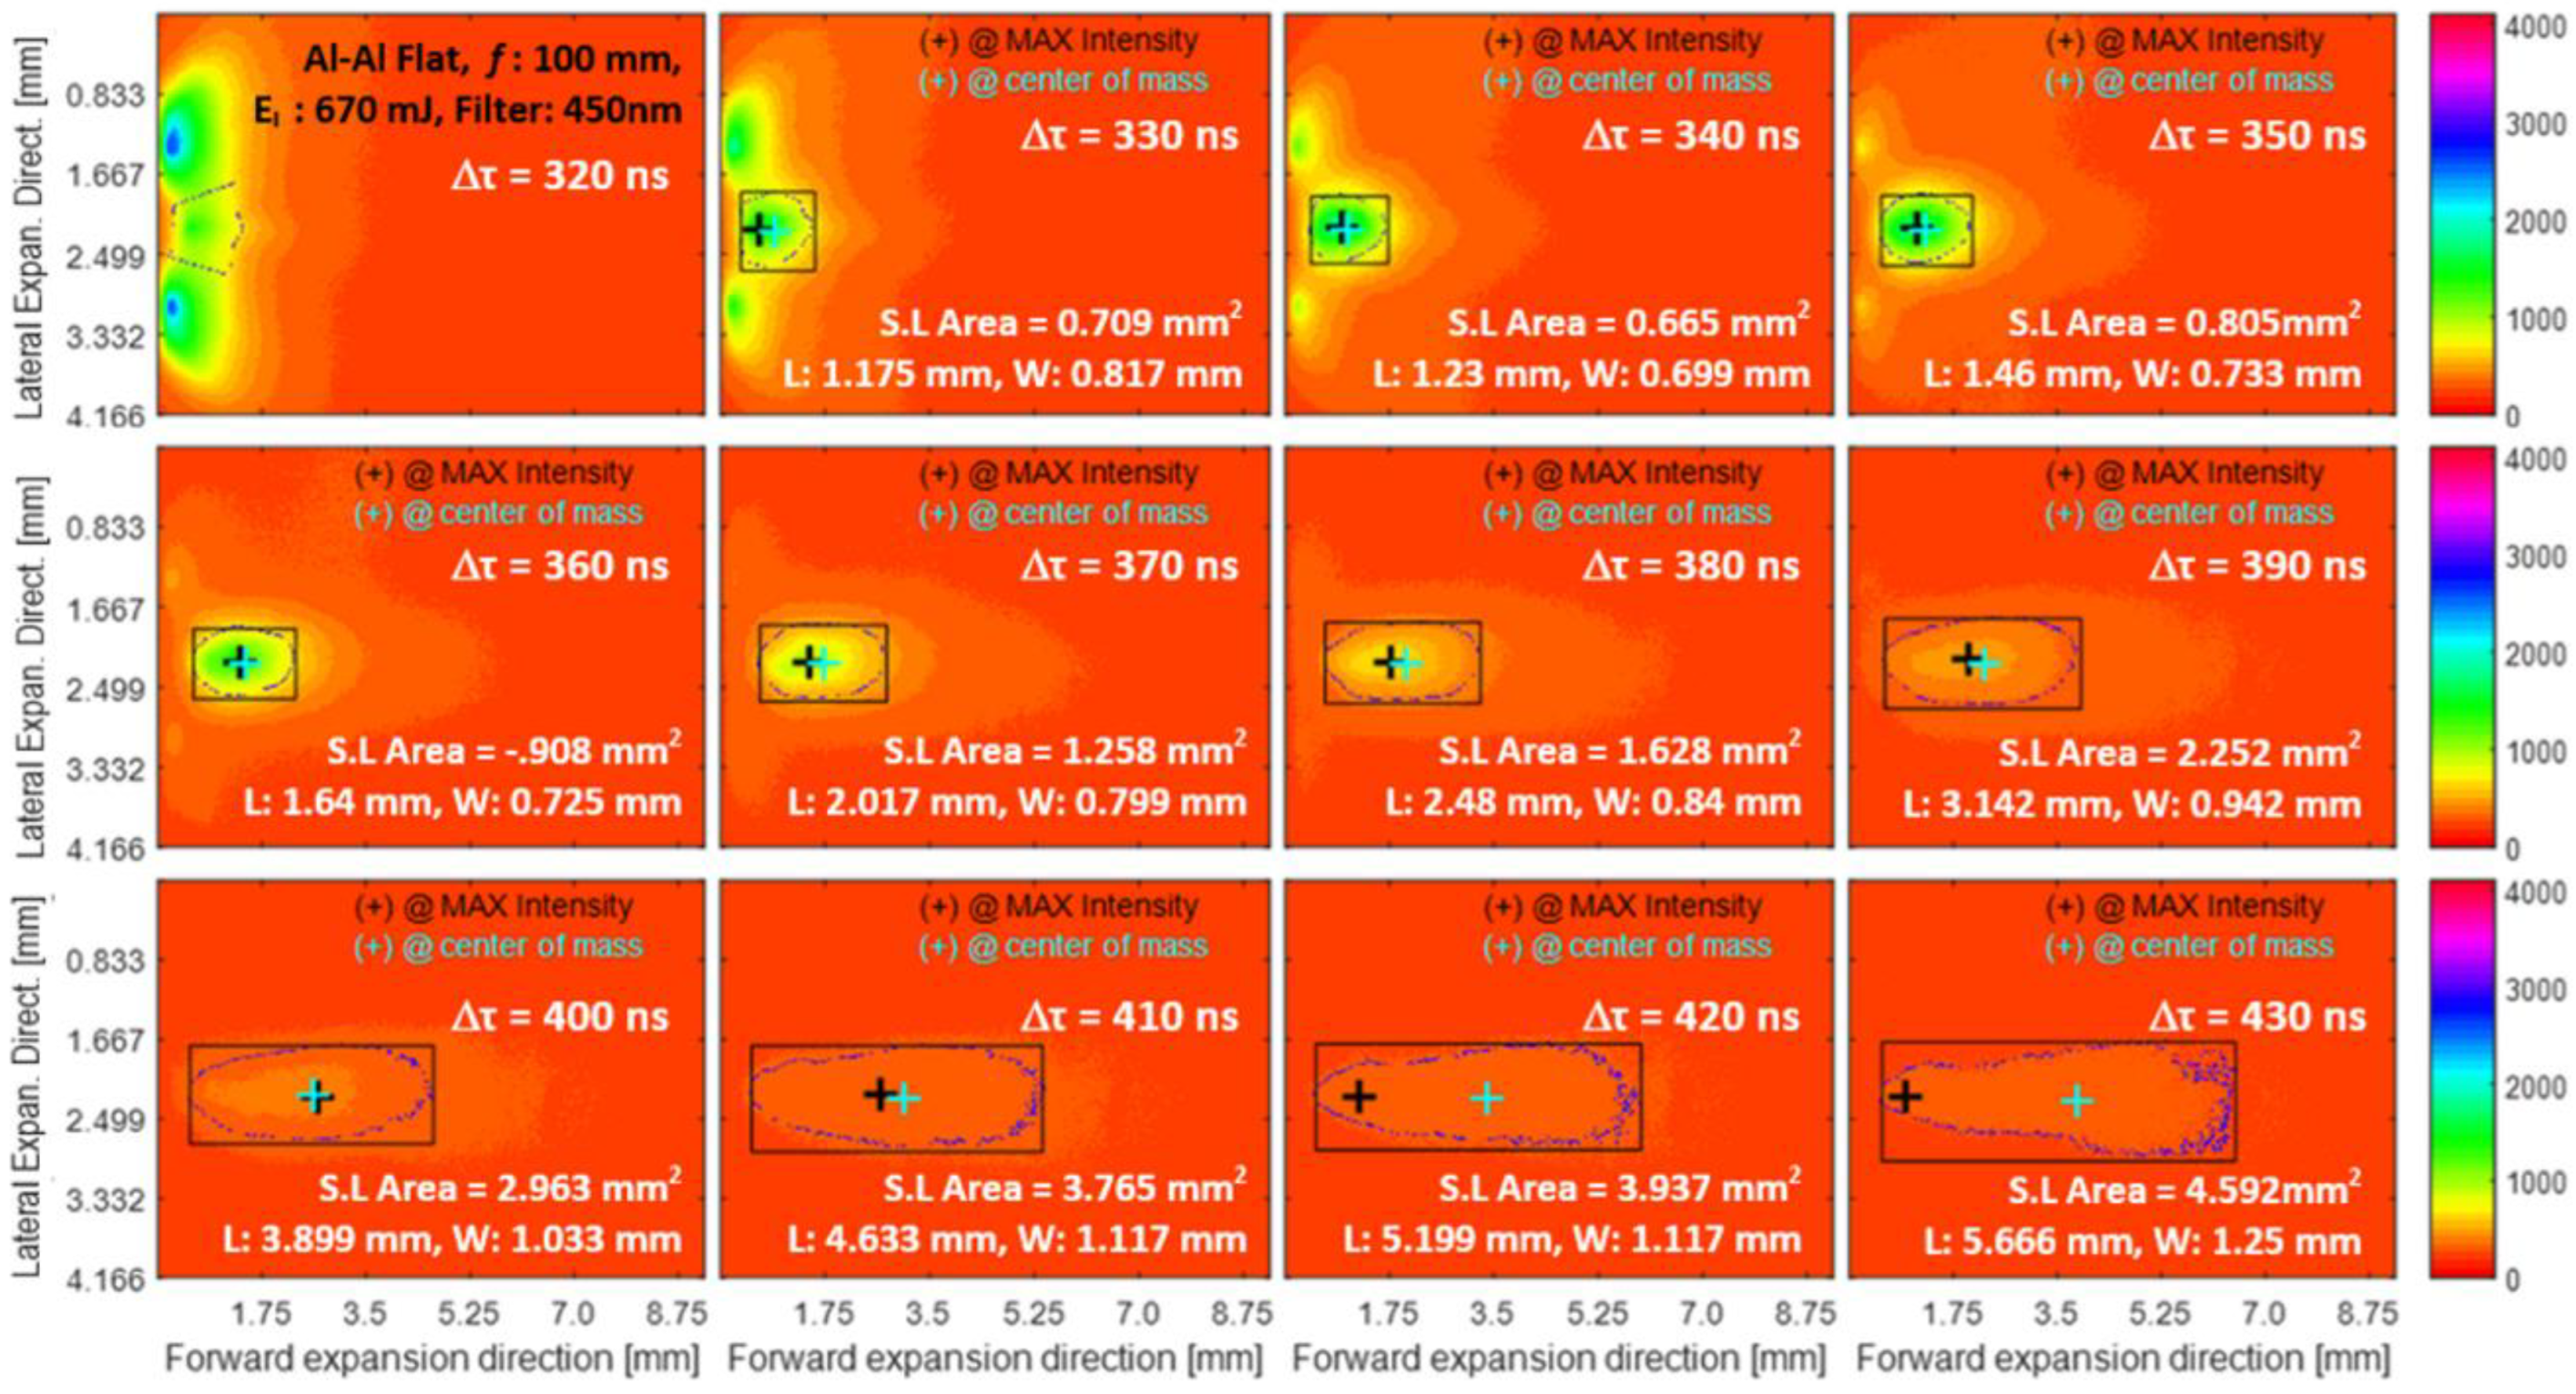
To calibrate the imaging system, a mesh image with a defined size (5 × 5 mm2) is employed. To gather the emission, a single-lens imaging setup is employed (spatially resolved). The ICCD camera, EUV spectrometer, and laser are all synced using a microcontroller-based timing generator with a timing jitter of less than 1 ns (Stanford DG645 digital delay generator) [13]. It is essential to have a systematic approach to image data analysis in these sensitive experimental images. All digital analyses were created and carried out utilizing advanced codes within the MATLAB environment. Figure 2 depicts various characteristics at 1/e of the stagnation layer on the top of each time-resolved image.
The region’s attributes may be determined for each time frame based on the intensity level of the pixels and their distribution within the ROI, which can assist in understanding the 2D dynamic structures inside the interaction zone.
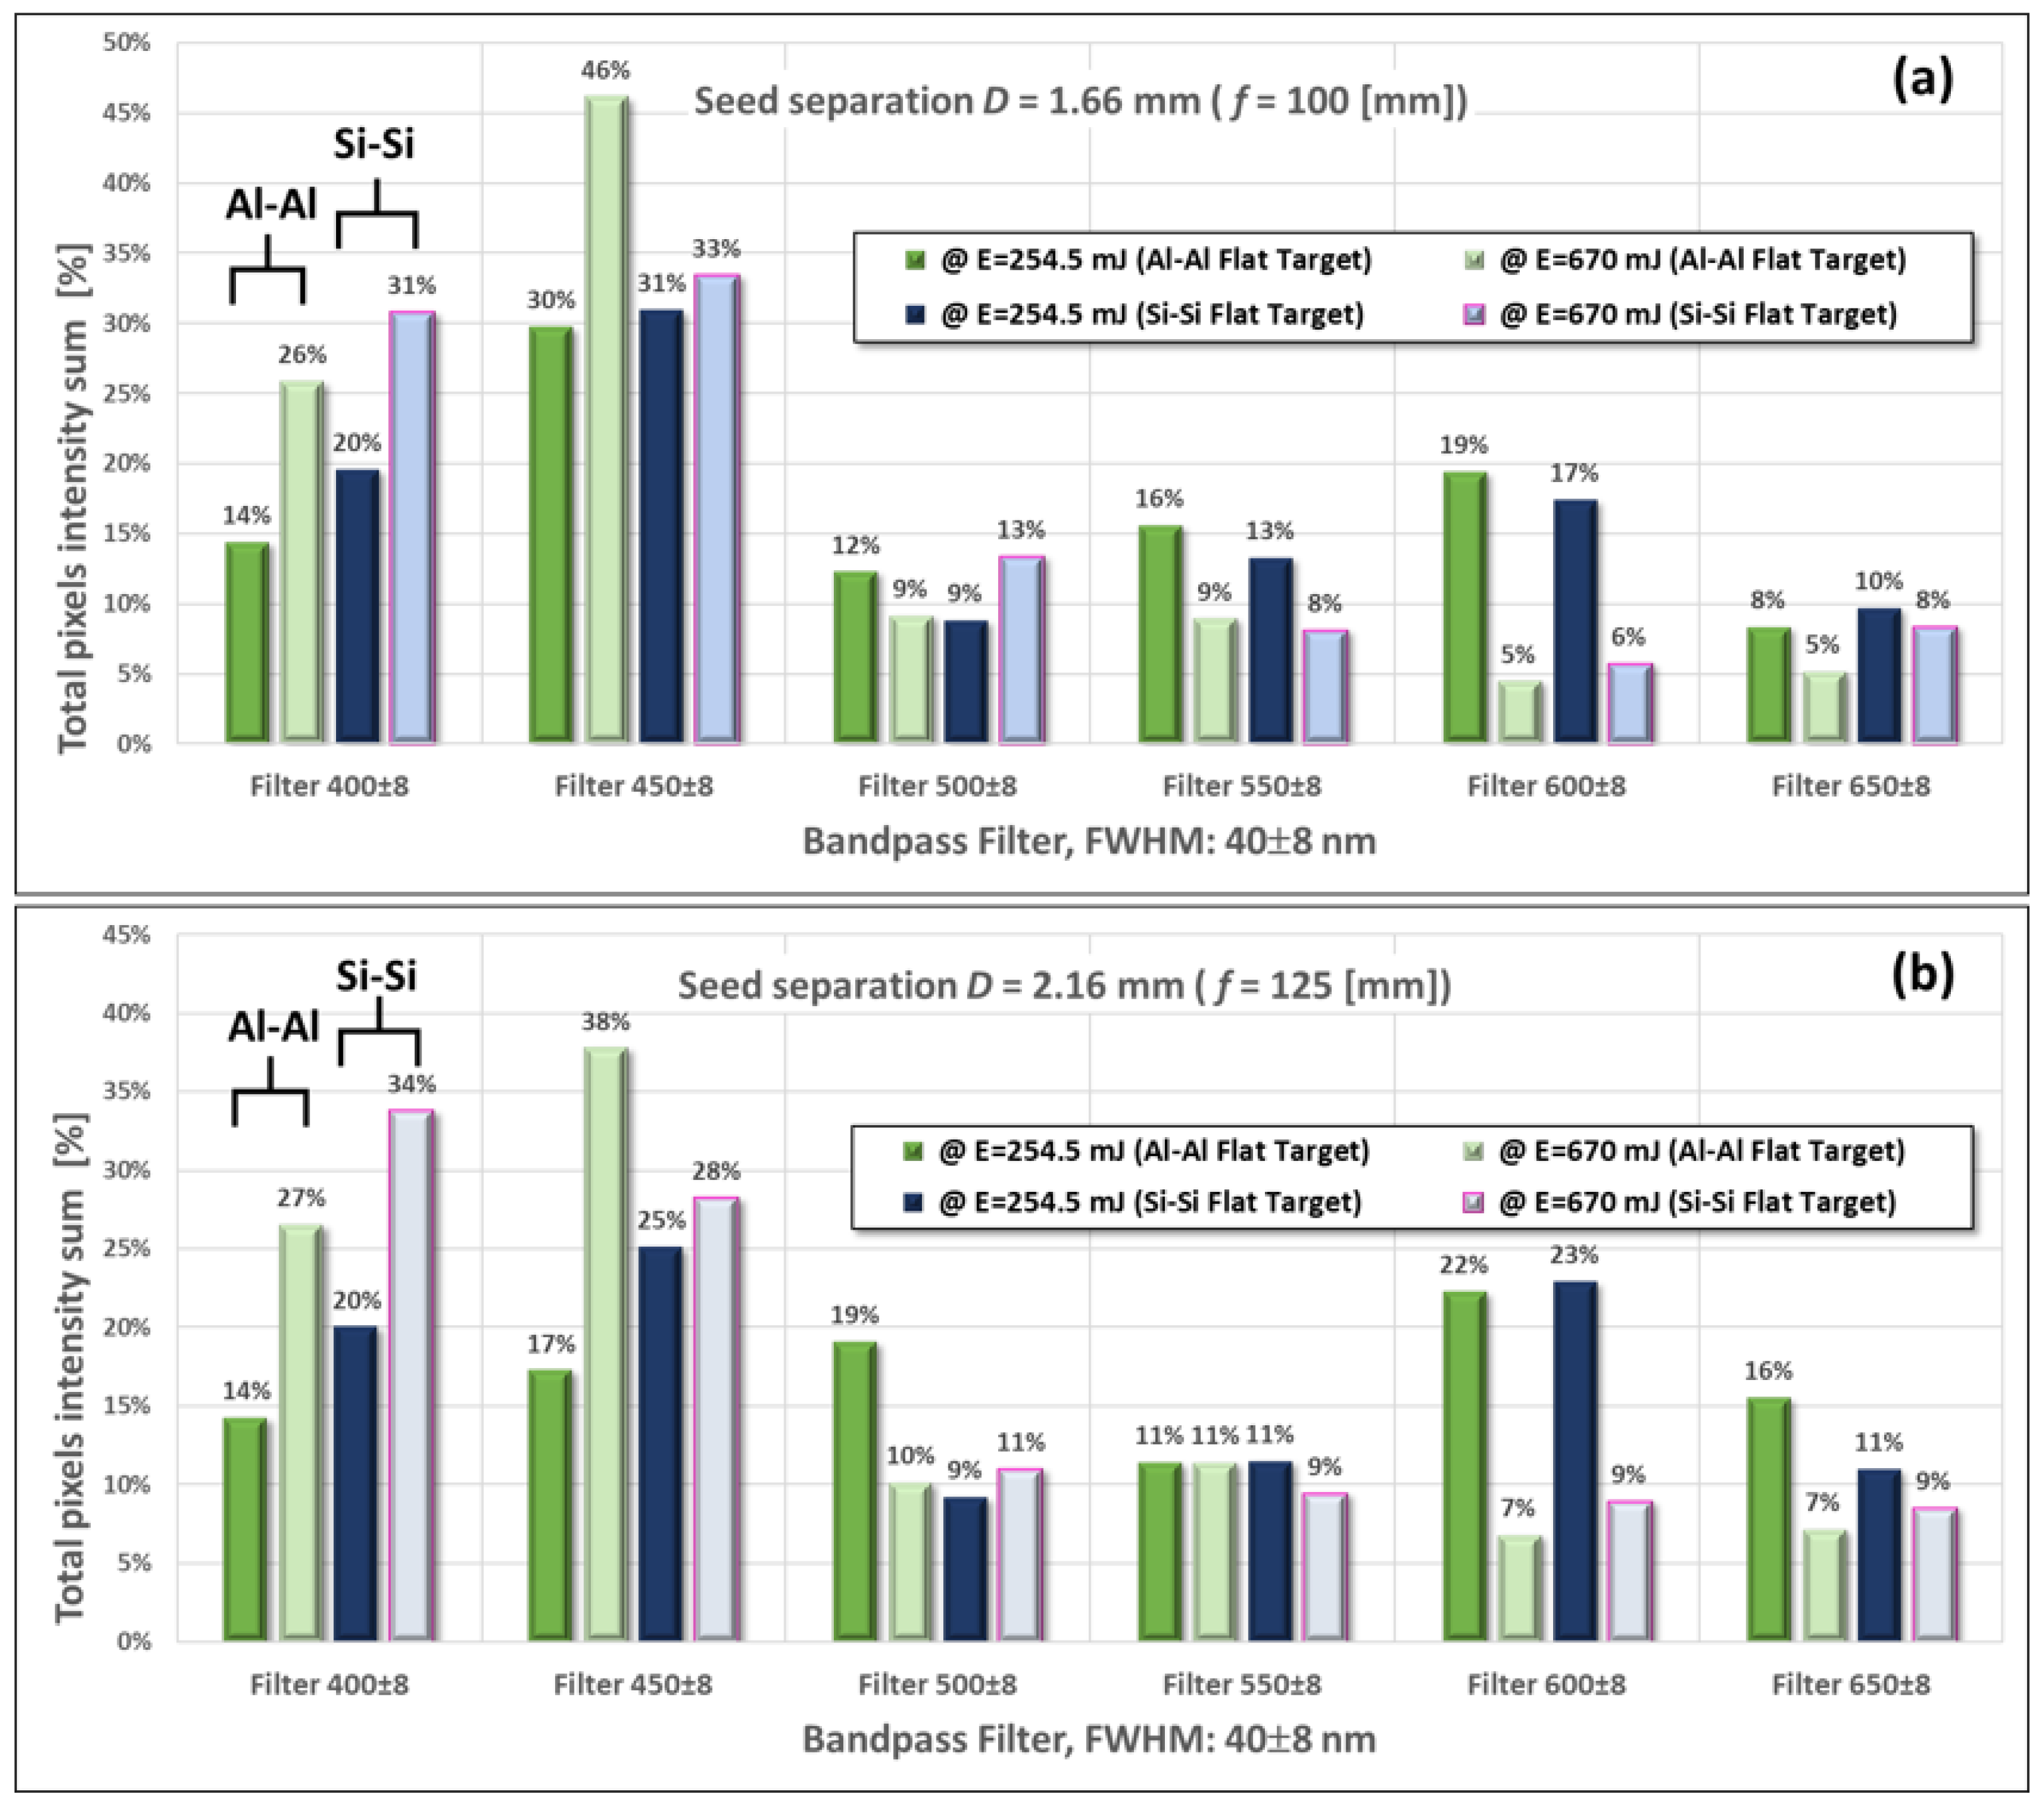
Figure 3 shows the visible intensity distributions inside the interaction region for each bandwidth (for the aluminum and silicon targets) through the time period from the time delay (Δτ) between the laser pulse and ICCD camera, which is 330 ns, until Δτ = 430 ns, as a function of the maximum laser energy (i.e., EL = 670 mJ) and the minimum laser energy (i.e., EL = 254.5 mJ).
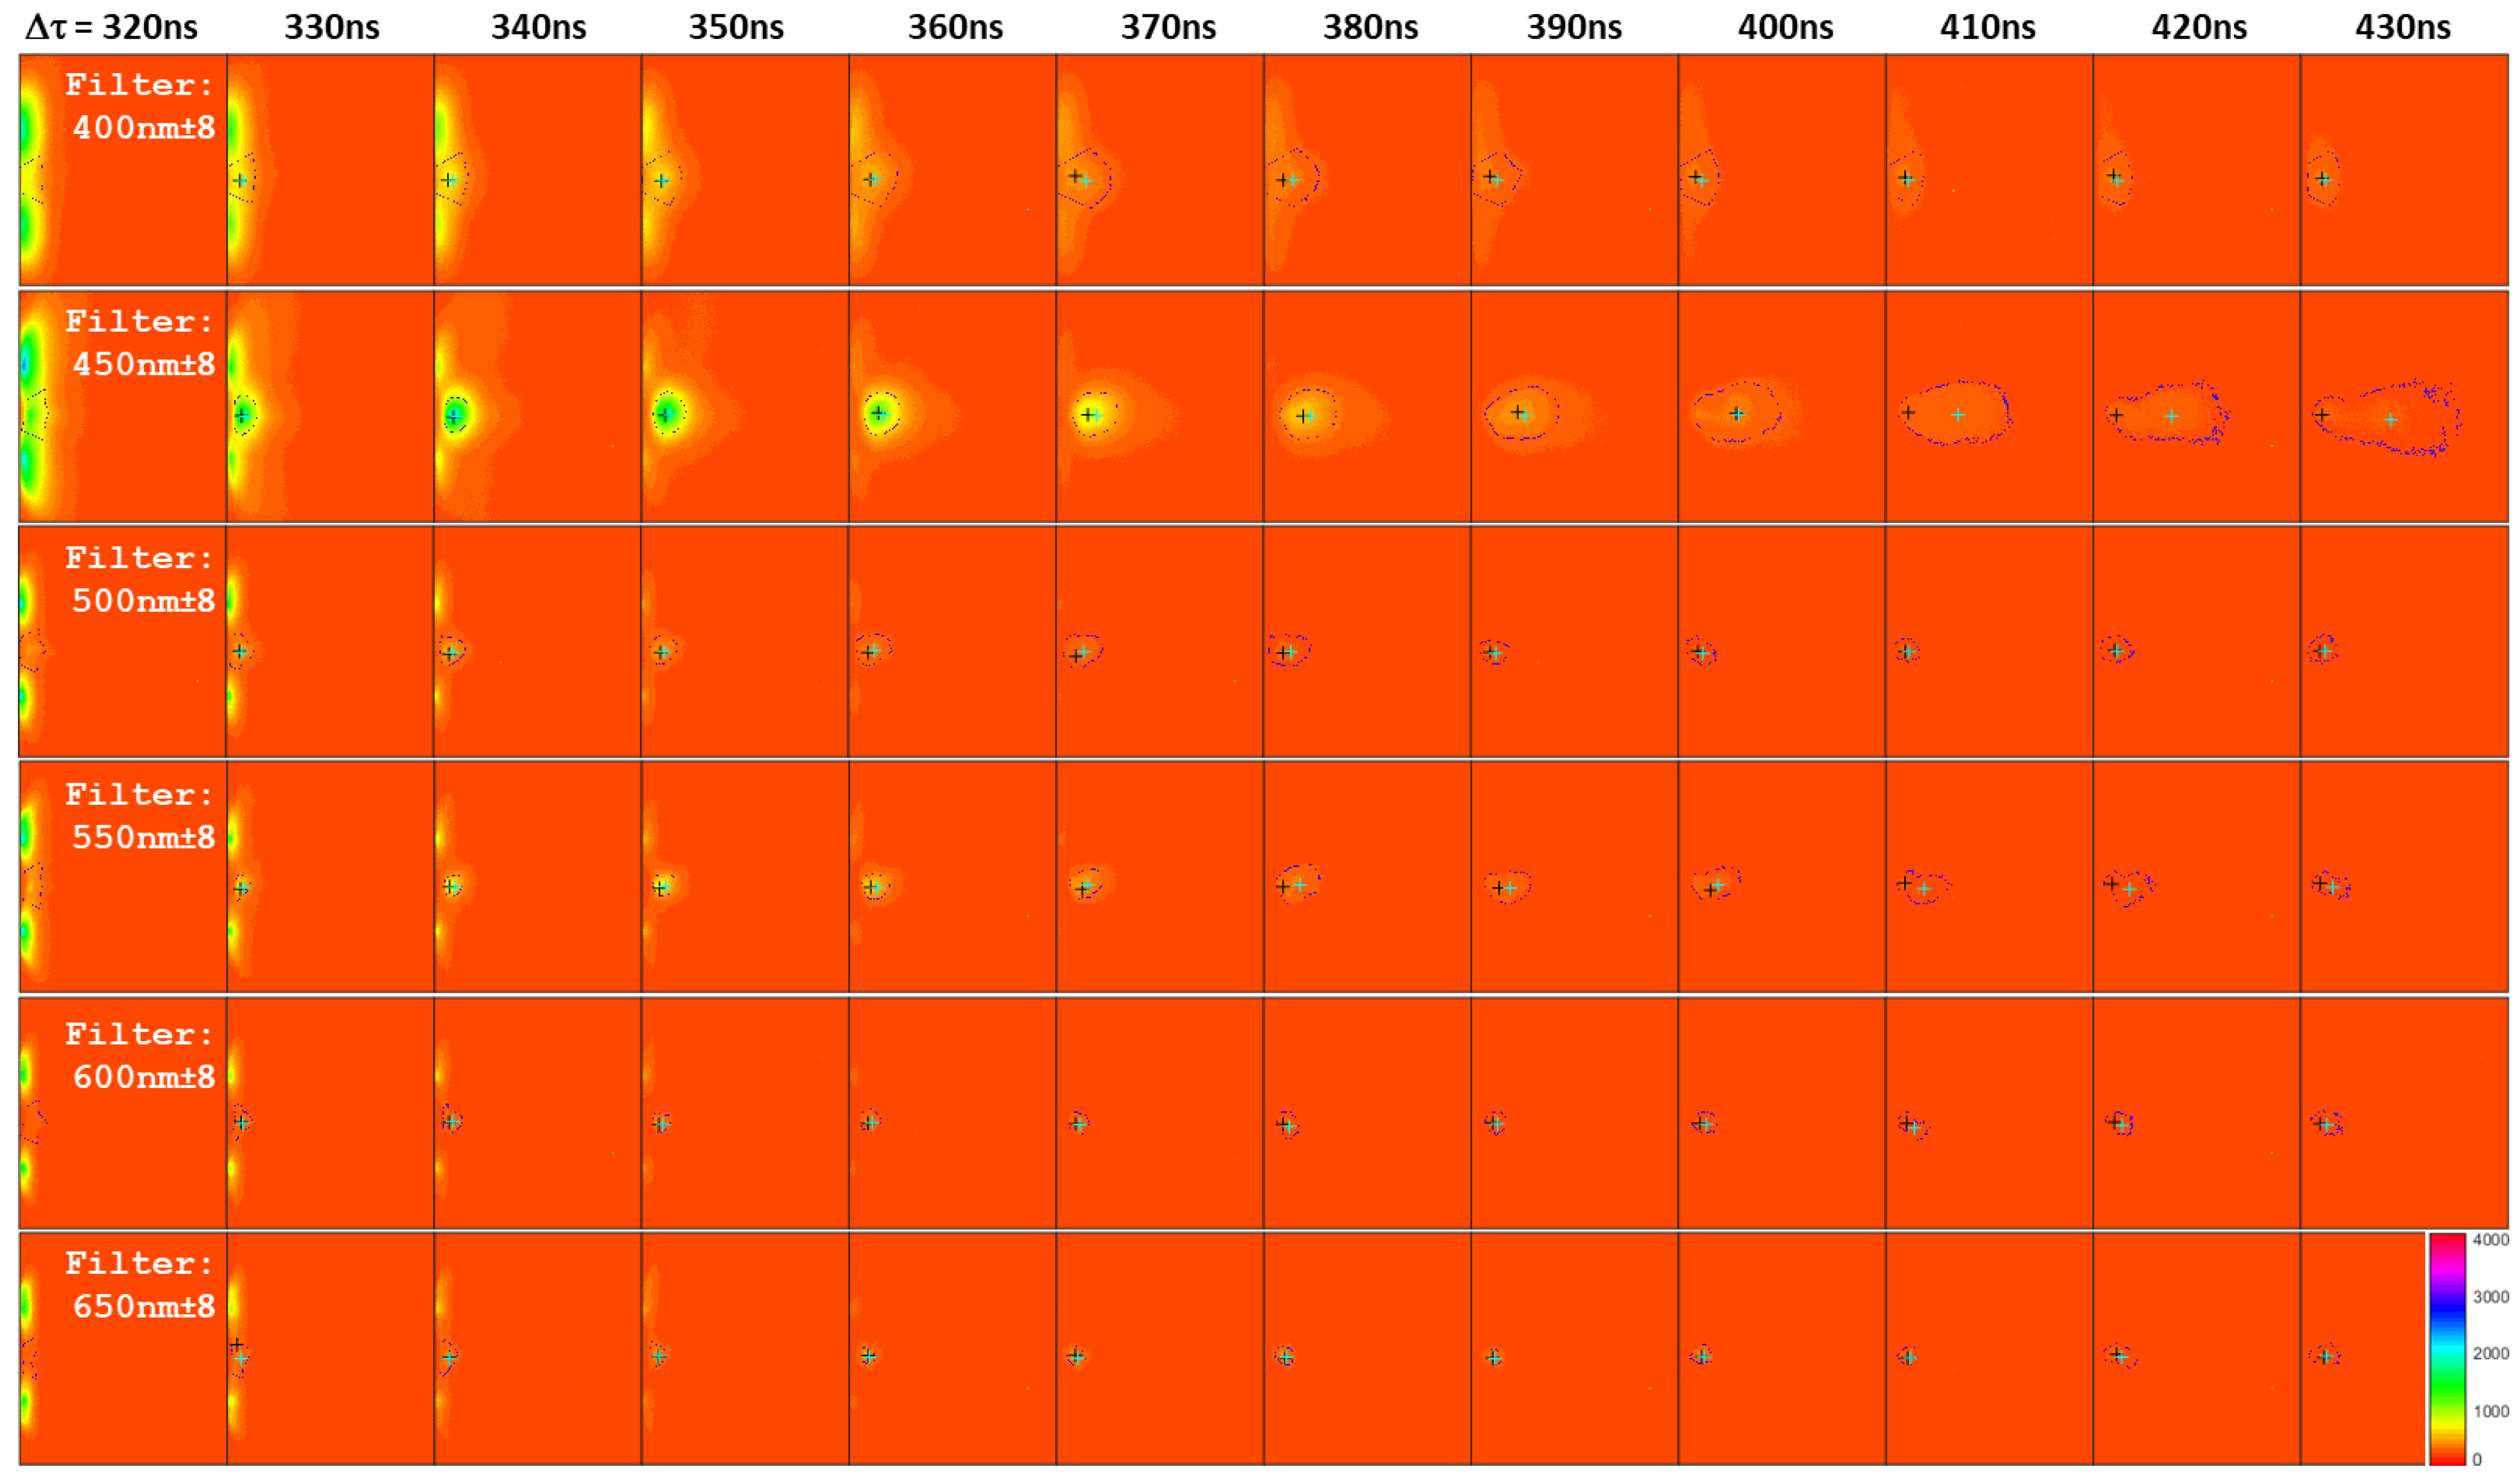
The ICCD camera records the evolution of two-dimensional digital images of the interacting plumes created by the aluminum and silicon targets at two distinct spatial separations of 1.66 and 2.66 mm (i.e., f = 100 or f = 125 mm). Figure 4 shows a series of images captured at 10 ns intervals from Δτ = 320 ns to 430 ns for six different filter bandwidths at D = 1.66 mm. For the earlier values of Δτ in all of the filters, the seed plasmas were too bright relative to the stagnation layer emission. Beyond Δτ = 420 ns, the emission from the interaction zone is too weak to be detected. Strong enough emission from the filters between 400 nm and 450 nm can be observed compared with other filters’ bandwidths.
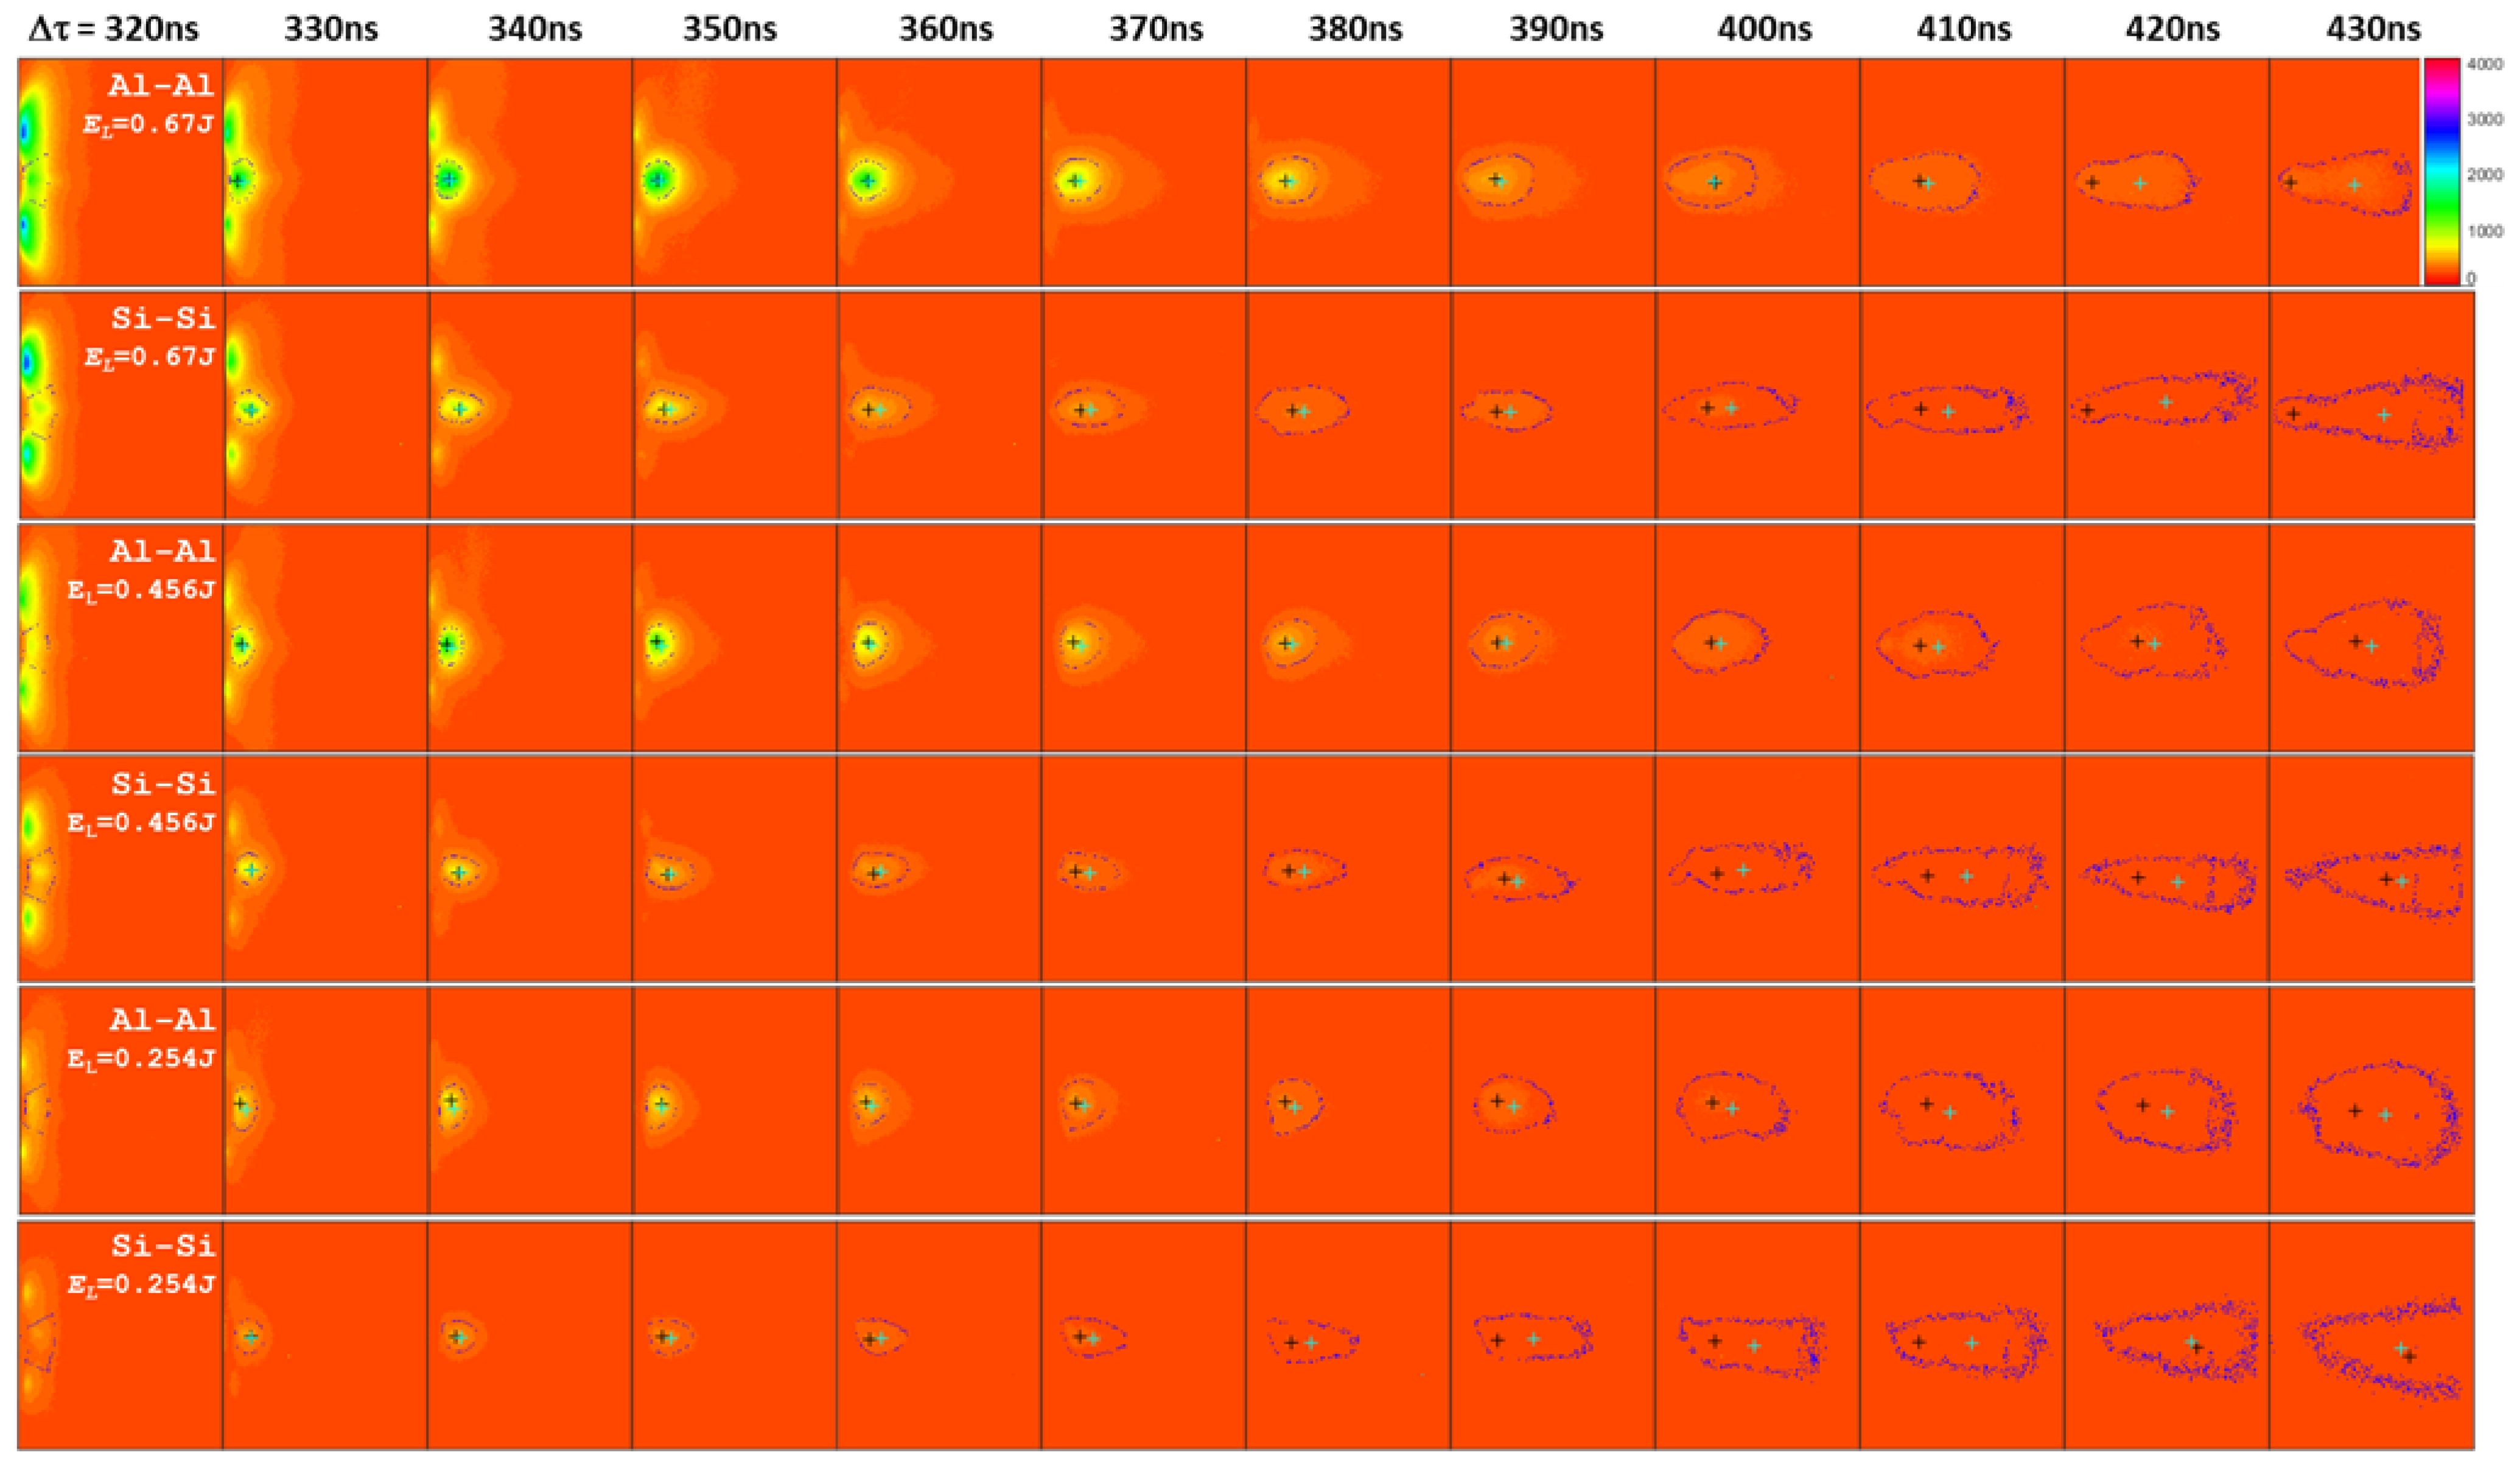
Figure 5 depicts a series of images of laterally colliding plasma plumes for the Al-Al target and the Si-Si flat target at various time delays ranging from Δτ = 320 ns to 430 ns at three different laser energies. Each image depicts the spectrally integrated emission intensity in the 450 nm filter bandwidth released by various plume species using the aluminum and silicon flat targets.
For both laser beams that form seed plasma plumes and provide similar experimental conditions for all target materials, the spot diameter was approximately 29.4 μm at f = 100 mm and 36.8 μm at f = 125 mm (FWHM). The maximum laser power densities at EL = 670 mJ were 4.60 ± 0.94 × 10¹² W/cm2 for the nanosecond laser pulse with the f = 100 mm lens and 2.94 ± 0.60 × 10¹² W/cm2 with the f = 125 mm lens.
The density of the seed plasma plume steadily declines with time, as seen in Figure 5 and Figure 6, in both cases of seed separation (i.e., D = 1.66 mm and D = 2.16 mm). Generally, plume expansion in a vacuum may be considered an adiabatic expansion, in which expansion happens under the influence of a pressure gradient and electron temperature and density drop with time [2,4].
In all of the scenarios, a well-defined stagnation layer is seen between the seed plumes, although its pattern, volume, and expansion velocity are greatly dependent on the features of the target material and the distances between the interacting plumes. The extension of the stagnation area is governed by the momentum transmission between the interacting seed species. A common observation suggests that lesser spacing results in the creation of an improved interaction zone. The development period of the interaction zone grows as the distance between the seed plumes increases. The interaction zone is initially restricted inside the seed region; however, as time passes, the interaction zone exits the seed region.
A well-formed stagnation zone is seen in all of the target materials at a plume separation of 1.66 mm from the shortest evaluated time delay (i.e., 330 ns). In the case of aluminum, the stagnation zone is larger and more intense than in the case of silicon, where the stagnation regions are sharper and brighter.
It is worth mentioning that Mondal et al. [14] attributed the ion’s dominance over the neutral signal to an increased ionization rate in the aluminum stagnation layer. In our experiments, a dove prism was inserted between the plasma focusing lens and the spectrograph slit in order to orient the expanding plasmas parallel to the slit, such that only light from the stagnation layer entered the spectrograph. The 400 nm filter in the current experiment captures the stronger three Al I lines, while the 450 nm filter captures the Al II and Al III lines. The relevant transitions are listed in Table 1 [15,16].
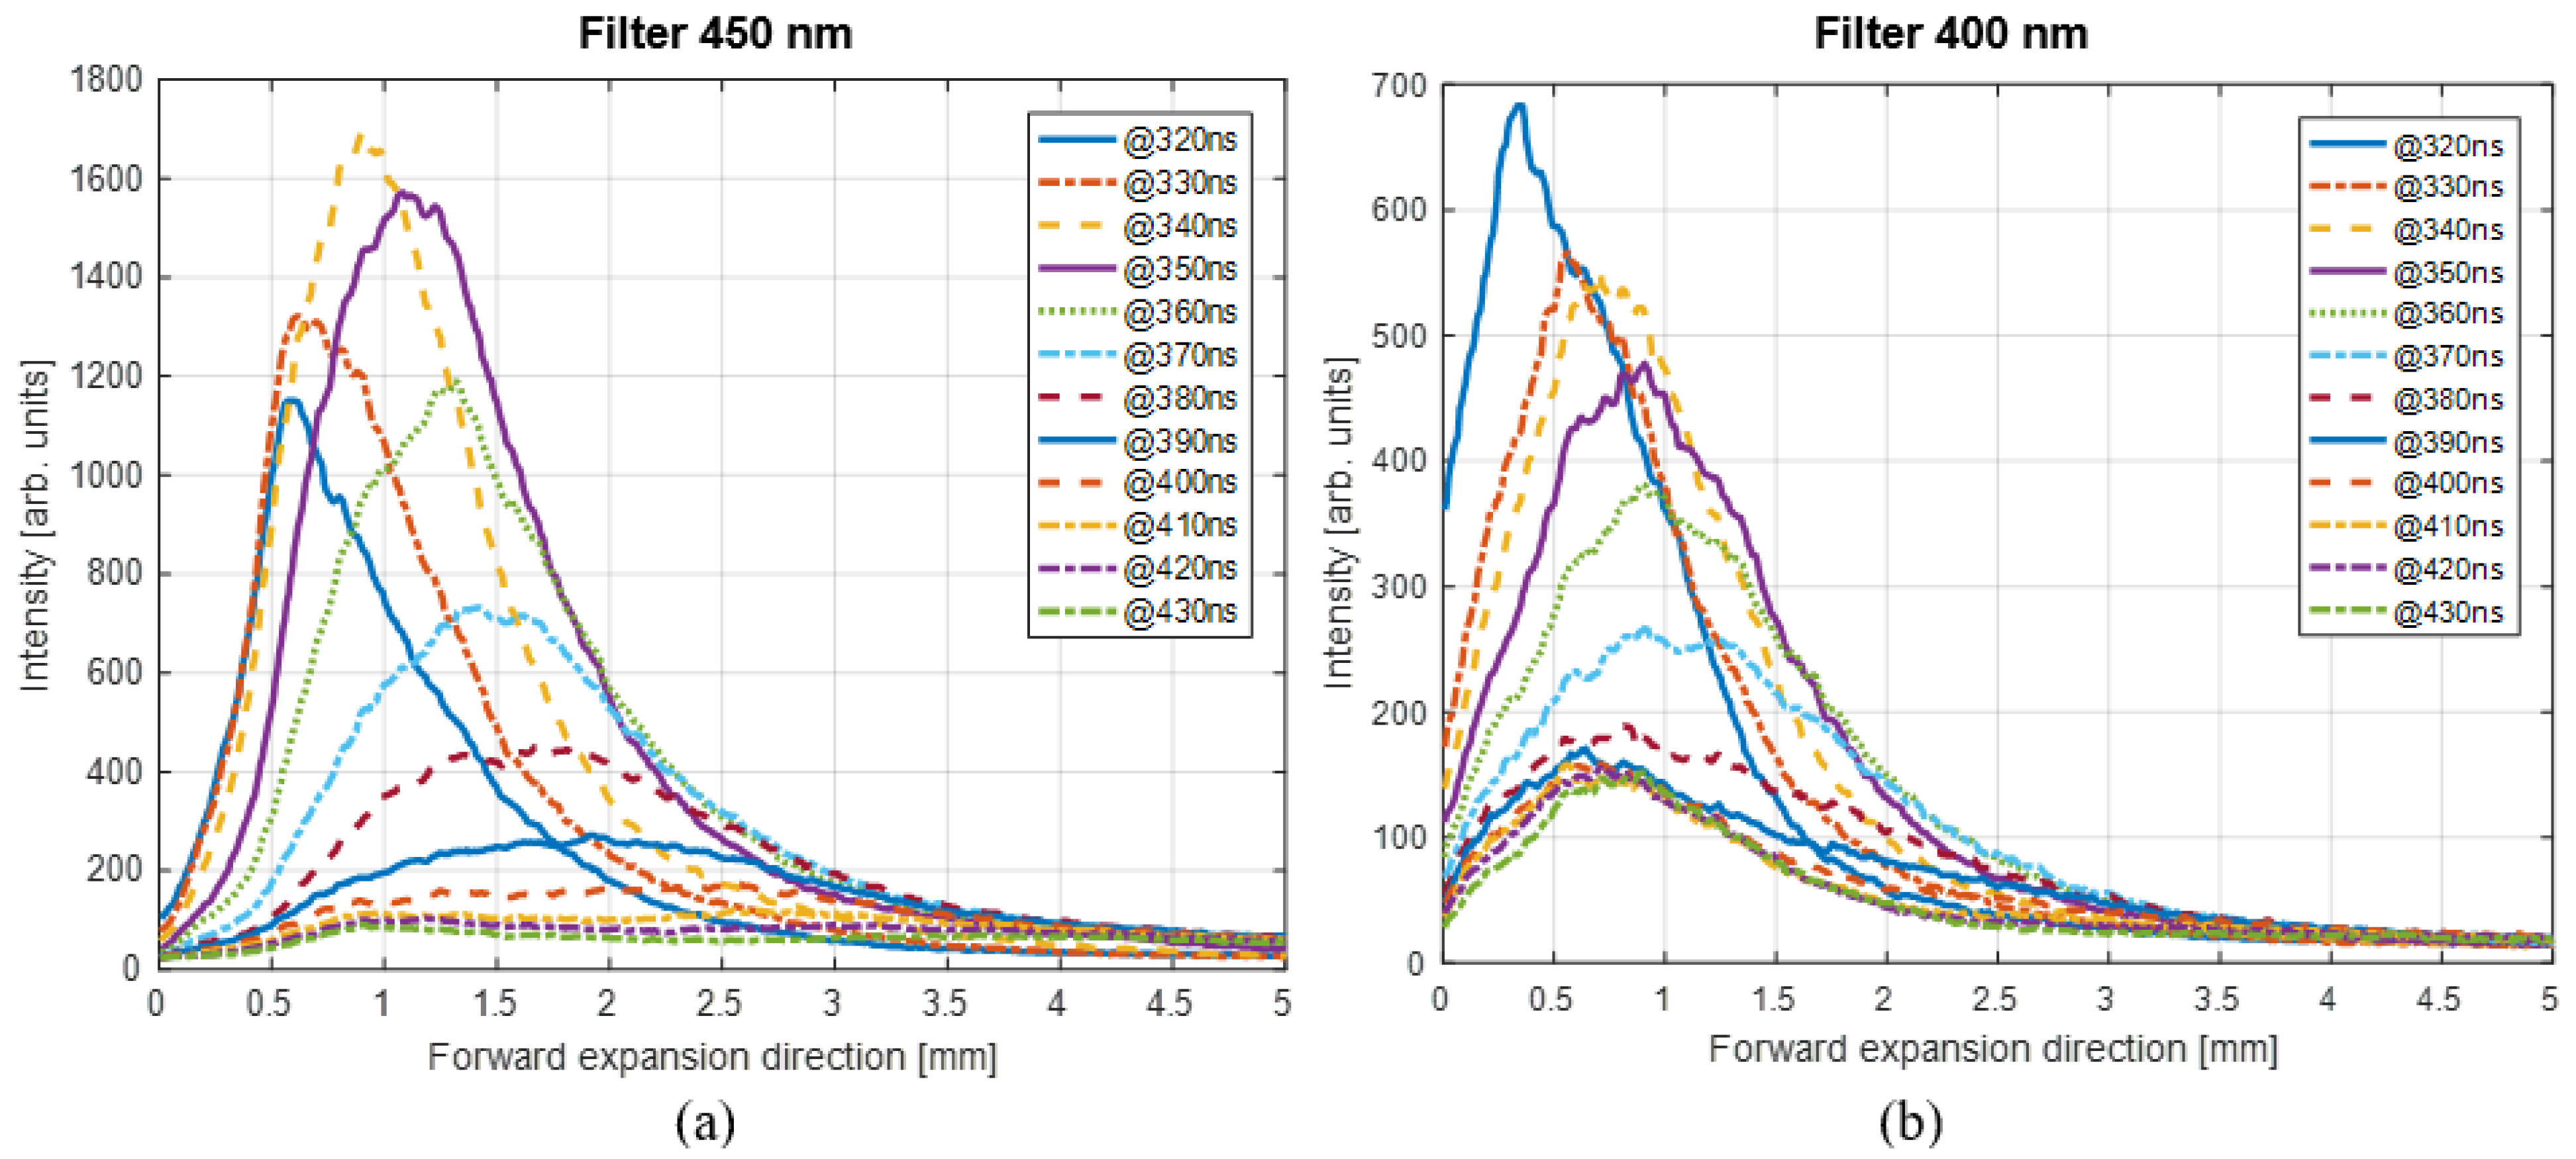
Figure 7a,b illustrate the intensity profiles for the 450 nm and 400 nm filters, respectively. The emission seen with the 450 nm filter peaks at 340 ns, and thereafter, it decreases. It is also evident that as one advances away from the target surface, the emission increases quickly, reaches a peak, and then declines almost exponentially with the distance.
For the ions, the peak emission occurs at ~1.0 mm, while for the neutrals, it is at ~0.4 mm. This is consistent with the idea that the more highly ionized atoms move at a higher velocity and, thus, have traveled further from the target in the same time frame compared to the neutrals. The aluminum stagnation layer for the neutrals is generally smaller and forms closer to the target. There are a number of competing effects here, which are as follows: The neutrals are moving more slowly, and hence, the mean free path (m.f.p.) is reduced. Conversely, the absence of charge will increase the m.f.p. compared to the ions.
Close to the target, the density is the highest, and hence, this is the most likely reason for the difference in the stagnation layer. Further away from the target, the density is not sufficient to form a stagnation layer from the neutrals.
At Δτ > 400 ns, for the 400 nm and 450 nm filters, Figure 4 shows evidence that the stagnation layer for the neutrals is thinner and shorter than that for the ions, reflecting the change in the collisionality parameter for the two species. However, it must be said that the emission from the seed plasmas makes a definite conclusion difficult in the case of the neutrals.
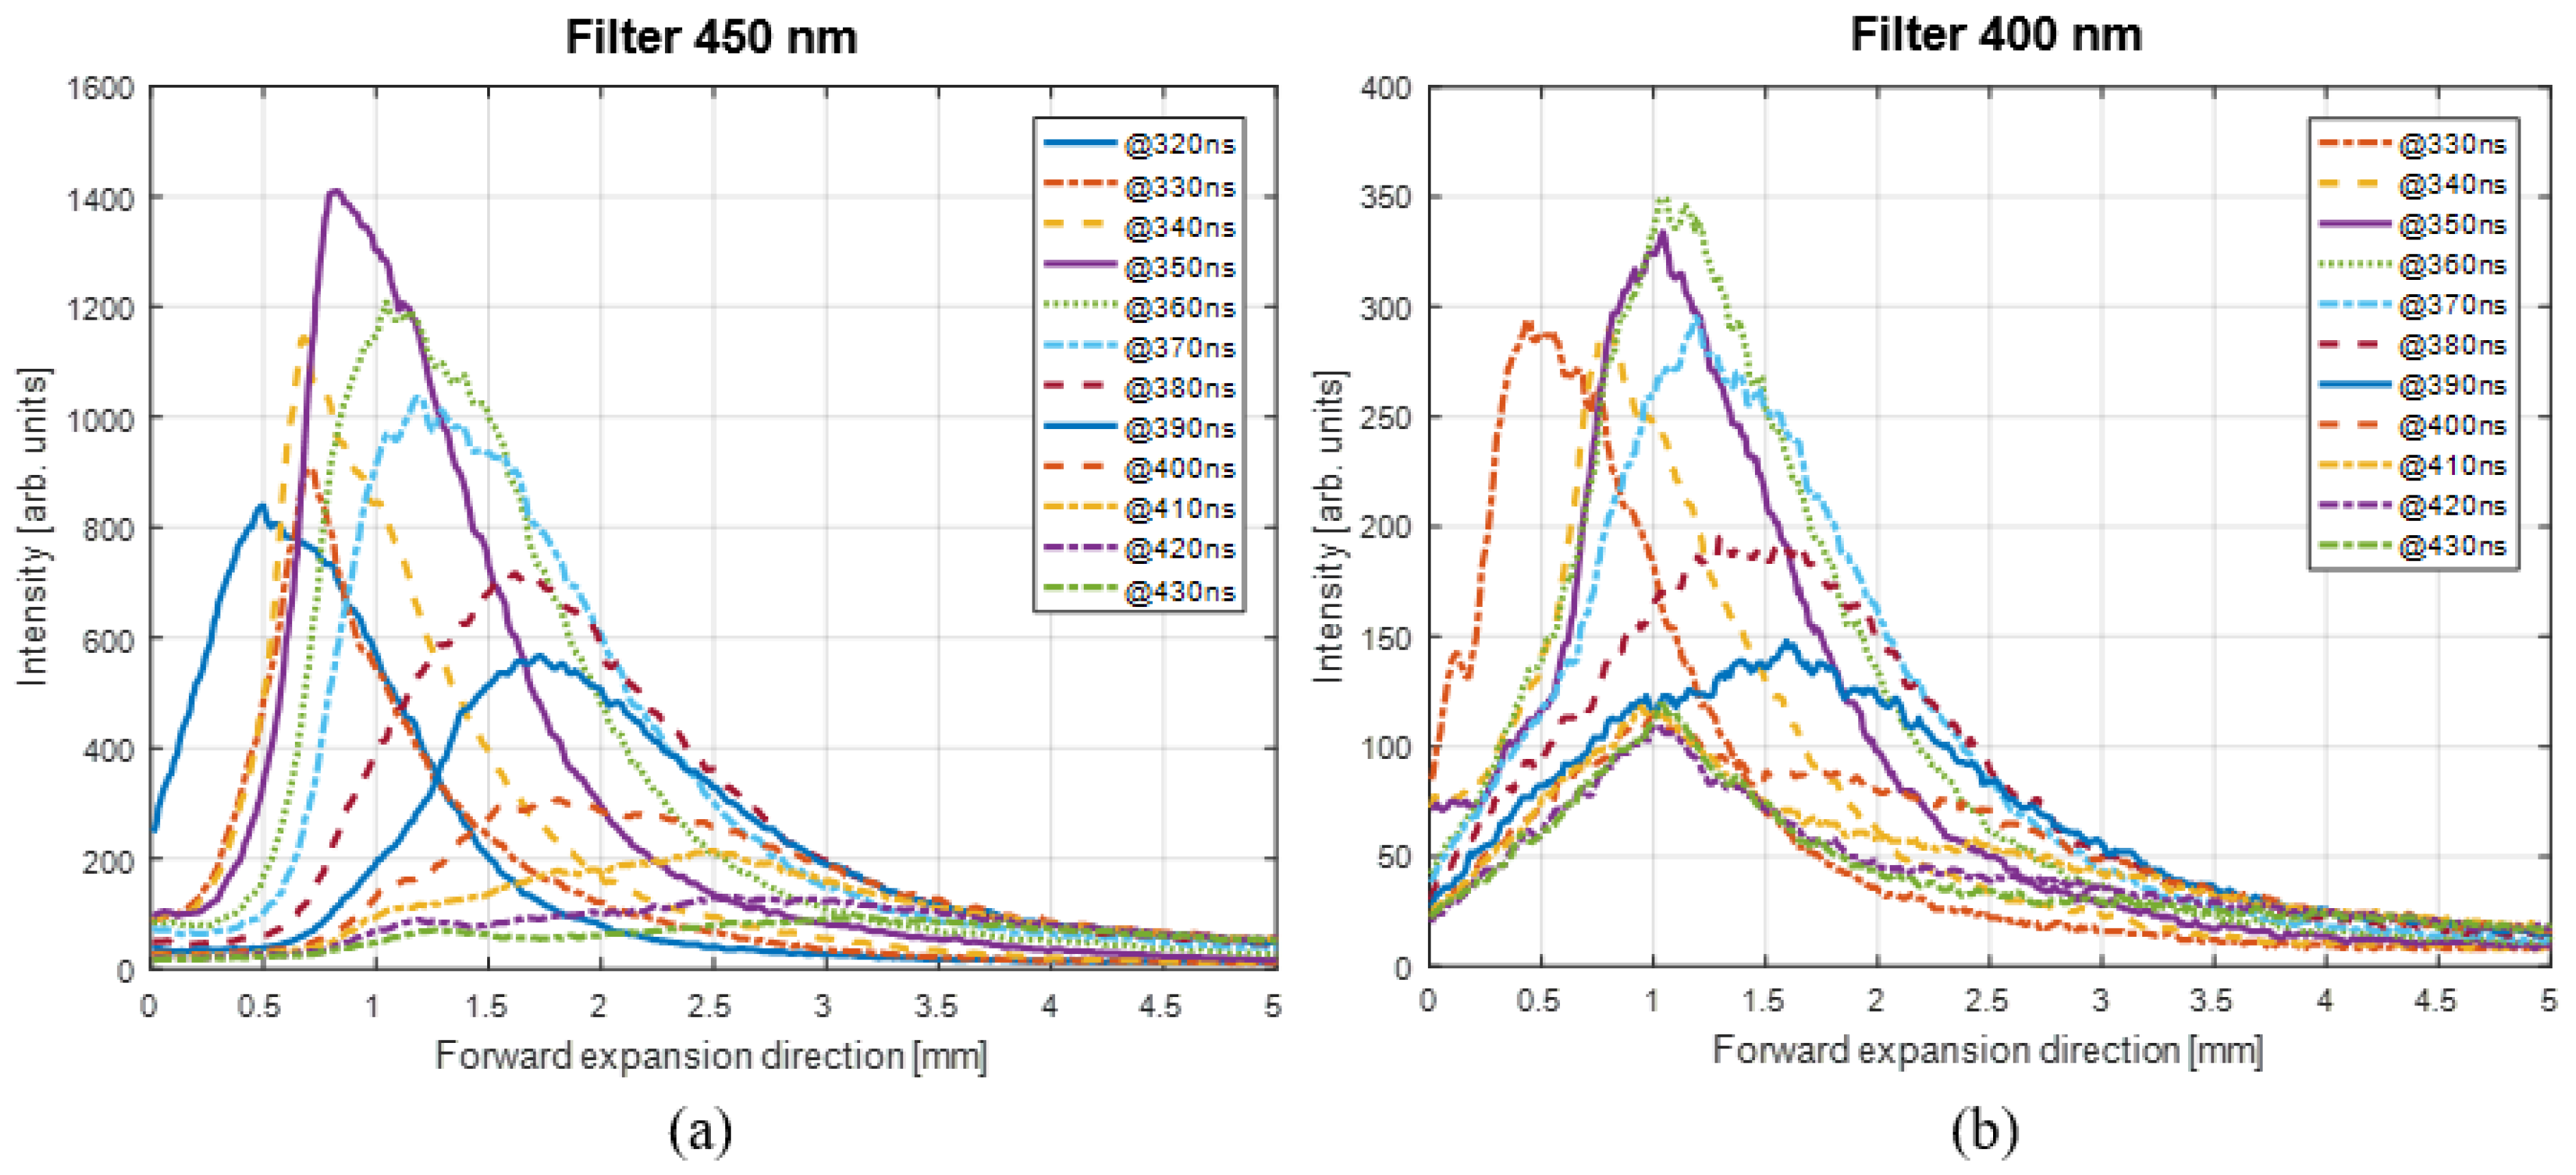
The aluminum emission profiles at a seed separation of 2.16 are shown in Figure 8. The peak in the ion signal occurs at 350 ns (later compared to D = 1.66 mm) and at Δτ = 360 ns for the slower-moving neutrals.
In general, the length and width through the time evolution of the stagnation layer at the 450 nm filter are smaller for the larger D value, as shown in Figure 9. Additionally, at the 400 nm filter, it can be observed that the length and, to some extent, the width stop increasing before the end of an interaction zone life cycle at both seed separations.
Additionally, the plume observed by the 450 nm filter (ions) is smaller at an earlier time compared to the emission from the neutrals observed by the 400 nm filter. This trend is reversed at later stages. This is most likely due to the fact that the neutrals do not stagnate at later time intervals.
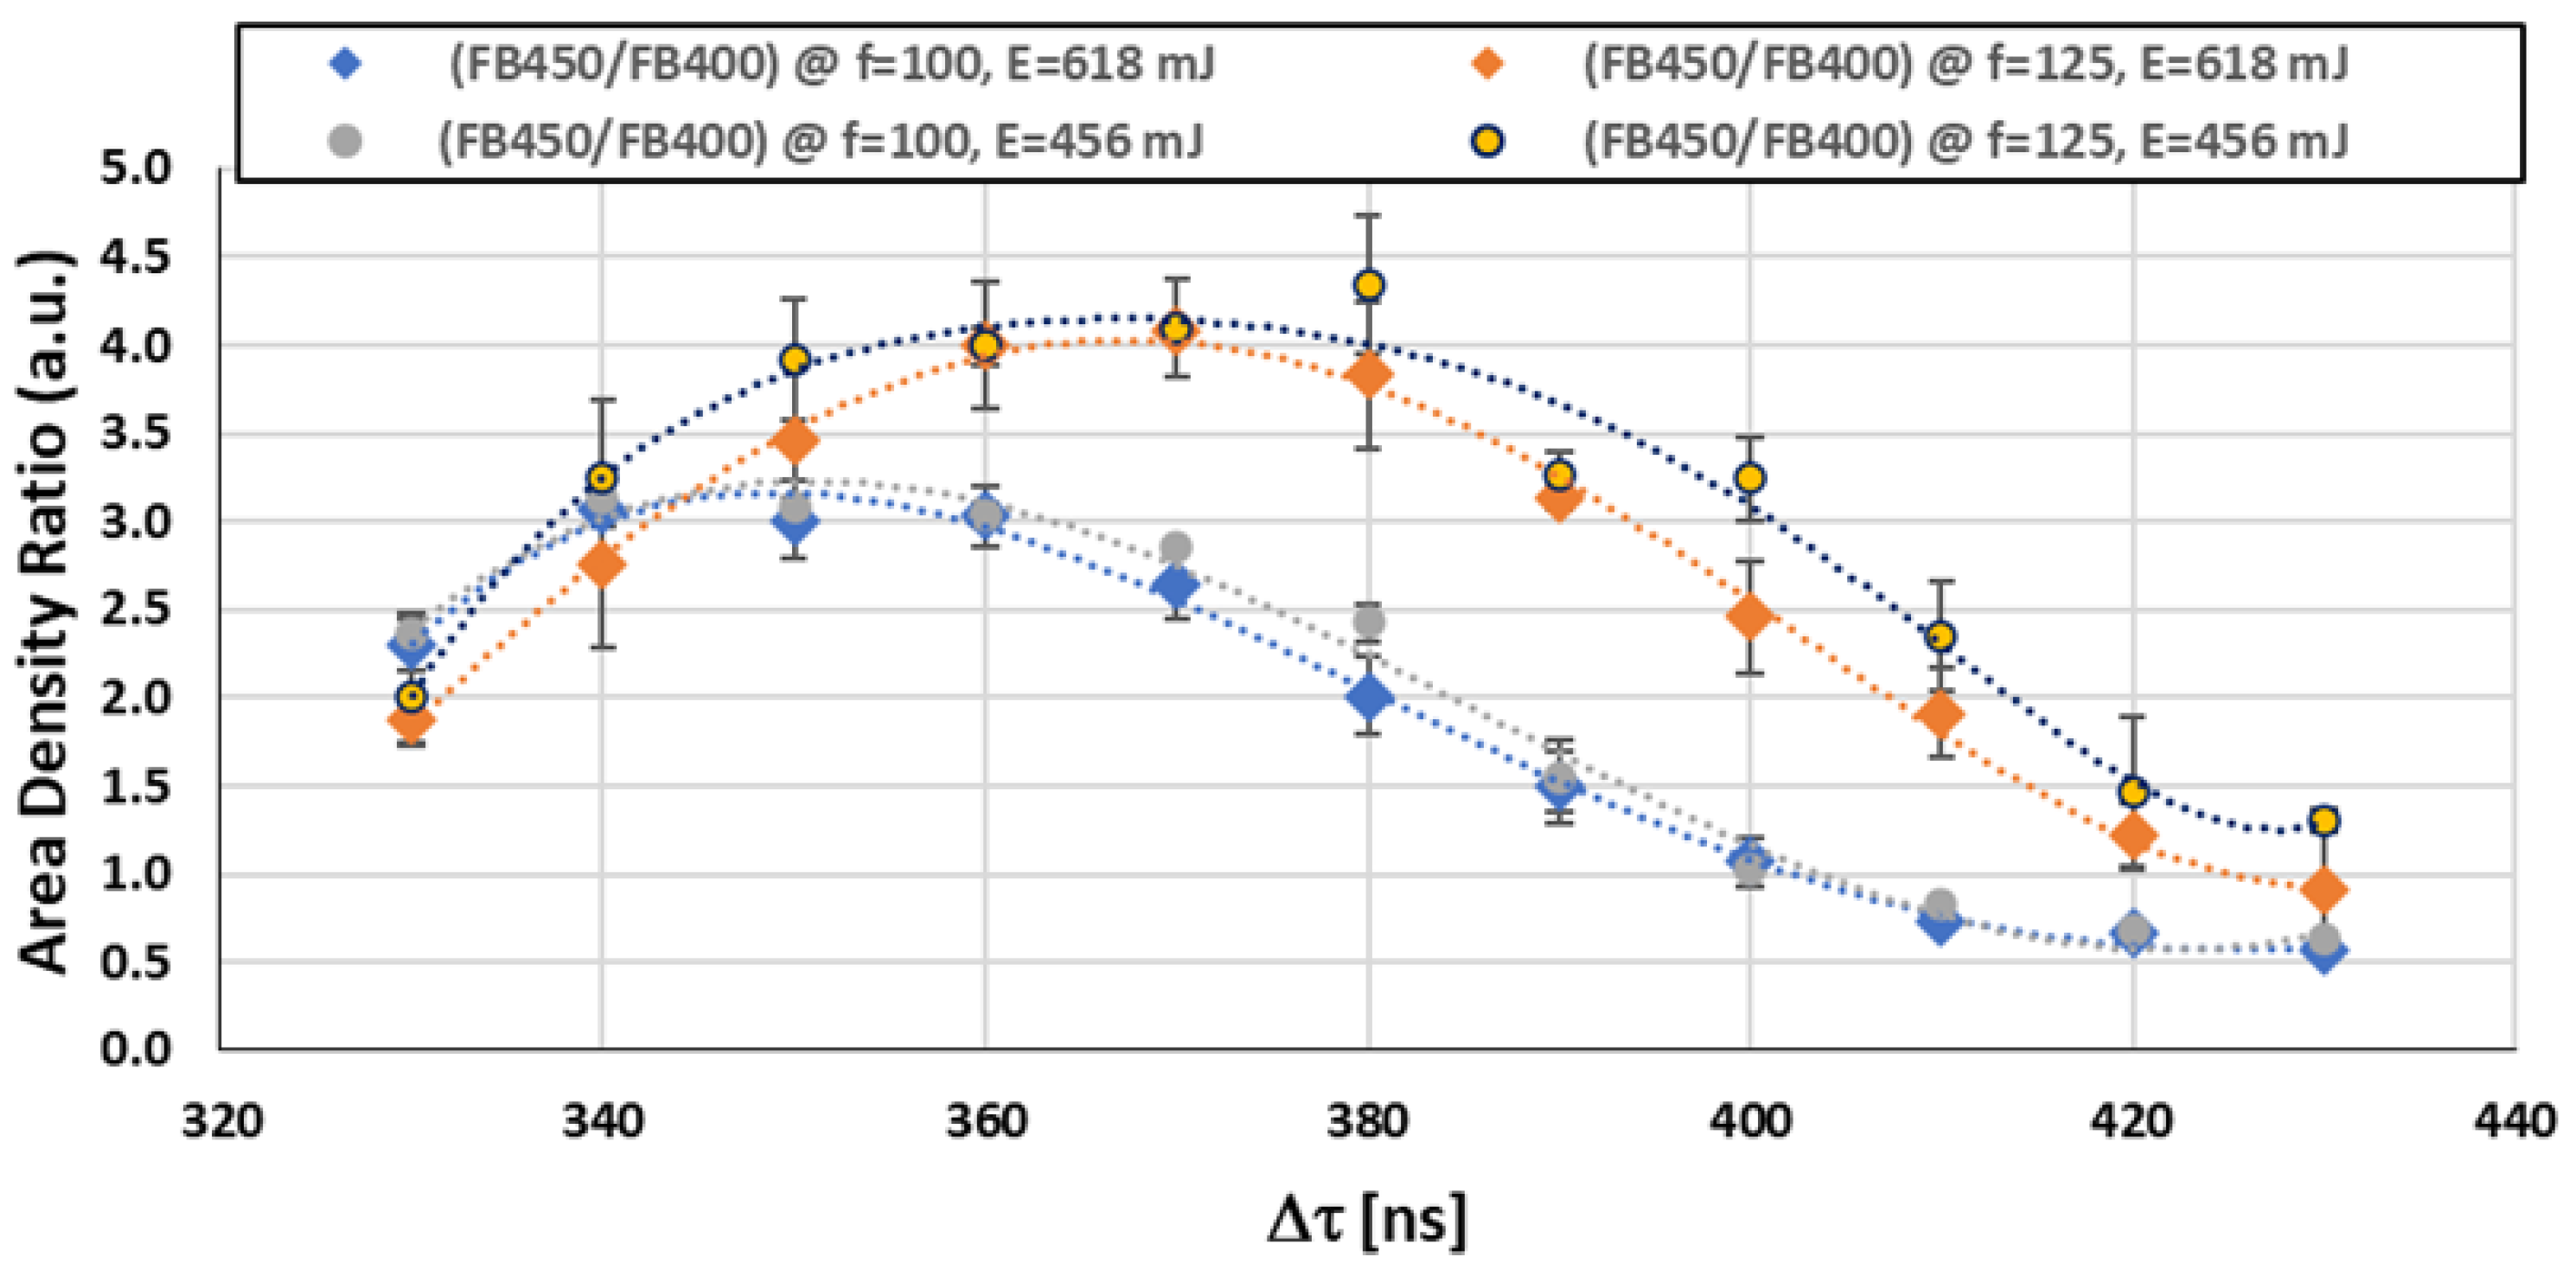
The ratio of Al ion to Al neutral emission can be investigated by measuring the emitting area of each species. This is shown in Figure 10. The emission density ratio (i.e., area density ratio “AD”) is always greater than one for the considered time range at Δτ < 400 ns. This suggests that the ionic species should dominate over the neutral ones at these timescales. The effect is enhanced with the larger seed separations.
A typical emission spectrum for the Si stagnation layer and the related peaks is listed in Table 2. As can be seen, the neutral emission is much weaker compared to the ion emission. The 400 nm filter captures the emission from the lower ionization stages better than the 450 nm filter.
The results for the colliding silicon plasma are shown in Figure 11. The two filters produce image sets that are broadly similar (whereas the aluminum emission was quite different when comparing the 400 nm and 450 nm images). There are some minor differences. Thus, in the case of silicon, the 450 nm filter tracks the behavior of the stagnation layer formed by the ions only, whereas the 400 nm filter captures both the ion and neutral emissions. It might be expected that the neutral and ion emissions would have different characteristics.
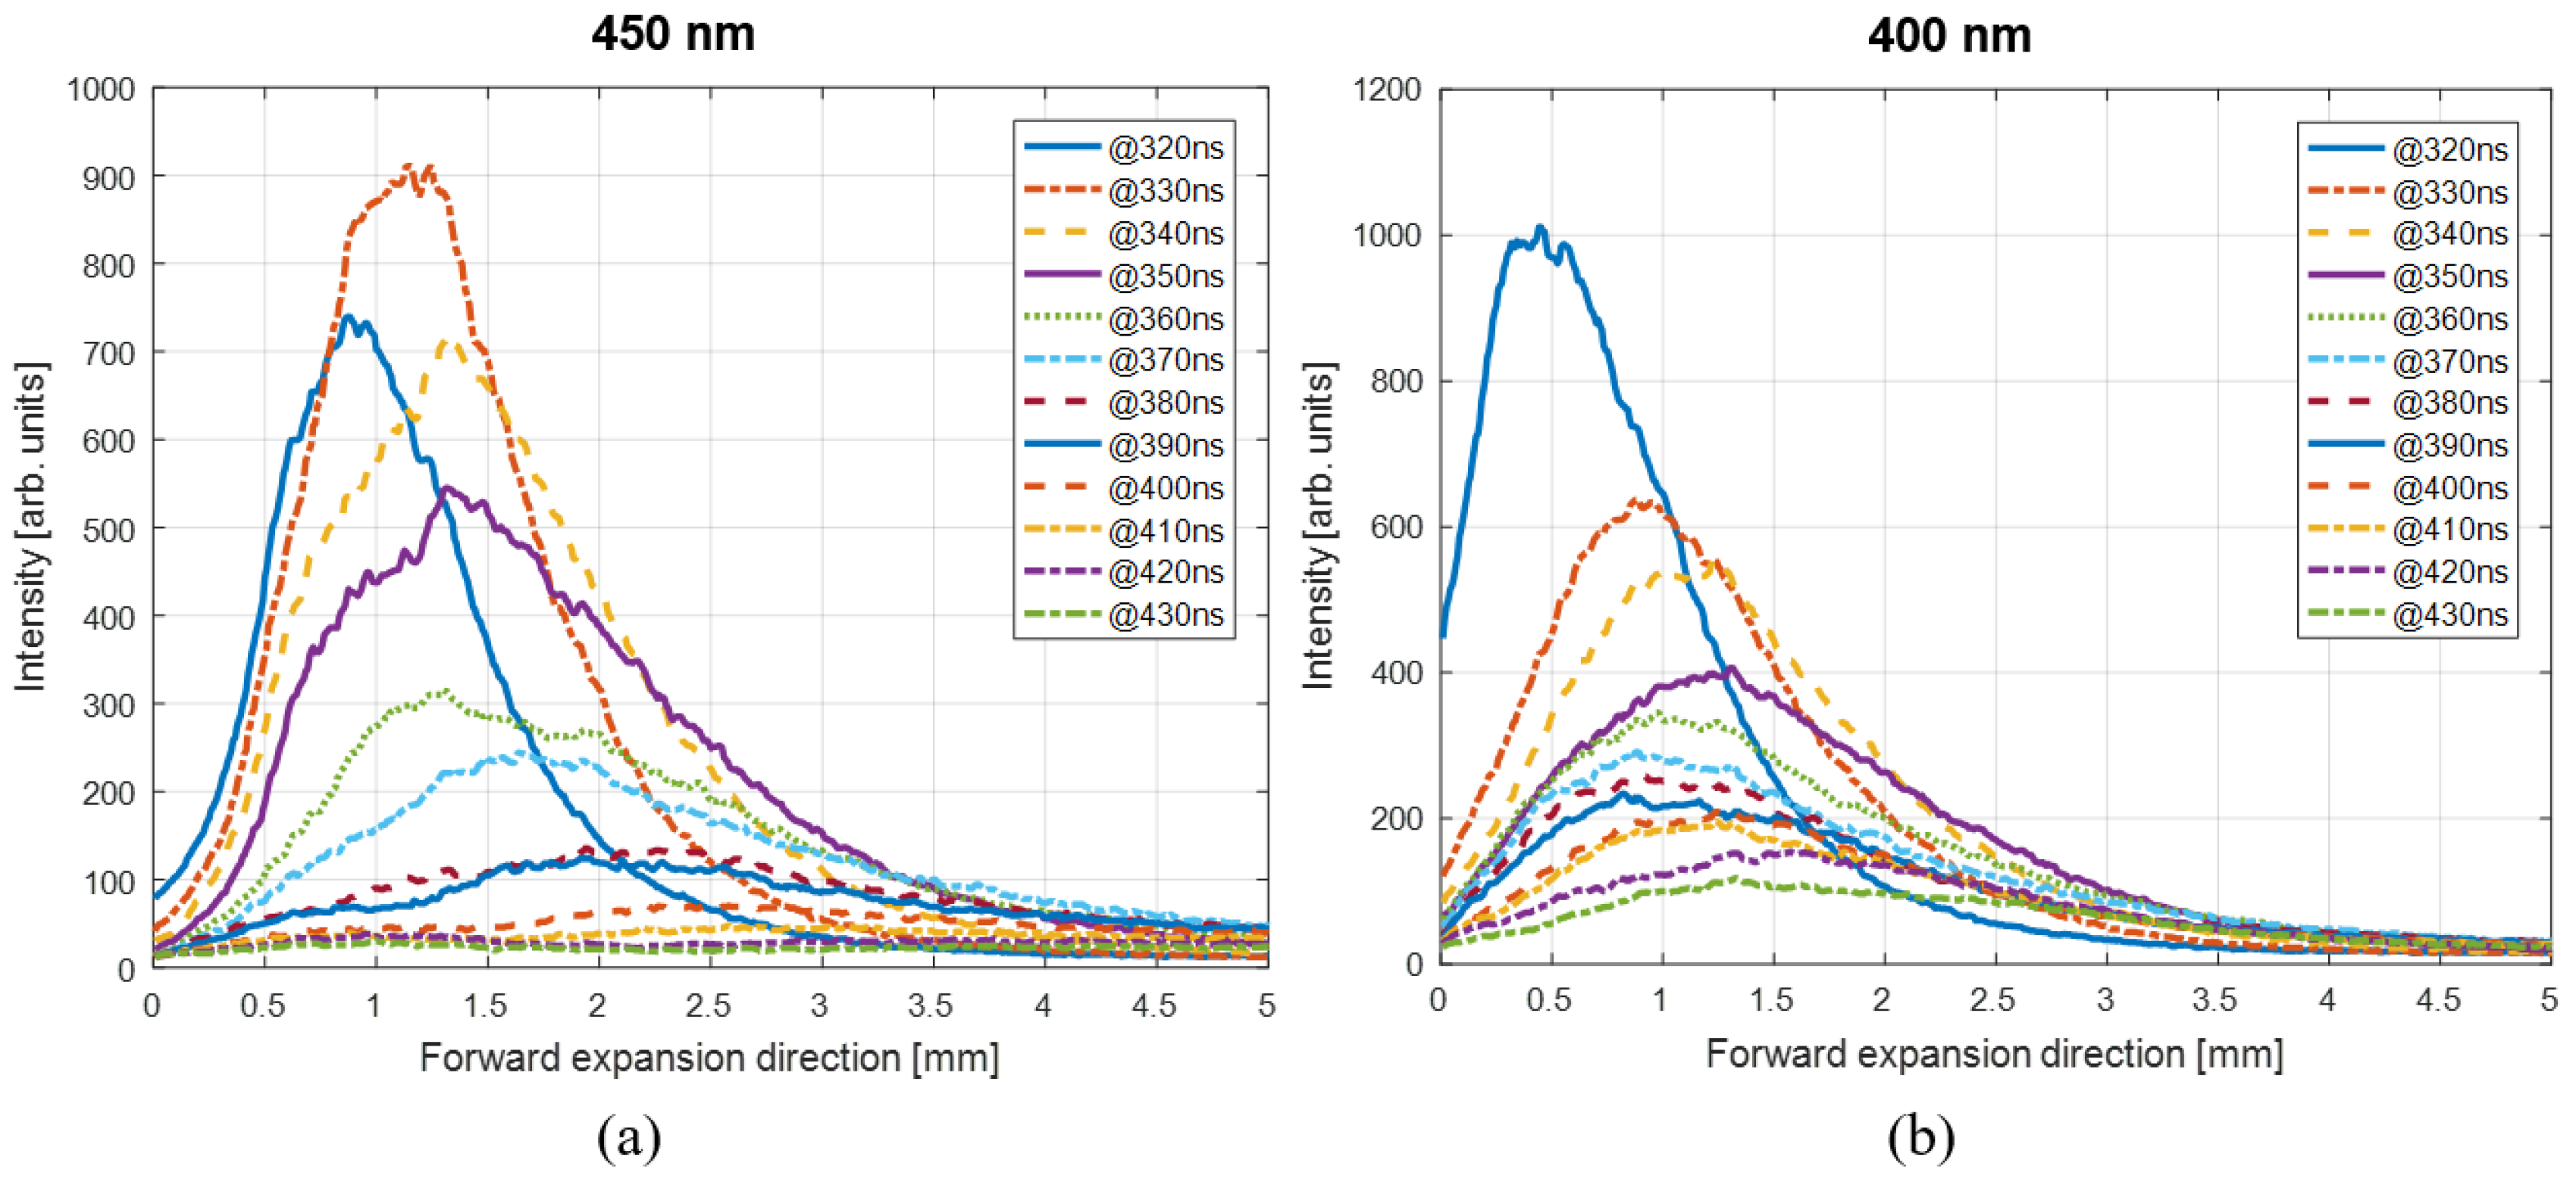
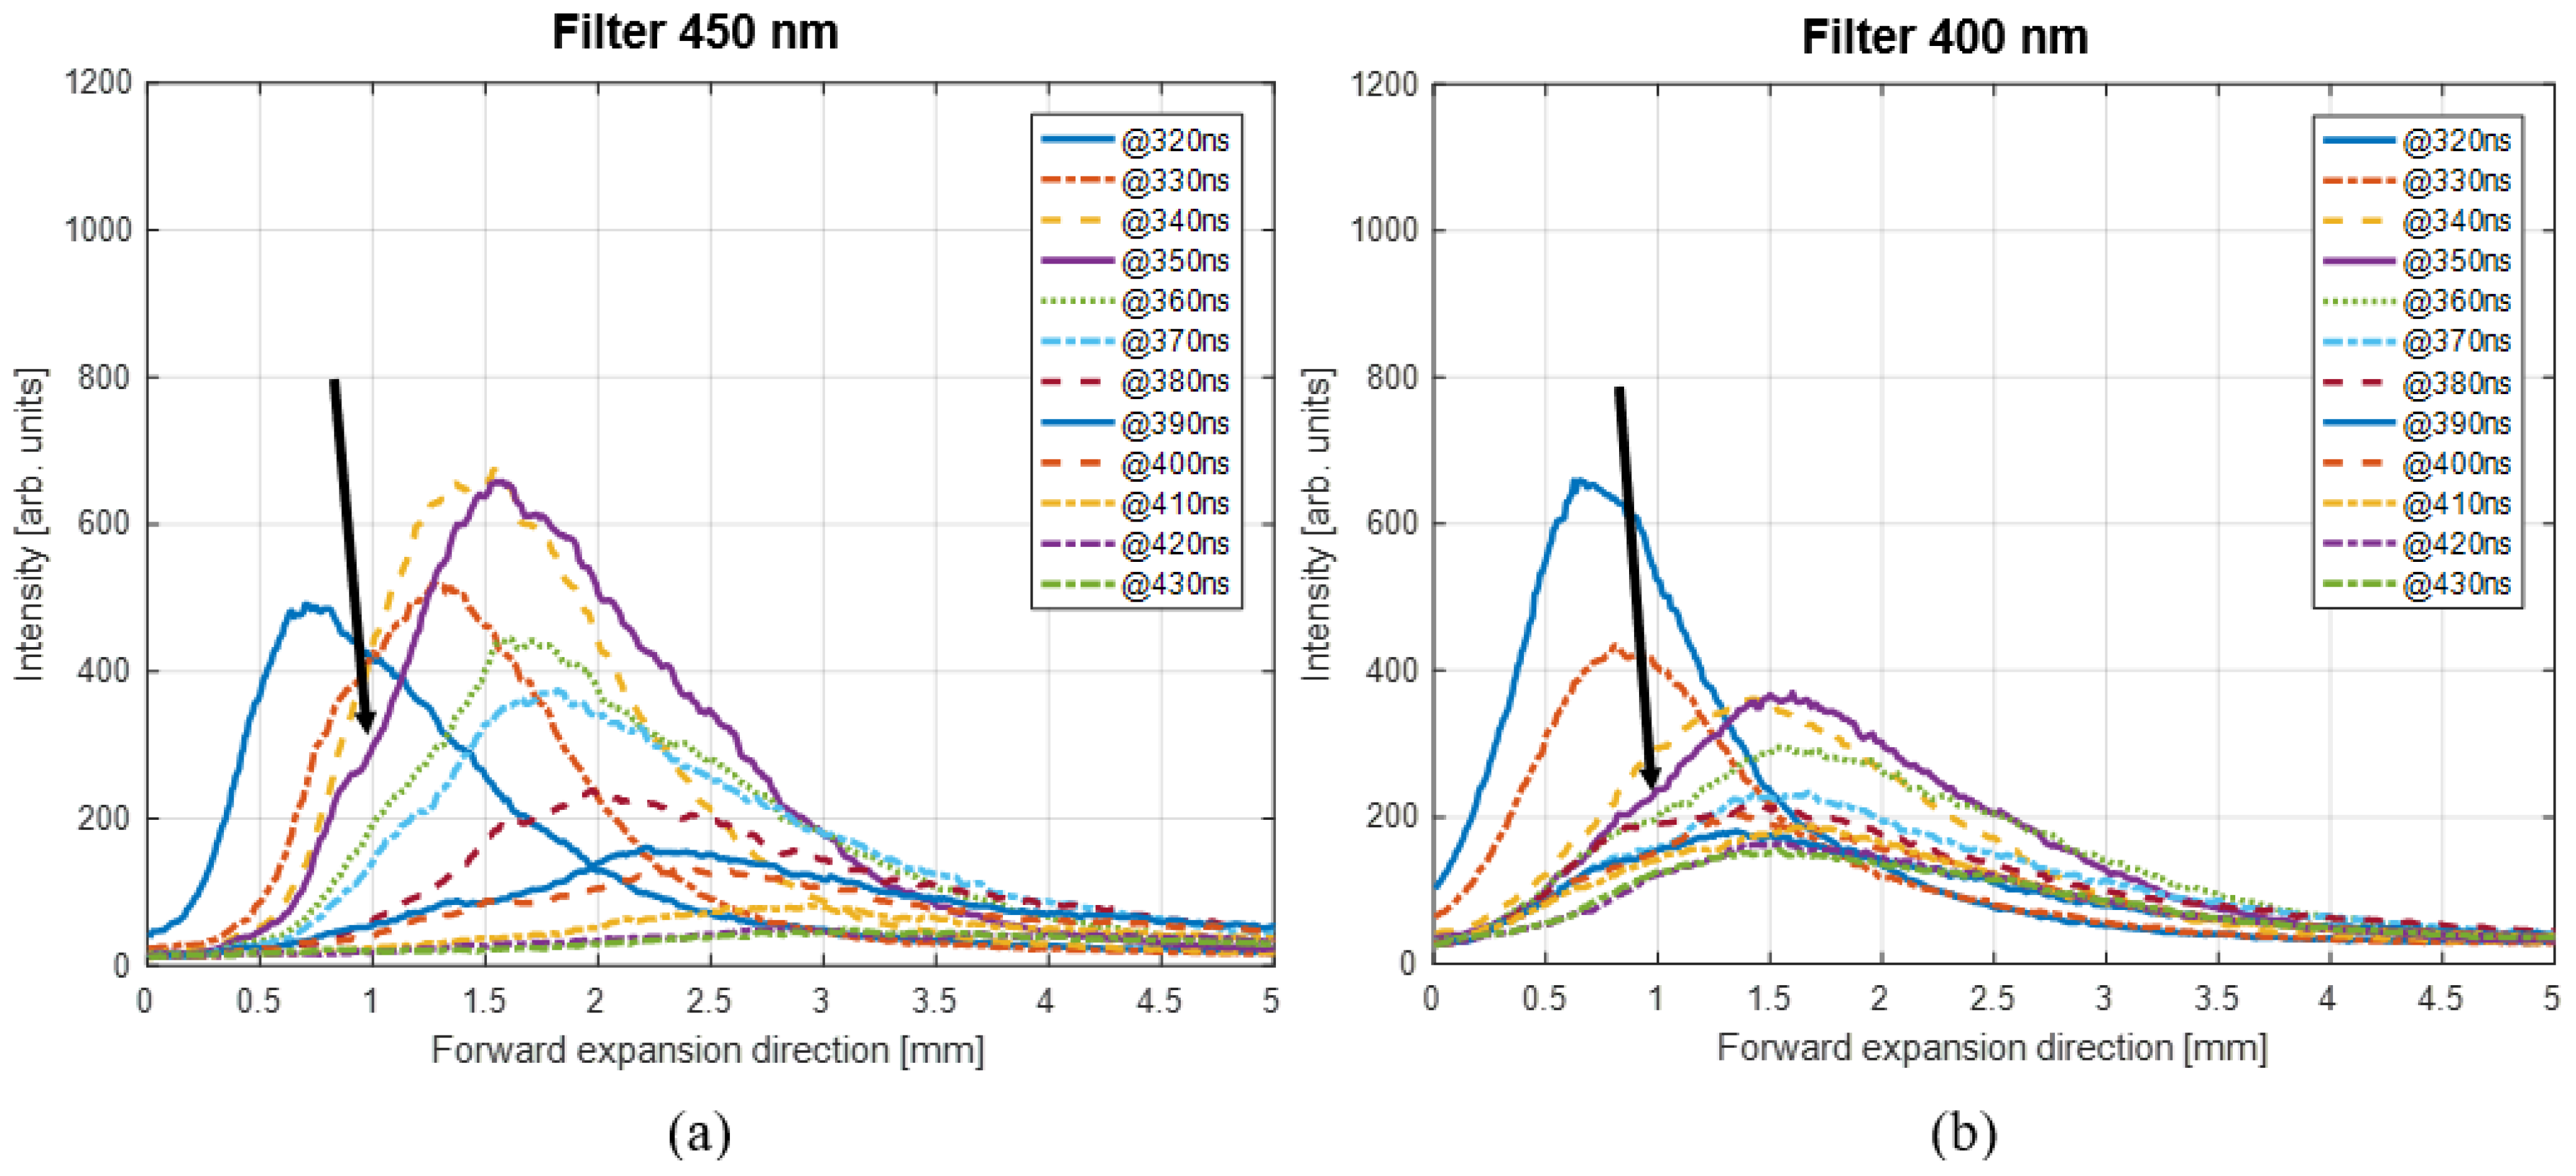
Figure 11 shows that most of the emissions are in the 400–450 nm range at D = 1.66 mm, and the emission profiles are shown in Figure 12. Typically, the emission peaks at the 450 nm filter are around 1.5–1.6 mm from the target and decrease exponentially after that.
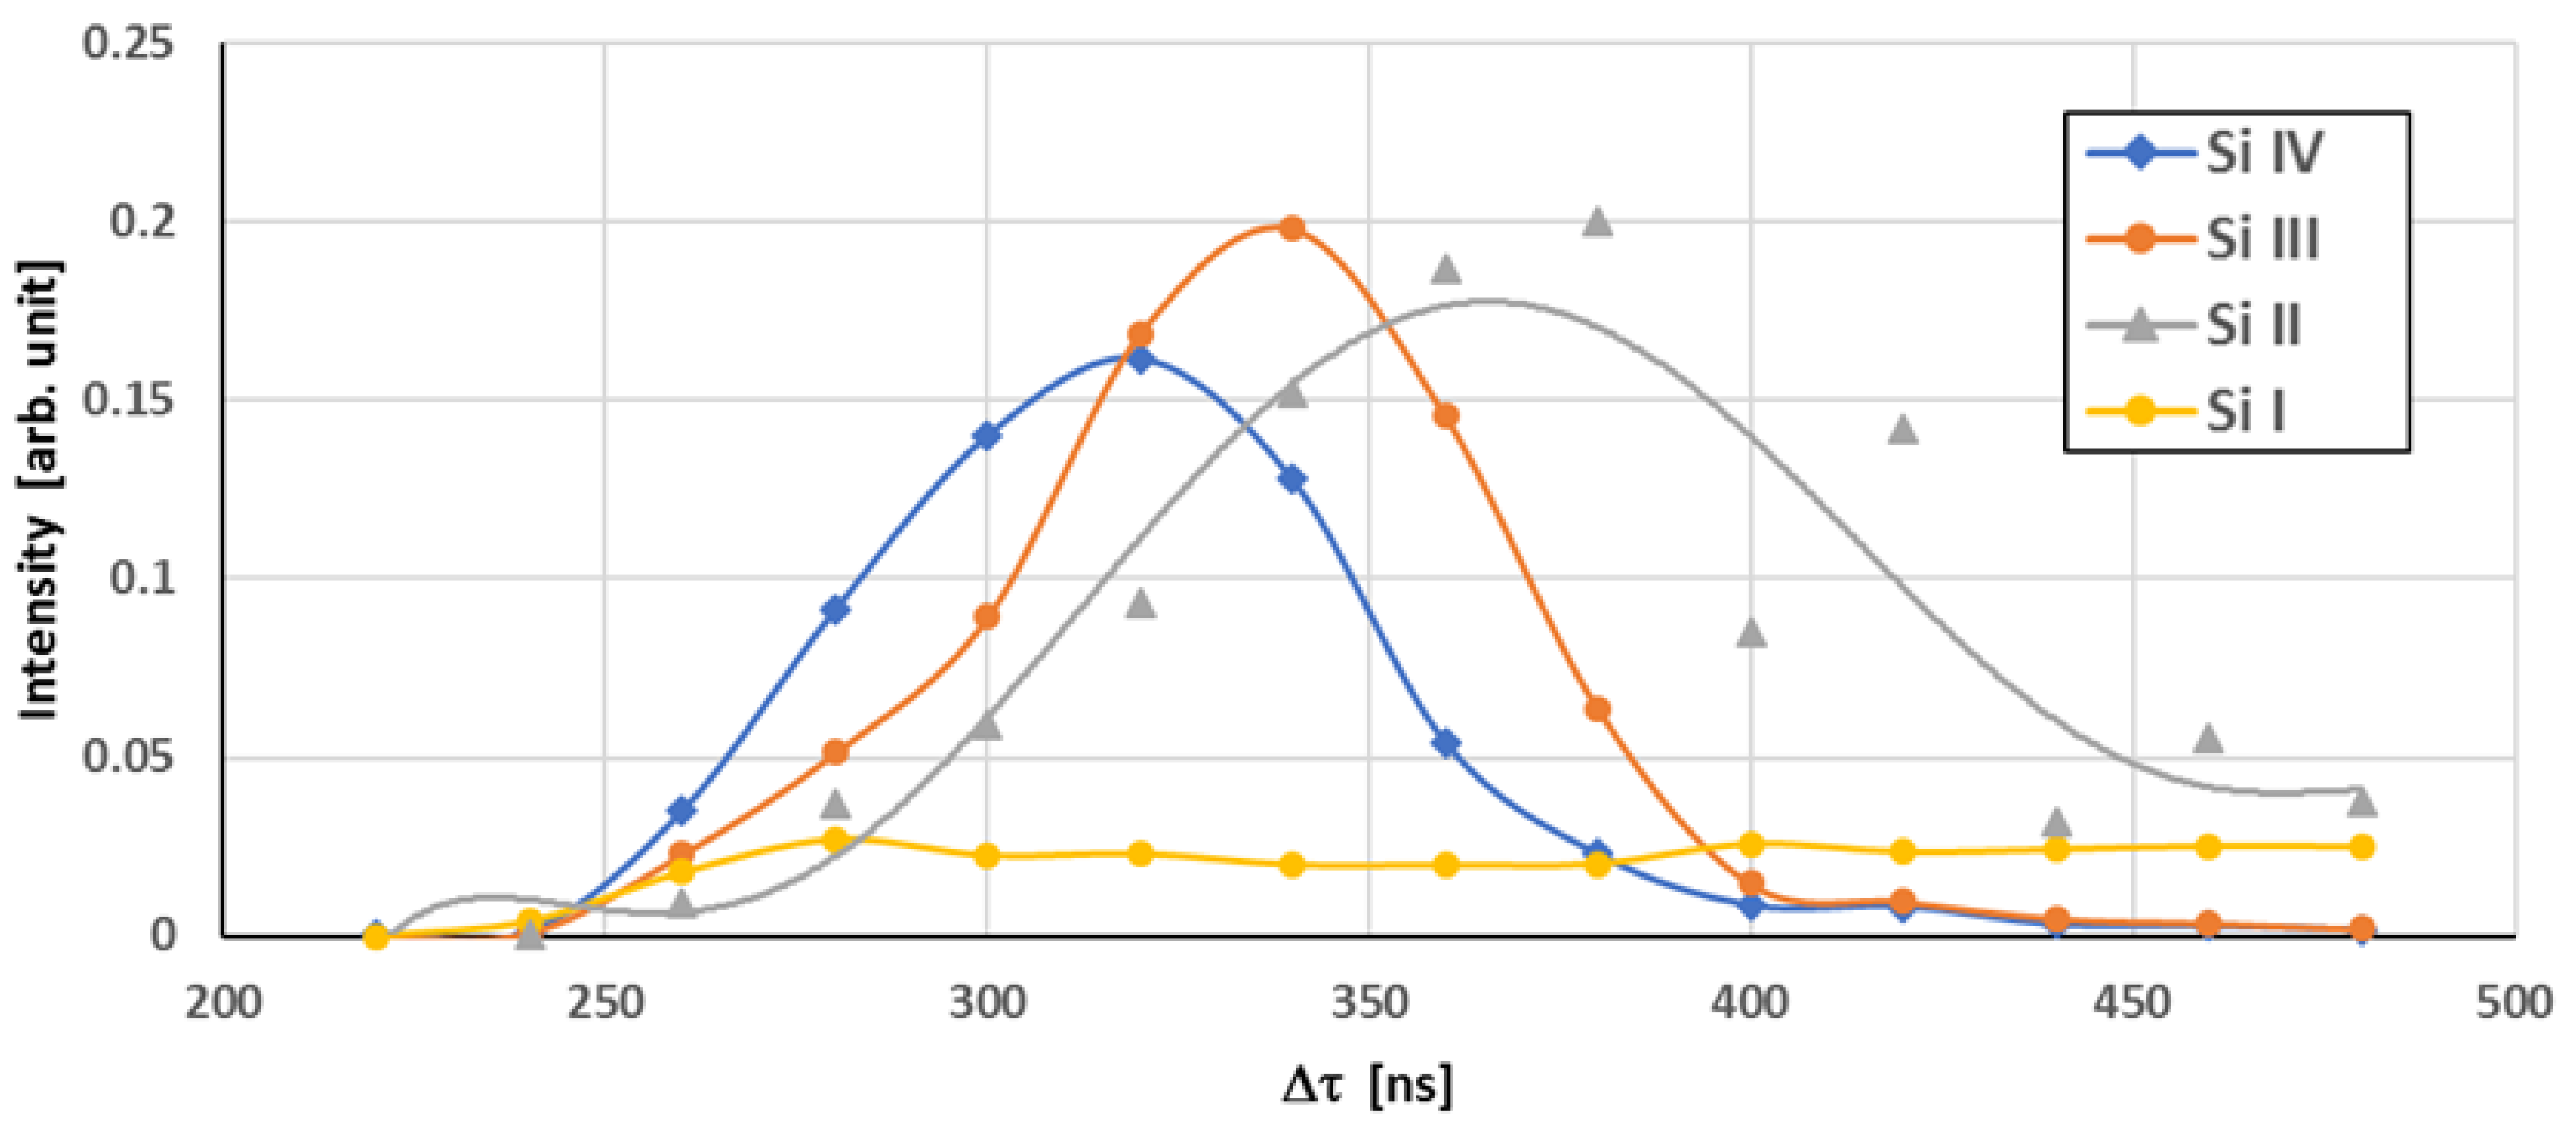
Additionally, the spectra in Figure 13 show a simple relationship between the peak emission time and the ion stage. The higher ion stages appear first, and the collisionality parameter is higher for these species.
The tracking of the peak intensity and its profile in the forward expansion direction gives a general picture of how peak emissions vary over time and distance, as shown in Figure 14.
In the case where the seed separation is relatively large (D = 2.16 mm instead of D = 1.66 mm), the silicon stagnation layer is better separated, and these graphs are easier to interpret. The peak emission times and distances are larger than those for D = 1.66 mm. There is evidence that the emission profiles have a shoulder (as shown in Figure 14) from 350 ns onward. This could be the separation of the faster-moving ions from the lower ion stages. The ion emission will dominate at the earlier times and then decrease as the emission from the lower ion stages increases, as shown in Figure 13.
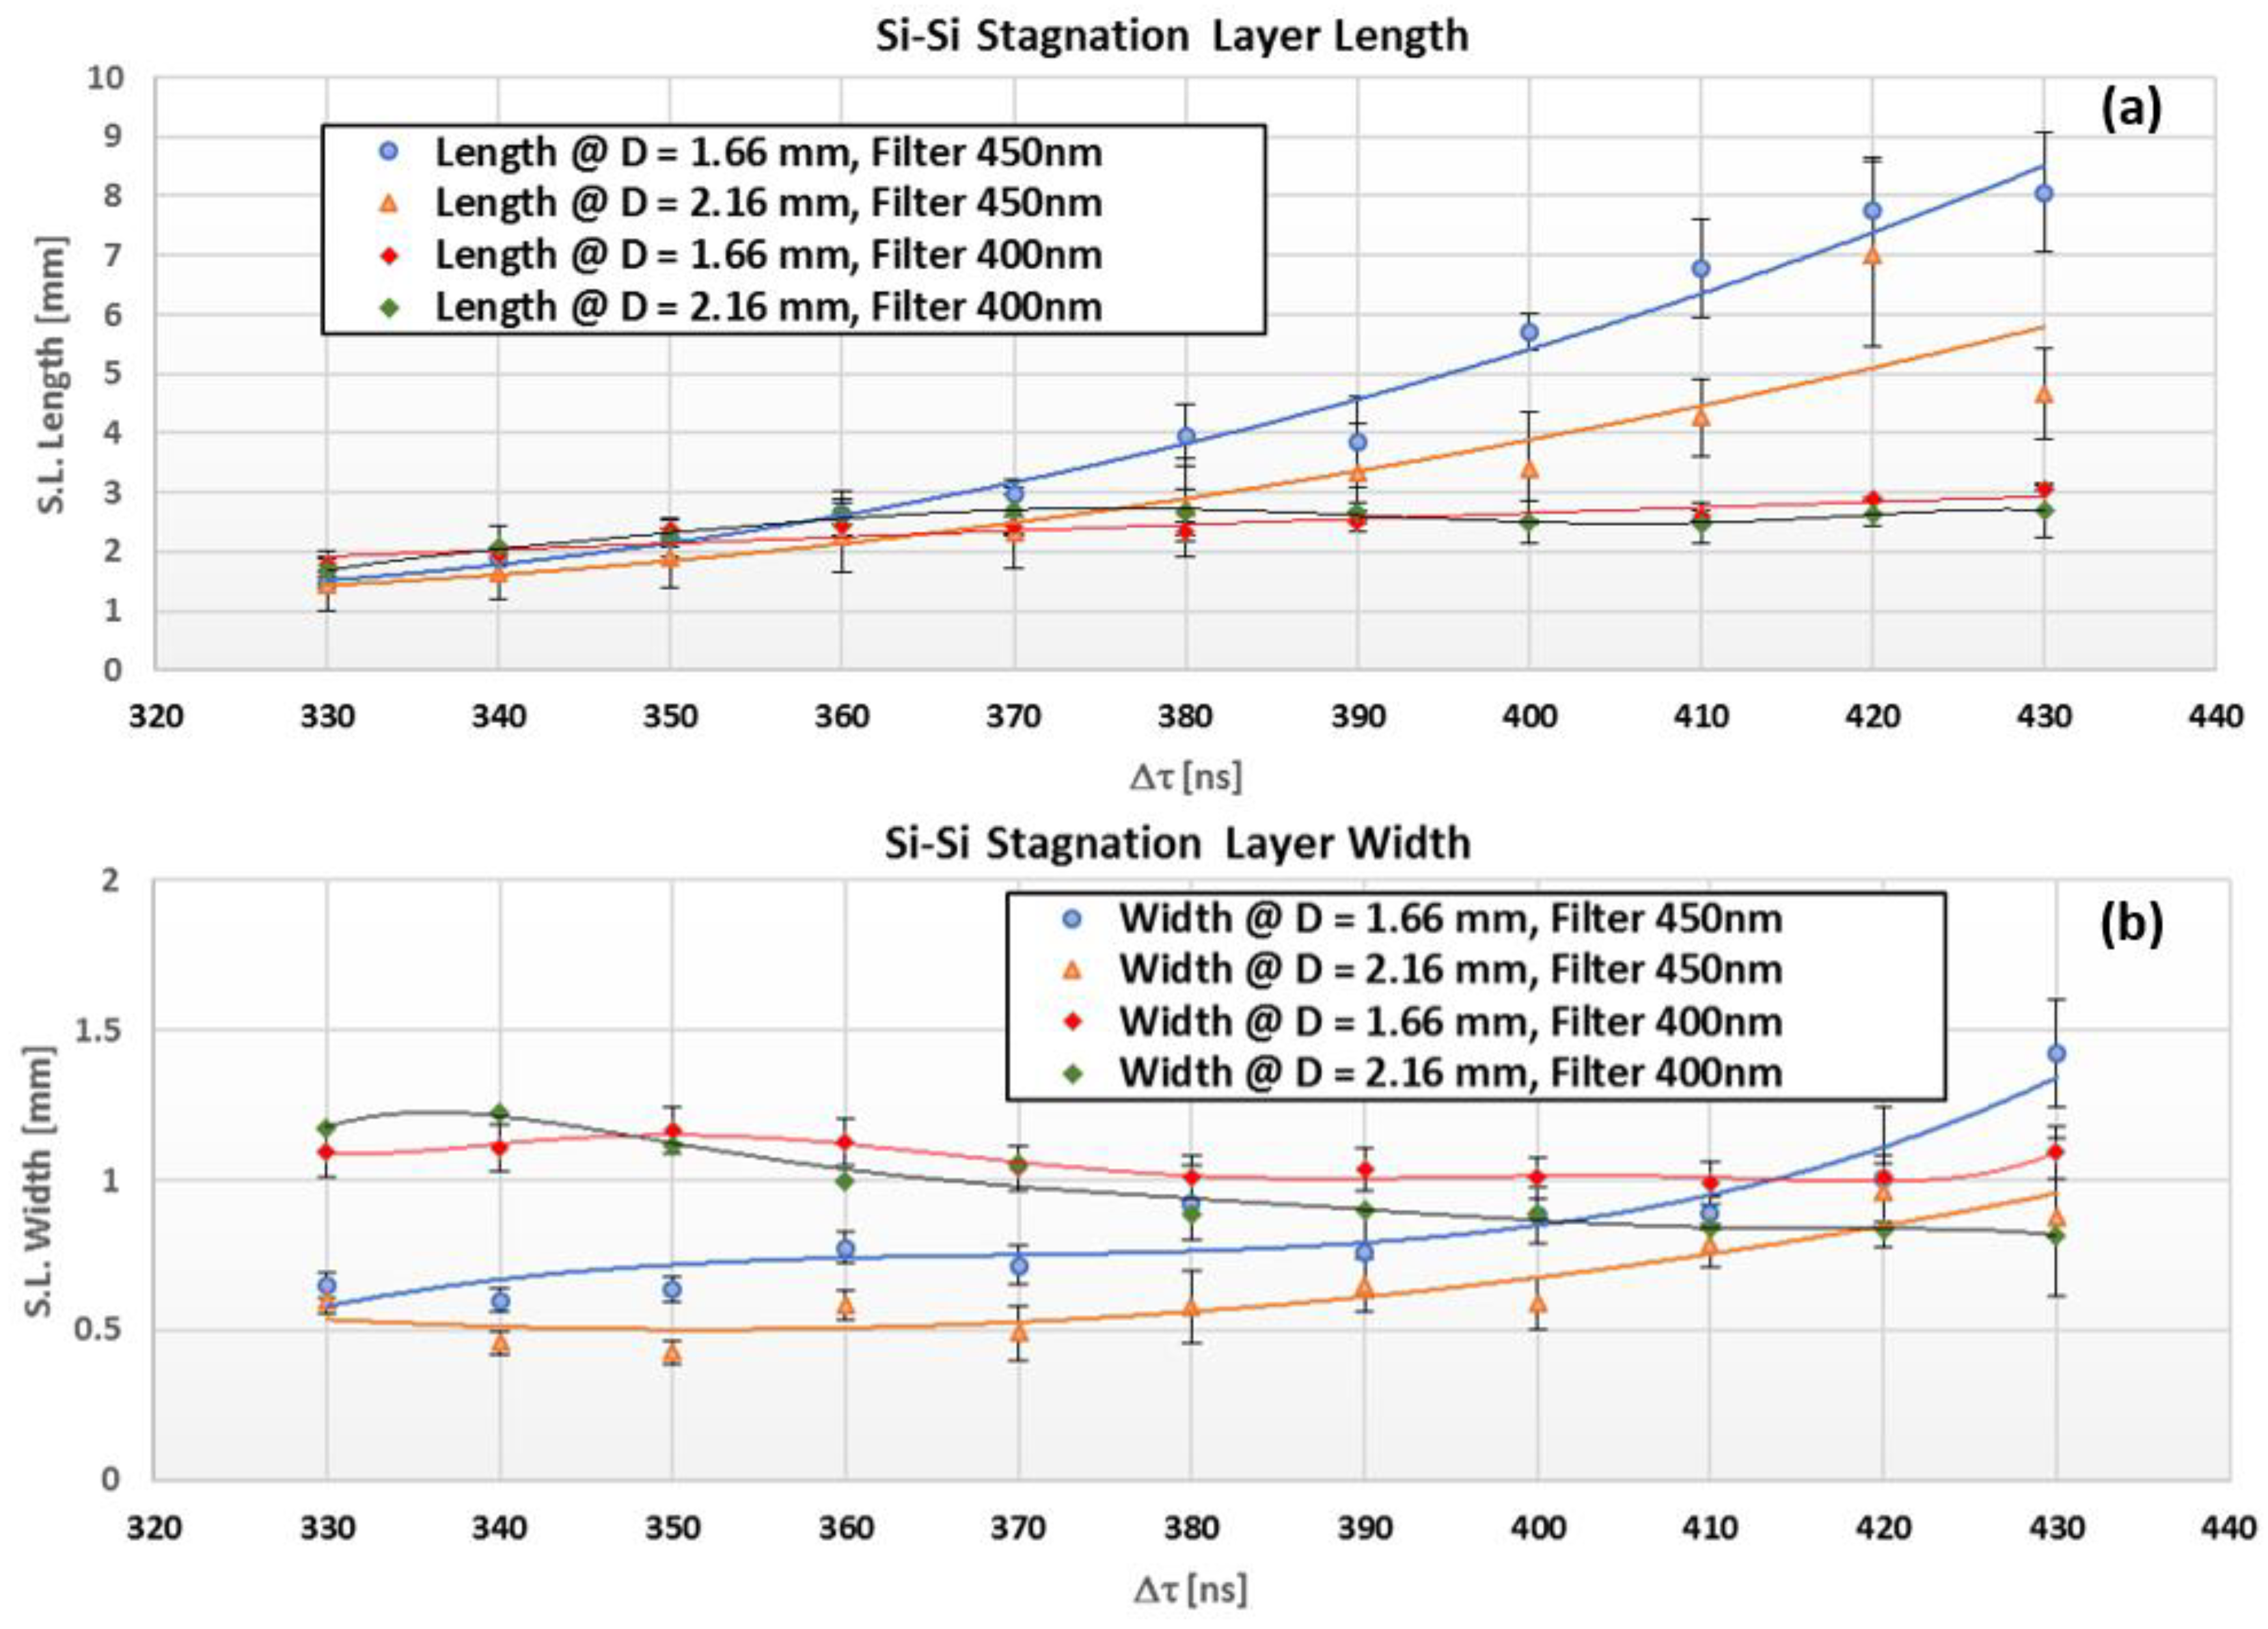
As for aluminum, the lengths and widths through the time evolution of the silicon stagnation layer are smaller for the larger D value for the 450 nm filter, as Figure 15 illustrates. Additionally, the width starts off smaller for the 450 nm filter compared to the 400 nm filter, but it reverses after 410 ns. A narrower width would indicate a harder stagnation layer, and this could be due to higher levels of ionization.
Sizyuk et al. [17] showed the time-varying spectra in the visible region for carbon colliding plasma at elapsed times of 250, 500, and 750 ns from ablation in the colliding plasma region using three different laser spot sizes of 250 µm, 500 µm, and 1000 µm. The time-resolved emission spectra illustrated how the area of the ionic line emissions grows intermittently and unexpectedly when the laser spot size is increased (i.e., a reduction in the laser intensity). This might give an explanation of what had been observed in the stagnation layer dynamics in this work at EL = 670 mJ and even for EL = 618 mJ.
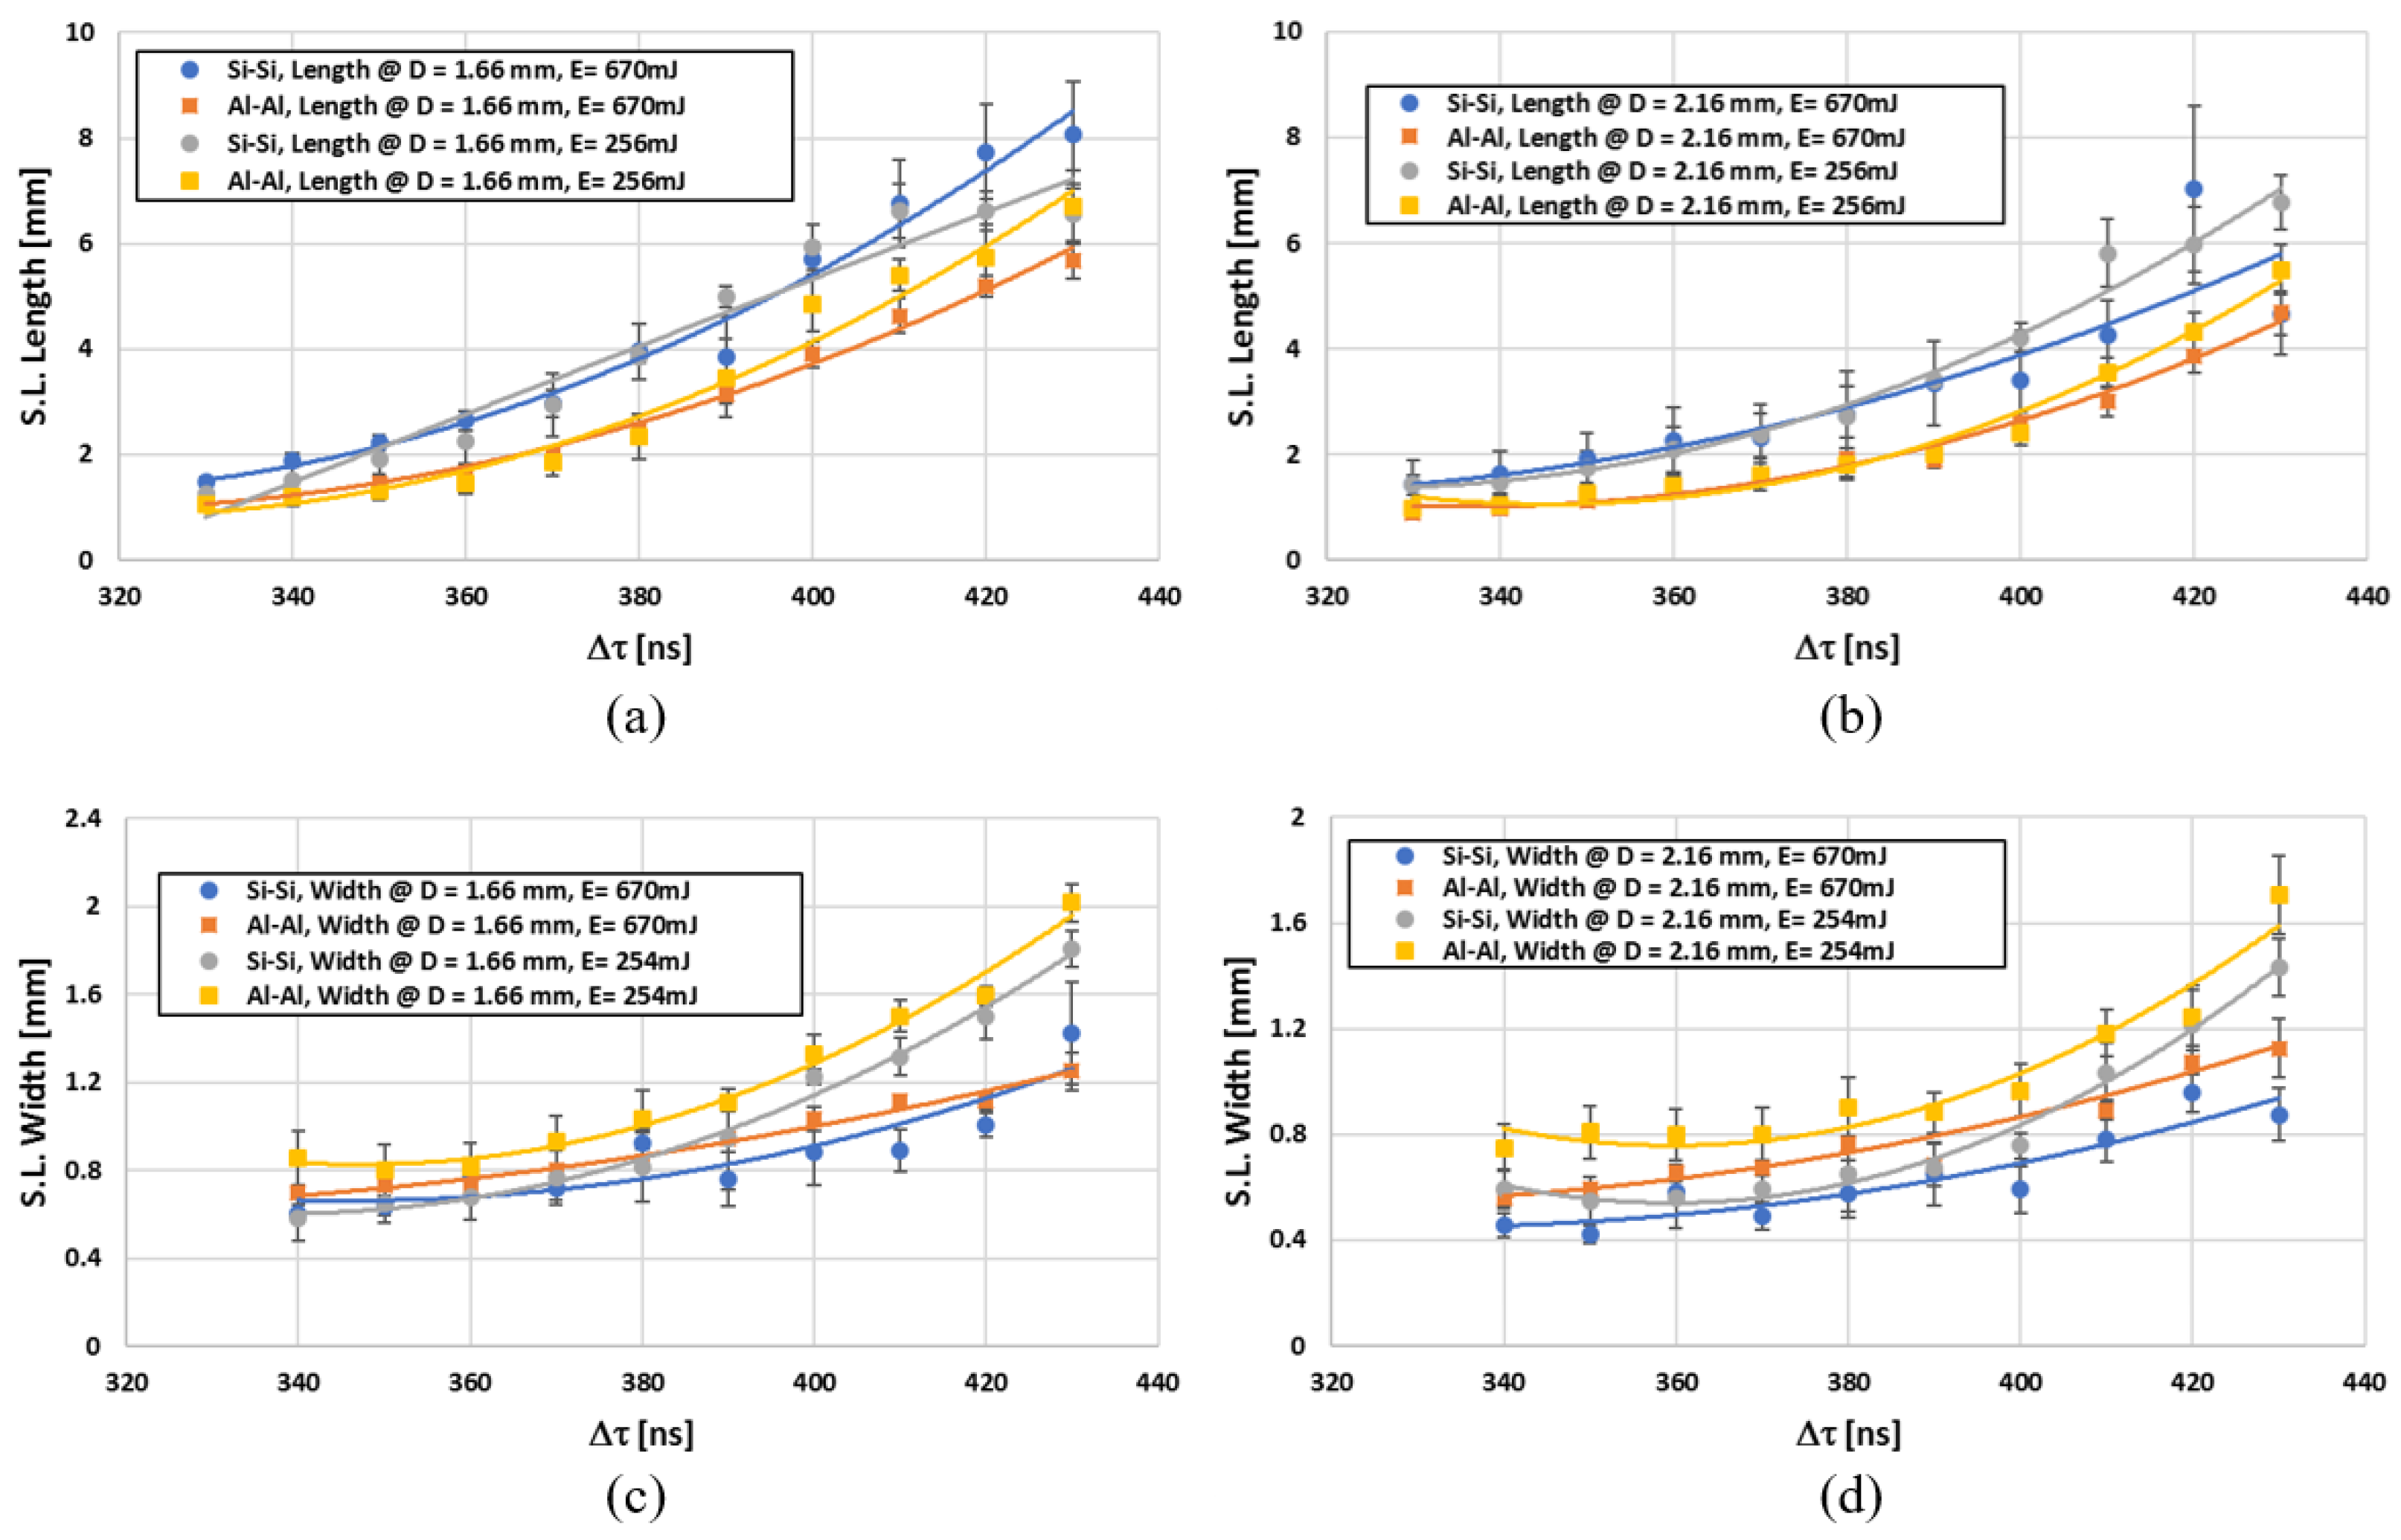
The results for the aluminum and silicon targets are compared directly. Figure 16a,b show that the Si stagnation layer extends far beyond the Al stagnation layer.
However, the stagnation layer width is similar in both cases and is largely insensitive to the laser energy, as shown in Figure 16c,d. With this in mind, in the same figure, the width of the interaction zone for both materials (i.e., Al-Al and Si-Si) will be larger if the laser energy reduces from 670 mJ to 254 mJ for both cases at a seed separation of 1.66 mm and 2.16 mm, respectively.
The differences between the Al and Si plasmas may be due to their mass differences; however, the differences between the spectra may also contribute in a very significant way to the observed differences between the data sets.

4. Conclusions

The paper presents results from temporally, spatially, and semi-spectrally resolved fast imaging, which reveals some detailed information on the distribution of atoms and ions inside the stagnation layer.
Additionally, the work presents a comparative analysis of the dynamics and properties of colliding plasma plumes and the resulting induced interaction zone created by the laser ablation of aluminum and silicon targets. The mass of the ablated species has a considerable effect on the properties of the interaction zone in terms of their initiation time, expansion features, geometry, size, and strength of stagnation, as revealed by time-resolved two-dimensional images.
In general, the creation of the interaction area begins earlier for the targets with lower atomic masses than for the targets with higher atomic masses. It has been discovered that the interaction zone of aluminum (as a metal) is brighter, restricted, and highly directed when compared to silicon (as a semiconductor material). It is worth noting that atomic kinetics may play a non-trivial role in these experiments, especially if the plasma expands and cools, which means that the distributions of level and ion populations will change. This could undeniably affect the radiation signatures, and this effect may need to be taken into consideration for future studies. We hope that the presented research will assist in better understanding the characteristics of colliding plasmas with various parameters.

Author Contributions

Conceptualization; H.M.A.-J. and T.M.; methodology, formal analysis, and investigation; H.M.A.-J. All authors have read and agreed to the published version of the manuscript.

Funding

The project was completed under the Erasmus Mundus “EXTATIC” program and the Framework Partnership Agreement, no. 2012–0033, for financial support over the course of this project.

Acknowledgments

This work is associated with the Framework Partnership Agreement FPA-2012-0033 of the EXTATIC project for the EU FP7 Erasmus Mundus Joint Doctorate Program. The authors acknowledge the members of the EXTATIC academic committee for their continuous support.

Conflicts of Interest

The authors declare no conflict of interest.

References

  1. Rambo, P.W.; Denavit, J. Interpenetration and ion separation in colliding plasmas. Phys. Plasmas 1994, 1, 4050–4060. [Google Scholar] [CrossRef]
  2. Camps, E.; Escobar-Alarcón, L.; Haro-Poniatowski, E.; Fernández-Guasti, M. Spectroscopic studies of two perpendicularly interacting carbon plasmas generated by laser ablation. Appl. Surf. Sci. 2002, 197, 239–245. [Google Scholar] [CrossRef]
  3. Zepf, M.; Clark, E.L.; Krushelnick, K.; Beg, F.N.; Escoda, C.; Dangor, A.E.; Santala, M.I.K.; Tatarakis, M.; Watts, I.F.; Norreys, P.A.; et al. Fast particle generation and energy transport in laser-solid interactions. Phys. Plasmas 2001, 8, 2323–2330. [Google Scholar] [CrossRef]
  4. Katayama, K.; Kinoshita, T.; Okada, R.; Fukuoka, H.; Yoshida, T.; Yaga, M.; Aoki-Matsumoto, T.; Umezu, I. Mixing of laser-induced plumes colliding in a background gas. Appl. Phys. A 2022, 128, 1007. [Google Scholar] [CrossRef]
  5. Hough, P.; McLoughlin, C.; Harilal, S.S.; Mosnier, J.P.; Costello, J.T. Emission characteristics and dynamics of the stagnation layer in colliding laser produced plasmas. J. Appl. Phys. 2010, 107, 024904. [Google Scholar] [CrossRef] [Green Version]
  6. Shilpa, S.; Gopinath, P. Dynamics of angularly colliding laser-produced plasmas in air and argon ambient. Vacuum 2023, 208. [Google Scholar] [CrossRef]
  7. Lee, H.; Kim, N.-K.; Lee, M.-G.; Kwon, J.-W.; Son, S.H.; Bae, N.; Park, T.; Park, S.; Kim, G.-H. Investigation of ion collision effect on electrostatic sheath formation in weakly ionized and weakly collisional plasma. Plasma Sources Sci. Technol. 2022, 31, 084006. [Google Scholar] [CrossRef]
  8. Kabacinski, A.; Tissandier, F.; Gautier, J.; Goddet, J.-P.; Andriyash, I.; Zeitoun, P.; Sebban, S.; Oliva, E.; Kozlová, M. Femtosecond soft x-ray lasing in dense collisionaly-pumped plasma. Phys. Rev. Res. 2022, 4, L032009. [Google Scholar] [CrossRef]
  9. Wang, Y.; Chen, A.; Zhang, D.; Wang, Q.; Li, S.; Jiang, Y.; Jin, M. Enhanced optical emission in laser-induced breakdown spectroscopy by combining femtosecond and nanosecond laser pulses. Phys. Plasmas 2020, 27, 023507. [Google Scholar] [CrossRef]
  10. Kumar, B.; Singh, R.K.; Sengupta, S.; Kaw, P.K.; Kumar, A. Propagation dynamics of laterally colliding plasma plumes in laser-blow-off of thin film. Phys. Plasmas 2014, 21, 083510. [Google Scholar] [CrossRef]
  11. George, S.; Singh, R.; Nampoori, V.; Kumar, A. Fast imaging of the laser-blow-off plume driven shock wave: Dependence on the mass and density of the ambient gas. Phys. Lett. A 2013, 377, 391–398. [Google Scholar] [CrossRef]
  12. Singh, R.P.; Patel, D.; Thareja, R.K. Investigation of ion dynamics of laser ablated single and colliding carbon plasmas using Faraday cup. Heliyon 2022, 8, e10621. [Google Scholar] [CrossRef] [PubMed]
  13. Al-Juboori, H.M.; McCormack, T. Digital nanosecond imaging architecture and analytical tracking technique of colliding laser-produced plasma. Opt. Quantum Electron. 2022, 54, 321. [Google Scholar] [CrossRef]
  14. Mondal, A.; Kumar, B.; Singh, R.K.; Joshi, H.C.; Kumar, A. Spectroscopic investigation of stagnation region in laterally colliding plasmas: Dependence of ablating target material and plasma plume separation. Phys. Plasmas 2019, 26, 022102. [Google Scholar] [CrossRef]
  15. Kramida, R.Y. NIST Atomic Spectra Database (Version 5.6.1). 2022. Available online: http://physics.nist.gov (accessed on 12 January 2023).
  16. Al-Juboori, H.M.; Malik, N.A.; McCormack, T. Investigations on the effect of target angle on the stagnation layer of colliding laser produced plasmas of aluminum and silicon. Phys. Plasmas 2021, 28, 123515. [Google Scholar] [CrossRef]
  17. Sizyuk, T.; Oliver, J.; Diwakar, P.K. Mechanisms of carbon dimer formation in colliding laser-produced carbon plasmas. J. Appl. Phys. 2017, 122, 023303. [Google Scholar] [CrossRef] [Green Version]
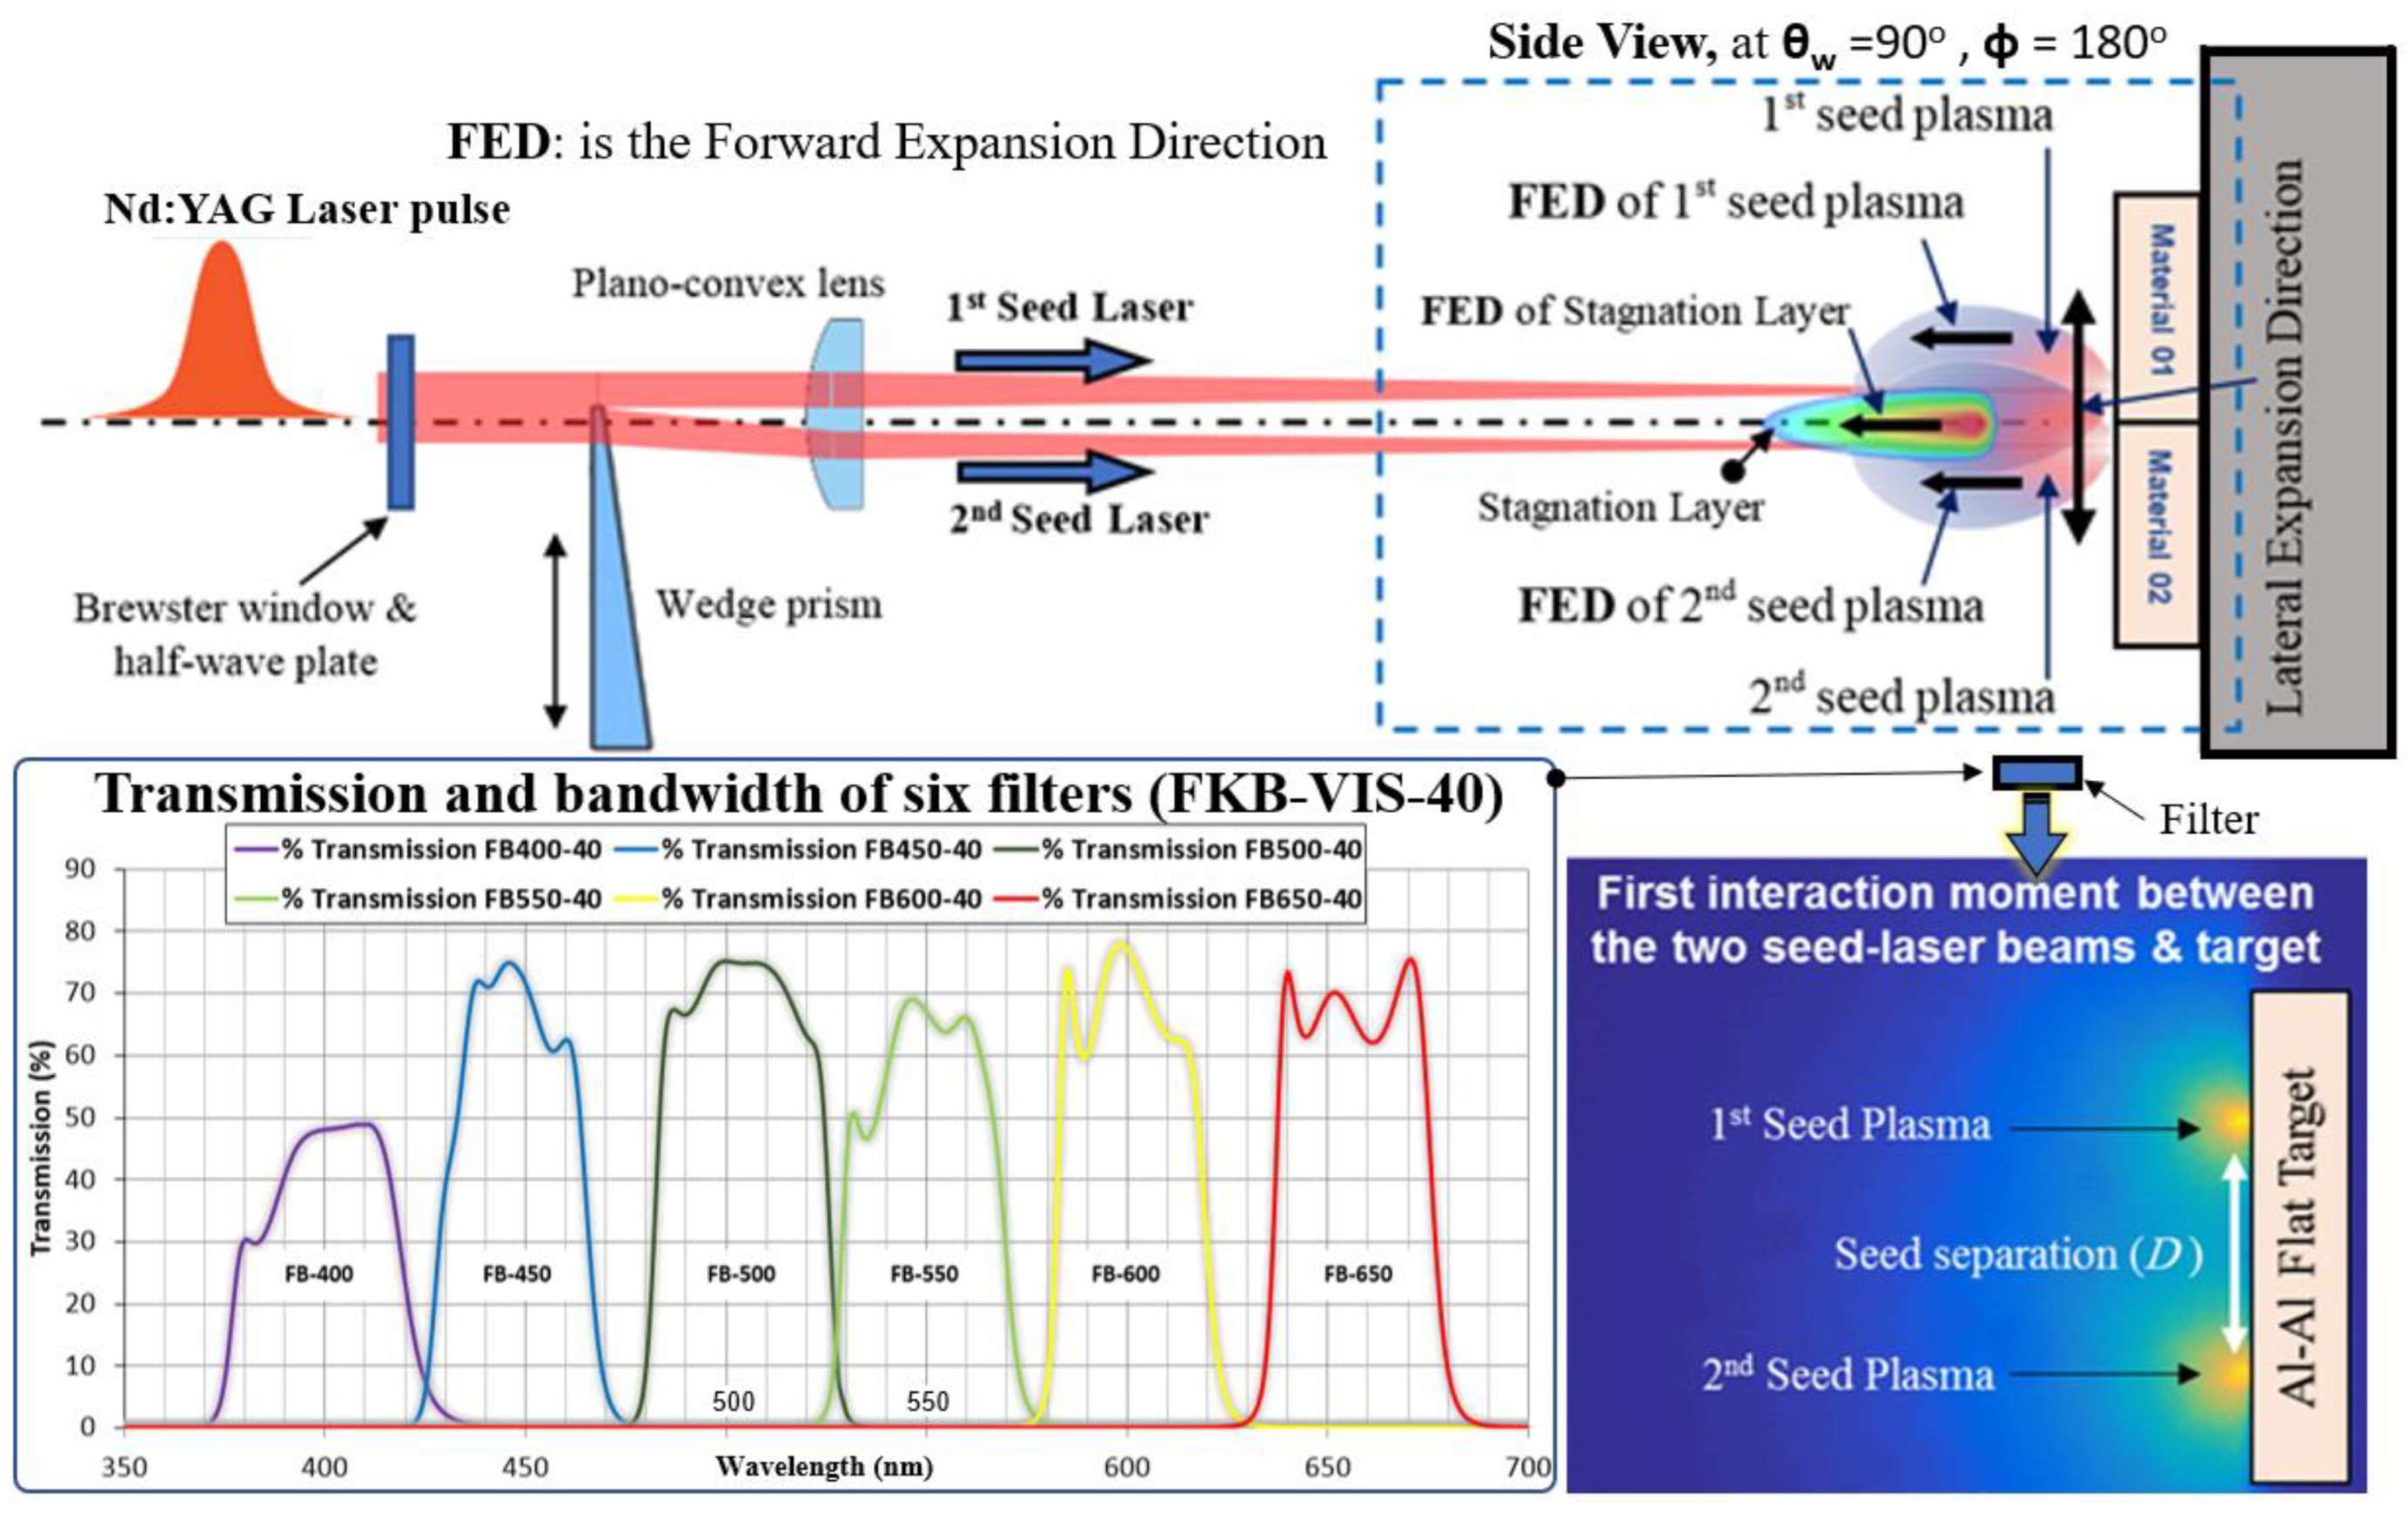
Figure 1. The interaction principle of colliding laser-produced aluminum plasmas captured at a time delay (Δτ) of 275 ns and the related expansion direction.
Plasma 06 00015 g001
Figure 2. Time-sequenced optical images of Al-Al flat target emission (450 ± 8 nm bandpass filter) from colliding laser plasmas.
Plasma 06 00015 g002
Figure 3. Percentage of the total visible intensity of neutral atoms and multi-charged ions at the Al-Al and Si-Si flat targets from Δτ = 330 ns to 430 ns at (a) D = 1.66 mm and (b) D = 2.16 mm.
Plasma 06 00015 g003
Figure 4. A sequence of aluminum laser-produced colliding plasma plume images of six different filter bandwidths at a beam separation of 1.66 mm in a vacuum and a laser energy (EL) = 610 mJ.
Plasma 06 00015 g004
Figure 5. A sequence of laser-produced colliding plasma plume images of solid Al and Si targets at three different laser energies and a beam separation (D) of 1.66 mm in a vacuum using a 450 nm filter.
Plasma 06 00015 g005
Figure 6. A sequence of laser-produced colliding plasma plume images of solid Al and Si targets at three different laser energies and D = 2.16 mm in a vacuum using a 450 nm filter.
Plasma 06 00015 g006
Figure 7. Motion of the peak intensity in the aluminum interaction zone at EL = 670 mJ using a focusing lens with a focal length equal to 100 mm with (a) the 450 nm filter and (b) the 400 nm filter.
Plasma 06 00015 g007
Figure 8. Temporal evolution of the intensity distribution profile in the stagnation layer using two different bandpass filters at D = 2.16 mm. (a) a 450 nm filter, and (b) a 400 nm filter.
Plasma 06 00015 g008
Figure 9. Aluminum stagnation layer growth in the forward expansion direction via temporal evolution at EL = 670 mJ based on (a) length and (b) width, where the continuous lines represent the polynomial fit.
Plasma 06 00015 g009
Figure 10. Ratio of the AD for the ion groups at 450 nm to the AD for the ion groups at 400 nm of the aluminum interaction region in a vacuum, where the dashed lines represent the polynomial fit.
Plasma 06 00015 g010
Figure 11. A sequence of silicon laser-produced colliding plasma plume images of six different filter bandwidths at a beam separation of 1.66 mm in a vacuum and at a laser energy (EL) of 610 mJ.
Plasma 06 00015 g011
Figure 12. The temporal variation of the peak intensity profile in the Si interaction zone at EL =610 mJ with (a) the 450 nm filter and (b) the 400 nm filter.
Plasma 06 00015 g012
Figure 13. The average intensity versus the time delay (Δτ) for the ions emitted from Si I–IV with fitting curves, where the continuous lines represent the polynomial fit.
Plasma 06 00015 g013
Figure 14. Motion of the peak intensity in the silicon interaction zone at EL = 670 mJ.
Plasma 06 00015 g014
Figure 15. Si stagnation layer growth in the forward expansion direction via temporal evolution based on (a) length and (b) width, where the continuous lines represent the polynomial fit.
Plasma 06 00015 g015
Figure 16. Expansion features of the stagnation layer based on two different material targets for EL = 670 mJ and EL = 254 mJ. (a) Length at D =1.66 mm; (b) length at D = 2.16 mm; (c) width at D =1.66 mm; (d) width at D = 2.16 mm. The continuous lines represent the polynomial fit.
Plasma 06 00015 g016
Table 1. Identified aluminum emission lines [15].
Atomic Speciesλo [nm]FilterTransition Levels
Al I393.20400 nm3s24d – 3s3p(3po)3d – 2D5/22Do5/2
Al I394.403s23p – 3s24s – 2P1/22S1/2
Al I396.153s23p – 3s24s – 2P3/22S1/2
Al III415.022p64d – 2p65f – 2D3/22Fo5/2
Al II466.30450 nm3p2 – 3s24p – 1D21P1
Al III447.992p64f – 2p65g – 2F7/22G9/2
Al III451.252p64p – 2p64d – 2P1/22D3/2
Al III452.892p64p – 2p64d – 2P3/22D3/2
Table 2. Detected silicon emission lines [15].
Atomic Speciesλo [nm]FilterTransition Levels
Si III380.654400 nm3s4p – 3s4d – 3P23D3
Si II385.3363s3p2 – 3s24p – 2D3/22P3/2
Si I390.5523s2 3p2 – 3s23p4s – 1S0 1P1
Si III392.4473s4f – 3s5g – 1F31G4
Si IV408.8852p64s – 2p64p – 2D1/22P3/2
Si IV411.6102p64s – 2p64p – 2S1/22P1/2
Si II412.8073s23d – 3s24f – 2D3/22F5/2
Si II413.0893s23d2 – 3s24f22D5/22F7/2
Si IV432.818450 nm2p65p – 2p66s – 2P3/22S1/2
Si II455.2623s4s – 3s4p – 3S13P2
Si III456.7823s4s – 3s4p – 3S13P1
Si II462.1723s24d – 3s27f – 2D5/22F7/2
Disclaimer/Publisher’s Note: The statements, opinions and data contained in all publications are solely those of the individual author(s) and contributor(s) and not of MDPI and/or the editor(s). MDPI and/or the editor(s) disclaim responsibility for any injury to people or property resulting from any ideas, methods, instructions or products referred to in the content.