Article

Erbium Orthoniobate-Tantalates: Structural, Luminescent and Mechanical Properties of ErNbxTa1−xO4 Ceramics and Bactericidal Properties of ErNbO4 Powder

1
Tananaev Institute of Chemistry—Subdivision of the Federal Research Centre «Kola Science Centre of the Russian Academy of Sciences», 184209 Apatity, Russia
2
Institute of North Industrial Ecology Problems—Subdivision of the Federal Research Center «Kola Science Center of the Russian Academy of Sciences», 184209 Apatity, Russia
3
Saint Petersburg State Institute of Technology, Moskovsky Prospect, Building 24-26/49 Litera A, 190013 Saint Petersburg, Russia
*
Author to whom correspondence should be addressed.
Ceramics 2025, 8(4), 130; https://doi.org/10.3390/ceramics8040130
Submission received: 16 September 2025 / Revised: 13 October 2025 / Accepted: 20 October 2025 / Published: 22 October 2025
(This article belongs to the Topic High Performance Ceramic Functional Materials)

Abstract

Fine powders of erbium niobate-tantalates ErNbxTa1−xO4 (x = 0; 0.1; 0.3; 0.5; 0.7; 0.9; 1) have been synthesized by the liquid-phase method in this study. Ceramic samples have been prepared using conventional sintering from these powders. Rietveld refinement of XRD patterns of polycrystals determined the phase composition and clarified the parameters of the phase structure of ErNbxTa1−xO4 solid solutions depending on the Nb/Ta ratio. The morphological features of the microstructure of erbium niobate-tantalate ceramics have been studied. Their mechanical properties, strength characteristics (Young’s modulus, microhardness) and critical stress intensity factor of the first kind KIC have been estimated. The photoluminescent properties of ceramic solid solutions of erbium niobate-tantalates depending on the composition have been studied. Dark and photoinduced toxicity of finely dispersed ErNbO4 powders have been studied in relation to Gram-positive, Gram-negative and spore-forming microorganisms. The best indicators of antibacterial activity of ErNbO4 have been demonstrated in relation to Gram-positive cells of Micrococcus sp. The discovered properties open up the possibility of not only traditional use as functional materials, but also the use of these materials for disinfection of surfaces, water and biological tissues.

1. Introduction

The role of compounds and functional materials containing rare earth elements (REEs) in the development of modern technologies is constantly and inevitably increasing. The range of applications for such materials is expanding significantly. A huge amount of fundamental research is devoted to the design and characterization of luminescent materials that exhibit new photophysical effects [1,2,3]. The reason for this popularity is their role in modern technologies (display screens, optical communication amplifiers, LED lamps and solid-state lasers); the need for the materials is constantly growing.
Solid-state luminescent materials based on lanthanide niobate-tantalates REE(NbxTa1−x)O4 have the combined advantages of typical lanthanide photoluminescence (PL) and photophysical stability. Lanthanide PL is known for two types of regimes: the conversion of exciting radiation is increased in one case, and it is decreased in the other case. Up-conversion luminescence (UCL) refers to a nonlinear optical process [3,4,5]. What is characteristic of this process? Two or more near-infrared (IR) photons are sequentially absorbed into several real intermediate energy states, and luminescence is emitted at a wavelength shorter than the wavelength of the absorbed radiation.
Trivalent REE niobate-tantalates, such as Er and Yb, have attracted much attention because these PL materials can convert near-IR excitation into visible emission, that is, they are up-conversion phosphors [4,5,6]. UCL arises from 4f-4f orbital electronic transitions with accompanying wave functions. They are localized within a single lanthanide ion. These internal 4f electronic transitions of lanthanide ions are largely electric-dipole transitions. They are prohibited by the selection rules. However, the rules are relaxed due to the local mixing of f states with higher electronic configurations. The local mixing itself is caused by the splitting of the crystal field levels [7,8,9]. Variation in the Nb/Ta ratio in REE(NbxTa1−x)O4 increases energy transfer from the emission centers of the crystal host based on the TaO43− and NbO43− groups to the emission centers of REE cations.
Up-conversion phosphors are widely used in optical devices such as temperature sensors, IR quantum counters, and compact solid-state lasers [10]. However, converting near-IR to visible radiation eliminates background fluorescence and light scattering from biological materials. And this makes, in particular, micro-nano-grained up-conversion phosphors ideal for use in bioimaging with undeniable advantages, for example, the absence of autofluorescence of biological tissues and a large penetration depth [11]. However, the use of ABO4-type compounds in medical practice requires preliminary biotesting and testing for toxicity, including in relation to various microorganisms [12].
It should also be noted that the phenomenon of resistance of pathogens to therapeutic drugs is the main reason for the negative effect on human health. This phenomenon is the basis for a sharp decrease in the effectiveness of etiotropic therapy for infectious diseases. The increasing resistance of microorganisms, on the one hand, to traditional antimicrobial drugs, and on the other hand, to traditional methods of chemical inactivation of bacteria makes the development of new effective methods for combating bacterial contamination and infections extremely relevant [13].
Finely dispersed powdered phosphors based on the compound ErNbO4 emit over a wide range of the visible spectrum (~530–670 nm). They are almost insoluble in water in the temperature range −40–+100 °C, and are resistant to alkalis, acids and other aggressive environments. This markedly distinguishes them from organic and organometallic compounds. These properties also make it possible to use them in such conditions and situations where the chemical and temperature stability is important.
This significantly distinguishes them from organic and organometallic compounds used, for example, for antimicrobial photodynamic inactivation. And this expands the scope of its applications, for example, to the purification of industrial and agricultural wastewater, where the chemical and temperature stability of the bactericidal material is important [14,15,16,17,18,19,20,21].
Therefore, the urgent tasks for today are the following: first, the search for promising luminescent phosphors with UCL; secondly, the development of synthesis technology resulting in finely dispersed powders.
Such powders can be used in biology and medicine, including for antimicrobial photodynamic inactivation or bacteriotoxic light therapy (BLT) [14,15]. In addition, their use creates ceramic materials with increased hardness and strength, qualities necessary to produce a variety of sensors and counters, including those operating under conditions of increased mechanical loads.
The goal of this study is the synthesis of fine powders of erbium niobate-tantalates ErNbxTa1−xO4 (x = 0; 0.1; 0.3; 0.5; 0.7; 0.9; 1); the preparation of ceramic samples and the study of their structural, mechanical and luminescent (up-conversion) characteristics; and also the study of the biological properties of ErNbO4 powders, such as dark and photoinduced toxicity.

2. Methods

The synthesis of erbium niobate-tantalate powders ErNbxTa1−xO4 (x = 0; 0.1; 0.3; 0.5; 0.7; 0.9; 1) was carried out using the liquid-phase method. The synthesis required high-purity fluoride Nb- and Ta-containing solutions or mixtures thereof. Their volumes provided the specified composition of niobate-tantalates. Solutions were prepared as follows: oxides Nb2O5 (99.9) and Ta2O5 (99.9) were dissolved in HF (99.9, Komponent-reaktiv Ltd., Moscow, Russia). Niobium, tantalum hydroxides or mixtures thereof were precipitated with 25% NH4OH (99.9 (not more than 10−5 of 23 impurities), Sigma Tek, Khimki, Russia) from the initial solutions. Then, the sediment was washed three times using repulpation with deionized water to remove F ions at a ratio of solid (S) and liquid (L) phases S:VL =1:3, and dried at 100 °C. Then, a solution of Er(NO3)3 with a given concentration of Er at a ratio of S:VL =1:2 was added to the precipitate. Erbium nitrate solutions were prepared as follows: Er2O3 (oxide 99.9% LLC HimKraft, Moscow, Russia) was dissolved in HNO3 (99.9, Vekton Ltd., Saint Petersburg, Russia). A 25% solution of NH4OH (99, Sigma Tech, Khimki, Russia) at pH ~8–9 was introduced into the pulp formed during stirring. The precipitate was filtered and washed three times with deionized water at S:VL = 1:4 to remove ammonium ions, and then it was dried. The temperature was ~140 °C. Then, the sediment was calcined in a resistance furnace at 700 °C for 4 h. Then, the sediment was ground in a chalcedony ball mill (grinder) MLW KM1 (MLW, Leipzig, Germany). Then, the powders were calcined for 5 h at 1200 °C. The gravimetric method determined the content of niobium and tantalum in fluoride Nb- and Ta-containing solutions. The potentiometric method determined the content of fluoride ions in fluoride Nb- and Ta-containing solutions. An EV-74 ion meter with an F-selective electrode EVL-1M3 (Zavod izmeritel’nych priborov, Belarus, Gomel’) was used as a research tool. Fluorine in the synthesized powders was analyzed by pyrohydrolysis. Erbium in filtrates and washing solutions was determined by inductively coupled plasma mass spectrometry (ICP-MS) ELAN 9000 DRC-e (PerkinElmer, Hopkinton, MA, USA). The elemental composition of the powders was evaluated by X-ray fluorescence spectrometry using a Spectroscan MAKC-GV (Spectron, Saint Petersburg, Russia).
The specific surface area of the powders was determined by the low-temperature nitrogen adsorption method (BET; FlowSorb II 2300; TriStar 3020 V1. 03, both from Micromeritics, Norcross, GA, USA). The average particle size of the powders dav was determined from these data by the formula dav = 6/Ssp·ρ, where Ssp is the specific surface area, m2/g; ρ is the density, g/cm3.
X-ray phase analysis of the synthesized ErNbxTa1−xO4 samples was performed on a Rigaku XtaLAB Synergy-S X-ray diffractometer (Rigaku, Tokyo, Japan) with a new generation PhotonJet-S multifocal source and an HPC detector (Rigaku, Tokyo, Japan). A Rietveld refinement was applied including Full Pattern Decomposition (FPD). The cell parameters of the ceramic solid solutions ErNbxTa1−xO4 (x = 0; 0.1; 0.3; 0.5; 0.7; 0.9; 1) were refined by the WPPF (Whole Powder Pattern Fitting).
From powders obtained using conventional sintering (CS), ceramic samples were prepared in the form of tablets with a diameter of 10 mm and a height of 2–3 mm. Polyvinyl alcohol was the binder. The tablets were pressed at a load of ~3.8 kg/cm2. The tablets were sintered in a KEP 14/1400P electric furnace (MZVE LLC, Tryokhgorny, Russia). The temperature was 1400 °C, and the process lasted 3 h.
The multifunctional X-ray diffractometer Rigaku (RIGAKU, Japan, Tokyo) clarified the phase composition and structures of ceramic samples. The device is equipped with SmartLab Studio II software. The speed of the counter was 2 deg·min−1 (CuKα radiation, scanning range 6–90°). The ICDD (International Diffraction Data Center) databases (PDF 4, relies 2022) were used to identify the phases. The WPPF helped clarify the structural characteristics of the phases. Atomic coordinates and crystallographic lattice characteristics were entered from cif files ICDD. The R-factor criteria were the values of the profile agreement factors Rp and Rwp, calculated using standard formulas.
A ZEISS EVO 25 UltimMax 170 scanning electron microscope SEM (Carl Zeiss QEC GmbH, Oberkochen, Germany) examined morphology and sizes of powders, as well as the microstructure of ceramic samples. Then, based on the SEM scans and the technical capabilities of the ScanMaster program (National research nuclear university (MEPHI), Moscow Engineering Physics Institute, Russia), we analyzed the obtained data. ScanMaster was created to mathematically process such images and measure them. The program is able to select objects in an image and perform morphological operations on them. It can calculate object characteristics based on selected criteria, perform statistical processing of a set of selected objects based on selected criteria and generate diagrams and correlations. The mechanical properties of ceramic samples (microhardness and Young’s modulus) were studied by the contact method using a NanoSkan probe microscope-nanohardness tester (FSBI TISNCM, Troitsk, Russia). The methods were used from works [22,23,24,25]. The microhardness of ceramics was determined by comparative sclerometry [23], and Young’s modulus was determined from approach curves [22]. The crack resistance, which is the stress intensity factor for mode I, KIC, was determined according to the model of Anstis et al. [24,25]. The load was 15 mN during the test. To reduce the standard error of the data, the obtained values of microhardness and crack resistance were averaged over ten measurements in 10 arbitrary areas measuring 60 × 60 μm for each sample.
PL spectra of the studied ceramics were obtained with an AvaSpec-3648 spectrofluorimeter (manufactured by Avantes, Apeldoorn, The Netherlands) when excited at a wavelength of 980 nm by a single-mode laser module KLM-H980 (PTI “Optronik”, St. Petersburg, Russia) in the IR range with a continuous radiation power of 120/200 mW. The operating wavelength range of the spectrofluorimeter AvaSpec-3648 (Avantes BV, Apeldoorn, The Netherlands) is 330–980 nm with a resolution of 0.025 nm. The measurement step was 0.17 nm.
A total of three bacterial strains were used to determine the photoinduced and dark toxicity of ErNbO4 powders. These are Gram-positive—Micrococcus sp. and Gram-negative—Escherichia coli strains. Another object was the spore-forming bacterium Bacillus subtilis. The studied strains were subcultured onto freshly prepared agar nutrient medium for research purposes; they were incubated in a thermostat at 27 °C for three days. To prepare a bacterial suspension, cultures were treated with sterile saline. The initial number of bacterial suspension was more than ~104 cells/mL. Photoinduced toxicity of ErNbO4 powders was evaluated by the degree of inhibition of cell growth of three bacterial cultures under study in natural light. A sample of the material (2 or 5 mg/mL) was placed in a glass test tube containing 19 mL of saline solution, then 1 mL of bacterial suspension was added. A 2 mg sample was used for Gram-positive and Gram-negative bacteria, namely Micrococcus sp. and Escherichia coli, respectively; and a 5 mg sample was used for spore-forming bacteria Bacillus subtilis as they are more resistant to bactericidal substances. The test tube was tightly closed with a rubber sterile stopper and mounted on an orbital shaker LOIP LS-110 (LAB-PU-01) (JSC LOIP, Saint-Petersburg, Russia). The rotation speed was 200 rpm. The test tube was kept in natural light for 24 h. The tubes were exposed to light during natural daylight hours. Sowing was carried out after 4 and 24 h.
The source of natural light was sunlight. A lux meter (TKA-PKM, 06) and a UV Radiometer (TU 4215-003-16796024-16) monitored the illumination level during the experiments. Luxmeter TKA-PKM (06) was produced by the Research and Production Enterprise “TKA”, St. Petersburg, Russia. The illumination level of the samples in various spectral ranges is presented in Table 1.
Experiments in the dark were carried out to compare the results. They involved Gram-positive bacteria Micrococcus sp. Control experiments were carried out with the same lighting, but there were no luminescent phosphors in them. It has been found that the number of bacteria in the suspension does not significantly decrease over 4 and 24 h in natural light when there are no luminescent phosphors.

3. Results and Discussion

3.1. Dimensional Characteristics and Morphology of Powders

ICP-MS data indicate that, taking into account the volumes of solutions, the loss of erbium in filtrates and washing solutions is significantly less than 0.1 mg when synthesizing 30 g of powder for most of the studied samples. This means that gadolinium and europium are almost completely transferred from Er(NO3)3 solutions into the hydroxide precipitate. The data in Table 2 show that the concentrations of Er, Nb and Ta are close to the calculated values within the permissible error of the analysis method used (1%).
It has been found that the fluorine concentration in the powders is below the sensitivity limit of the analytical method used (less than 1 × 10⁻³%).
Table 2 demonstrates that the average particle sizes of the powders in the series of studied compositions are quite similar. Therefore, we present a typical shape of the powders using a sample with the largest particle size ErNbO4 and with the smallest particle size ErNb0.1Ta0.9O4 as an example (Figure 1).
Figure 1 shows that the powders consist of nearly spherical particles of similar morphology. The particle size of the ErNbO4 powders ranges from 0.1 to 1.25 μm, as seen in Figure 1a. The average size of the ErNb0.1Ta0.9O4 powders is ~0.1 to 0.7 μm, as seen in Figure 1b. It should be noted that the powder particles tend to stick together and form larger agglomerates.

3.2. Structure of Ceramic Solid Solutions

Figure 2 shows XRD patterns of ErNbxTa1−xO4 samples (x = 0; 0.1; 0.3; 0.5; 0.7; 0.9; 1).
Since the ionic radii of niobium and tantalum atoms in mixed orthoniobates-tantalates in the oxidation state of +5 and six-fold coordination are the same and equal to 0.64 Å [26], in accordance with the Goldschmidt tolerance factor, one can expect the formation of a continuous series of solid solutions REENbxTa1−xO4 at x = 0–1. However, it was established that in the ErNbxTa1−xO4 series, near x = 0.5, a structural transition occurs from the monoclinic symmetry of the C2/c cell to the monoclinic P2/a cell at the stage of FPD. The studied solid solutions ErNbxTa1−xO4 at x = 0.5–1 crystallize in the structure of β-fergusonite with a monoclinic cell of erbium orthoniobate (ICDD, card 04-006-1916, space group (SPGR): C2/c (15) Z = 4), and at x ≤ 0.5 in the form of M-fergusonite erbium orthotantalate (ICDD, card 04-012-5293, SPGR: P2/a (13), Z = 2). The cell parameters of ErNbxTa1−xO4 (x = 0; 0.1; 0.3; 0.5; 0.7; 0.9; 1) refined by the WPPF method are presented in Table 3. It should be noted that in the ErNbxTa1−xO4 sample, at x = 0.5, two phases were identified simultaneously: about 82% monoclinic β-fergusonite with the SPGR C2/c and 18% monoclinic M-fergusonite with P2/a. The concentration region around the point Nb/Ta = 1 in the series of solid solutions ErNbxTa1−xO4 is probably a morphotropic region of coexistence of two phases of fergusonite.
Figure 3 shows the structures of the monoclinic cells P2/a and C2/c and their corresponding coordination polyhedra. The differences lie in the anionic composition.
It is believed that the coordination polyhedron around the Ta atoms for the P2/a cell can be fairly interpreted as a tetrahedron (semi-dodecahedron) (4 + 2), and for the C2/c cell and Nb atoms, it can be fairly interpreted as a distorted octahedron [27]. Moreover, the additional O atoms in the case of C2/c (β-fergusonite) are closer to the atoms of the cation sublattice A5+ than in M-fergusonite with the P2/a cell (Figure 3, Table 4). In the structure of β-fergusonite, the atoms of the crystalline host (tantalum or niobium) are in a strongly distorted octahedral coordination with six Ta(Nb)–O bonds whereas in M-fergusonite the tantalum (niobium) atoms are in a tetrahedral coordination; see Figure 3.
The cell parameters increase with increasing Nb content in the host (see Table 3) due to the increase in distances between A5+ and oxygen ions (Table 4).
This pattern is probably due to the different electronegativity of Ta (1.5 on the Pauling scale) and Nb (1.6 on the Pauling scale) and, as a consequence, the different effective charges on the Ta5+, Nb5+ and O2− ions in compounds with a covalent bond [28]. In the case of TaO6 or NbO6 groups, a small increase in the electronegativity of the cation from Ta5+ to Nb5+ is accompanied by an increase in the ionic radius of O2−. These changes probably lead to an increase in the length of the A5+–O2− bonds.
Deviations in the lattice constants from Vegard’s law are explained, as in work [29], by the formation of inhomogeneities (clusters) enriched with one of the substituted atoms.
In addition, the ErTaO4 sample contains about 6 wt% Er3TaO7 cubic system with Fm-3m (225) (ICDD, card 00-024-0406), and the ErNb0.9Ta0.1O4 ceramic sample contains about 10 wt% cubic Er3NbO7 (ICDD, card 00-024-1080, SPGR: Fm-3m) (Figure 2, Table 3).

3.3. Morphological and Mechanical Characteristics of Ceramic Solid Solutions ErNbxTa1−xO4 (x = 0; 0.1; 0.3; 0.5; 0.7; 0.9; 1)

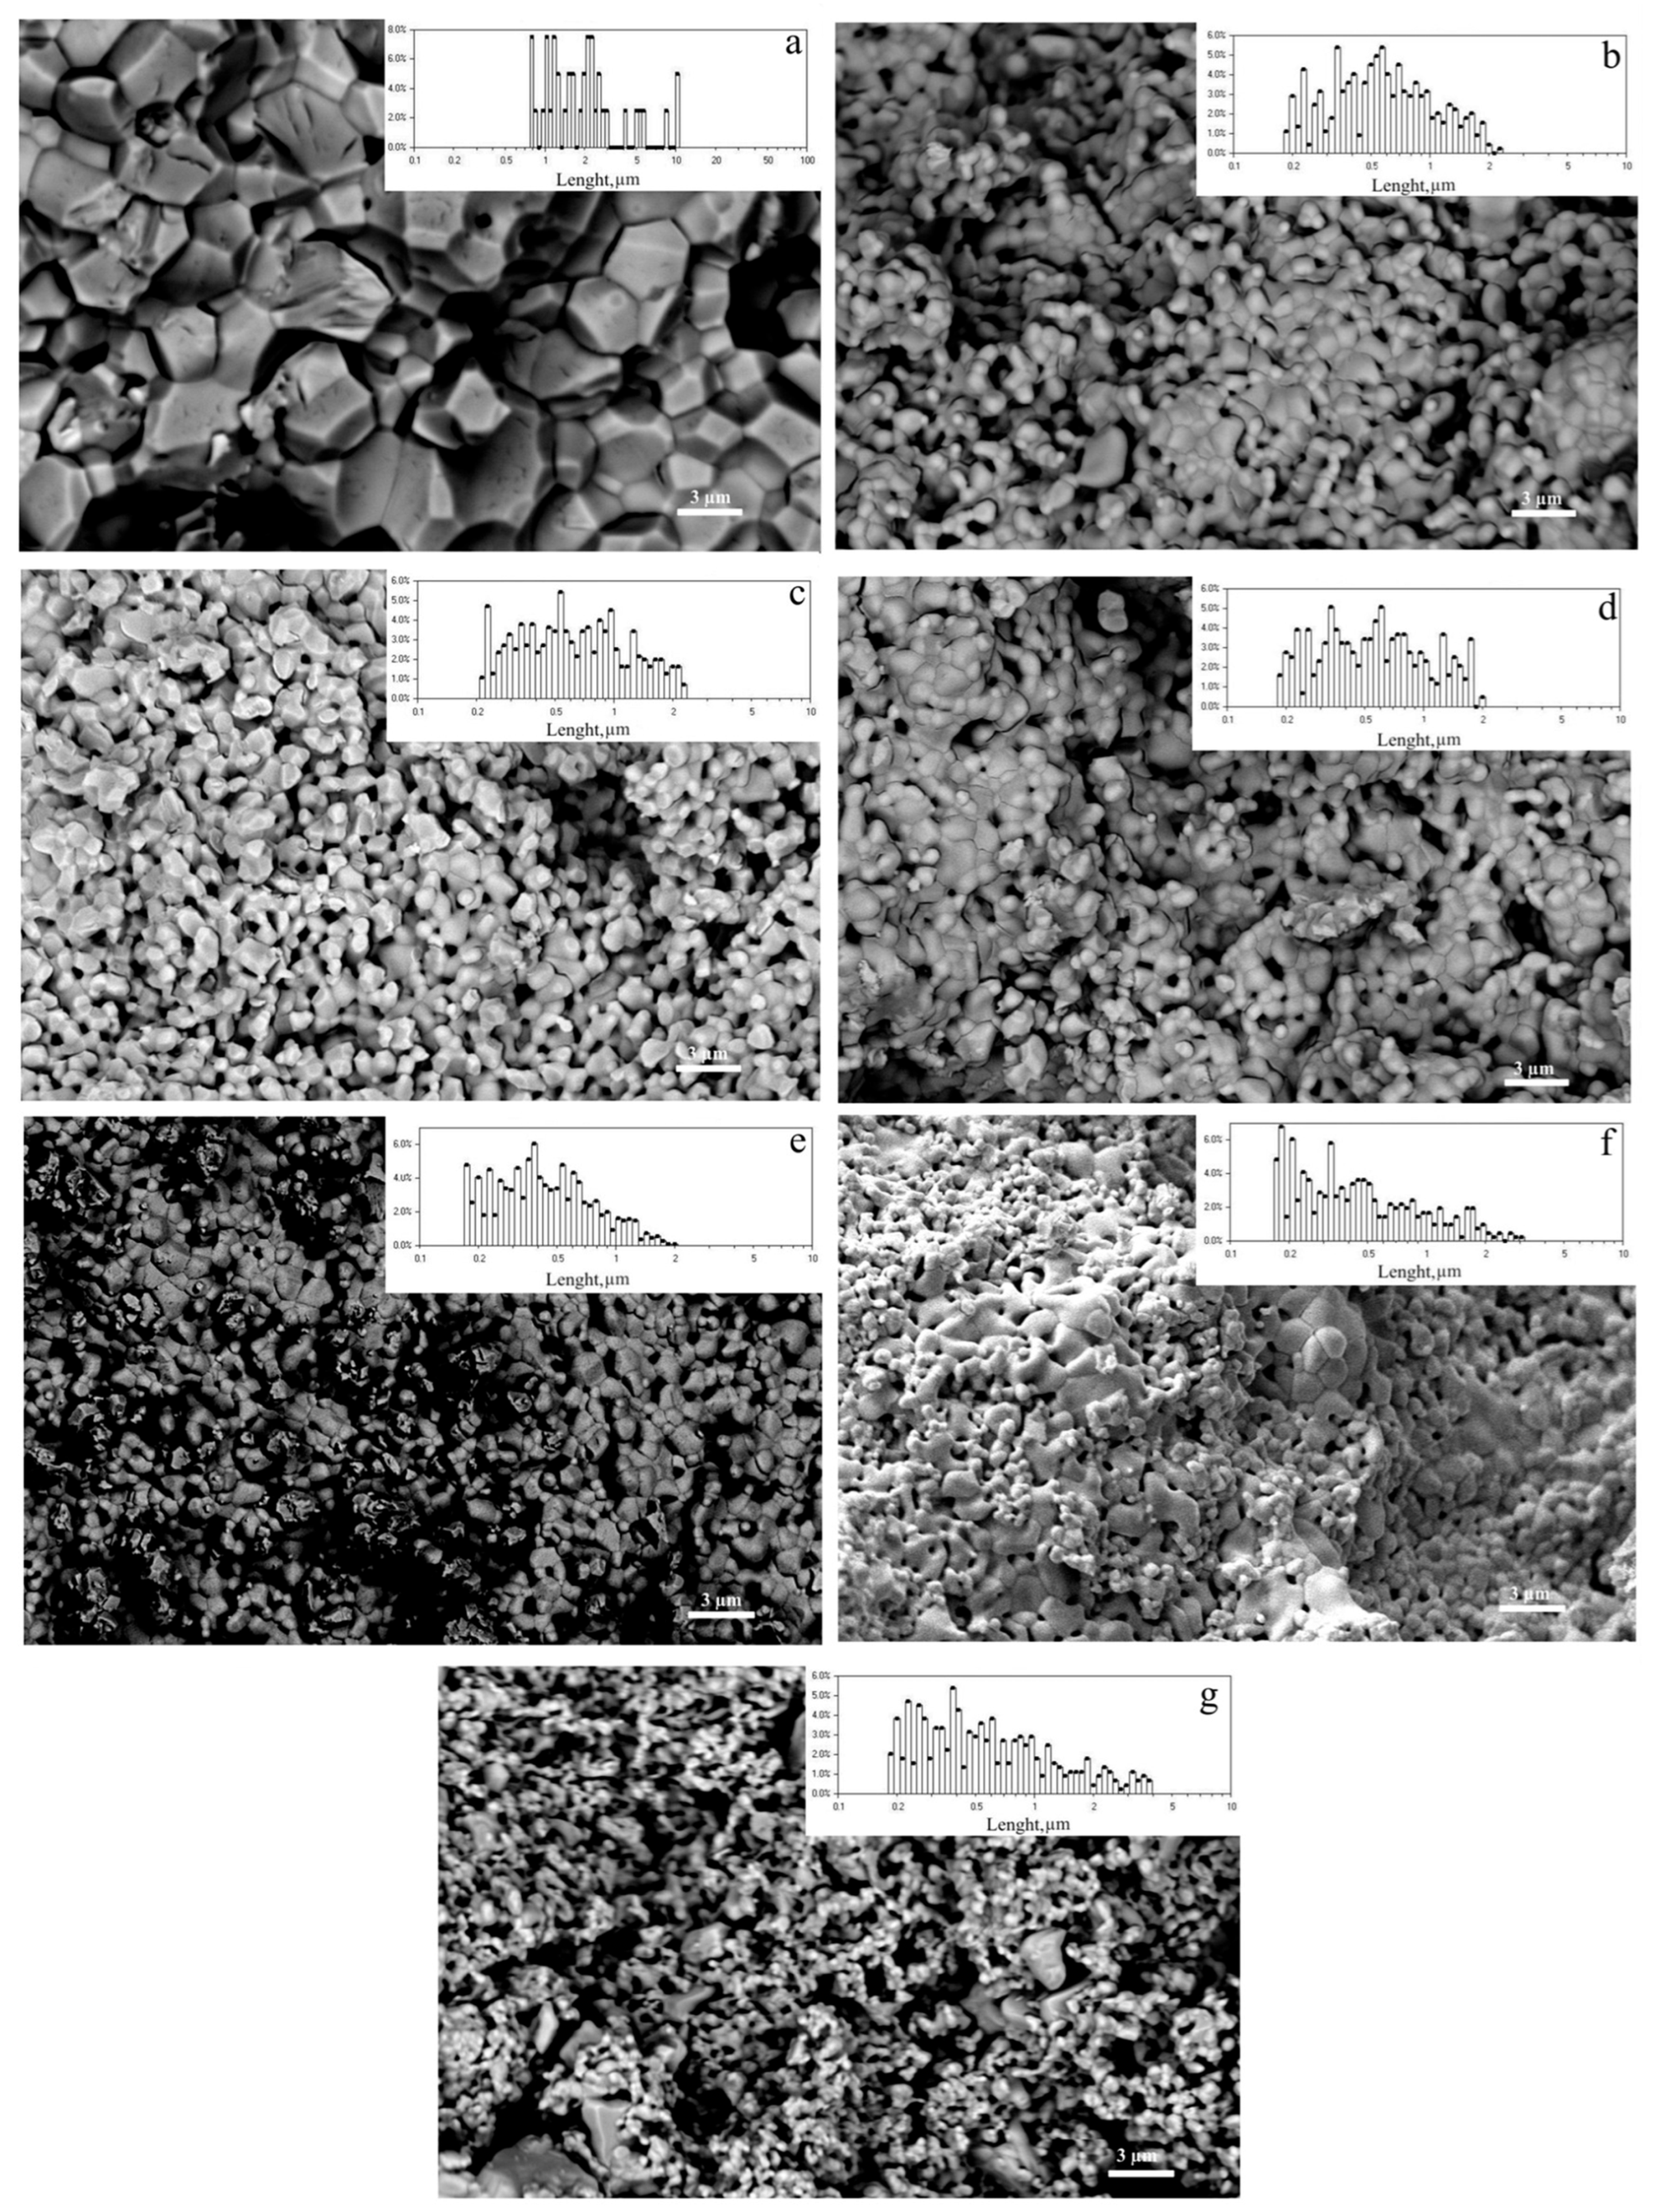
A series of SEM images were performed to characterize the morphologies and estimate the grain sizes of ErNbxTa1−xO4 (x = 0; 0.1; 0.3; 0.5; 0.7; 0.9; 1). The microstructure of ceramic samples and their size composition are shown in Figure 4.
The data in Figure 4 show that ErNbxTa1−xO4 ceramic samples consist of grains of similar morphology with pronounced boundaries. The largest crystallite size is in the ErNbO4 sample, from ~0.7 to ~10 μm, as seen in Figure 4a. It is likely that the large grain size of ErNbO4 ceramics may be due to the sintering temperature of the ceramics. It is close to the melting point.
If Ta in the ErNbxTa1−xO4 composition increases, respectively, and the melting temperature increases, the ceramic grain size decreases. The range of crystallites from ~ 0.2 to ~ 2.6 μm is typical for the ErNb0.9Ta0.1O4 and ErNb0.7Ta0.3O4 samples, as seen in Figure 4b,c. The size of the main fraction of crystallites is from ~0.18 to ~2.2 μm for ErNbxTa1−xO4 ceramics, where x ≤ 0.5, as seen in Figure 4d–g. Ceramic samples ErNb0.9Ta0.1O4 and ErTaO4 containing cubic phases with Fm-3m (225) Er3NbO7 and Er3TaO7, respectively, (Figure 4b,g) are the most heterogeneous and contain individual grains larger than 3.0 µm. In general, ErNbxTa1−xO4 ceramics (x = 0; 0.1; 0.3; 0.5; 0.7; 0.9; 1) prepared by CS from erbium niobate-tantalate powders synthesized by the liquid-phase method have a finer grain size than those obtained by solid-phase synthesis with crystallite sizes about or more than 5.0 µm [30,31,32,33].
The contact method helped to study the mechanical properties of ceramic samples. Table 5 shows the results of measurements and calculations of the mechanical characteristics of ceramic samples.
The data in Table 5 show that the mechanical characteristics of ceramics strongly depend on the phase composition of the samples. The best mechanical characteristics, microhardness (H = 6.11 ± 0.86 GPa), Young’s modulus (E = 297.6 ± 10.8 GPa) and crack resistance (KIC = 1.44 ± 0.2, MPa m0.5) are found in the ErNbO4 ceramic sample and the ErNb0.7Ta0.3O4 single-phase sample, as seen in Figure 2, Table 3. Low mechanical characteristics of the ErNb0.5Ta0.5O4 sample are due to the coexistence of two fergusonite phases. The low mechanical characteristics of the ErNb0.9Ta0.1O4 sample are naturally due to the presence in the sample of about 10 wt% cubic Er3NbO7 phase (ICDD, card 00-024-1080, SPGR: Fm-3m). The key parameters in the difference in the mechanical characteristics of the compared orthoniobate-tantalates are the method of obtaining the materials, the properties and concentration of doping REEs and the ratio of crystalline phases in the sample. Nevertheless, the values of the mechanical characteristics of ErNb1−xTaxO4 ceramic samples synthesized by the liquid-phase method are consistent with the results presented in the literature [30,31,32,33]. The authors of [31,32] show the range of Young’s modulus for REE-niobates (RENbO4) (RE = Y, La, Nd, Sm, Gd, Dy, Yb)—60-170 GPa and hardness up to 11.48 GPa. The values of Young’s modulus ∼120 GPa for YbTaO4 and LuTaO4, ∼270 GPa for ScTaO4 are presented in [33]. Taking into account the differences in measurement methods (nanoindentation and sclerometry), our results of measuring these quantities are in a good agreement with the data in the literature. For example, the Young’s modulus of RENbO4 ceramics decreases linearly as the ionic radius of RE3+ increases [31,32]. The ionic radius of Er3+ is smaller than the ionic radii of Sm3+, Gd3+, Dy3+; therefore, it is natural that the single-phase ceramic sample ErNbO4 has higher mechanical characteristics than orthoniobates Sm3+, Gd3+ and Dy3+. The latter are considered by the authors of [31,32].

3.4. Study of PL of Ceramic Solid Solutions ErNbxTa1−xO4 (x = 0; 0.1; 0.3; 0.5; 0.7; 0.9; 1)

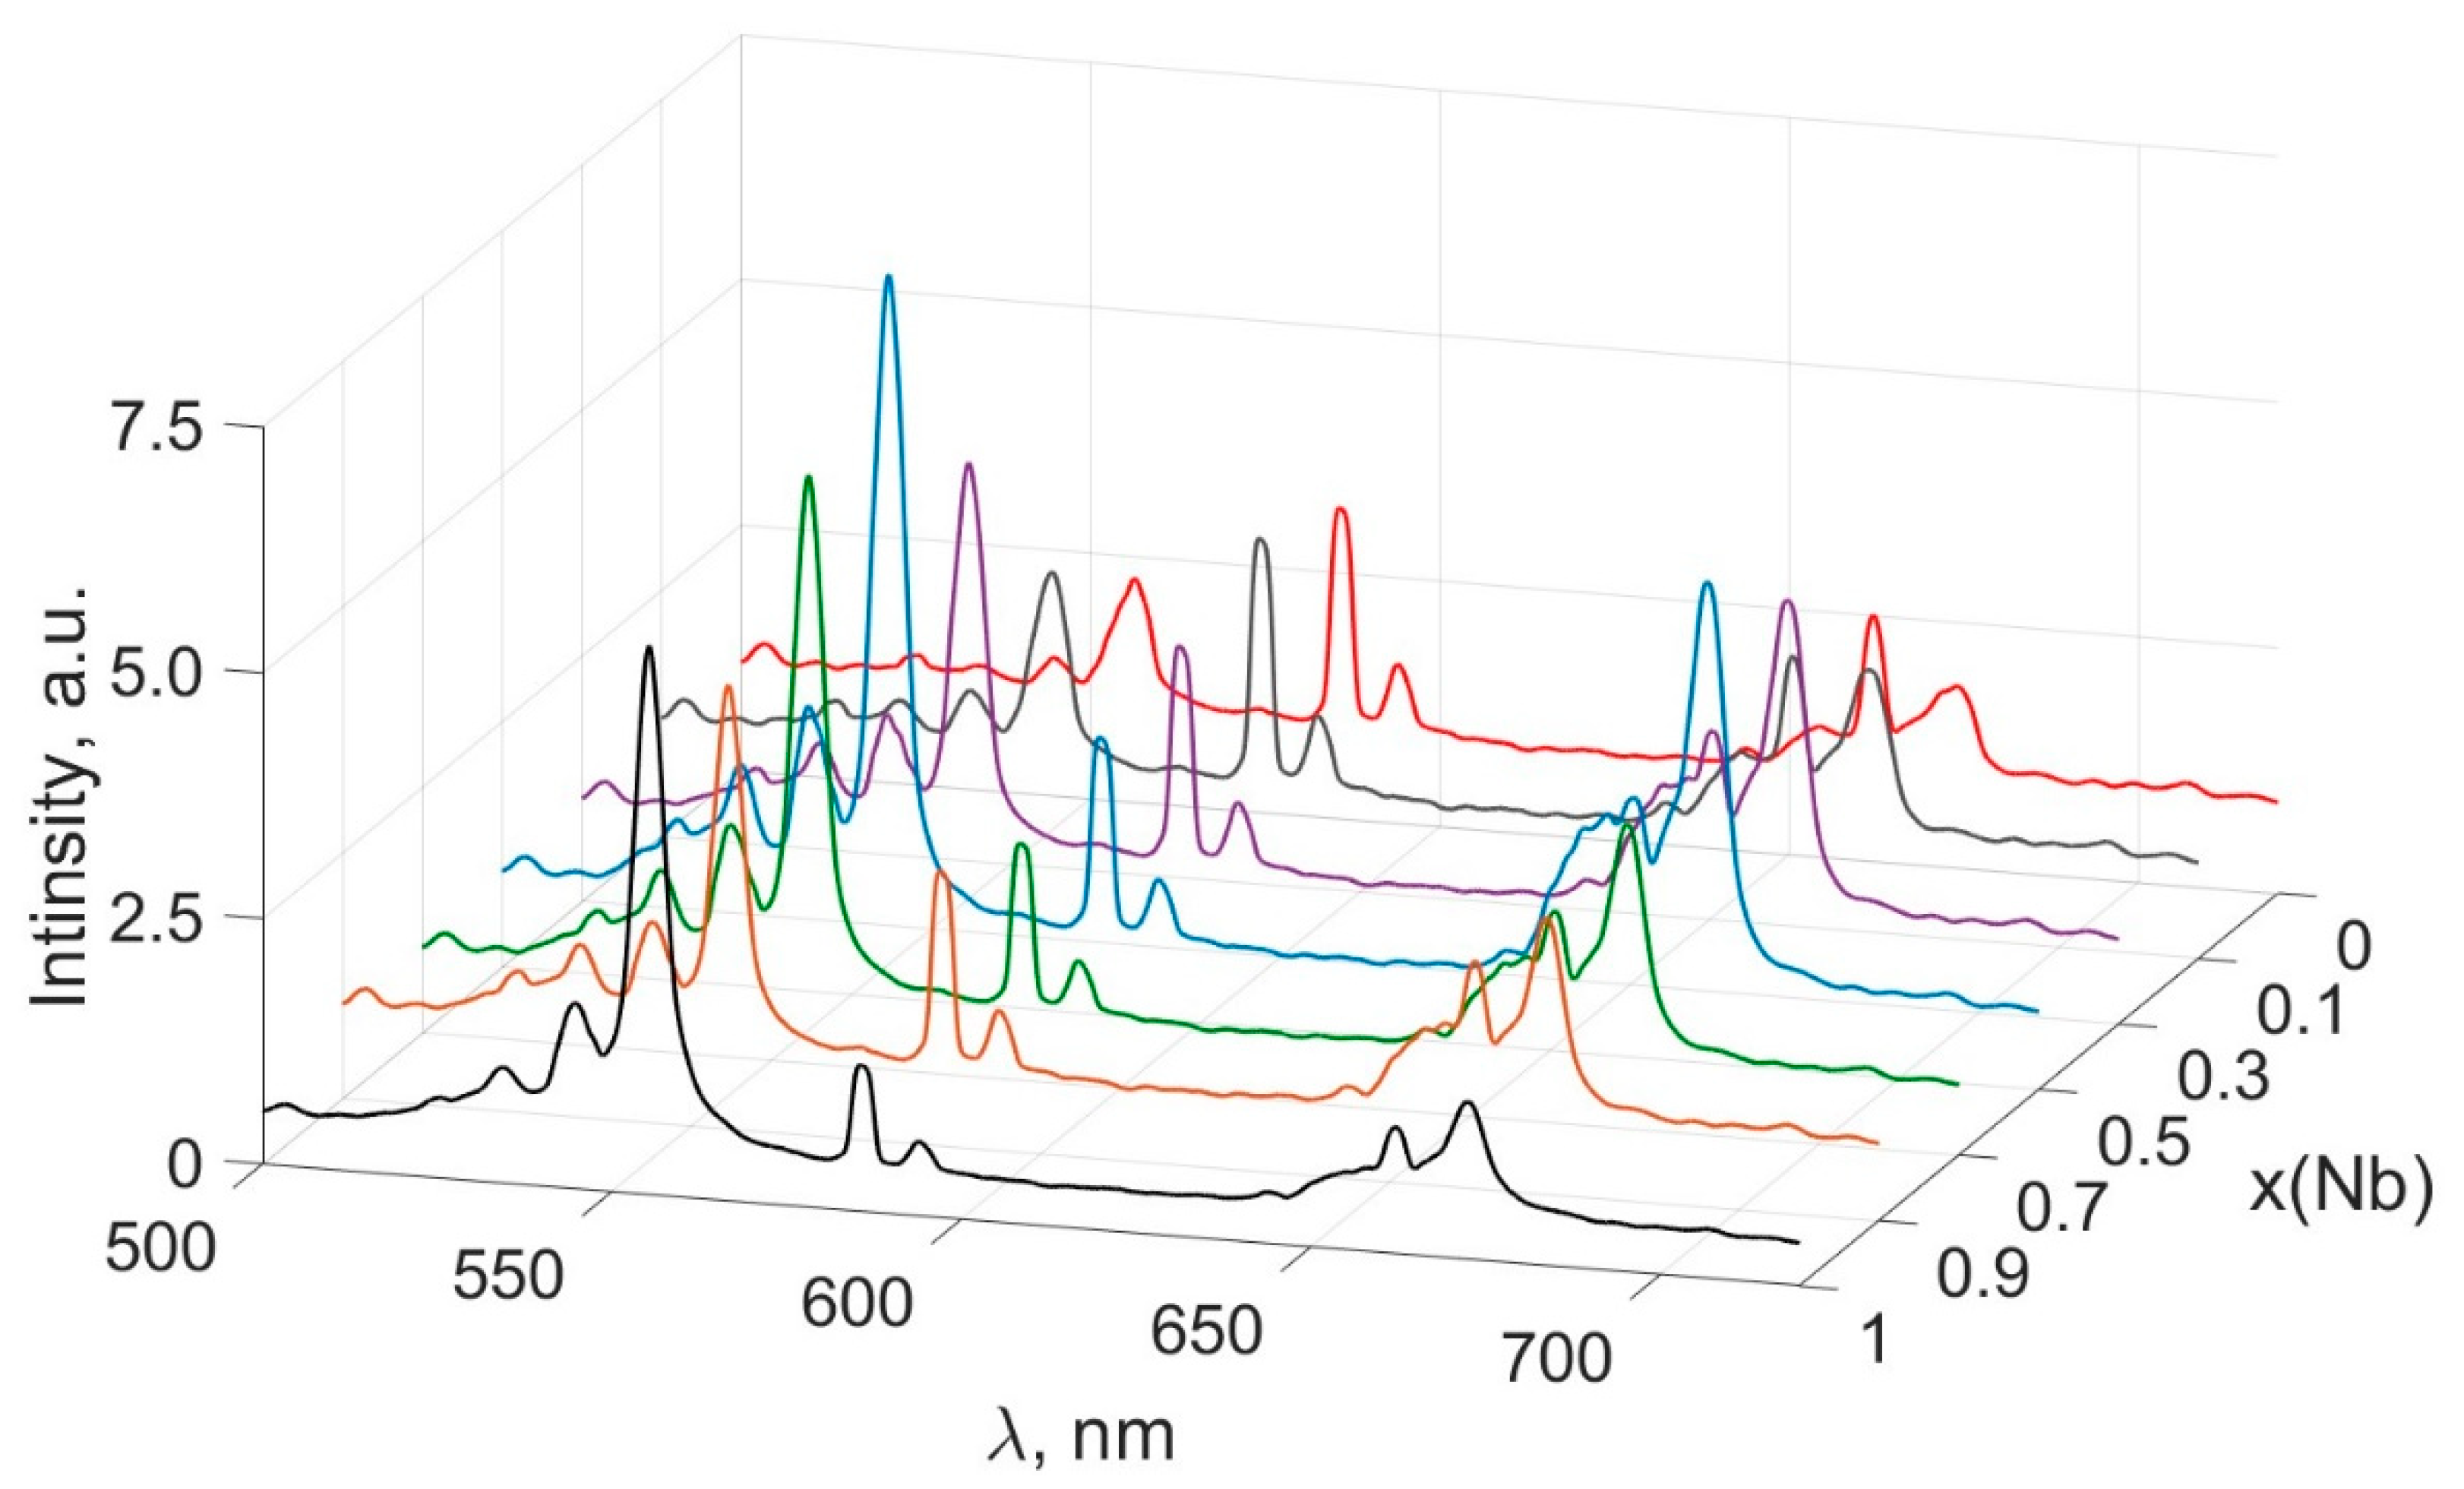
Figure 5 shows the PL spectra of ErNbxTa1−xO4 ceramics when laser radiation excites the near-IR range (λexc = 980 nm). The PL spectra of the samples under study consist of bands of different intensities which depend on the composition of the ceramics. The PL bands correspond to intraconfigurational transitions of the Er3+ ion in the host of ceramic samples in the spectral range from 500 to 700 nm. For example, the main radiative transitions of the Er3+ ion correspond to (2H11/2, 4S3/2) → 4I15/2 in the region of 500–560 nm and the main radiative transitions of the Er3+ ion correspond to 4F9/24I15/2 in the region of 640–680 nm [34,35,36], as seen in Figure 5. PL peaks at 585 and 594 nm and, as far as we know, have not been previously observed in ceramic and single-crystalline niobate-tantalates of alkali and REEs [35,36]. The reason for the appearance of these bands can presumably be associated with the radiative transition 4G9/24I11/2 of the Er3+ ion during three-photon absorption according to the refined Dieke’s diagram [34].
The mechanism of UCL of the Er3+ ion consists of sequential absorption of IR radiation and subsequent emission in the visible region. Initially, the first low-energy quantum with energy Eexc = 1.27 eV is absorbed by the Er3+ ion and transferred to the excited state (transition 4I15/24I11/2). Subsequent absorption of the second quantum transfers the Er3+ ion to a higher energy state. This increases the population of the 4F7/2 levels.
Further nonradiative recombination with the participation of lattice phonons transfers the Er3+ ion to the 4S3/2 state. The radiative transition 4S3/24I15/2 produces UCL in the visible region. The radiative transition 2H11/24I15/2 (Figure 5 appears in the PL spectra near 535 nm due to the small energy difference between the 2H11/2 and 4S3/2 levels and the influence of the crystal field of the ceramic host [34,35,36,37,38].
The transition of the Er3+ ion to the 4F9/2 state is possible in two ways. The first is phonon relaxation from the 4S3/2 level to the 4F9/2 level. However, this transition has a low probability as the intensity of the radiative transition 4F9/24I15/2 is extremely low when the UV region is excited, compared to that when the near-IR region is excited [37]. The second way involves nonradiative relaxation from the 4I11/2 level to 4I13/2 and subsequent absorption of exciting radiation (4I13/24F9/2 transition). The latter provides intense PL at 675 nm, as seen in Figure 5. The transfer of the Er3+ ion to the excited state 4F7/2 is also possible due to the resonant energy transfer between two REEs where one element is a sensitizer, the second is an activator [39].
The highest quantum yield of PL is observed in ErNbO4 ceramics in comparison with ErTaO4 in individual compounds. The excess in intensity of the 4S3/24I15/2 transition is about 60%, as seen in Figure 5. One of the reasons for the weak intensity of UCL of ErTaO4 ceramics may be due to the presence of an additional phase in the form of Er3NbO7 (cubic system, Figure 2, Table 3). It leads to the creation of structural defects of various sizes at the boundaries of two phases. The latter can lead to an increase in the proportion of nonradiative processes and weak PL intensity of Er3+ ions in the ErTaO4 host. The PL intensity in the green and red regions of the spectrum depends on the Nb/Ta ratio in mixed ceramic matrices.
Changing the Nb/Ta ratio changes the average distance between the atoms of the crystal host (A5+) and O2− (Table 4). This can cause PL quenching in the tantalate host [40,41]. Substitution of Nb5+/Ta5+ in the solid solution also leads to changes in the crystal field strength due to a change in the lengths of the A5+–O2− bonds. The atom substitution affects the symmetry of the local environment of the luminescence center. Both of these quantities affect the host element of the transition between the ground and excited states of the ion and the shape of the vibronic potential and change the PL intensity.
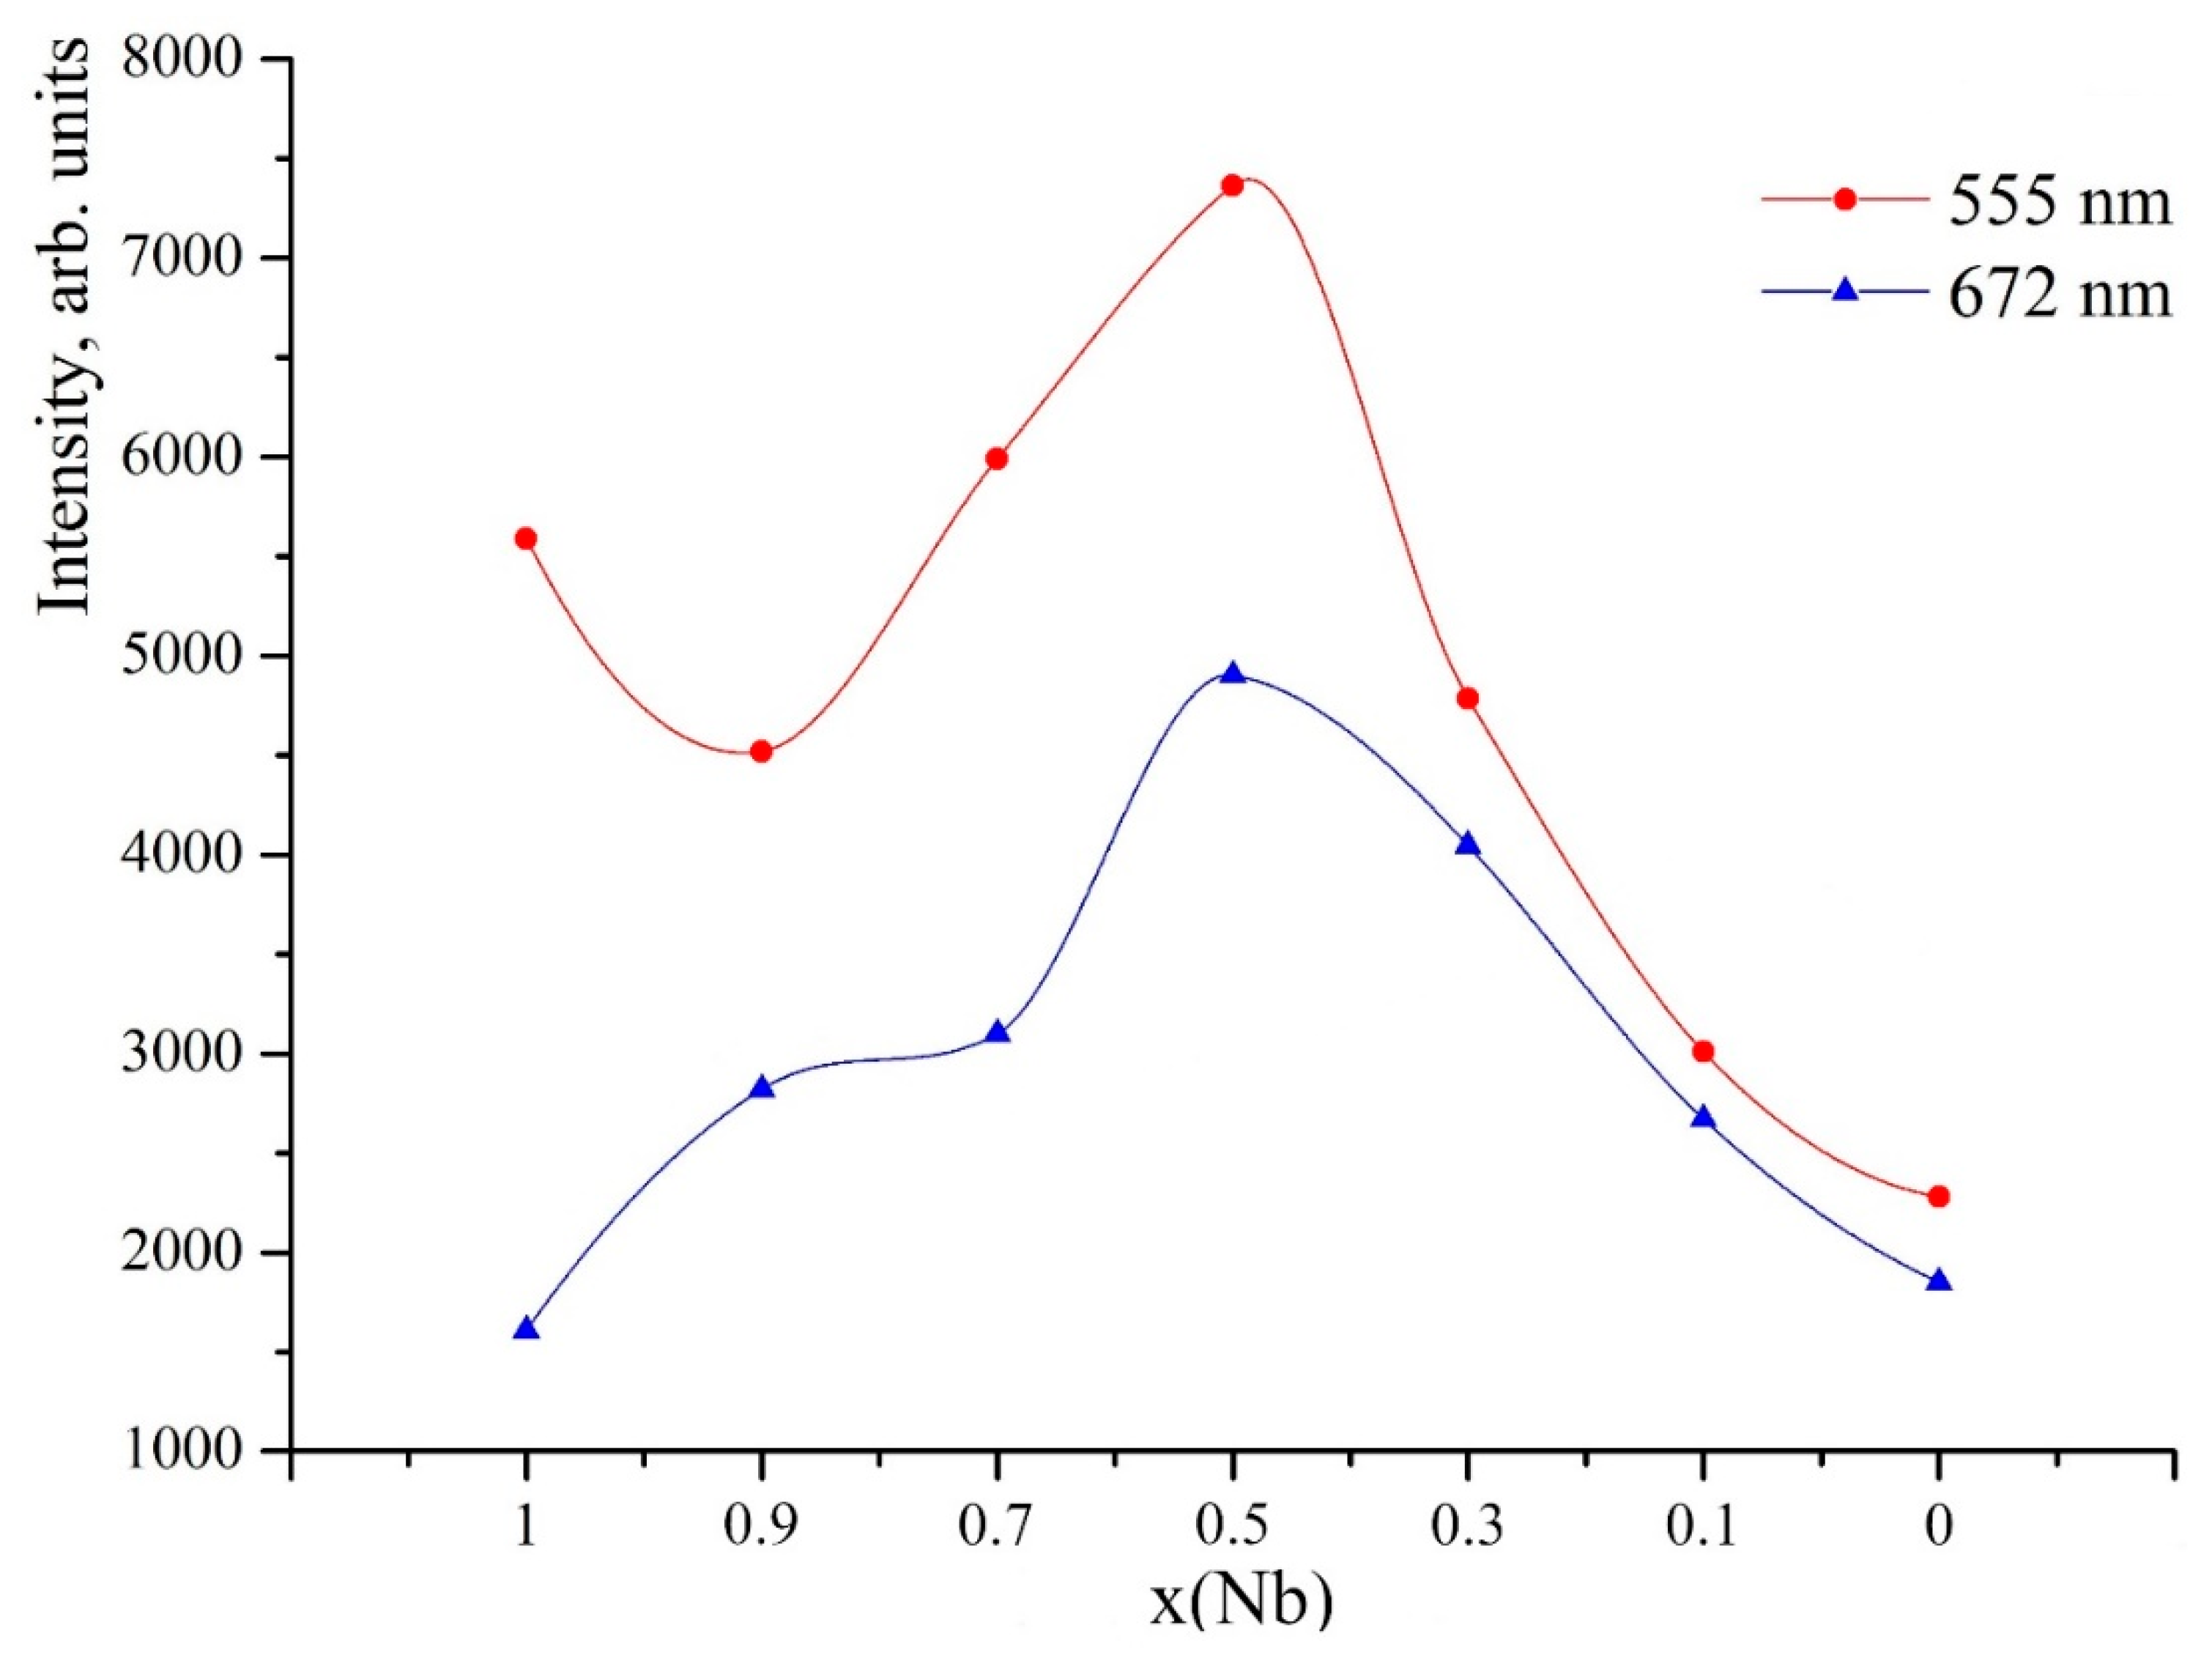
Figure 6 shows the change in the intensity of the peaks at 555 and 672 nm in the samples depending on the composition. If there is a gradual decrease in Nb from x = 1 to x = 0.5, the PL intensity at 555 and 672 nm increases in ErNbx-1TaxO4 ceramics, with the exception of ceramics with the composition ErNb0.9Ta0.1O4. According to X-ray phase analysis, an additional phase Er3NbO7 (see Figure 2, Table 3) is present in the last sample. This phase reduces the PL intensity to the greatest extent at 555 nm. When the amounts of Nb and Ta in the ErNb0.5Ta0.5O4 ceramic structure are equal, the PL intensity of both maxima reaches its maximum value. And this intensity prevails over the PL intensity in individual compounds. This may be promising for creating temperature sensors based on this material [35,37,38].
These results correlate well with the presence of two phases in the sample with the composition ErNb0.5Ta0.5O4—about 82% monoclinic β-fergusonite with C2/c and 18% monoclinic M-fergusonite with P2/a. An increase in the PL intensity is observed in the region around Nb/Ta = 1. This may be due to the structural rearrangement of one cell into another. This in turn affects the efficiency of Er PL due to anisotropic changes in the distance between the ErO8 polyhedron and neighboring AO6.
The intensity of the PL bands at 585 and 594 nm monotonically increases in the series of ErNbO4 →ErNb0.7Ta0.3O4 →ErNb0.5Ta0.5O4 ceramics, which are monophasic with a fergusonite-β type structure, as seen in Figure 2.
The main energy process in the studied ErNbxTa1−xO4 ceramics is the energy transfer from the host. At the same time, there is a general tendency of increasing PL intensity in the blue region of the spectrum in ErNbxTa1−xO4 with increasing niobium concentration [42]. If there were no disorder processes in the niobium-tantalum sublattice, the growth of PL intensity (I) with increasing niobium concentration (x) would proceed without anomalies and the dependence I(x) would be close to linear. However, due to the structural transition from the monoclinic symmetry of the C2/c cell to the monoclinic P2/a cell and the positional disorder of the niobium and tantalum cations near the concentration x = 0.5, a pronounced maximum is observed in the I(x) dependence.
When the niobium concentration increases in the range x = 0.5–0.7, the positional disorder in the B-sublattice decreases and the polarization of the oxygen octahedron AO6 changes (Table 4); a regular decrease in the PL intensity is also observed.
At further increase in niobium concentration (x = 0.7–1.0), the tendency of the intrinsic PL intensity growth in ErNbxTa1−xO4 with increasing niobium concentration comes into force [42]. That is, the energy transfer from the ErNbxTa1−xO4 host to Er3+ increases and, accordingly, the PL intensity at the intracenter transitions of Er3+ ion grows.

3.5. Bacteriological Properties of Powder ErNbO4

To test the photobactericidal properties, a simple composition, ErNbO4, which has moderate luminescent properties, was chosen,. In experiments made to test photoinduced toxicity under natural light, luminescent powder ErNbO4 showed good bactericidal action against bacterial cells of Escherichia coli, Bacillus brevis and Micrococcus sp. The residual number of bacteria after exposure for 24 h was ~20.6, 16.94 and 11.67%, respectively, of the initial value, as seen in Table 6.
The most resistant to the effect were Gram-negative bacterial cells Escherichia coli, as seen in Table 6. This is due to the more complex structure of their cell wall compared to Gram-positive Micrococcus sp. It is generally known that the main structure responsible for the general resistance of Gram-negative bacteria to various external agents is the outer membrane. It is part of the cell wall [43]. The outer membrane is based on a two-layer asymmetric structure. Their outer layer consists mainly of liposaccharides (LPS) and protein complexes embedded between LPS [44]. The total negative charge of LPS is associated with a high content of negatively charged groups in the central part of these macromolecules.
Probably, under the influence of the polycationic compound ErNbO4, LPS are released, disintegration of the outer membrane occurs and its permeability increases [45,46].
Gram-positive bacterial cells Micrococcus sp. participated in experiments without lighting. Experiments have shown that the number of bacterial cells Micrococcus sp. decreases only by half when they are kept in the dark. This is apparently due to the insignificant bactericidal activity of ErNbO4 itself, Table 7.
Table 7 shows that in the dark, the number of bacterial cells Micrococcus sp. in the presence of ErNbO4 phosphor powder decreases significantly less and more slowly than in natural light.
Photoinduced toxicity of ErNbO4 applied to bacterial cells of Micrococcus sp. is higher than dark toxicity by ~5 times. Photoinduced toxicity of the ErNbO4 luminophore is most effective for inactivating bacterial cells Micrococcus sp. Their distinctive feature is the simple structure of the cell wall. It should also be noted that the experimental results are very reproducible. Experiments in light with bacterial cells Micrococcus sp. were repeated in a comparative series of experiments in light and in the dark. The residual amount of Micrococcus sp. after exposure for 24 h in the first experiment was 11.67%, and it was 11.35% under the same conditions in the second, as seen in Table 6 and Table 7. Thus, the results coincide within the experimental error.

4. Conclusions

The liquid-phase synthesis method using erbium nitrate solutions and co-precipitated niobium and tantalum hydroxides helped to obtain fine powders of erbium niobate-tantalates ErNbxTa1−xO4 (x = 0; 0.1; 0.3; 0.5; 0.7; 0.9; 1)
Ceramic samples were prepared from the resulting fine powders, according to CS. The phase structures of ErNb1−xTaxO4 ceramic solid solutions depending on the Nb/Ta ratio in the composition of the samples were obtained by Rietveld refinement of X-ray diffraction patterns of polycrystals. It has been shown that the structure of the ErNbxTa1−xO4 solid solution from x = 1 to x = 0.5 corresponds to the structure of fergusonite-β with a monoclinic cell of erbium orthoniobate (ICDD, card 04-006-1916 SPGR: C2/c (15), Z = 4).
It has been established that in the ErNbxTa1−xO4 series, at about x = 0.5, a structural transition occurs from the monoclinic symmetry of the C2/c cell to the monoclinic P2/a cell. When Ta in ErNbxTa1−xO4 increases (at x = 0.3 or less), the solid solution crystallizes in the structure of M-fergusonite, ICDD, card 04-012-5293 SPGR: P2/a (13), Z = 2. The crystal matrix atoms (tantalum or niobium) are in a distorted octahedral coordination with six Ta(Nb)–O bonds in the β-fergusonite structure, and the tantalum (niobium) atoms are in a tetrahedral coordination in M-fergusonite.
The mechanical characteristics of ceramic solid ErNbxTa1−xO4 (x = 0; 0.1; 0.3; 0.5; 0.7; 0.9; 1) solutions were determined. It was shown that the best mechanical characteristics, microhardness (H = 6.11 ± 0.86 GPa), Young’s modulus (E = 297.6 ± 10.8 GPa) and crack resistance (KIC = 1.44 ± 0.2, MPa m0.5) were possessed by the ErNbO4 ceramic sample and the single-phase niobate-tantalate sample ErNb0.7Ta0.3O4 with microhardness (H = 5.68 ± 1.0 GPa), Young’s modulus (E = 162.4 ± 6.9 GPa) and crack resistance (KIC = 1.20 ± 0.1 MPa m0.5).
The luminescent properties of ceramic samples were studied. It was shown that when laser radiation excites in the near-IR range (λexc = 980 nm), solid solutions of ErNbxTa1−xO4 (x = 0; 0.1; 0.3; 0.5; 0.7; 0.9; 1) irradiate PL with increasing conversion of the exciting radiation, and maximum value of PL was in ErNb0.5Ta0.5O4.
The photoinduced and dark toxicity of the up-conversion phosphor ErNbO4 was studied in relation to Gram-positive, Gram-negative and spore-forming microorganisms. It was shown that inactivation of Gram-positive bacteria Micrococcus sp. by the up-conversion phosphor ErNbO4 is most effective in the light. This is apparently due to the structure of their cell wall.

Author Contributions

Conceptualization—O.S., M.P. and N.F.; Methodology—O.S., M.S., E.Z. and N.F.; Validation—M.S., O.S. and N.F.; Investigation—S.M., O.S., M.S., E.Z. and N.F.; Data Curation—E.Z. and S.M.; Writing—Original Draft—O.S., M.S., S.M., N.F. and D.M.; Writing—Review and Editing—O.S. and M.P.; Visualization—O.S., M.S. and N.F.; Resources—D.M.; Supervision—O.S. All authors have read and agreed to the published version of the manuscript.

Funding

This work was financially supported by the Ministry of Science and Higher Education Russian Federation scientific topics FMEZ-2025-0055 and FMEZ-2025-0044.

Data Availability Statement

Data is provided within the manuscript and will be available from the corresponding author on a reasonable request.

Conflicts of Interest

The authors declare no conflicts of interest.

References

  1. Ikesue, A. (Ed.) Solid-State Lighting. In Processing of Ceramics Breakthroughs in Optical Materials; Wiley: Hoboken, NJ, USA, 2021; pp. 187–274. [Google Scholar]
  2. Li, W.; Mi, W.; Chen, L.-J. Advances, challenges and prospects of visible fiber lasers in display technologies. Displays 2024, 82, 102630. [Google Scholar] [CrossRef]
  3. Auzel, F. Upconversion and anti-stokes processes with f and d ions in solids. Chem. Rev. 2004, 104, 139–174. [Google Scholar] [CrossRef]
  4. Zhang, F. General Introduction to Upconversion Luminescence Materials. In Photon Upconversion Nanomaterials; Springer: Berlin/Heidelberg, Germany, 2015. [Google Scholar] [CrossRef]
  5. Tian, Y.; Huang, P.; Wang, L.; Shi, Q.; Cui, C. Efect of Yb3+ concentration on upconversion luminescence and temperature sensing behavior in Yb3+/Er3+ codoped YNbO4 nanoparticles prepared via molten salt route. Chem. Eng. J. 2016, 297, 26–34. [Google Scholar] [CrossRef]
  6. Wang, X.; Li, X.; Zhong, H.; Xu, S.; Cheng, L.; Sun, J.; Zhang, J.; Li, L.; Chen, B. Up-conversion luminescence, temperature sensing properties and laser-induced heating effect of Er3+/Yb3+co-doped YNbO4 phosphors under 1550 nm excitation. Sci. Rep. 2018, 8, 5736. [Google Scholar] [CrossRef] [PubMed]
  7. Ofelt, G.S. Intensities of Crystal Spectra of Rare-Earth Ions. J. Chem. Phys. 1962, 37, 511–520. [Google Scholar] [CrossRef]
  8. Singh, S.; Kachhap, S.; Sharmaa, M.; Singh, S.K. Enhancing the temperature sensing property of a Ca0.79−xBixEr0.01Yb0.2MoO4 phosphor via local symmetry distortion and reduction in non-radiative channels. RSC Adv. 2023, 13, 14991–15000. [Google Scholar] [CrossRef]
  9. Thakur, H.; Singh, S.; Gathania, A.K.; Singh, S.K.; Singh, R.K. Effect of Li+/K+/Zn2+ doping on the optical and temperature sensing properties of Tm3+ and Yb3+ doped YVO4 phosphor. Ceram. Intern. 2023, 49, 25935–25944. [Google Scholar] [CrossRef]
  10. Haase, M.; Schafer, H. Upconverting nanoparticles. Angew. Chem. Int. Ed. 2011, 50, 5808–5829. [Google Scholar] [CrossRef]
  11. Wang, R.; Zhang, F. NIR luminescent nanomaterials for biomedical imaging. J. Mater. Chem. B 2014, 2, 2422–2443. [Google Scholar] [CrossRef]
  12. Wei, D.; Qi, J.; Hamblin, M.R.; Wen, X.; Jiang, X.; Yang, H. Near-infrared photoimmunotherapy: Design and potential applications for cancer treatment and beyond. Theranostics 2022, 12, 7108–7131. [Google Scholar] [CrossRef]
  13. O’Neill, J. Tackling Drug-Resistant Infection Globally: Final Report and Reccommendations; Review on Antimicrobial Resistance; Wellcome Trust: London, UK, 2016; p. 80. [Google Scholar]
  14. Alves, E.; Faustino, M.A.F.; Neves, M.G.P.M.S.; Cunha, A.; Tome, J.P.C.; Almeida, A. An insight on bacterial cellular targets of photodynamic inactivation. Future Med. Chem. 2014, 6, 141–164. [Google Scholar] [CrossRef]
  15. Almeida, A.; Faustino, M.A.F.; Tome, J.P.C. Photodynamic inactivation of bacteria: Finding the effective targets. Future Med. Chem. 2015, 7, 1221–1224. [Google Scholar] [CrossRef]
  16. Bonnett, R. Photosensitizers of the Porphyrin and Phthalocyanine Series for Photodynamic Therapy. Chem. Soc. Rev. 1995, 24, 19–33. [Google Scholar] [CrossRef]
  17. Liu, J.J.; Zhang, L.C.; Du, X.J.; Cui, F.X.; Du, C.L.; Gao, B.X. PEG Encapsulation of Porphyrins for Cell Imaging and Photodynamic Therapy. Lett. Org. Chem. 2013, 10, 342–347. [Google Scholar] [CrossRef]
  18. Zhang, J.L.; Deng, L.; Yao, J.Z.; Gu, P.; Yang, F.; Wang, X.X.; Liu, W.; Zhang, Y.Y.; Ke, X.F.; Jing, X.L.; et al. Synthesis and photobiological study of a novel chlorin photosensitizer BCPD-18MA for photodynamic therapy. Bioorg. Med. Chem. 2011, 19, 5520–5528. [Google Scholar] [CrossRef] [PubMed]
  19. Noemie, T. Tissue distribution and pharmacokinetics of an ATWLPPR-conjugated chlorin-type photosensitizer targeting neuropilin-1 in glioma-bearing nude mice. Photochem. Photobiol. Sci. 2008, 7, 433–441. [Google Scholar] [CrossRef]
  20. Isakau, H.A. Toward understanding the high PDT efficacy of chlorin e6-polyvinylpyrrolidone formulations: Photophysical and molecular aspects of photosensitizer-polymer interaction in vitro. J. Photochem. Photobiol. B 2008, 92, 165–174. [Google Scholar] [CrossRef]
  21. Asano, R.; Nagami, A.; Fukumoto, Y.; Yazama, F.; Ito, H.; Sakata, I.; Tai, A. Synthesis and biological evaluation of new chlorin derivatives as potential photosensitizers for photodynamic therapy. Bioorg. Med. Chem. 2013, 21, 2298–2304. [Google Scholar] [CrossRef]
  22. Maslenikov, I.I.; Reshetov, V.N.; Useinov, A.S. Mapping the elastic modulus of a surface with a NanoScan 3D scanning microscope. Instrum. Exp. Tech. 2015, 58, 711. [Google Scholar] [CrossRef]
  23. Malygin, G.A. Plasticity and strength of micro- and nanocrystalline materials. Phys. Sol. State. 2007, 49, 1013–1033. [Google Scholar] [CrossRef]
  24. Anstis, G.R.; Chantikul, P.; Lawn, B.R.; Marshall, D.B. A Critical Evaluation of Indentation Techniques for Measuring Fracture Toughness: I, Direct Crack Measurements. J. Am. Ceram. Soc. 1981, 64, 533–538. [Google Scholar] [CrossRef]
  25. Chantikul, P.; Anstis, G.R.; Lawn, B.R.; Marshall, D.B. A Critical Evaluation of Indentation Techniques for Measuring Fracture Toughness: II, Strength Method. J. Am. Ceram. Soc. 1981, 64, 539–544. [Google Scholar] [CrossRef]
  26. Shannon, R.D. Revised effective ionic radii and systematic studies of interatomic distances in halides and chalcogenides. Acta Cryst. 1976, 32, 751–767. [Google Scholar] [CrossRef]
  27. Trunov, V.K.; Kinzhibalo, L.N.; Efremov, V.A.; Krongauz, V.G. On the M′-structure of “orthotantalates” of the rare-earth elements. Dokl. Akad. Nauk SSSR 1981, 260, 103–106. [Google Scholar]
  28. Sanderson, R.T. Chemical Bonds and Bond Energy. Academic Press: New York, NY, USA, 1975. [Google Scholar]
  29. Voloshyna, O.V.; Boiaryntseva, I.A.; Baumer, V.N.; Ivanov, A.I.; Korjik, M.V.; Sidletskiy, O.T. New, dense, and fast scintillators based on rare-earth tantaloniobates. Nucl. Instrum. Meth. A 2014, 764, 227e231. [Google Scholar] [CrossRef]
  30. Xiao, W.; Yang, Y.; Pi, Z.; Zhang, F. Phase Stability and Mechanical Properties of the Monoclinic, Monoclinic-Prime and Tetragonal REMO4 (M = Ta, Nb) from First-Principles Calculations. Coatings 2022, 12, 73. [Google Scholar] [CrossRef]
  31. Wu, F.; Wu, P.; Zhou, Y.; Chong, X.; Feng, J. The thermo-mechanical properties and ferroelastic phase transition of RENbO4 (RE = Y, La, Nd, Sm, Gd, Dy, Yb) ceramics. J. Am. Ceram. Soc. 2020, 103, 2727–2740. [Google Scholar] [CrossRef]
  32. Zhu, J.; Xu, J.; Zhang, P.; Meng, X.; Cao, S.; Wu, J.; Wei, M.; Shi, Y.; Reece, M.J.; Gao, F. Enhanced mechanical and thermal properties of ferroelastic high-entropy rare-earth-niobates. Scr. Mater. 2021, 200, 113912. [Google Scholar] [CrossRef]
  33. Chen, L.; Hu, M.; Guo, J.; Chong, X.; Feng, J. Mechanical and thermal properties of RETaO4 (RE = Yb, Lu, Sc) ceramics with monoclinic-prime phase. J. Mater. Sci. Technol. 2020, 52, 20–28. [Google Scholar] [CrossRef]
  34. Suzuki, K.; Kotani, T.; Sato, K. First-principles method justifying the Dieke diagram and beyond. Phys. Rev. Res. 2023, 5, 013111. [Google Scholar] [CrossRef]
  35. Zhang, D.L.; Hou, Z.P.; Han, F.; Hua, P.R.; Yu, D.Y.; Pun, E.Y.B. Er3+ upconversion fluorescence of ErNbO4 phosphor for optical temperature sensing. IEEE Photon. Technol. Lett. 2014, 26, 1601–1604. [Google Scholar] [CrossRef]
  36. Zhang, D.L.; Hua, P.R.; Cui, Y.M.; Chen, C.H.; Pun, E.Y.B. Absorption and emission characteristics of Er3NbO7 phosphor: A comparison with ErNbO4 phosphor and Er:LiNbO3 single crystal. J. Lumin. 2007, 127, 453–460. [Google Scholar] [CrossRef]
  37. Wang, X.; Li, X.; Cheng, L.; Xu, S.; Sun, J.; Zhang, J.; Zhang, X.; Yang, X.; Chen, B. Concentration-dependent spectroscopic properties and temperature sensing of YNbO4:Er3+ phosphors. RSC Adv. 2017, 7, 23751–23758. [Google Scholar] [CrossRef]
  38. Singh, S.; Kachhap, S.; Singh, A.K.; Pattnaik, S.; Singh, S.K. Temperature sensing using bulk and nanoparticles of Ca0.79Er0.01Yb0.2MoO4. Methods Appl. Fluoresc. 2022, 10, 044004. [Google Scholar] [CrossRef]
  39. Hirano, M.; Ishikawa, K. Hydrothermal formation and up-conversion luminescence of Er3+-doped GdNbO4. J. Am. Ceram. Soc. 2017, 100, 2814–2821. [Google Scholar] [CrossRef]
  40. Blasse, G.; Bril, A. Luminescence phenomena in compounds with fergusonite structure. J. Lumin. 1970, 3, 109–131. [Google Scholar] [CrossRef]
  41. Blasse, G.; Bril, A. Photoluminescent Efficiency of Phosphors with Electronic Transitions in Localized Centers. J. Electrochem. Soc. 1968, 115, 1067–1076. [Google Scholar] [CrossRef]
  42. Palatnikov, N.; Smirnov, M.V.; Masloboeva, S.M.; Shcherbina, O.B.; Sidorov, N.V.; Steblevskay, N.I.; Belobeletskaya, M.V. Luminescence properties of Sol–Gel Derived Ceramic GdNbxTa1−xO4 and YNbxTa1−xO4 Solid Solutions. Inorg. Mat. 2020, 56, 437–442. [Google Scholar] [CrossRef]
  43. Nitzan, Y.; Gutterman, M.; Malik, Z.; Ehrenberg, B. Inactivation of gram-negative bacteria by photosensitized Porphyrins. Photochem. Photobiol. 1992, 55, 89–96. [Google Scholar] [CrossRef]
  44. Raetz, C.R.; Ulevitch, R.J.; Wright, S.D.; Sibley, C.H.; Ding, A.; Nathan, C.F. Gram-negative endotoxin an extraordinary lipid with profound effects on eukaryotic transduction. FASEB J. 1991, 5, 2652–2660. [Google Scholar] [CrossRef]
  45. Hamblin, M.R.; Gasan, T. Photodynamic therapy: A new antimicrobical approach to infectious desease. Photochem. Photobiol. Sci. 2004, 3, 436–450. [Google Scholar] [CrossRef] [PubMed]
  46. Ergaieg, K.; Chevanne, M.; Cillard, J.; Seux, R. Involvement of both Type I and Type II mechanisms in Gram-positive and Gram-negative bacteria photosensitization by a meso-substituted cationic porphyrin. J. Sol. Energy 2008, 82, 1107–1117. [Google Scholar] [CrossRef]
Figure 1. SEM images of ErNbxTa1−xO4 powders of typical morphology: (a)—ErNbO4; (b)—ErNb0.1Ta0.9O4. The insets show differential particle size distribution curves.
Ceramics 08 00130 g001
Figure 2. XRD patterns of ErNbxTa1−xO4 ceramic samples with Rietveld refinement of the main phases.
Ceramics 08 00130 g002
Figure 3. Structure of monoclinic cells P2/a and C2/c and coordination polyhedra around Ta and Nb atoms, respectively. The figure shows the distances k from the atoms of the crystal host (A5+) to the most distant oxygen atoms in the cell.
Ceramics 08 00130 g003
Figure 4. Microstructure and size composition of crystallites (in inserts) of ErNbxTa1−xO4 ceramic samples: (a) ErNbO4; (b) x = 0.9; (c) x = 0.7; (d) x = 0.5; (e) x = 0.3; (f) x = 0.1; (g) ErTaO4.
Ceramics 08 00130 g004
Figure 5. UCL spectra of ErNbxTa1−xO4 ceramics excited by near-IR laser radiation.
Ceramics 08 00130 g005
Figure 6. Change in the intensity of the main bands of the PL spectrum of ErNb1−xTaxO4 ceramics depending on the composition.
Ceramics 08 00130 g006
Table 1. Illumination in the spectral range from 380 to 980 nm and irradiance in the spectral range from 280 to 400 nm.
Lighting TypeIllumination in the Spectral Range from ~400 to 980 nm, LuxEnergy Illumination in the Spectral Range from 280 to 400 nm, mW/m2
Daylight2617 ± 209132 ± 13.2
Table 2. Elemental composition and specific surface area of synthesized erbium niobate-tantalate powders.
SampleAnalysis Results, wt%Specific Surface Area, Ssp, m2/gAverage Particle Size of Powders dav, µm
ErNbTa
ErNbO450.4029.62-1.040.78
ErNb0.9Ta0.1O447.6826.375.751.390.64
ErNb0.7Ta0.3O446.2219.4015.891.280.56
ErNb0.5Ta0.5O444.5013.0424.951.150.57
ErNb0.3Ta0.7O441.657.5334.071.540.42
ErNb0.1Ta0.9O440.862.4340.551.650.39
ErTaO441.10-43.400.840.75
Table 3. Refined values of the periods of unit cells of the main phases of ceramic samples ErNbxTa1−xO4 (x = 0; 0.1; 0.3; 0.5; 0.7; 0.9; 1).
Sample CompositionPhase in the Samplea, Åb, Åc, Åβ, °VRwp, %Rp, %
ErNbO404-006-1916
SPGR: C2/c (15)
ErNbO4
7.02557(8)10.91922(14)5.06648(7)131.4512(6)291.3157.495.67
ErNb0.9
Ta0.1O4
04-006-1916
SPGR: C2/c (15)
ErNbO4
7.0183(3)10.9163(4)5.0642(2)131.390(2)291.07710.195.96
ErNb0.7
Ta0.3O4
04-006-1916
SPGR: C2/c (15)
ErNbO4
7.0040(3)10.9126(4)5.0592(2)131.1898(19)290.9928.685.32
ErNb0.5
Ta0.5O4
04-006-1916
SPGR: C2/c (15)
ErNbO4 Phase weight 82%
6.9911(2)10.9080(4)5.05474(19)131.0188(18)290.8366.084.01
04-012-5293;
ErTaO4
P2/a (13) Phase weight 18%
5.3035(4)5.4538(4)5.1333(6)96.100(8)147.6396.084.01
ErNb0.3
Ta0.7O4
04-012-5293, ErTaO4 P2/a (13) 5.2996(3)5.4523(3)5.0550(3)95.276(2)145.44610.006.72
ErNb0.1
Ta0.9O4
04-012-5293, ErTaO4 P2/a (13) M 5.28439(11)5.44368(11)5.09790(10)96.3053(8)145.7624.633.35
ErTaO404-012-5293, ErTaO4 P2/a (13) M 5.2827(3)5.4402(3)5.0981(3)96.352(3)145.6146.424.73
Table 4. Interatomic distances between A5+ and O2− ions in ErNbxTa1−xO4 (x = 0; 0.1; 0.3; 0.5; 0.7; 0.9; 1).
SPGRDistance Nb Content, x
10.90.70.50.30.10
C2/c (15), Z = 4Nb–O(1)a[O(1)b]1.765881.764541.761711.75912
Nb–O(2)a[O(2)b]2.428902.427032.423262.41979
Nb–O(2)c[O(2)d]1.825741.826461.829901.83271
P2/a (13), Z = 2Ta–O(1)a[O(1)b] 1.927931.926891.915201.91407
Ta–O(1)a[O(1)b] 2.480182.455722.472522.47237
Ta–O(2)c[O(2)d] 1.996871.975561.989871.98973
Table 5. Mechanical characteristics of ErNbxTa1−xO4 ceramic samples.
Sample CompositionMicrohardness, H, GPaYoung’s Modulus, E, GPaCrack Resistance, KIC, MPa m0.5
ErNbO46.11 ± 0.86297.6 ± 10.81.44 ± 0.2
ErNb0.9Ta0.1O42.86 ± 0.3184.8 ± 1.80.7 ± 0.1
ErNb0.7Ta0.3O45.68 ± 1.0162.4 ± 6.91.20 ± 0.1
ErNb0.5Ta0.5O43.82 ± 0.33137.7 ± 4.31.10 ± 0.1
ErNb0.3Ta0.7O45.12 ± 1.1223.1 ± 5.91.16 ± 0.15
ErNb0.1Ta0.9O43.4 ± 0.36198.8 ± 2.70.94 ± 0.1
ErTaO44.2 ± 0.9139.3 ± 6.81.06 ± 0.1
Table 6. Change in the number of bacterial cells in the sample depending on the exposure time under natural light in the presence of ErNbO4 powder. ErNbO4 concentration—2 and 5 (Bacillus brevis) mg/mL.
SampleBacterial Cell TypeNumber of Bacterial Cells
Initialin 4 hin 24 h
×104 cells/mL%×104 cells/mL%×104 cells/mL%
1Escherichia coli6 ± 0.41001.2 ± 0.520.31.2 ± 0.01820.6
2Bacillus brevis6 ± 0.41001.5 ± 0.1925.01 ± 0.216.94
3Micrococcus sp.6 ± 0.41001.25 ± 0.7520.80.7 ± 0.0111.67
Table 7. Change in the number of bacterial cells of Micrococcus sp. under natural light and in the dark, in the presence of ErNbO4 powder. The concentration of ErNbO4 is 2 mg/mL.
Bacterial Cell Type Experimental ConditionsNumber of Bacterial Cells
Initial in 4 hin 24 h
×105 cells/mL%×105 cells/mL %×105 cells/mL%
Micrococcus sp.light1.41 ± 0.51000.29 ± 0.1820.60.16 ± 0.0211.35
dark1.41 ± 0.51000.7 ± 0.349.650.7 ± 0.0149.65
Disclaimer/Publisher’s Note: The statements, opinions and data contained in all publications are solely those of the individual author(s) and contributor(s) and not of MDPI and/or the editor(s). MDPI and/or the editor(s) disclaim responsibility for any injury to people or property resulting from any ideas, methods, instructions or products referred to in the content.