Article

Structural and Dielectric Impedance Studies of Mixed Ionic–Electronic Conduction in SrLaFe1−xMnxTiO6 (x = 0, 0.33, 0.67, and 1.0) Double Perovskites

by
Abdelrahman A. Elbadawi
1,
Elsammani A. Shokralla
2,*,
Mohamed A. Siddig
1,2,
Obaidallah A. Algethami
2,
Abdullah Ahmed Alghamdi
2 and
Hassan H. E. Idris
2
1
Department of Physics, Faculty of Science and Technology, Al Neelain University, Khartoum 11111, Sudan
2
Department of Physics, Faculty of Science, Al-Baha University, Al Aqiq 65799, Saudi Arabia
*
Author to whom correspondence should be addressed.
Ceramics 2025, 8(3), 87; https://doi.org/10.3390/ceramics8030087
Submission received: 21 April 2025 / Revised: 3 July 2025 / Accepted: 5 July 2025 / Published: 7 July 2025
(This article belongs to the Special Issue Advances in Electronic Ceramics, 2nd Edition)

Abstract

The structural and electrical properties of double perovskite compounds SrLaFe1−xMnxTiO6−δ (x = 0, 0.33, 0.67, and 1.0) were studied using X-ray diffraction (XRD) and dielectric impedance measurements. The reparation of perovskite compounds was successfully achieved through the precursor solid-state reaction in air at 1250 °C. The purity phase and crystal structures of perovskite compounds were determined by means of the standard Rietveld refinement method using the FullProf suite. The best fitting results showed that SrLaFeTiO6−δ was orthorhombic with space group Pnma, and both SrLaFe0.67Mn0.33TiO6−δ and SrLaFe0.33Mn0.67TiO6−δ were cubic structures with space group Fm3m, while SrLaMnTiO6−δ was tetragonal with a I/4m space group. The charge density maps obtained for these structures indicated that the compounds show an ionic and mixed ionic–electronic conduction. The dielectric impedance measurements were carried out in the range of 20 Hz to 1 MHz, and the analysis showed that there is more than one relaxation mechanism of Debye type. Doping with Mn was found to reduce the dielectric impedance of the samples, and the major contribution to the dielectric impedance was established to change from a capacitive for SrLaFeTiO6−δ to a resistive for SrLaMnTiO6−δ. The fall in values of electrical resistance may be related to the possible occurrence of the double exchange (DEX) mechanism among the Mn ions, provided there is oxygen deficiency in the samples. DC-resistivity measurements revealed that SrLaFeTiO6−δ was an insulator while SrLaMnTiO6−δ was showing a semiconductor–metallic transition at ~250 K, which is in support of the DEX interaction. The dielectric impedance of SrLaFe0.67Mn0.33TiO6−δ was found to be similar to that of (La,Sr)(Co,Fe)O3-δ, the mixed ionic–electronic conductor (MIEC) model. The occurrence of a mixed ionic–electronic state in these compounds may qualify them to be used in free lead solar cells and energy storage technology.

1. Introduction

Mixed ionic–electronic conductors (MIEC) with simultaneous ionic and electronic conduction play an important role in many electrochemical applications, such as energy storage and solar cell technologies [1]. MIEC material is preferred for replacing the Ni-YSZ anode [2], and such a property is found in numerous perovskite structures, such as La1− xSrxFeO3−δ [3], SrSn1−x FexO3−x/2+δ [4], (La,Sr)(Ti,Ni)O3−δ [5], and La(Sr)Fe(Ni)O3 [6]. The presence of MIEC is essential, apart from the values of the ionic (σi) and electronic (σe) conductivities. For a perovskite to be qualified as an efficient electrode and current collector, the conditions σi ≥ 0.1 S/cm and σe ≥ 100 S/cm must be fulfilled [2] to be an alternative for the Ni-YSZ anode. The MIEC materials are receiving great attention from many research groups for their promising applications as a relatively clean and cheap source of energy [7,8,9,10,11]. The versatility of MIEC perovskites stems from their unique combination of ionic and electronic conductivity, making them suitable for a wide range of applications in energy systems and electronic devices [12,13,14]. New stable anode materials need to be developed in order to solve this problem. The perovskite structures are known to be stable under electrochemical reactions. Double perovskite based on Sr2CoMoO6 is assumed to be a good MIEC, where it gave a maximum power density of 1017 mW/cm2 when La0.8Sr0.12Ga0.83Mg0.17O2.815 was used as a solid electrolyte [12]. The dielectric impedance is one of the sensitive tools for inspecting the relaxation mechanism and conductivity of the MIEC materials [15,16,17,18]. Moreover, the dielectric impedance is used to probe the effect of the hydrogen on the electrical conductivity, and it is also used to probe the mixed ionic–electronic conductivity of materials [13]. Several researchers have focused their studies on the dielectric impedance and the conductivity of double perovskite materials; among them, T. Xia et al. [19] studied the dielectric and the conductivity of Sr2Fe1−xMxNbO6 (M = Zn and Cu) under variable oxygen partial pressure. The materials studied were observed to have high conductivity and were chemically stable under oxygen partial pressure between 1 atm and 10−22 atm at 873 K. The increase in the conductivity was related to the charge disproportionation reaction of the Fe3+ ions. The dielectric impedance measurements carried out by Q. Liu et al. on Sr2Fe1.5Mo0.5O6 [20] were shown to be sensitive to temperature. They explained conduction in terms of the equilibrium reaction of F e 3 + + M o 5 + F e 2 + + M o 6 + . The effect of the H/Ar2 mixture and air on the dielectric impedance of Sr2MgMoO6−δ was investigated by D. Marrero-Lopez et al. [21].
Iron-containing double perovskites such as (Sr2FeMoO6) have shown versatility in electrical conductivity with a half-metallic magnetic material suitable for spintronic application, such as Fe-rich Sr2Fe1.5Mo0.5O6, which is a mixed ionic–electronic conductor [22]. Moreover, the Fe content can be adjusted to a wide range of concentrations, as seen in SrTi1−xFex O3−x (x = 0.05–0.8), which is also an MIEC [23]. This may be related to its high resistance and insulating behavior. On the other hand, the compound SrLaMnTiO6 shows a semiconductor–metal transition at a low temperature [24]. Accordingly, it is interesting to study double perovskites, as they are a major class of MIEC materials, due to their tunable electrical, ionic properties, and structural stability. As mentioned earlier, the perovskite structures are stable under electrochemical reactions. In the present study, we investigate the doping effect of Mn in the Fe site of double perovskite SrLaFeTiO6, and its suitability as a mixed ionic–electronic conductor. The dielectric impedance measurements were used to probe such a property using equivalent circuit models proposed mainly for MIEC materials [25]. In addition, the conductivity dependence on the Mn concentration of SrLaFe1−xMnxTiO6 (x = 0, 0.33, 0.67, and 1.0) as the signature of possible MIEC materials was explored.

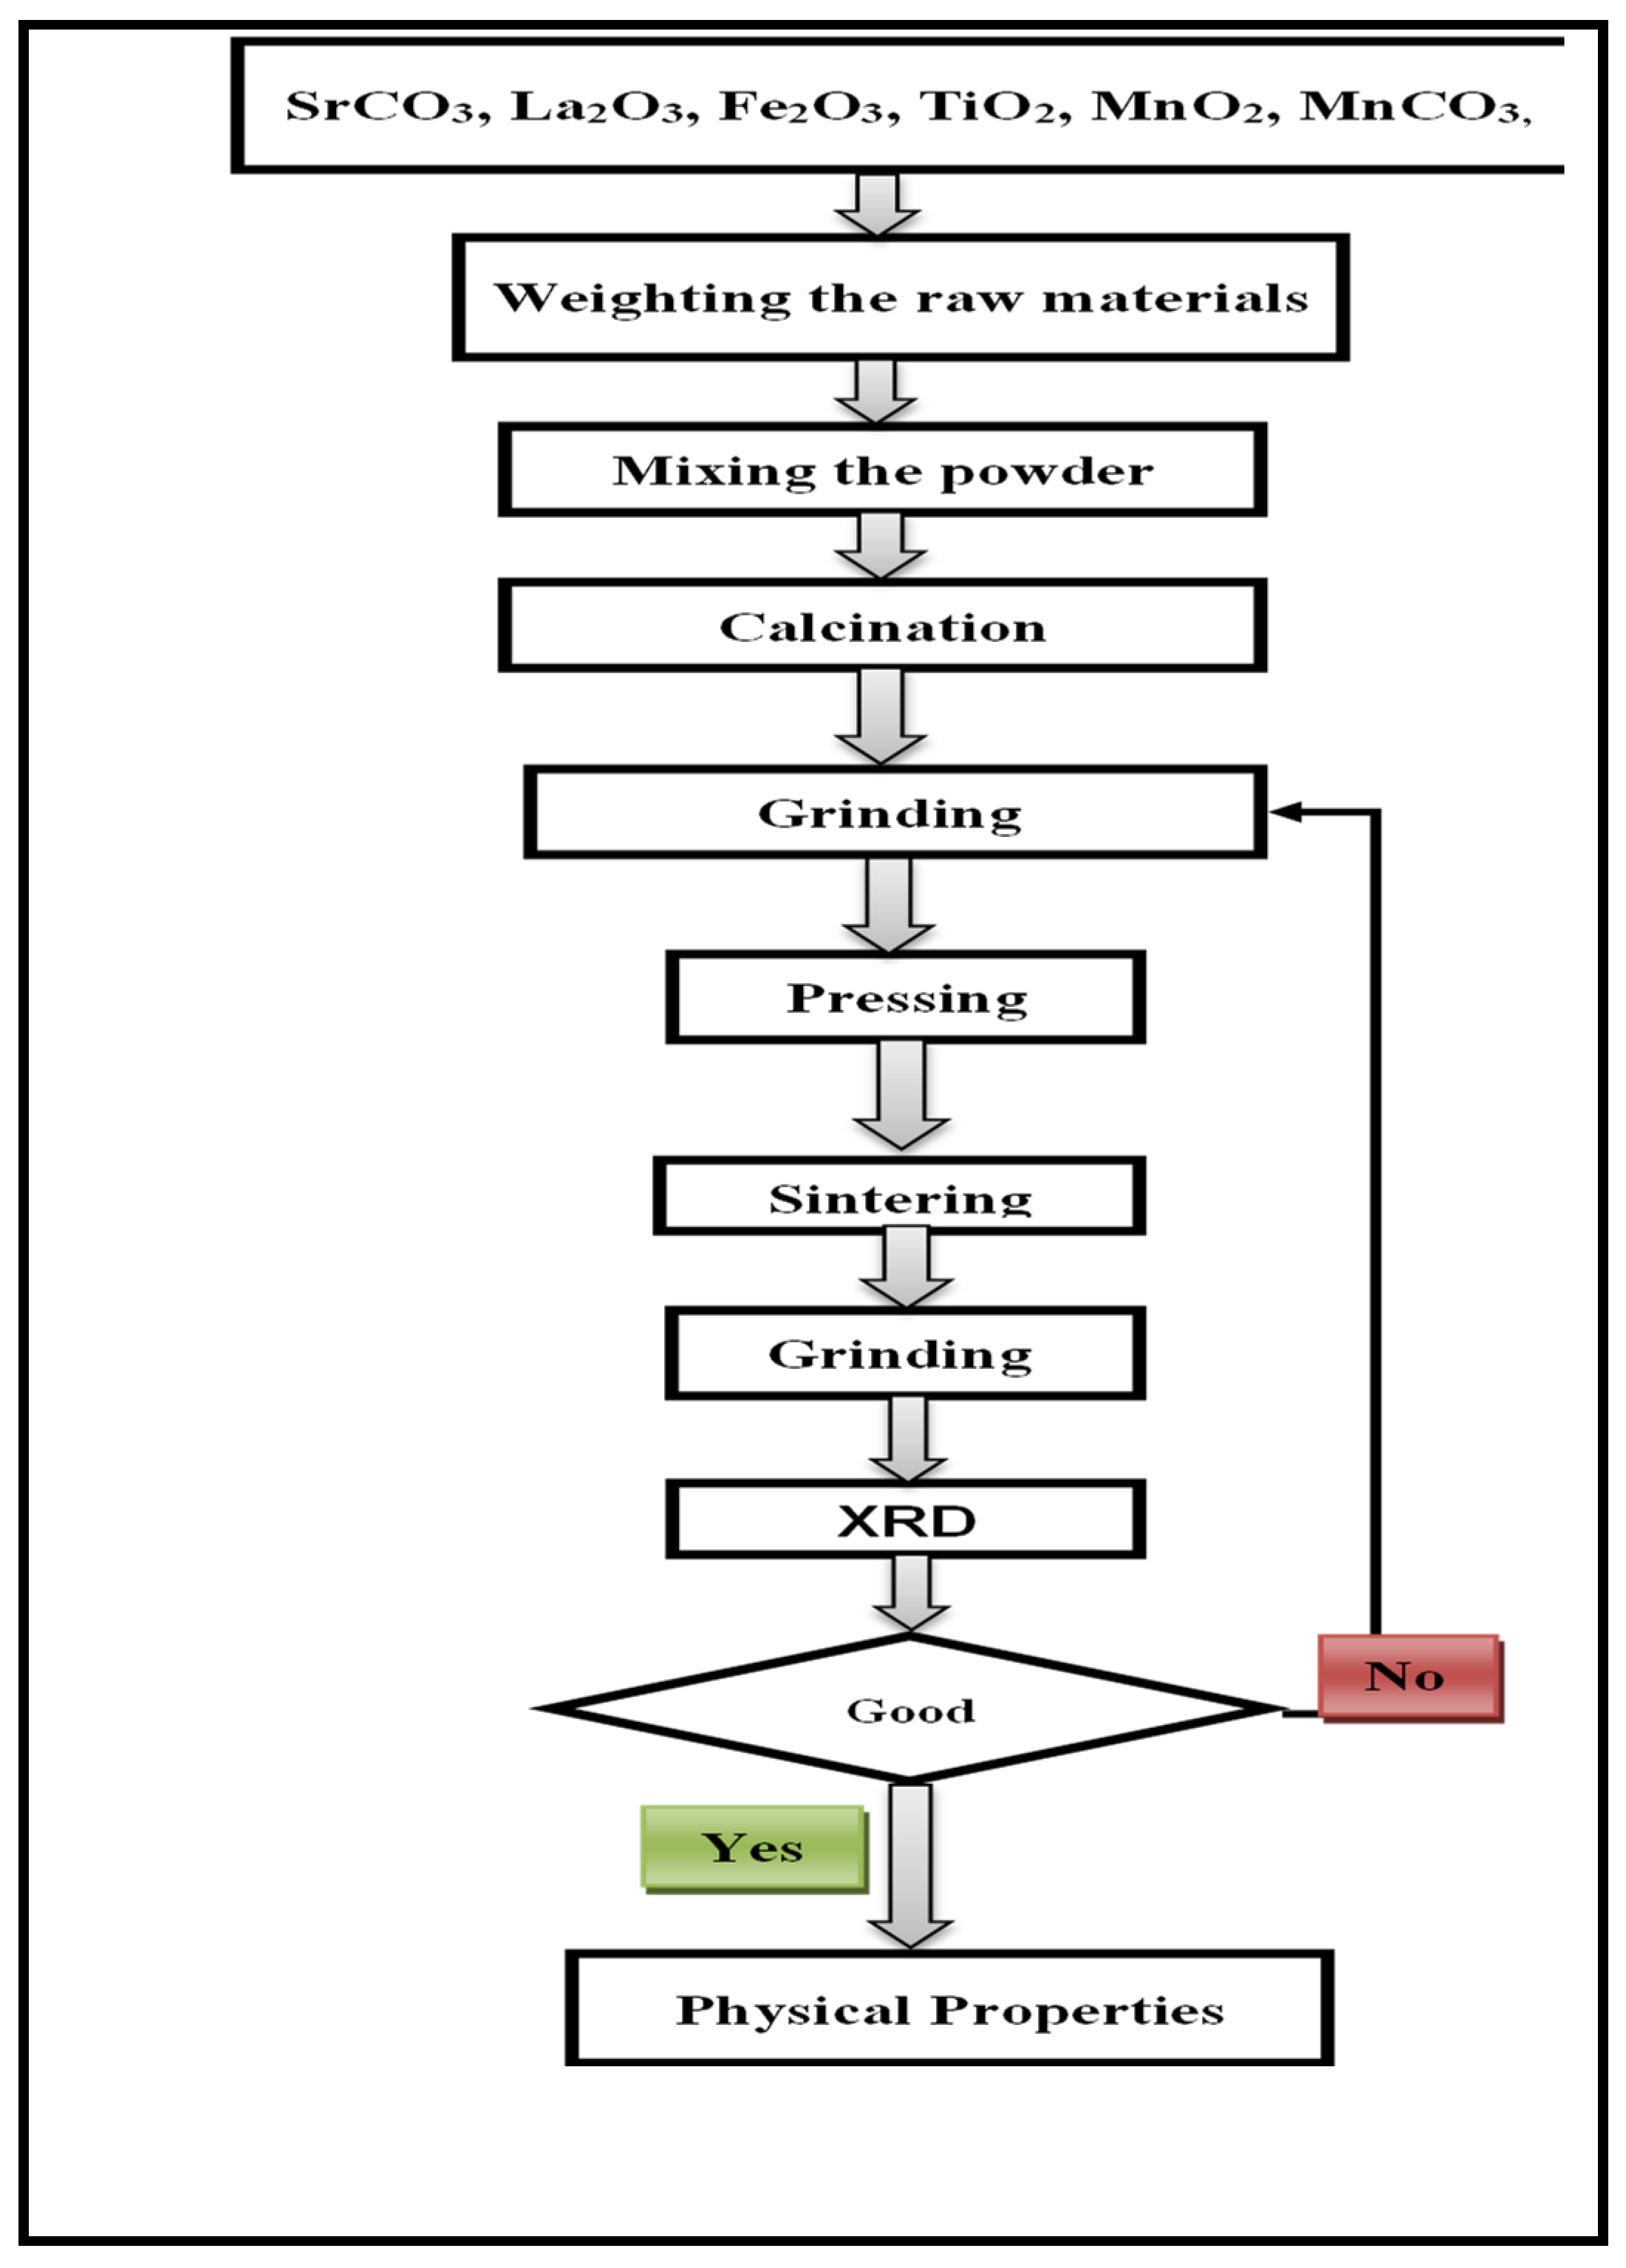
2. Experimental Section

Polycrystalline samples were prepared from stoichiometric amounts of SrCO3, MnCO3, La2O3, MnO2, Fe2O3, and TiO2. All materials were purchased from Alfa Aesar Chemical Company and had a purity of not less than 99.9%. The published and corresponding experimental values of their geometrical densities are shown in Table 1. After obtaining the originator powders, the lanthanum oxide (La2O3) was calcined at 1200 °C for 2 h to avoid the effect of humidity. Then, ferrous and titanium oxides were first mixed carefully and ground manually to 45 min continuously on agate mortar with a little amount of acetone for homogeneity. This was followed by the appropriate amounts of the starting materials being mixed and ground for a few minutes. A small amount of acetone was added after the grinding and left to dry in the air, subsequently heated, and was then put into a high density alumina crucible in the furnace at 900 °C for 12 h to remove carbon dioxide. After cooling to room temperature, the alkaline earth carbonate and the rare earth oxides were added, ground, and then pressed into pellet form at a pressure of 1.9 × 10⁸ N/m2 and heated at 900 °C with a rate of 10 °C/min for 12 h. This calcination step was repeated twice to remove the carbonates from the sample. Finally, the samples were ground again, pressed as earlier, and sintered at 1200 °C for 12 h using a heating rate of 10 °C/min. All samples were cooled to room temperature at the same rate as they were heated. Figure 1 shows the scheme of sample preparation followed in the present work. XRD was carried out using Bruker D8 Focus, Karlsruhe, Germany and Schimadzu 6000 diffractometers, Koyoto, Japan. The data were collected in the angular 2θ range of 20° to 80° with step scan 0.01° and 3 s/step using Cu-kα radiation of wavelength λ = 0.1541 nm. The collected data were fed into the FullProf suite [26] to determine the lattice parameter, space group, and atomic positions.
Accurate dielectric measurements were carried out on the samples of pellet form of about 1.24 cm diameter and 0.2 cm thickness. The two surfaces of each pellet were polished, well coated with a very thin layer of silver paste, and checked for good conduction. The measurements were carefully taken at room temperature as a function of frequency in the range from 20 Hz to 1 MHz using an American Quadtech 1920 bridge, Boston, Massachusetts, USA with 1M LCR bridge [27,28]. The LCR bridge was interfaced to a PC and the data were collected using an in-lab written LabView program, where an easy analyzer program was used to examine the data [29,30].

3. Results and Discussion

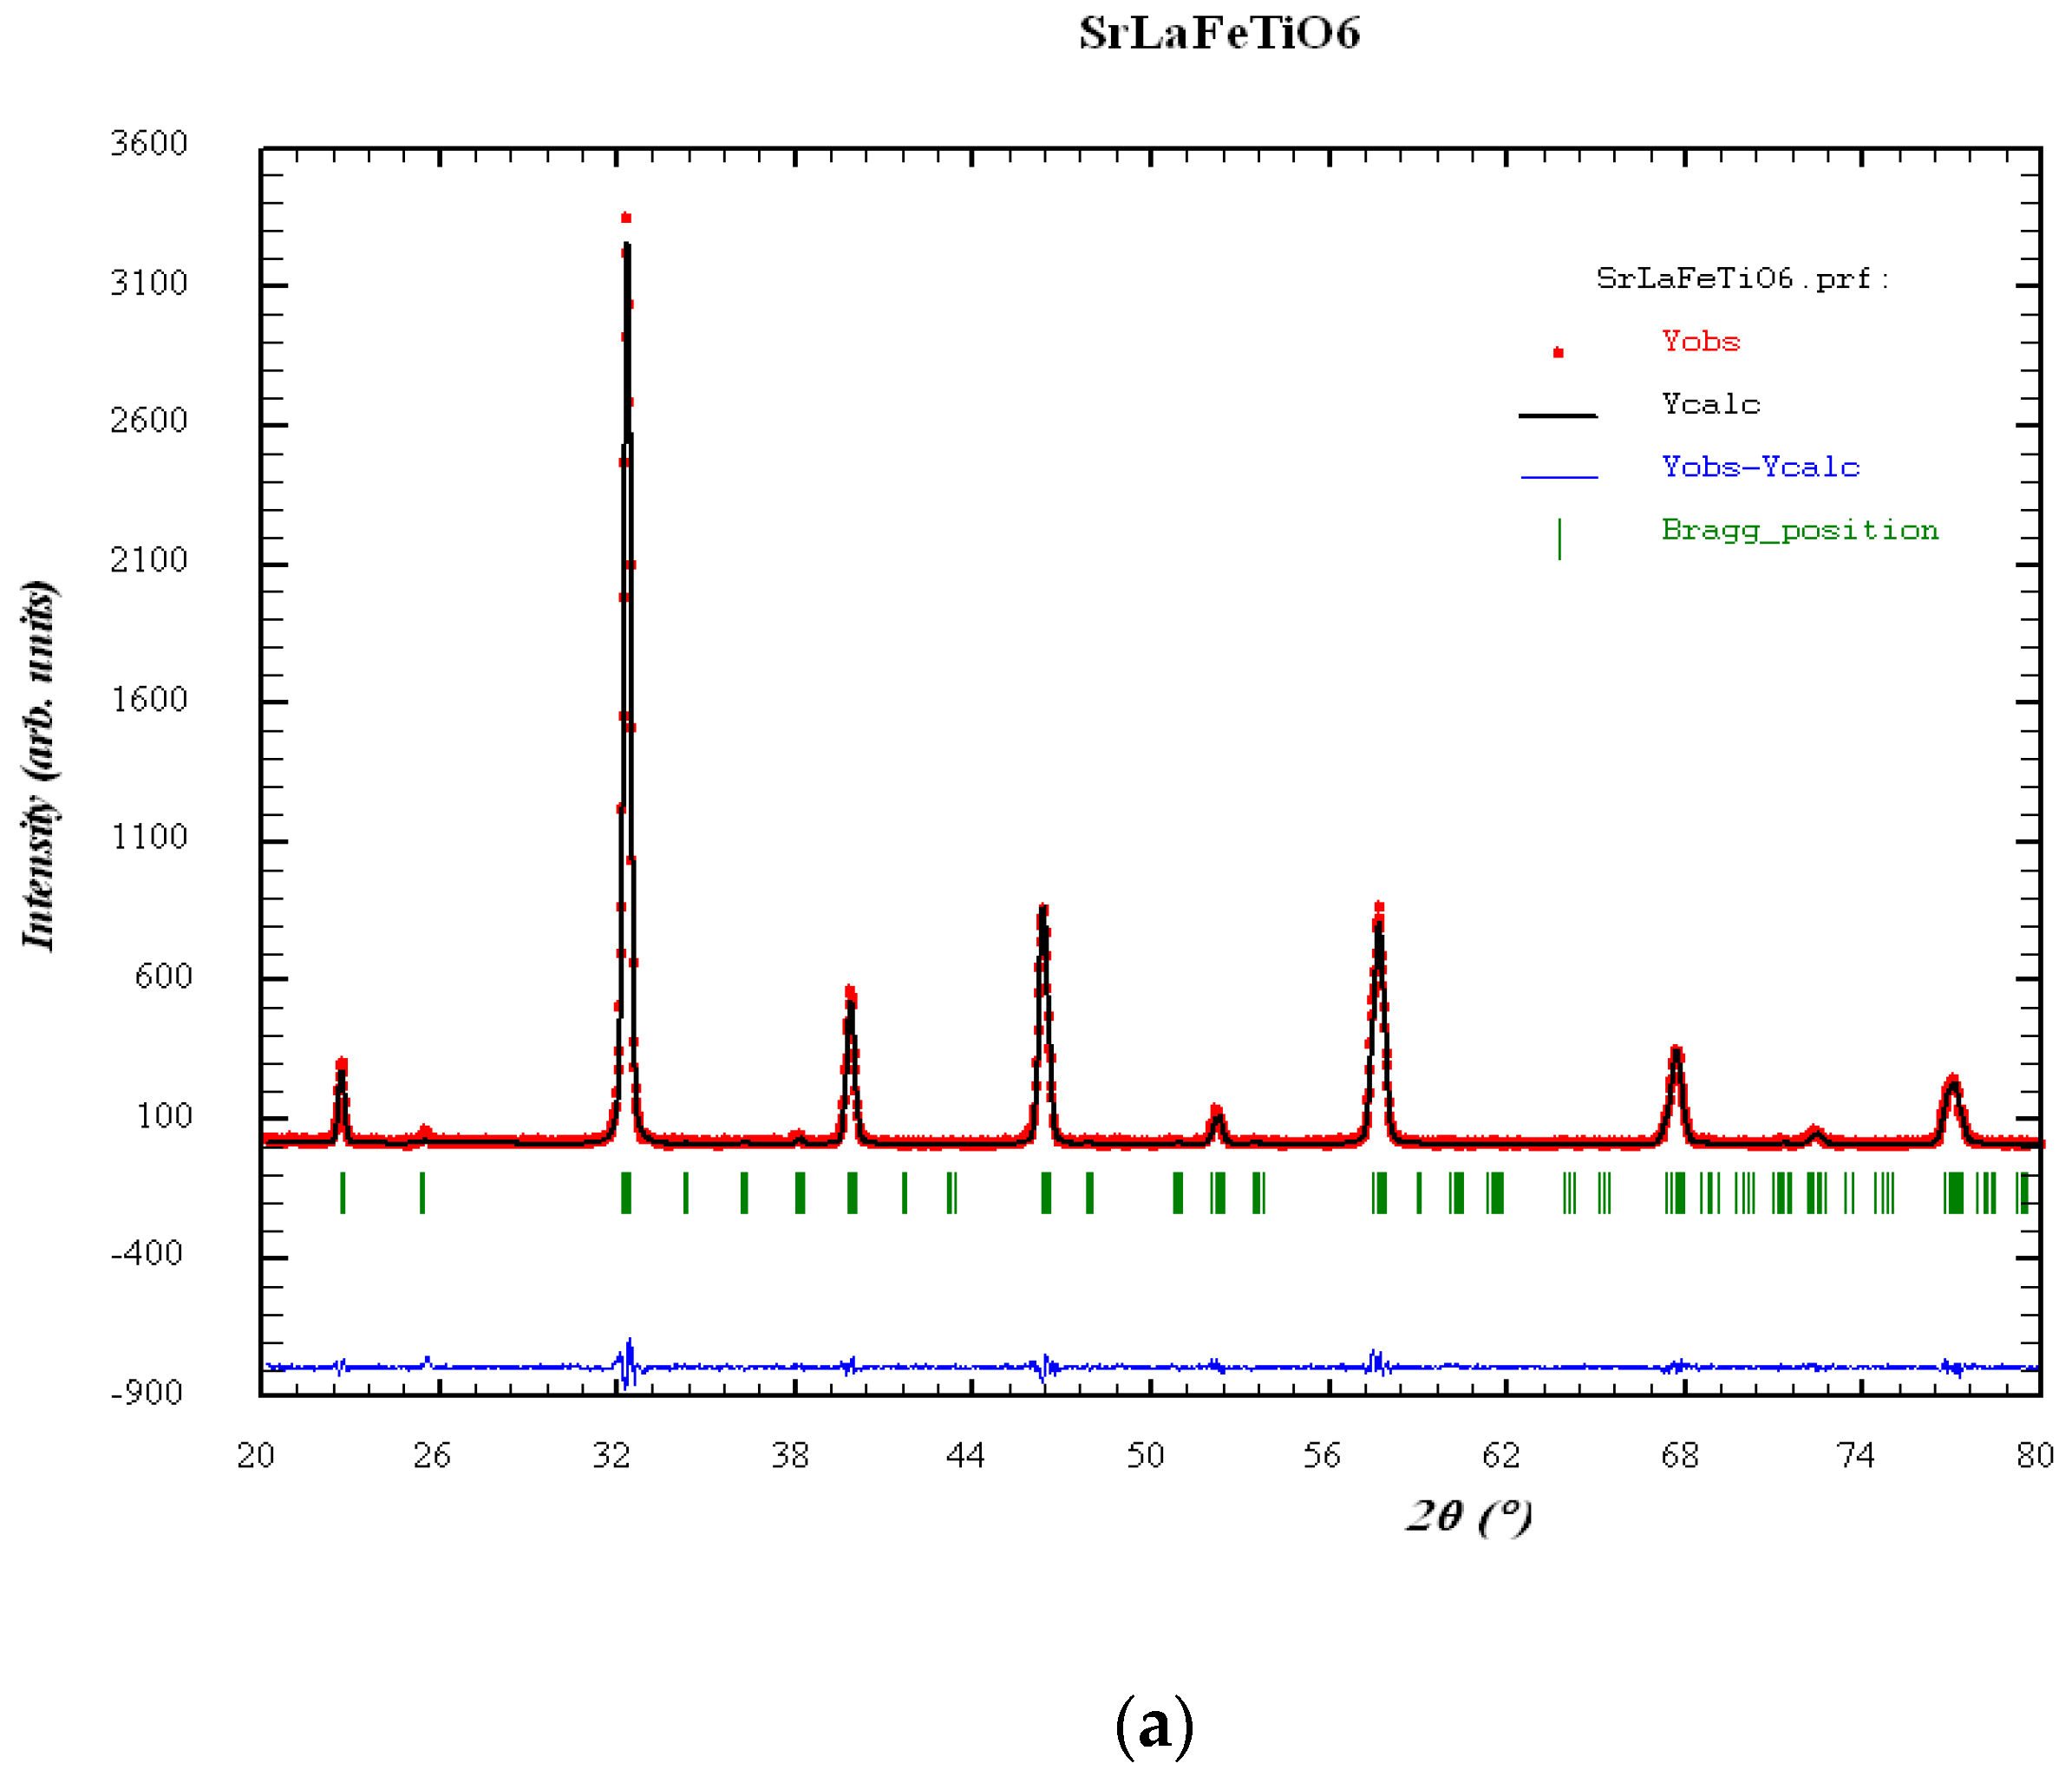
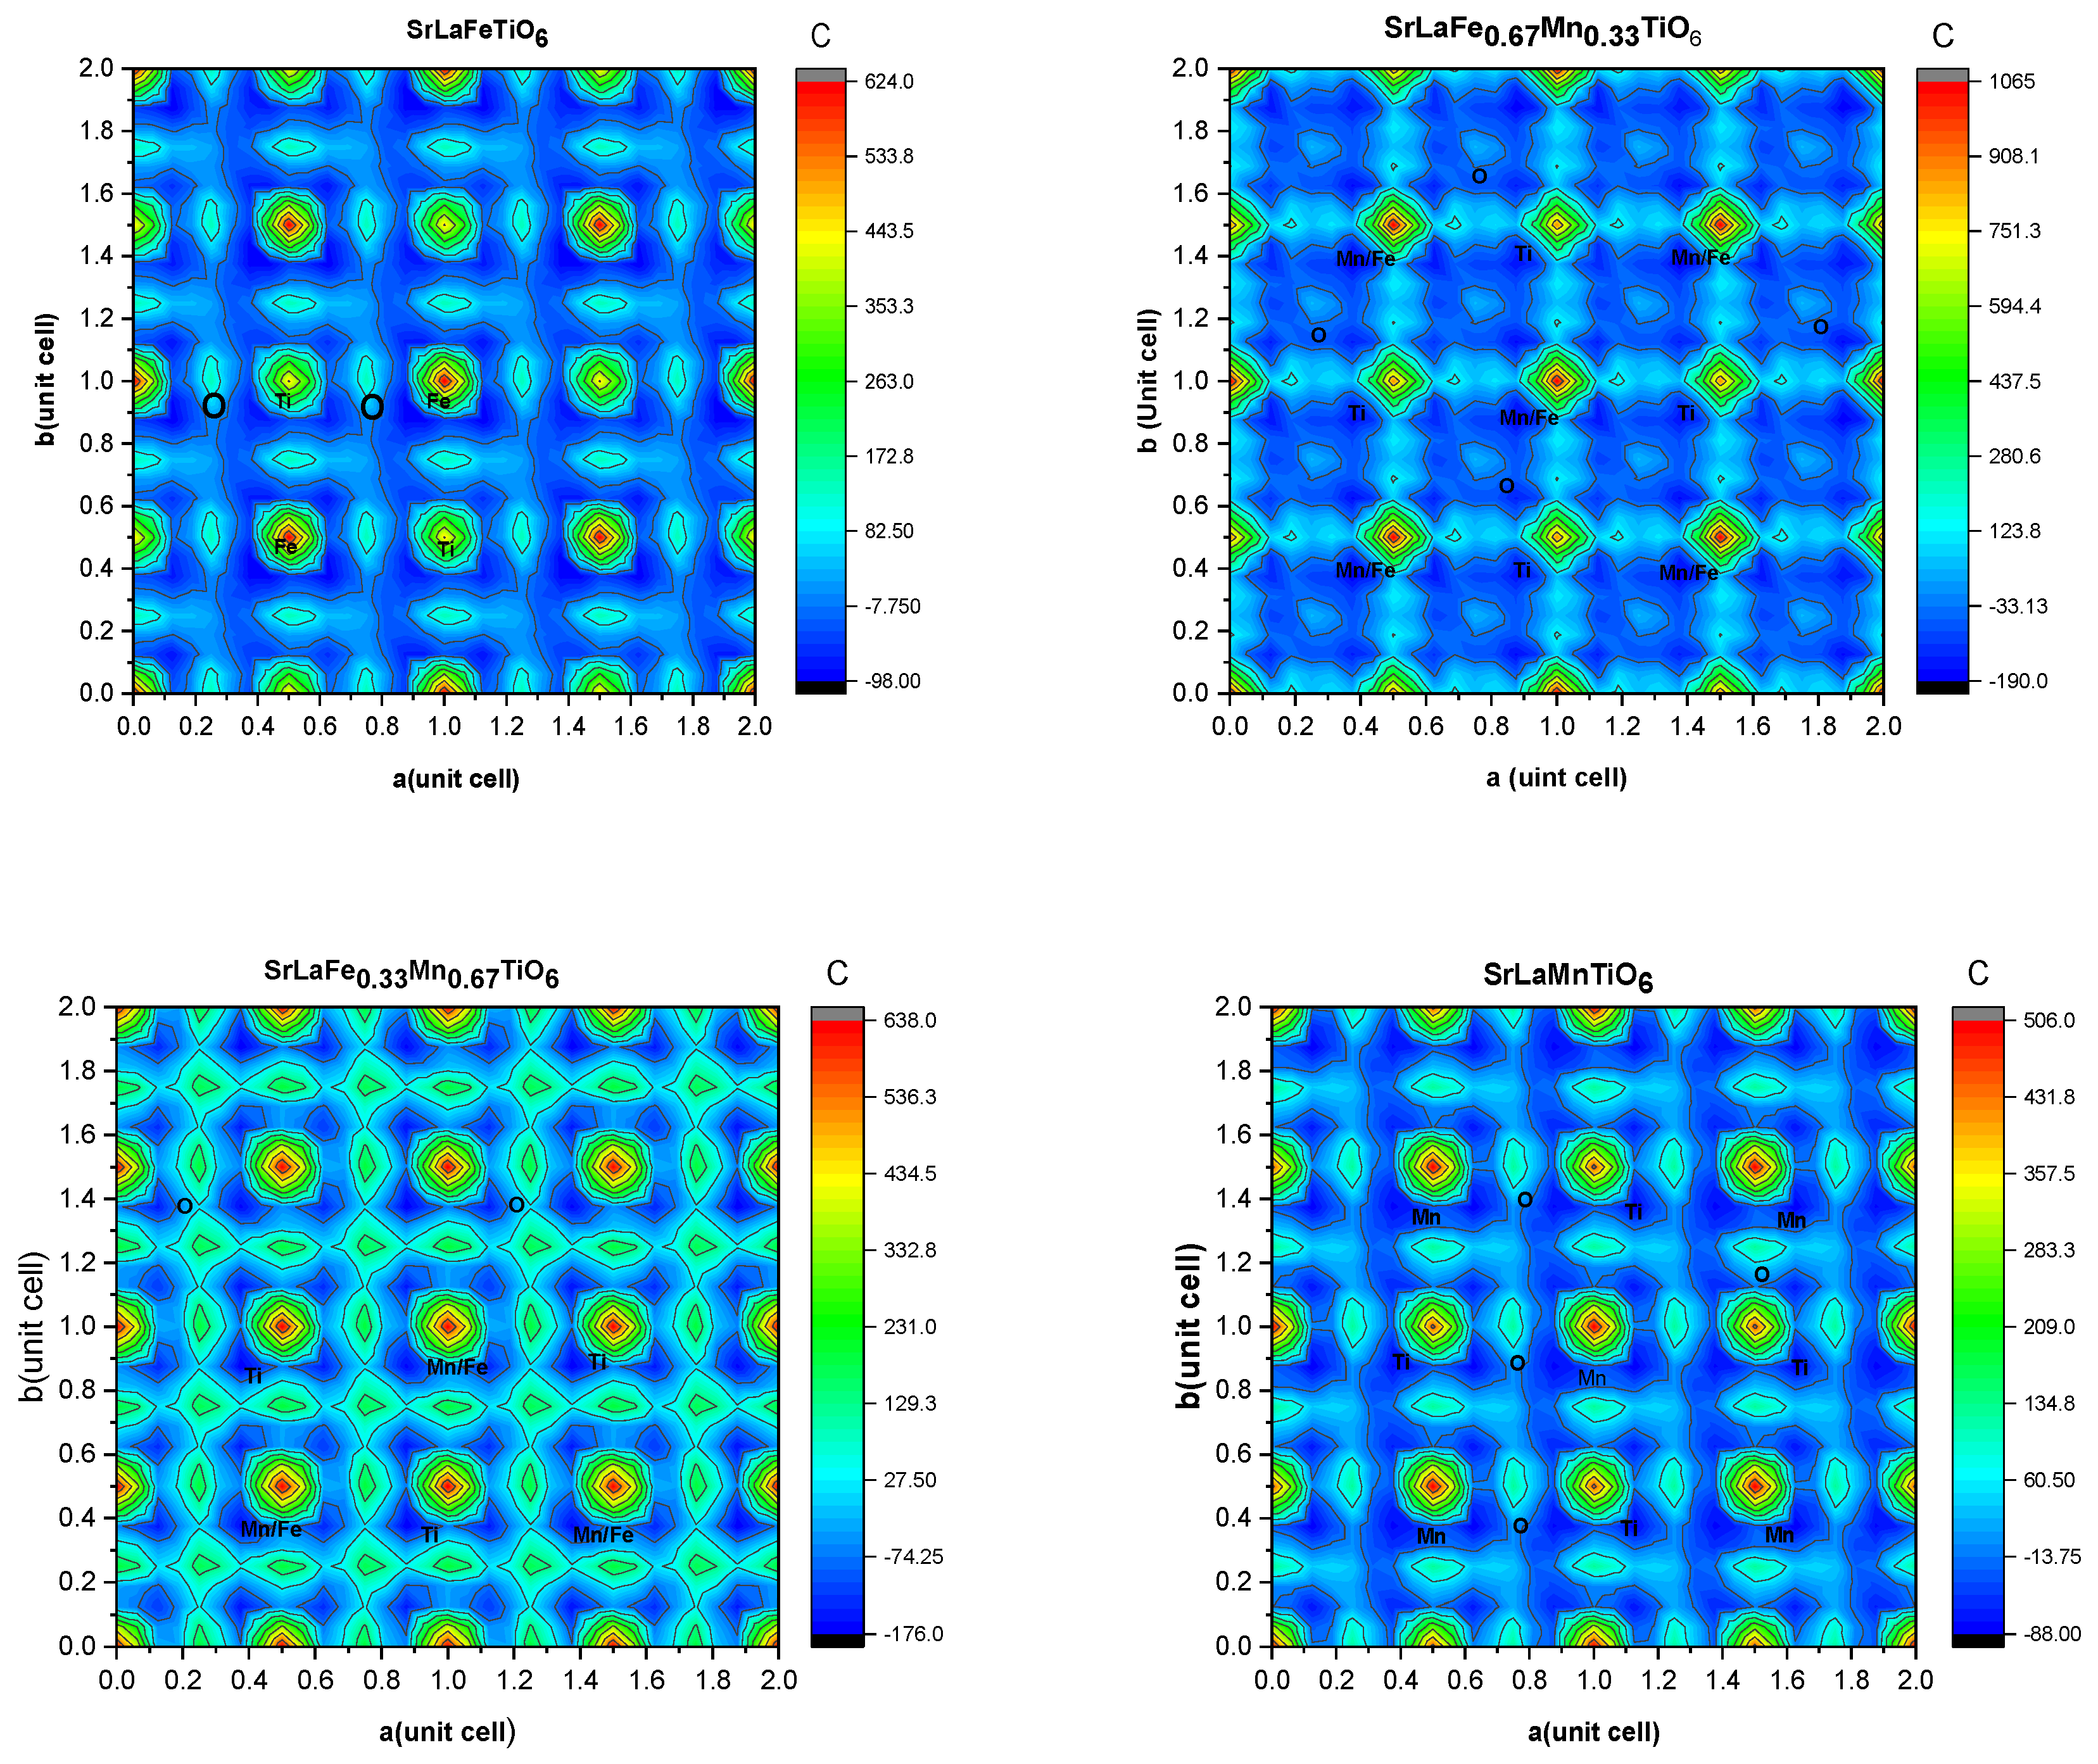
3.1. Structural Characterization and Charge Density Contour Maps

The Rietveld refinement profiles and X-ray diffraction patterns for SrLaFeTiO6 and SrLaMnTiO6, measured at room temperature, are shown in Figure 2a,b. These patterns provide essential insights into the structural properties of the double perovskite oxides [31]. The diffraction data were analyzed using Rietveld refinement within the FullProf suite to identify the best-fitting crystal structure. Two potential structural symmetries of cubic (Fm3m) [32], and orthorhombic (Pnma) [33] were evaluated. The XRD characterization confirmed that all samples were single-phase, indicating high synthesis purity [34]. The indexed peaks and refinement details are summarized in Table 2. Among the models tested, the orthorhombic structure (Pnma) provided the best match, as evidenced by the lowest Bragg reliability factors [35]. The refinement process encompassed three main aspects. First, the Rietveld refinement, a precise method for fitting theoretical patterns to experimental data, was employed [36]. Second, the lattice parameters and atomic positions, essential for describing the geometry and symmetry of the crystal structures, were determined [37]. Third, Bragg’s reliability factors quantified the fit quality, with lower values indicating better agreement [38]. The orthorhombic (Pnma) symmetry emerged as the most suitable structural model for all SrLaFeTiO6 and SrLaMnTiO6 samples, whereas samples with Mn doping at the Fe site exhibit cubic (Fm3m) symmetry, as shown in Figure 2b.
In XRD data, the measured intensities of the diffracted beams were related to the square of the structure factor amplitudes F h 2 , as follows:
I h F h 2
where the structure Factor F h is defined as follows:
F h = j f j exp 2 π i h x j + k y j + l z j
with f j is the scattering factor of j-th atom located at fractional coordinates x j , y j , z j . To reconstruct the electron density ρ(r) from the diffraction data, a Fourier synthesis was performed, yielding the following:
ρ r = 1 V h F h exp 2 π i h r
where V is the unit cell volume.
In this study, the refined XRD data were further analyzed using the Fourier module of the FullProf (version 2.05) suite to compute charge density maps, enabling the visualization of the electronic distribution within the materials.
As shown in Figure 3, the charge density maps illustrate the impact of Mn doping on the Fe-site, in the un-doped sample of SrLaFeTiO6 (Figure 3) where ionic conduction dominates and no significant bonding is observed between the Fe and Ti ions. In contrast, the Mn doping samples of SrLaFe0.67Mn0.33TiO6 and SrLaFe0.33Mn0.67TiO6 induce covalent bonding, reflecting altered electron distribution and improved electronic interactions. In Figure 3 of (SrLaMnTiO6), a mixed ionic–electronic conduction state is observed with partial covalent bonding apparent. These results highlight how Mn substitution enhances electronic conduction by increasing the covalent character in the bonds [39].

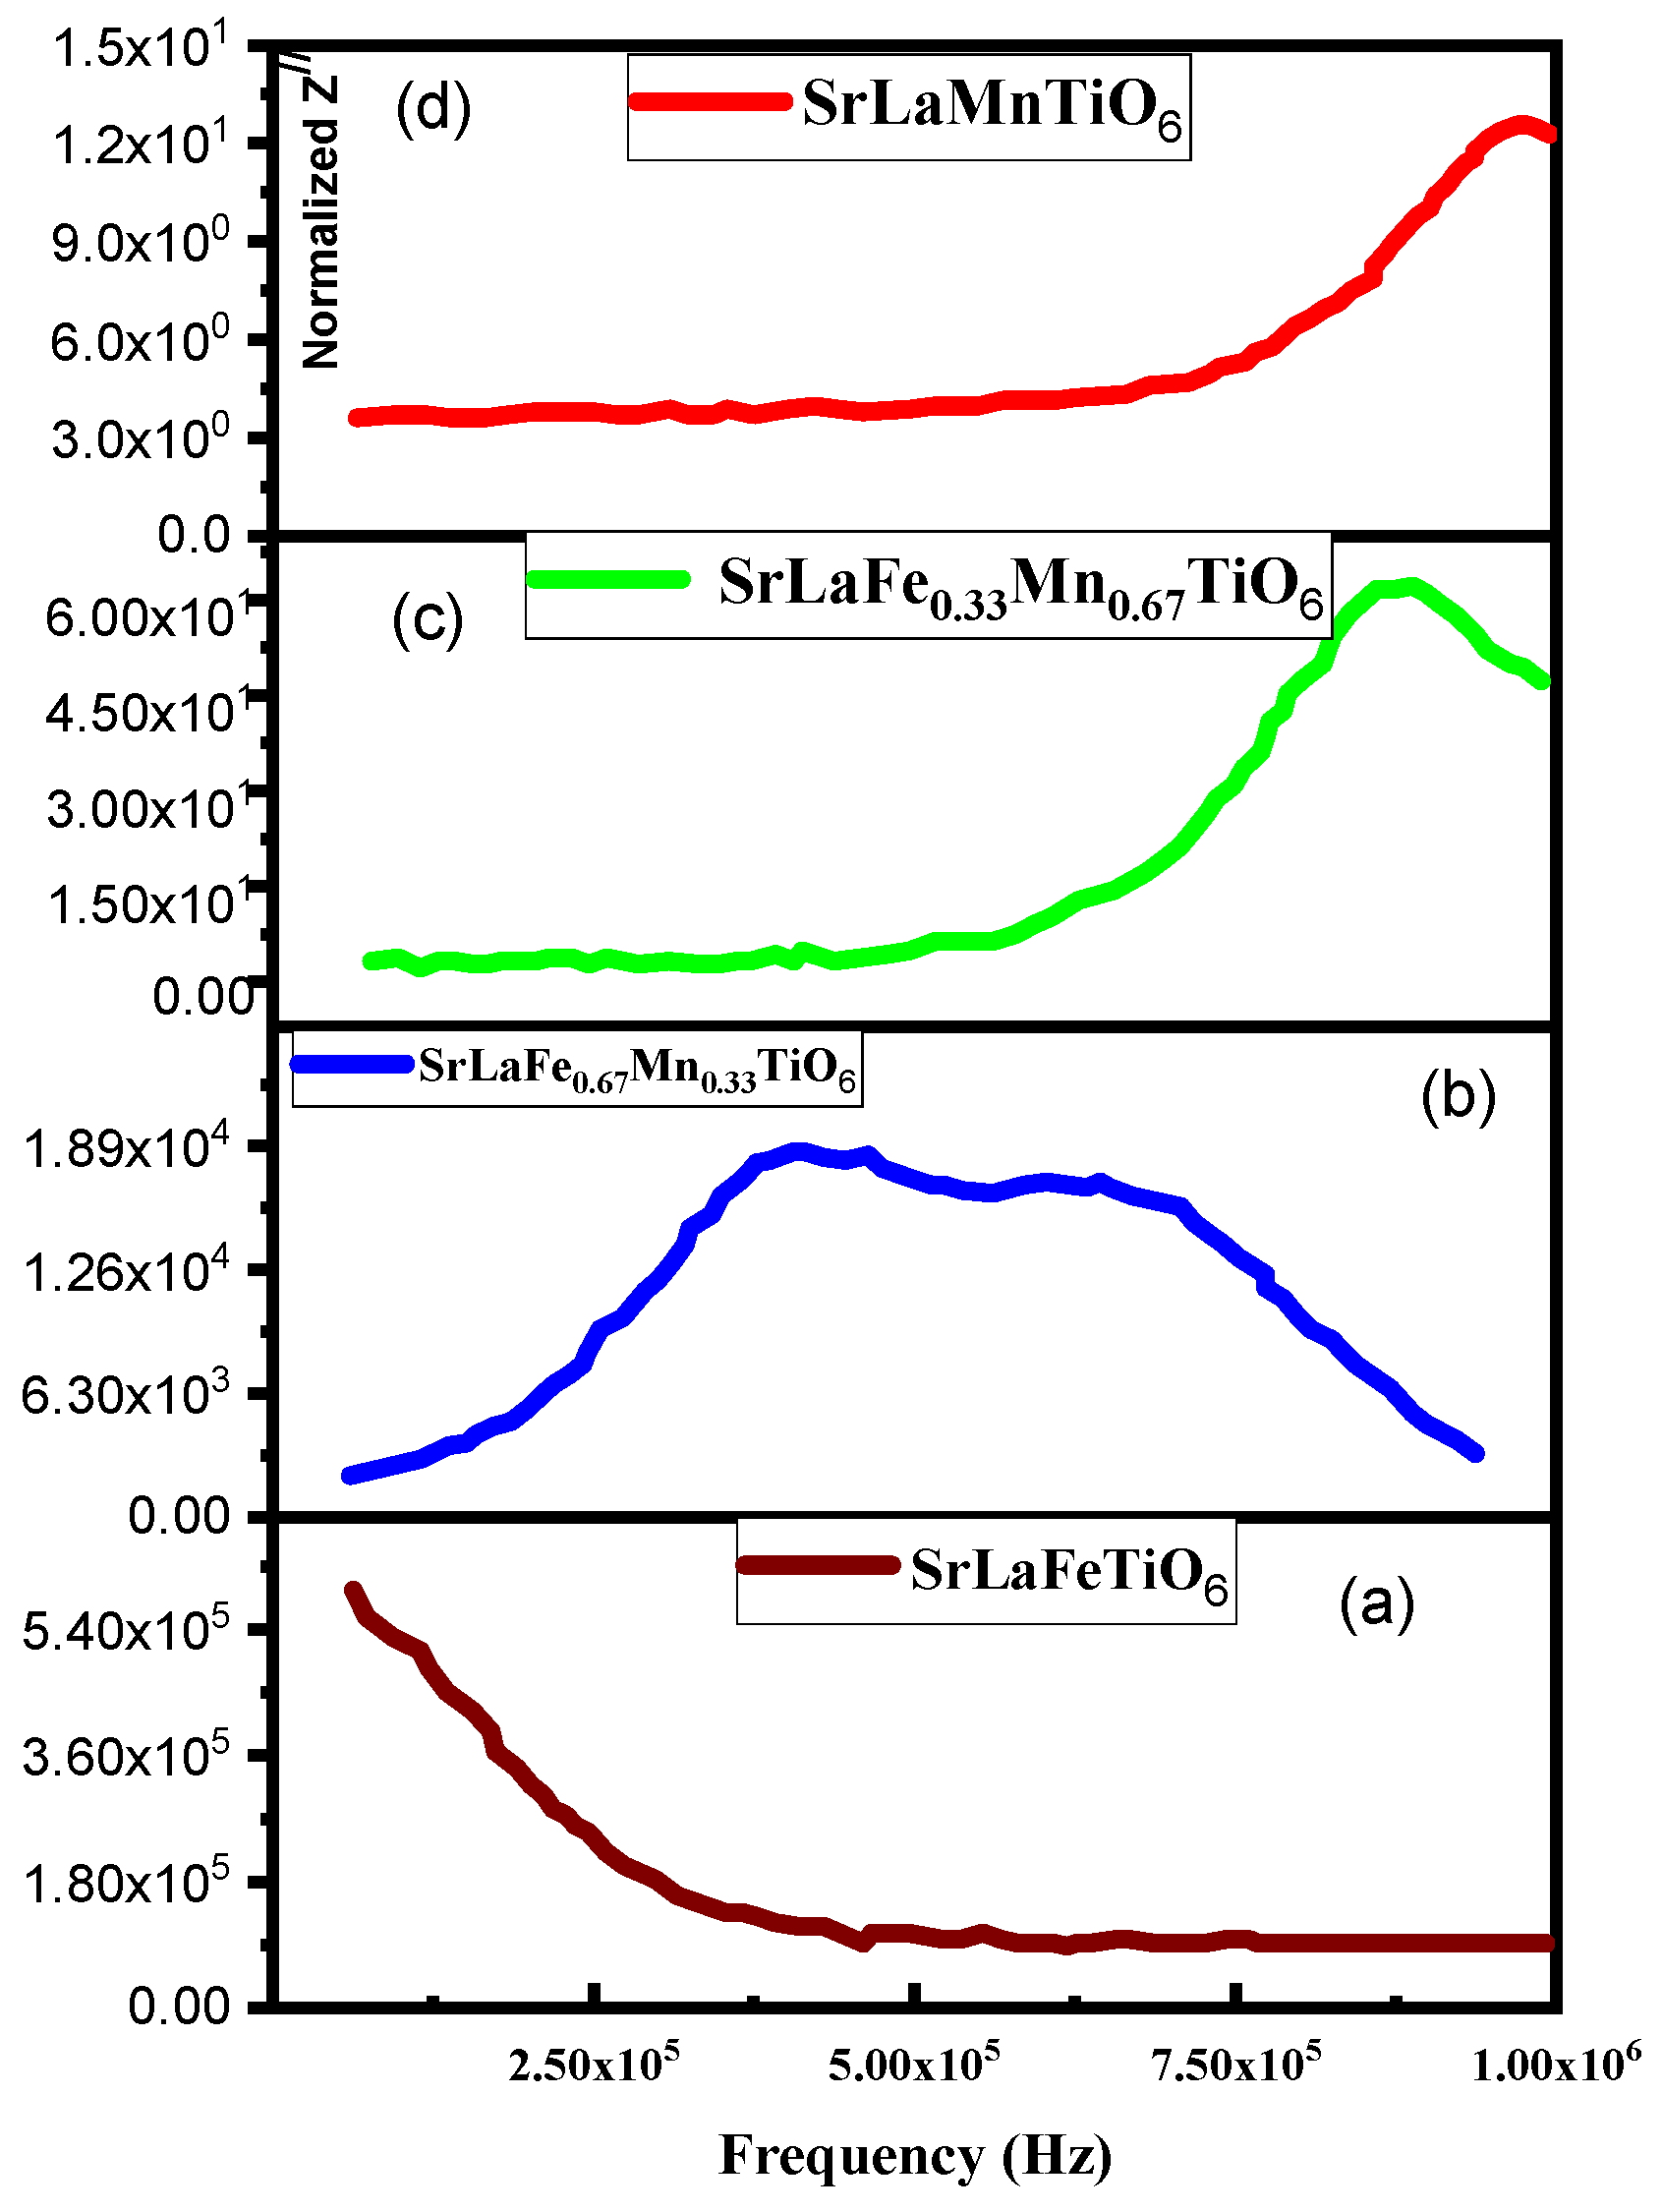
3.2. Frequency Response of Dielectric Impedance

Careful inspection of the impedance response to frequency in the form of Bode plots plays a major role in suggesting the equivalent circuit model that fits the data and in deriving the relaxation processes and other physical properties such as MIEC [40]. The results of the real ( Z \ ) and imaginary ( Z \ \ ) components of the impedance spectra measured in the frequency range from 20 Hz to 1 MHz were first examined using the Bode plots. Real and imaginary dielectric impedance for SrLaFeTiO6, SrLaFe0.67Mn0.33TiO6, SrLaFe0.33Mn0.67TiO6, and SrLaMnTiO6 as a function of frequency for the present samples are shown in Figure 4 and Figure 5. In Figure 4a of SrLaFeTiO6, a steep decrease in the impedance values is observed with an increasing frequency up to 1 kHz. Also, the changes in the slope are observed at frequencies greater than 100 kHz. The impedance values became constant as the frequency increased. This behavior may be explained by the increase in the conductivity with frequency and the liberation of space charge as a result of a reduction in its barrier height. This result is consistent with that reported by A. Tripathy et al. in the double perovskites containing Fe ions [41].
When Mn is included in the Fe-site, the values of the impedance of SrLaFe0.67Mn0.33TiO6 Figure 4b) appear to vary slowly below 300 KHz and then start to decrease as the applied frequency is increased. In SrLaFe0.33Mn0.67TiO6 (Figure 4c) and SrLaMnTiO6 (Figure 4d), it was found to be almost frequency-independent up to about 80 kHz and then decreased as the frequency increased to 1 MHz; the reason for this behavior is mainly due to dipolar polarization. The accumulation of charges on the grain boundaries increased and caused an increase in the interfacial polarization with an increase in the amount of Mn fraction. This phenomenon was dominant at lower frequencies. The imaginary part of the impedance ( Z \ \ ) of SrLaFeTiO6 (Figure 5a) was found to decrease as the applied frequency increased. The decreasing in the impedance ( Z \ \ ) values at a low frequency can be attributed to the hopping between ions and activations of mobile charges, and at high frequencies, the AC conductivity was dominant due to the hopping between equilibrium sites and active motion of electrons; this result was also reported by Ganapathi Rao Gajulaa et al. in the Li0.5Fe2.5O4-doped BaTiO3 composite ceramics [42]. For SrLaFe0.67Mn0.33TiO6 (Figure 5b), two peaks ( Z \ max) were observed at about 3.35 kHz and 6.50 kHz in the plot, indicating the occurrence of at least two relaxation times in the conduction process [43]. On the other hand, the two samples SrLaFe0.33Mn0.67TiO6 and SrLaMnTiO6 showed peaks at around 850 kHz and 1 MHz, as shown in Figure 5c,d, respectively. This result confirms that these compositions belong to the classical ferroelectric type. Figure 5b–d) shows that the ferroelectric relaxor characteristic of a high-frequency dispersion in the value of the imaginary parts of impedance as a function of frequency was accentuated as the concentration of Mn+ ions increased from (x = 0.33 to 1). It is important to note that the values of the frequency corresponding to the maximum were found to increase with the content of Mn+ Ions in the samples [42].

3.3. Equivalent Circuits and Modeling of Impedance Data

Simulations of the typical behavior of the Bode plots for the dielectric materials with a single relaxation time for an RC circuit are shown in Figure 4 and Figure 5. These plots were generated assuming as follows:
Z / α 1 1 + f 2 -
and   Z / / α f 1 + f 2 -
where f is the frequency.
This circuit was simulated over a frequency range from 10−3 to 106 Hz. Only the range from 10−2 to 103 Hz was shown to match the range of the frequency span of the measurement, i.e., over five orders of magnitude. Below 10−1 Hz, the response of the materials was found to be almost frequency-independent; the contribution of the polarization resistance (RP) can be assessed where it varies as 1 1 + f 2 . As the frequency increases up to a few kHz, it decreases as f 1 + f 2 and then becomes frequency-independent, at which point the resistance of the solid electrolyte (RS) can be evaluated. Furthermore, from the imaginary part of the impedance, the relaxation frequency can be determined. Figure 5 shows the resistive and capacitive contributions to the dielectric impedance. The capacitive contribution results in a higher electrical resistance, while the resistive contribution results in a lower resistance [44].
Figure 6 show the Cole–Cole diagrams that were developed to study the conduction processes occurring in dielectric materials and the data were fitted to appropriate equivalent circuits based on their analysis of the dielectric impedance response to frequency. Cole–Cole diagrams were used to study the contributions of electrode, grain, and grain boundary effects to the dielectric impedance of the materials. Ideally, these three contributions give rise to three arcs with three maxima corresponding to the relaxation frequency of an element of an equivalent circuit. These three arcs are typically modeled by a series combination of three sub-circuits, each consisting of a resistor connected in parallel with a capacitor (or constant phase element (CPE)). The location of each arc is determined by frequency, with the grain boundary arc generally being in a lower frequency range than the grain effect. Therefore, the grain boundary relaxation time (τ) is greater than the grain effect relaxation time (τg). The plots may appear as only part of an arc or as a single semicircle. The first situation indicates that the grain boundary resistivity (Rgb) may be significantly higher than the grain resistivity (Rg), with the corresponding frequency falling outside of the measurement range. Another case is that of typical insulation materials where both Rg and Rgb are high. The semicircle shape may exist when the Rg value is small, and the total resistance is dominated by Rgb which would be within the frequency range of the measurements [45].
Looking again at the Bode plots shown in Figure 4 and Figure 5, and in combination with the expected response discussed previously, Different characteristics of these samples were observed with regard to frequency. SrLaFeTiO6 exhibits typical capacitive behaviour compared to Figure 4a, but the resistive contribution is found to be small and cannot be easily excluded. The effect of Mn doping was found to change the main contribution to the dielectric impedance from a capacitive as observed in SrLaFeTiO6 to a resistive as in SrLaMnTiO6. The enhancement of the resistive contribution is expected to lead to the presence of mixed ionic and electronic conduction. To investigate MIEC, the data must be modeled taking into account the capacitive and resistive competition in the values of the Bode that were plotted in Figure 4 and Figure 5, respectively. The modeling of the MIEC state has been discussed by many authors [46,47]. F. S. Baumann et al. studied the dielectric impedance of the well-defined (La,Sr) (Co,Fe)O3 model electrode [25]. In contrast, the equivalent circuit model based on the generalized equivalent circuit model for mixed conductors was studied by J. Jamnik and J. Maier [48]. The response of the real and imaginary parts of the impedance in the frequency range from 0.1 Hz to 1 MHz at 700 °C for (La,Sr)(Co,Fe)O3- was qualitatively similar to that of the SrLaFe0.67Mn0.33TiO6 sample, but the Cole–Cole plots were found to be different. This difference may be related to the wide frequency range used by Baumann et al. [25]. Therefore, to model the impedance data of the present samples presented in the form of Cole–Cole plots, the equivalent circuit model of Baumann et al. for MIEC materials was considered with slight modifications [46].

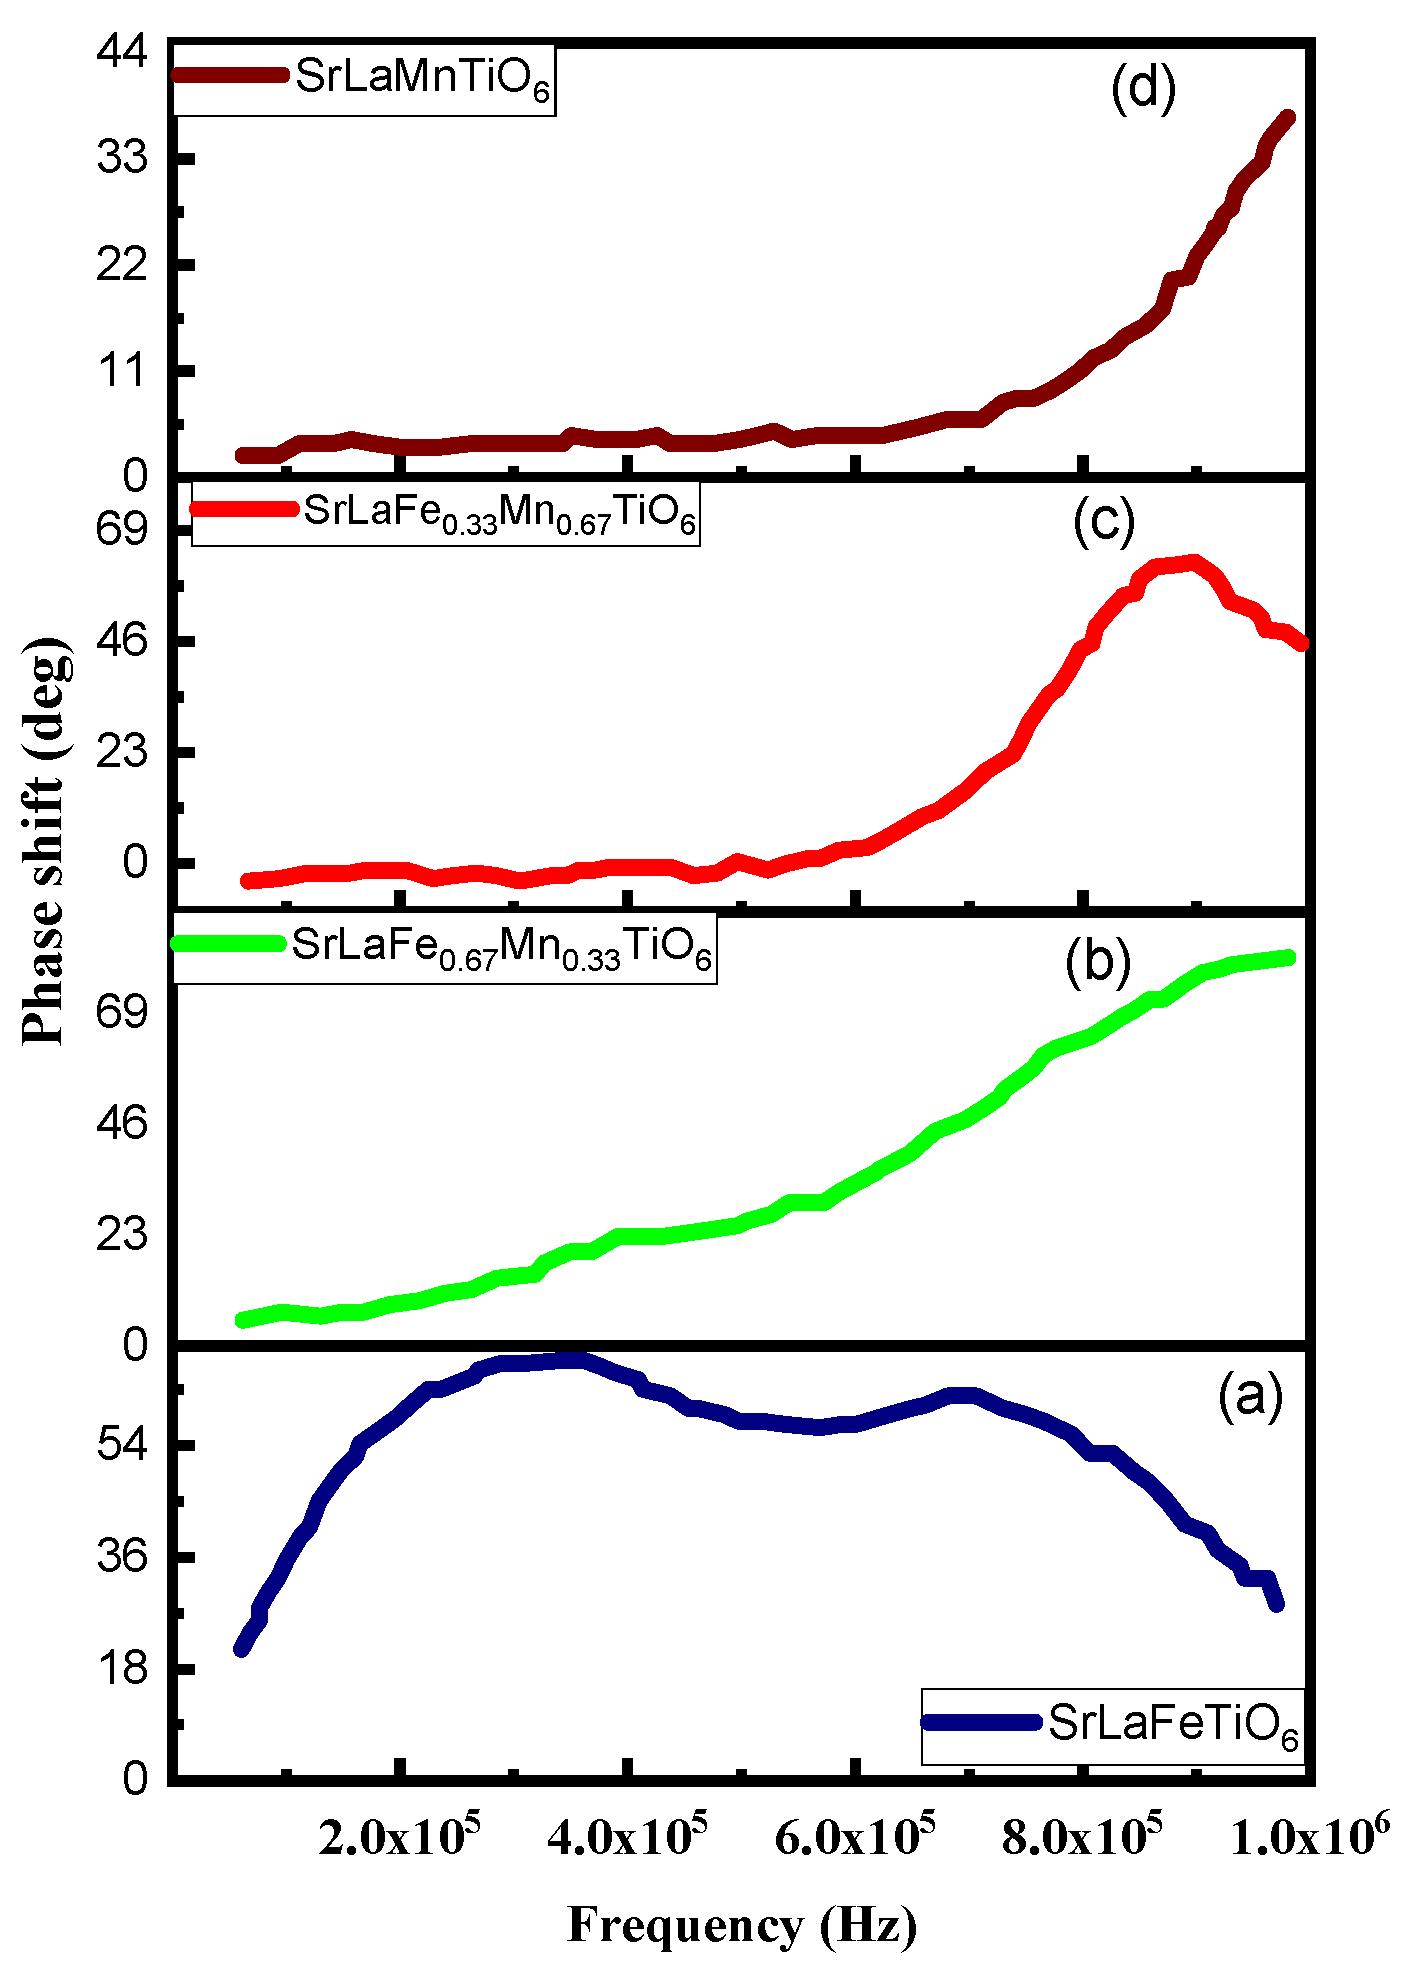
3.4. Complex Cole–Cole Representation and Phase Shift

The plot of Z \ versus Z \ \ for SrLaFeTiO6 and the corresponding phase shift defined as θ = a r c t a n Z / / Z / are shown in Figure 6A and Figure 7a, respectively. The Cole–Cole plot does not resemble a semicircle, but rather a portion of it with high values of Z \ and Z \ \ . Qualitatively, this means that the present sample did not exhibit a semicircle, maybe because both the grain and the grain boundary resistances are high and the relaxation time lies outside the low-frequency limit. Quantitatively, the data were modeled using the equivalent circuit given in Figure 8a. This equivalent circuit was considered to deal with the effect of the electrode, grain boundary, and grain size. The inclusion of the Warburg (WS) element was assumed to treat the diffusion in the transport process which is commonly observed in MIEC [49,50]. The criterion for the best equivalent circuit is that it must simultaneously fit the data of Z \ against frequency, the data of Z \ \ against frequency, the Cole–Cole plot, and the phase shift θ against frequency. This may be due to some proposed equivalent circuits, for example, fitting the Cole–Cole plot but failing to fit the phase shift. This criterion was detected and fulfilled continually in all the equivalent circuits proposed of the samples. The lines in Figure 6 represent the best fitting using the equivalent circuit shown in Figure 8a and the fitting parameters are given in Table 3.
The values of the grain and the grain boundary resistances were found to be very high and the corresponding relaxation time ( τ = R C ) can be deduced if C is obtained [49]. The value of C is related to the impedance of the constant phase element (CPE), which is given by the following:
Z = 1 1 + p i ω n
where p is a constant. The CPE element will represent a capacitor when the exponent n = 1 and p will equal C, the capacitance of the capacitor. In the case when the value of n is less than 1, the capacitance can be given by the following:
C = p R 1 n R
where R is the resistance connected in parallel with the concerned CPE element. The values of the C were calculated using Equation (7) and the relaxation times are given in Table 3. The calculated values of τ b and τ g b were found to be 19.17 × 10⁻⁶ s and 7.82 × 10⁻³ s, respectively. The value of τ g b falls in the range of the relaxation time of the dipolar polarization mechanism while the value of τ b falls in the range of the hopping polarization mechanism [49]. Furthermore, the values of n of the CPE1 and CPE2 are large and were found to be 0.95 and 0.92, respectively. This implies that the conduction is affected by the capacitive behavior of the grain boundary as inferred from the Bode plot of this sample. It is not simply that one can say that the sample is a purely ionic conductor with a capacitive nature. This is because the phase shift angle ( θ ) is not constant at θ = 90° [51]. The angle θ values were found to vary and showed two peaks at frequencies of 458.9 Hz and 36.5 kHz, corresponding to θ = 74.3°and θ = 69.2°, respectively. In general, the values of θ in this sample are considered large, which are greater than 40°. This, by its role, indicates that the value of RS and RP are widely separated and are reflected in the values of the resistances that are obtained from the equivalent circuit as shown in Table 3. Moreover, to have a Debye relaxation, the peak in θ f should not equal that of the complex impedance [52]. This may be confirmed in the present sample as there is no peak appeared in the Z \ \ f plot to match that of θ f plot for the same sample. The phase shift angle was related to the energy dissipated as heat in the dielectric materials. It can be observed from Figure 7a that as expected, the heat loss increases with frequency, and the two peaks that were observed signified the presence of more than a relaxation time. According to the model of Rezlescu [53], a peak appears when the frequency of the hopping of the charge carriers between two valence states of the same element matches with the frequency of the applied field. In SrLaFeTiO6, the valence states of Fe and Ti may exist as Fe3+/Fe2+ and as Ti3+/Ti4+, respectively. Thus, the peaks may be related to hopping between F e 2 + F e 3 + and T i 3 + T i 4 + ion pairs providing that there is an oxygen deficiency in the samples. Andrzej lasia reported a similar behavior in his original study of the constant phase element CPE [52].
As mentioned above, the inclusion of the Mn ions may alter the conduction mechanism, which should be reflected in the relaxation time of the conduction mechanism. The Cole–Cole plot of SrLaFe0.67Mn0.33TiO6 shows two arcs, as well as the phase shift angle shown in Figure 6B and Figure 7b, respectively. The complex shapes of the curves of the Cole–Cole plot and that appear as a function of frequency indicate that there were two different relaxation processes for bulk and grain boundary separation. The higher frequency arc usually corresponds to the grain effects. This data was fitted to the model shown in Figure 8a. The values of the fitting parameters are given in Table 3. Compared to the parameters for SrLaFeTiO6−δ, the grain boundary resistivity was found to decrease by a factor of two orders of magnitude while the grain resistivity was found to increase slightly. Furthermore, the relaxation time for both the grain and the grain size effects was found to decrease as they move from the hopping polarization regime to the dipolar polarization regime.
The values of θ , see Figure 5b, were found to vary from small values up to around 84°, i.e., the heat loss in SrLaFe0.67Mn0.33TiO6 was increasing with the frequency in a manner different from that of SrLaFeTiO6−δ. The peaks observed in θ f of SrLaFeTiO6−δ were found to smear out. Thus, the Debye relaxation is weakened in the frequency range of 20 Hz–1 MHz in the present measurements.
For the SrLaFe0.33Mn0.67TiO6, the situations of Z \ - Z \ \ and θ f plots, as seen in Figure 6C and Figure 7c, were found to be different. Low values for Z \ and Z \ \ were observed while the values of θ f were found to be small and increased with frequency. In SrLaFe0.33Mn0.67TiO6, the peak at low frequency for θ f disappeared and only one peak appeared around 250 kHz, which did not match the frequency of the peak of Z \ \ f plot that falls around 440 kHz. Hence, the Debye relaxation is still present [54].
Attempts to analyze the data using the same equivalent circuit shown in Figure 8a was unsuccessful where the fit was unsatisfactory, leading to the model being modified. The data were then modeled using the equivalent circuit shown in Figure 8b. This includes the contribution of the electronic conduction as expressed by the resistor Re connected in parallel to the loops of the R-CPE. The inclusion of the electronic contribution is inferred from the low values of and the value of =10−10 s, which is comparable to that of the electronic polarization. The results of the fitting parameters are given in Table 3. It can be seen from Table 3 that the relaxation time of the grain boundary effect continues to decrease until it is in the neighborhood of the dipolar and atomic polarization regimes.
The Z \ - Z \ \ and θ f plots of SrLaMnTiO6−δ are shown in Figure 6D and Figure 7d, respectively. The values of Z \ and Z \ \ were found to be the lowest in the series of samples studied. In Figure 7d, θ f was increased without showing a peak within the frequency range of measurement. However, a peak was observed at a frequency around 750 kHz in the Z \ \ f plot indicating that the Debye relaxation does not disappear in this range. The data were fitted to the equivalent circuit shown in Figure 8b. It is essential to mention that the best fitting was achieved without the inclusion of the CPE1 and the Warburg elements.
The effect of replacing Fe ions in SrLaFeTiO6−δ with Mn ions was found to change the dielectric behavior of the samples. As can be seen from the frequency dependence of the real and imaginary parts of the impedance of the samples, the values of the resistivity decrease with the Mn concentration. This means that the mechanism of the transport process changes. At room temperature, the state changes from insulating in SrLaFeTiO6− to semiconducting or metallic in SrLaMnTiO6−δ. Therefore, as a complementary tool to our present investigations, the temperature dependence of the electrical resistance of SrLaFeTiO6−δ and SrLaMnTiO6−δ was measured and is shown in Figure 9. The electrical resistance of SrLaFeTiO6−δ was found to increase rapidly below 100 K, which is indicative of the typical behavior of insulators. However, in the case of SrLaMnTiO6−δ, a semiconductor-to-metal transition was observed around 250 K. This transition was reported by I. Alvarez et al. [55] at 210 K. The difference in the values of TC may be related to the difference in oxygen content in both samples plus the sample of I. Alvarez et al., which was prepared by chemical method. This increase in conductivity may be explained by the presence of Mn2+ ↔ Mn3+ pairs to activate the double exchange mechanism, which normally leads to ferromagnetic metallic behavior [24,56]. Therefore, this DC electrical measurement supports the claim that the present samples are in the intermediate doping of Mn and may have mixed ionic–electronic conduction. In general, relaxation phenomena are associated with polarization, where, at low frequencies, the dipoles tend to align along the direction of the electric field. At high frequencies, the response of the dipoles to the fast field is slow, so their contribution to polarization becomes negligible, leading to a decrease in real impedance with increasing frequency [57].
In the lattice of the present double perovskite samples, the conduction mechanism could be related to electron hopping between two adjacent octahedral sites and charge transfer could take place between Fe2+ ↔ Fe3+ and Mn2+ ↔ Mn3+ pairs. In general, besides hopping, there is a polarization effect that plays a role(s) in the conductivity response to the frequency of double perovskites, where the applied electric field is known to displace the hopping electrons along with their direction to a certain value of frequency. For the samples with low Mn concentration, the conduction can be understood by considering the polarization effect and the motion of the space charge due to the inhomogeneous dielectric structure [3]. By changing the direction of the electric field, the space charge carriers will also change their direction. At higher frequencies, the time required for the reversal of the space charge will be insufficient and will therefore lag behind the reversal of the applied field. As the frequency was further increased, the space charge carriers moved before the field was reversed and made virtually no contribution to the polarization of the ionic double perovskites, so the dielectric impedance of the material was dramatically reduced. For the samples with high Mn concentration, the conduction was controlled by the double exchange mechanism and low resistivity values and metallic behavior were observed at low temperature for SrLaMnTiO6−δ. Moreover, a comparison of the electrical conductivity of LaSrFeTiO6 and LaSrMnTiO6 with previously published work of similar doped perovskites is shown in Figure 10 [58,59,60]. The comparison showed that a significant enhancement of electrical conductivity in the case of LaSrMnTiO6 double perovskite.

4. Conclusions

The structural and electrical properties of double perovskites SrLaFe1−xMnxTiO6, (x= 0, 0.33, 0.67, and 1.0) were investigated using X-ray diffraction (XRD), dielectric impedance measurements, and DC-resistivity measurements. The phase purity and crystal structures of these perovskites were determined and confirmed by the standard Rietveld refinement method using the FullProf suite. The best-fit results showed that SrLaFeTiO6 is orthorhombic with space group Pnma, SrLaFe0.67Mn0.33TiO6 and SrLaFe0.33Mn0.67TiO6 are cubic with space group Fm3m, while SrLaMnTiO6 is tetragonal with space group I/4m. The charge density maps obtained from these structures indicate that the perovskites have mixed ionic–electronic conduction. The dielectric impedance measurements spanning the range of 20 Hz to 1 MHz revealed more than one relaxation mechanism and the data were found to follow the Debye relaxation type. The dielectric impedance of SrLaFe0.67Mn0.33TiO6 was found to be similar to the (La,Sr)(Co,Fe)O3 MIEC model. The addition of Mn resulted in a decrease in samples’ resistance, which is related to the possibility of a double exchange mechanism occurring between Mn ions. The existence of a double exchange mechanism was indicated by the oxygen deficiency in the samples. The occurrence of mixed ionic–electronic conduction and oxygen deficiency in these perovskites may qualify them for use as gas sensors, solar cells, and energy storage technologies.

Author Contributions

Conceptualization, A.A.E. and E.A.S.; methodology, M.A.S.; software A.A.A.; validation, O.A.A. and Hassan.; formal analysis, M.A.S.; investigation, A.A.E.; resources, O.A.A.; data curation, E.A.S.; writing—original draft preparation, E.A.S.; writing—review and editing, H.H.E.I.; visualization, A.A.A.; supervision, A.A.E.; project administration, M.A.S.; funding acquisition, E.A.S. All authors have read and agreed to the published version of the manuscript.

Funding

This research received no external funding.

Institutional Review Board Statement

Not applicable.

Informed Consent Statement

Not applicable.

Data Availability Statement

The original contributions presented in this study are included in the article. Further inquiries can be directed to the corresponding author.

Acknowledgments

This project was supported by the Department of Physics, the Faculty of Science, Al-Baha University.

Conflicts of Interest

The authors declare no conflicts of interest.

References

  1. Bibi, B.; Nazar, A.; Zhu, B.; Yang, F.; Yousaf, M.; Raza, R.; Yousaf Shah, M.A.K.; Kim, J.-S.; Afzal, M.; Lei, Y.; et al. Emerging semiconductor ionic materials tailored by mixed ionic-electronic conductors for advanced fuel cells. Adv. Powder Mater. 2024, 3, 100231. [Google Scholar] [CrossRef]
  2. Mogensen, M.; Lindegaard, T.; Hansen, U.R.; Mogensen, G. Physical properties of mixed conductor solid oxide fuel cell anodes of doped CeO2. J. Electrochem. Soc. 1994, 141, 2122–2128. [Google Scholar] [CrossRef]
  3. Deronzier, E.; Chartier, T.; Geffroy, P.-M. Oxygen semi-permeation properties of La1−xSrx FeO3−δ perovskite membranes under high oxygen gradient. J. Mater. Res. 2020, 35, 2506–2515. [Google Scholar] [CrossRef]
  4. Kim, C.S.; Bishop, S.R.; Tuller, H.L. Electro-chemo-mechanical studies of perovskite-structured mixed ionic-electronic conducting SrS1−x FexO3−x/2+δ part II: Electrical conductivity and cathode performance. J. Electroceram. 2018, 40, 57–64. [Google Scholar] [CrossRef]
  5. Arrive, C.; Delahaye, T.; Joubert, O.; Gauthier, G.H. Study of (La, Sr)(Ti, Ni)O3−δ materials for symmetrical Solid Oxide Cell electrode—Part B: Conditions of Ni exsolution. Ceram. Int. 2020, 46, 5841–5849. [Google Scholar] [CrossRef]
  6. Liu, S.; Liu, Q.; Luo, J.-L. The excellence of La(Sr)Fe(Ni)O3 as an active and efficient cathode for direct CO2 electrochemical reduction at elevated temperatures. J. Mater. Chem. A 2017, 5, 2673–2680. [Google Scholar] [CrossRef]
  7. Riess, I. Mixed ionic-electronic conductors-material properties and applications. Solid State Ion. 2003, 157, 1–17. [Google Scholar] [CrossRef]
  8. Wolf, S.E.; Winterhalder, F.E.; Vibhu, V.; de Haart, L.B.; Guillon, O.; Eichel, R.A.; Menzler, N.H. Solid oxide electrolysis cells—Current material development and industrial application. Matter Chem. A 2023, 11, 17977–18028. [Google Scholar] [CrossRef]
  9. Pockett, A.; Carnie, M.J. Ionic Influences on Recombination in Perovskite Solar Cells. ACS Energy Lett. 2017, 2, 1683–1689. [Google Scholar] [CrossRef]
  10. Senocrate, A.; Maier, J. Solid-State Ionics of Hybrid Halide Perovskites. J. Am. Chem. Soc. 2019, 141, 8382–8396. [Google Scholar] [CrossRef]
  11. Vadhva, P.; Hu, J.; Johnson, M.J.; Stocker, R.; Braglia, M.; Brett, D.J.; Rettie, A.J. Electrochemical Impedance Spectroscopy for All-Solid-State Batteries: Theory, Methods and Future Outlook. ChemElectroChem 2021, 8, 1930–1947. [Google Scholar] [CrossRef]
  12. Mahato, N.; Banerjee, A.; Gupta, A.; Omar, S.; Balani, K. Progress in material selection for solid oxide fuel cell technology: A review. Prog. Mater. Sci. 2015, 72, 141–337. [Google Scholar] [CrossRef]
  13. Wang, Y.; Zhang, Z.; Zhang, L.; Luo, Z.; Shen, J.; Lin, H.; Long, J.; Wu, J.C.; Fu, X.; Wang, X.; et al. Visible-Light Driven Overall Conversion of CO2 and H2O to CH4 and O2 on 3D-SiC@ 2D-MoS2 Heterostructure. J. Am. Chem. Soc. 2018, 140, 14595–14598. [Google Scholar] [CrossRef] [PubMed]
  14. Hossain, S.; Abdalla, A.M.; Jamain, S.N.B.; Zaini, J.H.; Azad, A.K. A review on proton conducting electrolytes for clean energy and intermediate temperature-solid oxide fuel cells. Renew. Sustain. Energy Rev. 2017, 79, 750–764. [Google Scholar] [CrossRef]
  15. Jia, H.; Zhou, W.; Duan, S.; Nan, H.; Luo, F.; Zhu, D. DC conductivity and AC impedance of Mn doped magnesia alumina spinel (MgAl2−2xMn2xO4) over a large temperature range. J. Eur. Ceram. Soc. 2018, 39, 1251–1256. [Google Scholar] [CrossRef]
  16. Satapathy, A.; Sinha, E. A comparative proton conductivity study on Yb-doped BaZrO3 perovskite at intermediate temperatures under wet N2 environment. J. Alloys Compd. 2019, 772, 675–682. [Google Scholar] [CrossRef]
  17. Jasinski, P.; Petrovsky, V.; Suzuki, T.; Anderson, H.U. Impedance studies of diffusion phenomena and ionic and electronic conductivity of cerium oxide. J. Electrochem. Soc. 2005, 152, J27–J32. [Google Scholar] [CrossRef]
  18. Bashir, J.; Shaheen, R. Structural and complex AC impedance spectroscopic studies of A2CoNbO6 (A= Sr, Ba) ordered double perovskites. Solid State Sci. 2011, 13, 993–999. [Google Scholar] [CrossRef]
  19. Xia, T.; Liu, X.; Li, Q.; Meng, J.; Cao, X. Synthesis, structural and electrical characterizations of Sr2Fe1−xMxNbO6 (M = Zn and Cu) with double perovskite structure. J. Alloys Compd. 2006, 422, 264–272. [Google Scholar] [CrossRef]
  20. Liu, Q.; Dong, X.; Xiao, G.; Zhao, F.; Chen, F. A novel electrode material for symmetrical SOFCs. Adv. Mater. 2010, 22, 5478–5482. [Google Scholar] [CrossRef]
  21. Marrero-López, D.; Peña-Martínez, J.; Ruiz-Morales, J.; Martín-Sedeño, M.; Núñez, P. High temperature phase transition in SOFC anodes based on Sr2MgMoO6−δ. J. Solid State Chem. 2009, 182, 1027–1034. [Google Scholar] [CrossRef]
  22. Kalanda, N.; Kim, D.H.; Demyanov, S.; Yu, S.C.; Yarmolich, M.; Petrov, A.; Oh, S.K. Sr2FeMoO6 nanosized compound with dielectric sheaths for magnetically sensitive spintronic devices. Curr. Appl. Phys. 2018, 18, 27–33. [Google Scholar] [CrossRef]
  23. Jung, W.; Tuller, H.L. Impedance study of SrTi1−xFexO3−δ (x = 0.05 to 0.80) mixed ionic-electronic conducting model cathode. Solid State Ion. 2009, 180, 843–847. [Google Scholar] [CrossRef]
  24. Álvarez-Serrano, I.; de Larramendi, I.R.; López, M.; Pico, C.; Rojo, T.; Veiga, M. Oriented nanocrystals in SrLaMnTiO6 perovskite thin films grown by pulsed laser deposition. J. Alloys Compd. 2011, 509, 1457–1462. [Google Scholar] [CrossRef]
  25. Baumann, F.S.; Fleig, J.; Habermeier, H.-U.; Maier, J. Impedance spectroscopic study on well-defined (La, Sr)(Co, Fe)O3−δ model electrodes. Solid State Ion. 2006, 177, 1071–1081. [Google Scholar] [CrossRef]
  26. El Hachmi, A.; Tamraoui, Y.; Manoun, B.; Haloui, R.; Elaamrani, M.A.; Saadoune, I.; Bih, L.; Lazor, P. Synthesis and Rietveld refinements of new ceramics Sr2CaFe2WO9 and Sr2PbFe2TeO9 perovskites. Powder Diffr. 2018, 33, 134–140. [Google Scholar] [CrossRef]
  27. Correia, V.; Mitra, K.Y.; Castro, H.; Rocha, J.G.; Sowade, E.; Baumann, R.R.; Lanceros-Méndez, S. Design and fabrication of multilayer inkjet-printed passive components for printed electronics circuit development. J. Manuf. Process. 2018, 31, 364–371. [Google Scholar] [CrossRef]
  28. Buniatyan, V.; Tsakanov, V.; Martirosyan, N.; Melikyan, G.; Dashtoyan, H. Dielectric Characteristics of Pt/BaxSr1−xTiO3/Pt Thin Film Structure under the Electron Beam Irradiation. Armen. J. Phys. 2016, 9, 138–146. [Google Scholar]
  29. Ashfaq, A.; Almufarij, R.S.; Ali, M.Y.; Ali, A.; Tahir, S.; Sabugaa, M.M.; Fahmy, M.A.; Shokralla, E.A.; Ragab, A.H.; El-Refaey, D.E.; et al. High thermoelectric power factor of n-type Bi2 (Se, S) via synergetic influence on the charge carrier concentration and energy filtering effect. Int. Commun. Heat Mass Transf. 2023, 146, 106870. [Google Scholar] [CrossRef]
  30. Bondarenko, A.S. Analysis of large experimental datasets in electrochemical impedance spectroscopy. Anal. Chim. Acta 2012, 743, 41–50. [Google Scholar] [CrossRef]
  31. Albrecht, E.; Siponkoski, T.; Rautama, E.; Karppinen, M.; Karttunen, A. Centrosymmetric to non-centrosymmetric transition in the Ca2-xMnxTi2O6 double perovskite system studied through structural analysis and dielectric properties. Dalton Trans. 2024, 53, 6282–6288. [Google Scholar] [CrossRef]
  32. Zaraq, A.; Orayech, B.; Igartua, J.; Bouari, E.; Gregory, D.; Gesing, T. Crystallography at non-ambient conditions and physical properties of the synthesized double perovskites, Sr2(Co1−xFex)TeO6. Dalton Trans. 2023, 52, 4086–4102. [Google Scholar] [CrossRef] [PubMed]
  33. Haneef, M.; Almufarij, R.S.; Tahir, S.; Gazo-Hanna, E.; Arayro, J.; Shokralla, E.A.; Alrefaee, S.H.; Fahmy, M.A.; Macadangdang, R.R., Jr.; Ashfaq, A. Optimization of a novel lead-free MASiI3 based perovskite solar cell: A comprehensive study on device performance enhancement. Results Eng. 2024, 23, 102809. [Google Scholar] [CrossRef]
  34. Szczodrowski, K.; Behrendt, M.; Barzowska, J.; Górecka, N.; Majewska, N.; Leśniewski, T.; Łapiński, M.; Mahlik, S. Lanthanide ions (Eu3+, Er3+, Pr3+) as luminescence and charge carrier centers in Sr2TiO4. Dalton Trans. 2023, 52, 4329–4335. [Google Scholar] [CrossRef]
  35. Song, B.; Shen, J.; Zhao, H.; Kumar, A.; Xu, Q.; Zhai, Y.; Li, Q. A new room-temperature multiferroic material: Y2FeAlO6. Ceram. Int. 2021, 47, 10873–10879. [Google Scholar] [CrossRef]
  36. Uvarov, V. The influence of X-ray diffraction pattern angular range on Rietveld refinement results used for quantitative analysis, crystallite size calculation and unit-cell parameter refinement. J. Appl. Crystallogr. 2019, 52, 252–261. [Google Scholar] [CrossRef]
  37. Gómez-Peralta, J.; Bokhimi, X.; Quintana, P. Convolutional Neural Networks to Assist the Assessment of Lattice Parameters from X-ray Powder Diffraction. J. Phys. Chem. A 2023, 127, 7655–7664. [Google Scholar] [CrossRef]
  38. Sullivan, B.; Archibald, R.; Langan, P.; Dobbek, H.; Bommer, M.; McFeeters, R.; Coates, L.; Wang, X.; Gallmeier, F.; Carpenter, J.; et al. Improving the accuracy and resolution of neutron crystallographic data by three-dimensional profile fitting of Bragg peaks in reciprocal space. Struct. Biol. 2018, 74, 1085–1095. [Google Scholar] [CrossRef]
  39. Rai, A.; Thakur, A. Co-substitution tailored dielectric relaxation and electrical conduction in lanthanum orthoferrite. Ceram. Int. 2020, 46, 22752–22765. [Google Scholar] [CrossRef]
  40. Tripathy, A.; Das, S.N.; Bhuyan, S.; Choudhary, R.N.P. Structural and dielectric properties of double perovskite lead free BiGdMnNiO6 electronic system. Mater. Tody Proc. 2021, 35 Pt 2, 109–111. [Google Scholar] [CrossRef]
  41. Burnat, D.; Nasdaurk, G.; Holzer, L.; Kopecki, M.; Heel, A. Lanthanum doped strontium titanate-ceria anodes: Deconvolution of impedance spectra and relationship with composition and microstructure. J. Power Sources 2018, 385, 62–75. [Google Scholar] [CrossRef]
  42. Gajula, G.R.; Kumar, K.C.; Buddiga, L.R.; Nethala, G.P. Dielectric and impedance properties of Li0.5Fe2.5O4 doped BaTiO3 composite ceramics. Results Phys. 2018, 11, 899–904. [Google Scholar] [CrossRef]
  43. Zawar, S.; Atiq, S.; Tabasum, M.; Riaz, S.; Naseem, S. Highly stable dielectric frequency response of chemically synthesized Mn-substituted ZnFe2O4. J. Saudi Chem. Soc. 2019, 23, 417–426. [Google Scholar] [CrossRef]
  44. Dhahri, A.; Dhahri, E.; Hlil, E.K. Electrical conductivity and dielectric behaviour ofnanocrystalline La0.6Gd0.1Sr0.3Mn0.75Si0.25O3. RSC Adv. 2018, 8, 9103–9111. [Google Scholar] [CrossRef]
  45. Maity, S.K.; Dutta, A.; Kumar, S.; Sinha, T. Electrical properties of Ba2YbNbO6: An impedance spectroscopy study. Phys. Scr. 2013, 88, 065702. [Google Scholar] [CrossRef]
  46. Almufarij, R.S.; Jamil, M.; Alsubhe, E.; Alghamdi, S.M.; Shokralla, E.A.; Khan, K.M.; Ashfaq, A.; Ali, A.; Jafri, S.A.A.; Khan, M.S. Enhancing solar cell efficiency through tandem structures utilizing lead-free mixed cation perovskites and CZTSe absorber layers. Chem. Phys. Impact 2024, 8, 100562. [Google Scholar] [CrossRef]
  47. Feng, W.; Zhao, Y.; Xia, Y. Solid interface of garnet electrolytes. Adv. Mater. 2024, 15, 2306111. [Google Scholar] [CrossRef]
  48. Jamnik, J.; Maier, J. Generalised equivalent circuits for mass and charge transport: Chemical capacitance and its implications. Phys. Chem. Chem. Phys. 2001, 3, 1668–1678. [Google Scholar] [CrossRef]
  49. Reddy, M.V.; Julien, C.M.; Mauger, A.; Zaghib, K. Sulfide and oxide inorganic solid electrolytes for all-solid-state li batteries: A review. Nanomaterials 2020, 10, 1606. [Google Scholar] [CrossRef]
  50. Abitonze, M.; Diko, C.S.; Zhu, Y.; Yang, Y. Recent progress on inorganic composite electrolytes for all-solid-state lithium batteries. MRS Energy Sustain. 2024, 11, 219–266. [Google Scholar] [CrossRef]
  51. Lasia, A. The Oregine of the CPE. J. Phys. Chem. Lett. 2022, 13, 589. [Google Scholar] [CrossRef]
  52. Dizon, A.; Orazem, M.E. On the impedance response of interdigitated electrodes. Electrochim. Acta 2019, 327, 135000. [Google Scholar] [CrossRef]
  53. Yang, E.-H.; Noh, Y.-S.; Ramesh, S.; Lim, S.S.; Moon, D.J. The effect of promoters in La0.9M0.1Ni0.5Fe0.5O3 (M = Sr, Ca) perovskite catalysts on dry reforming of methane. Fuel Process. Technol. 2015, 134, 404–413. [Google Scholar] [CrossRef]
  54. Wang, C.; Shi, Z.; Wang, Y.; Peng, G.; Luo, W.; Xiao, M.; Xing, W.; Sang, G.; Liu, C. Ruthenium Phosphide Nanoclusters Dispersed on Zeolitic Imidazolate Framework-8 and Encapsulated in N,P-Codoped Carbon as Electrocatalysts for the Hydrogen Evolution Reaction. ACS Appl. Nano Mater. 2024, 7, 25335–25344. [Google Scholar] [CrossRef]
  55. Huang, V.M.-W.; Vivier, V.; Orazem, M.E.; Pébère, N.; Tribollet, B. The apparent constant-phase-element behavior of an ideally polarized blocking electrode a global and local impedance analysis. J. Electrochem. Soc. 2007, 154, C81–C88. [Google Scholar] [CrossRef]
  56. Medvedkin, G.A.; Ishibashi, T.; Nishi, T.; Hayata, K.; Hasegawa, Y.; Sato, K. Room temperature ferromagnetism in novel diluted magnetic semiconductor Cd1−xMnxGeP2. Jpn. J. Appl. Phys. 2000, 39, L949. [Google Scholar] [CrossRef]
  57. Gul, I.; Maqsood, A. Structural, magnetic and electrical properties of cobalt ferrites prepared by the sol-gel route. J. Alloys Compd. 2008, 465, 227–231. [Google Scholar] [CrossRef]
  58. Shang, P.-P.; Zhang, B.-P.; Liu, Y.; Li, J.-F.; Zhus, H.-M. Preparation and Thermoelectric Properties of La-Doped SrTiO3 Ceramics. J. Electron. Mater. 2011, 40, 926–931. [Google Scholar] [CrossRef]
  59. Qin, M.; Lou, Z.; Shi, Z.; Zhang, R.; Xu, J.; Gao, F. Enhanced thermoelectric properties of Sr0.9La0.1TiO3 Ceramics fabricated by SPS with nanosized Ti addition. J. Mater. Sci. Mater. Electron. 2020, 31, 6919–6926. [Google Scholar] [CrossRef]
  60. Wang, H.; Su, W.; Liu, J.; Wang, C. Recent development of n-type perovskite thermoelectrics. J. Mater. 2016, 2, 225e236. [Google Scholar] [CrossRef]
Figure 1. The sequential scheme of preparing SrLaFe1−xMnxTiO6 (x = 0, 0.33, 0.67, and 1.0).
Ceramics 08 00087 g001
Figure 2. (a) Rietveld refinement profiles of the X-ray diffraction patterns for SrLaFeTiO6 with (Pnma) space group. (b) Rietveld refinement profiles of the X-ray diffraction patterns for SrLaMnTiO6 It shows the tetragonal structure with (I/4m) space group. The dots correspond to the experimental data, and the solid line is for the Rietveld refinement fit.
Ceramics 08 00087 g002aCeramics 08 00087 g002b
Figure 3. The contour maps in the ab-plane of each crystal system of the samples, that are obtained from the results of the best fitting of the XRD data.
Ceramics 08 00087 g003
Figure 4. The Bode real dielectric impedance for (a) SrLaFeTiO6, (b) SrLaFe0.67Mn0.33TiO6, (c) SrLaFe0.33Mn0.67TiO6, and (d) SrLaMnTiO6.
Ceramics 08 00087 g004
Figure 5. The Bode imaginary dielectric impedance for (a) SrLaFeTiO6, (b) SrLaFe0.67Mn0.33TiO6, (c) SrLaFe0.33Mn0.67TiO6, and (d) SrLaMnTiO6.
Ceramics 08 00087 g005
Figure 6. The complex Cole–Cole plots for (A) SrLaFeTiO6, (B) SrLaFe0.67Mn0.33TiO6, (C) SrLaFe0.33Mn0.67TiO6, and (D) SrLaMnTiO6. The blue dots correspond to the experimental data and the red solid line represent the fitting.
Ceramics 08 00087 g006
Figure 7. The phase angle shift calculated for (a) SrLaFeTiO6, (b) SrLaFe0.67Mn0.33TiO6, (c) SrLaFe0.33Mn0.67TiO6, and (d) SrLaMnTiO6.
Ceramics 08 00087 g007
Figure 8. The equivalent circuit models used for fitting the impedance data. The sample name is shown along with the equivalent circuit that is used for the data fitting.
Ceramics 08 00087 g008
Figure 9. DC resistance measured as a function of temperature for SrLaFeTiO6−δ and SrLaMnTiO6−δ.
Ceramics 08 00087 g009
Figure 10. Comparison of electrical conductivity of present work with similar previously published work.
Ceramics 08 00087 g010
Table 1. The published and corresponding experimental values of geometrical densities of LaSrFeTiO6 and LaSrMnTiO6 double perovskites.
PowderLaSrFeTiO6LaSrMnTiO6LaSrFe0.67 Mn0.33TiO6LaSrFe0.33 Mn0.67TiO6
Published density6.5 g/cm3.6.3 g/cm35.4 g/cm35.38g/cm3
Experimental density6.4 g/cm36.1 g/cm35.64 sg/cm35.42g/cm3
Table 2. The atomic positions, space groups, lattice parameters, and refinement reliability factors for all samples.
ElementsCoordinatesSrLaFeTiO6SrLaFe0.67Mn0.33TiO6SrLaFe0.33Mn0.67TiO6SrLaMnTiO6
PnmaFm3mFm3mI/4m
Sr/LaX0.01016 ± 0.000080.25000 ± 0.000010.25000 ± 0.000020.00000
Y0.25000 ± 0.000030.25000 ± 0.000040.25000 ± 0.000030.50000 ± 0.00006
Z0.00795 ± 0.000050.25000 ± 0.000020.25000 ± 0.000010.25000 ± 0.00003
Fe/MnX0.000000.000000.000000.00000
Y0.000000.000000.000000.00000
Z0.50000 ± 0.000040.000000.000000.00000
TiX0.000000.50000 ± 0.000020.50000 ± 0.000030.50000 ± 0.00004
Y0.000000.50000 ± 0.000040.50000 ± 0.000010.50000 ± 0.00003
Z0.50000 ± 0.000030.50000 ± 0.000050.50000 ± 0.000010.00000
O1X−0.00176 ± 0.000250.24900 ± 0.000210.26846 ± 0.000120.00000
Y0.25000 ± 0.000010.000000.000000.00000
Z0.52003 ± 0.000020.000000.000000.24503 ± 0.00011
O2X0.25942 ± 0.00031--0.24174 ± 0.00051
Y−0.01639 ± 0.00025--0.30077 ± 0.00034
Z0.26433 ± 0.00011--0.00000
a (Å)5.55765 ± 0.000067.81499 ± 0.000077.81934 ± 0.000075.51964 ± 0.00006
b (Å)7.82408 ± 0.00007---
c (Å)5.53766 ± 0.00004--7.80438 ± 0.00007
RWP2.43.525.083.83
RP3.613.153.714.9
Table 3. The fitting parameters which are obtained using equivalent circuits.
Constant Phase ElementParametersSrLaFeTiO6SrLaFe0.67Mn0.33TiO6SrLaFe0.33Mn0.67TiO6SrLaMnTiO6
Grain
(R1 + CPE1)
R1 (Ω)3248.9005390.1008.99037.024
P1 × 10−910.1600.610--
n10.9500.940--
C1 (nF)5.900.270--
τ1 (Sec)19.17 × 10−614.55 × 10⁻⁷--
Grain boundary
(R2 + CPE2)
R2 (Ω)1.22 × 10643,055125.700-
P2 × 10−99.45017.4501.100-
n20.9200.8100.920-
C2 (nF)6.4103.2300.250-
τ2 (Sec)7.82 × 10−313.91 × 10−531.43 × 10⁻⁹-
Electrode
(R3 + CPE3)
R3 (Ω)95.68026,198138.99456.140
P3 × 10−90.5700.7200.0010.001
n30.9600.9100.0870.158
C3 (nF)0.2800.2500.006190.930
τ3 (Sec)26.79 × 10−965.50 × 10−78.33 × 10−1087.09 × 10−6
Wsr21.87 × 1052.0 × 10−142.0 × 10⁻¹²-
Ws110.4609.740--
Celec (nF)--1786.237.020
Electronic resistanceRe (Ω)--6.225.580
Disclaimer/Publisher’s Note: The statements, opinions and data contained in all publications are solely those of the individual author(s) and contributor(s) and not of MDPI and/or the editor(s). MDPI and/or the editor(s) disclaim responsibility for any injury to people or property resulting from any ideas, methods, instructions or products referred to in the content.

