Article

Characterization of the Evolution with Temperature of the Structure and Properties of Geopolymer-Cordierite Composites

by
Franklin Casarrubios
1,*,
Alexandre Marlier
1,
Charlotte Lang
2,
Sandra Abdelouhab
2,
Isabella Mastroianni
2,
Geoffroy Bister
2 and
Maurice-François Gonon
1,*
1
Materials Institute, University of Mons (UMONS), 7000 Mons, Belgium
2
Belgian Ceramic Research Centre (BCRC), 7000 Mons, Belgium
*
Authors to whom correspondence should be addressed.
Ceramics 2024, 7(4), 1513-1532; https://doi.org/10.3390/ceramics7040098
Submission received: 9 September 2024 / Revised: 8 October 2024 / Accepted: 13 October 2024 / Published: 17 October 2024
(This article belongs to the Special Issue Innovative Manufacturing Processes of Silicate Materials)

Abstract

:
This work is part of a research project aimed at producing ceramic-like materials, without the need for an initial sintering, for potential applications in catalysis or filtration at temperatures up to 1000 °C. In that context, cordierite-derived materials were prepared from recycled cordierite powder (automotive industry waste) bonded with metakaolin-potassium silicate geopolymer. The principle is that these materials, prepared at temperatures below 100 °C, acquire their final properties during the high-temperature commissioning. The focus is on the influence of the K/Al ratio and cordierite fraction on the stability of the dimensions and porosity during heating at 1000 °C, and on the final Young’s modulus and coefficient of thermal expansion. Conventional and high-temperature XRD evidenced the absence of crystallization of the geopolymer binder and interaction with the cordierite filler during the heating stage when K/Al = 1 or 0.75. By contrast, crystallization of kalsilite and leucite, and diffusion of potassium ions in the structure of cordierite is evidenced for K/Al = 1.5 and 2.3. These differences strongly influence the shrinkage due to sintering and the final properties. It is shown that a K/Al ratio of 0.75 or 1 is favorable to the stability of the porosity, around 25 to 30%. Moreover, a low coefficient of thermal expansion of 4 to 4.5 × 10⁻⁶ K−1 and a Young’s modulus of 40 to 45 GPa is obtained.

1. Introduction

Cordierite Mg2Al4Si5O18 (or 2MgO·2Al2O3·5SiO2) is one of the main compounds of the ternary system MgO-SiO2-Al2O3. Although there are different ways to synthesize cordierite, the most common is by reactive sintering, at a temperature of around 1400 °C, of mixtures of raw materials containing the required oxides, such as talc, clay and alumina [1]. Besides their interesting dielectric properties [2], these materials have received a great deal of attention due to their very low coefficients of thermal expansion (<3 × 10⁻⁶ K−1) and thermal conductivity (2–3 W m−1 K−1) [3,4]. They are thus widely used in high-temperature applications, such as catalyst substrates and filtration [5,6,7,8]. For the automotive industry, most of the catalytic converters are produced by the extrusion of a cordierite honeycomb substrate coated with a “washcoat”, consisting of precious metals (Pt, Pd, …) [9,10].
Considering the huge number of motor vehicles produced in the world, recycling of end-of-life converters is of growing interest from economic and environmental points of view. Studies are carried out on the recovery of the precious metals of the washcoat by pyrometallurgy and hydrometallurgy. Furthermore, new approaches are considered to obtain zero waste by recycling the ceramic substrate [11]. On the other hand, a non-negligible quantity of non-conform fired cordierite substrates (without washcoat) are produced by the industry. The reuse of these production wastes for the manufacture of high-added value products is, therefore, of high interest and would be a first step to demonstrate the recyclability of the cordierite.
However, the use, as raw material, of a powder of milled fired substrates, and, therefore, mineralogically containing cordierite as nearly single phase, fundamentally changes the sintering mechanism. Indeed, the absence of physicochemical transformations and reactions between the different raw materials of a mixture (e.g., talc, kaolin, …) consequently leads to sintering essentially based on diffusion mechanisms in the solid state [12,13]. In this case, the suitability of the powder edifice for consolidation and densification is strongly conditioned to the use of a sub-micron size powder and a high sintering temperature. Using dilatometry curves, Camerucci et al. evidenced the solid-state sintering of cordierite between 850 °C and 1350 °C. Above 1350 °C, shrinkage is accelerated by the occurrence of a liquid phase. Their study also highlights the influence of particle size distribution on the densification. Firstly, using a monomodal distribution, the finer the particle size, the greater the densification. Secondly, using a bimodal distribution, with an optimum ratio, allows an increase in the degree of densification [12]. However, obtaining a powder from downgraded parts requires several grinding steps, and the energy cost and process duration increase sharply with the desired fineness. An alternative solution is the use of a sintering additive to lower the sintering temperature. Ogiwara et al. studied the influence of the addition of 3%wt of Li2O–Bi2O3. They succeeded in achieving a densification of 97% at 1050 °C for 2 h. However, the mechanical properties were degraded, for example, flexural strength going from 243 MPa to 120 MPa [13]. Even if it is considered that extensive densification is not useful for the intended application, sufficient consolidation to ensure mechanical strength is essential. It is, therefore, of great interest to find an alternative to conventional sintering to produce consolidated and geometrically stable parts at the lowest possible energy cost.
For several years now, geopolymer materials have been attracting growing interest from scientists and industrialists alike. Without the need for energy-intensive heat treatments, the geopolymerization process makes it possible to form silicate inorganic materials with good performance in terms of mechanical properties, chemical resistance and durability [14,15,16]. Geopolymers are obtained by reaction between alkaline silicate, or more rarely acidic reagent, and amorphous aluminosilicate powders, at room or low temperatures. The resulting solid has a three-dimensional amorphous structure that contains mostly covalent bonds. A large body of research focuses on the formulation of geopolymers for construction applications [17,18]. However, more and more studies are also focusing on the development of geopolymers for applications that usually use ceramic materials [19,20].
Unfortunately, one of the downsides of geopolymers is their poor mechanical properties at high temperatures. During a rise in temperature, dehydration and dihydroxylation of the inorganic network occur, possibly followed by its crystallization and other phenomena. These transformations induce strong dimensional variations and cracking [21,22]. To overcome this issue, the geopolymer paste can be loaded with mineral filler to produce a “composite” material [19,23,24]. By doing so, the geopolymer allows a “cold” consolidation of the powder edifice and the reaction between the geopolymer and the filler during a rise in temperature can possibly stabilize the structure of the material and enhance its final properties.
The type of alkali and the alkali/Al ratio have a strong influence on the properties of the geopolymer materials after curing but also at high temperatures. Bernal et al. studied the influence of alkali over the evolution of shrinkage with temperature until 1000 °C on samples cured at ambient temperature for 7 days and 5 years. For alkali/Al = 1, Na-based geopolymers show a first stage of shrinkage of 7.5% at 250 °C related to dehydration and dihydroxylation, and a second shrinkage around 750 °C related to viscous sintering. The final shrinkage is 23%. For K-geopolymers, the first shrinkage is lower (5%) and the viscous sintering begins at 900 °C; the final shrinkage is 10%. Finally, Rb- and Cs-geopolymers show the same behavior with a smoother shrinkage for the removal of water, and no sintering is observable. The final shrinkage is around 7.5%. After 5 years of curing, Na-geopolymers show the same behavior but the shrinkage related to sintering is more drastic and the final shrinkage is 27.5%. Finally, K-geopolymers show the same behavior as the Rb-geopolymers, and the curing time has no effect over the evolution of shrinkage with temperature [25]. The potassium-based geopolymers show better resistance to high temperatures compared to sodium-based geopolymer pastes [23]. A study was undertaken by Kohout et al. [26] about the effect of the K/Al molar ratio on the thermomechanical properties of metakaolinite-based geopolymer composites. In their study, a chamotte was used as a filler for the geopolymer matrix. From the structural point of view, it was shown that the pure geopolymer stays amorphous until 800 °C. For higher temperatures, the crystallization of leucite (KAlSi2O6) and kalsilite (KAlSiO4) happens depending on the K/Al ratio; the higher the ratio, the more phases appear at lower temperatures. It was also highlighted that the geopolymer in the composites shows the same transformations as the pure geopolymer. Regarding the mechanical properties, a high K/Al molar ratio tends to bring down the mechanical properties of the samples. For unfired samples, the maximal value of the Young’s modulus is obtained with a ratio near 1.0. Additionally, the modulus tends towards lower values when the sample is fired at temperatures up to 1000 °C. On the other hand, in their work, K. Hemra and P. Aungkavattana demonstrated that using cordierite as filler leads to a strong increase in the compressive strength after heat treatment at 800 °C/2 h compared to the geopolymer alone [24]. They also showed that no new crystalline compounds are formed during the heat treatment.
Cesium-based geopolymers reinforced with 5–35 wt% cordierite were synthesized by Wei Chen et al. [27]. The main crystalline phases in the product, obtained after thermal treatment at 1400 °C, are cordierite and cubic pollucite, Cs2O·Al2O3·4SiO2, which is formed by crystallization of the geopolymer matrix over 700 °C. The cordierite filler does not react with the geopolymer. The shrinkage resulting from the sintering is less than 5% and occurs over 800 °C. The lowest coefficient of thermal expansion results from the highest cordierite load and is 1.89 × 10⁻⁶ K−1, which is unexpectedly lower than the CTE of pure cordierite. In their work, Chengying Bai et al. [28] investigated the synthesis by a replica route of cordierite-based geopolymer foams that have potential applications such as porous supports or high-temperature filter components. The geopolymers were prepared by incorporating MgO as an additional magnesium source in metakaolin and fly ash reacted with NaOH solution and sodium silicate solution. Sintering at 1200 °C for 2 h led to porous cordierite-based ceramics. However, an extensive structural characterization showed that the transformation of cordierite after the thermal treatment was incomplete.
Finally, some recent works demonstrate that it is possible to obtain geopolymer composite parts by additive manufacturing. Gasmi et al. studied the production of metakaolin-based geopolymer and composites with feldspar and wollastonite by robocasting [29]. Additive manufacturing techniques appear to be highly promising for producing substrates or filters with optimized geometries. Kovacev et al. used digital-light processing (DLP) to produce substrates with two designs of diamond unit cells. For the same inlet gas temperature, it was found that the conversion efficiency was higher for the substrates produced by DLP compared to traditional honeycomb substrates [30].
In this context, we investigate the manufacture of cordierite–geopolymer composites. As previously explained, the first motivations for the choice of cordierite as the mineral filler are its intrinsic properties and the reuse of industrial wastes. Besides this, it is well known that the crystal structure of the cordierite can accept the insertion of potassium atoms [31,32]. This can possibly lead to interactions between the potassium silicate-based geopolymer and the cordierite filler during the rise in temperature, and then affect the dimension stability and the final properties of the composite. More precisely, our interest is in the influence of the K/Al ratio and the cordierite fraction on the stability of the dimensions and porosity during heating at 1000 °C, and on the final Young’s modulus and coefficient of thermal expansion. The final goal of this work is to select the most promising compositions for a further study that will focus on their use in additive manufacturing.

2. Materials and Methods

2.1. Materials

The cordierite powder used in this work comes from non-conform (over tolerance limits or presence of flaws) honeycomb substrates for catalytic converters that were supplied by an industrial partner. These substrates are first crushed with a pestle into a coarse powder, which is further wet-milled using a Turbula shaker (Willy A. Bachofen AG, Basel, Switzerland) at a speed of 46 RPM with alumina media, and finally dried to obtain the final powder. The parameters for the milling are the following:
  • Weight ratio cordierite/water = 5:7
  • Weight ratio cordierite/balls = 1:1
  • Shaking time = 7.5 h
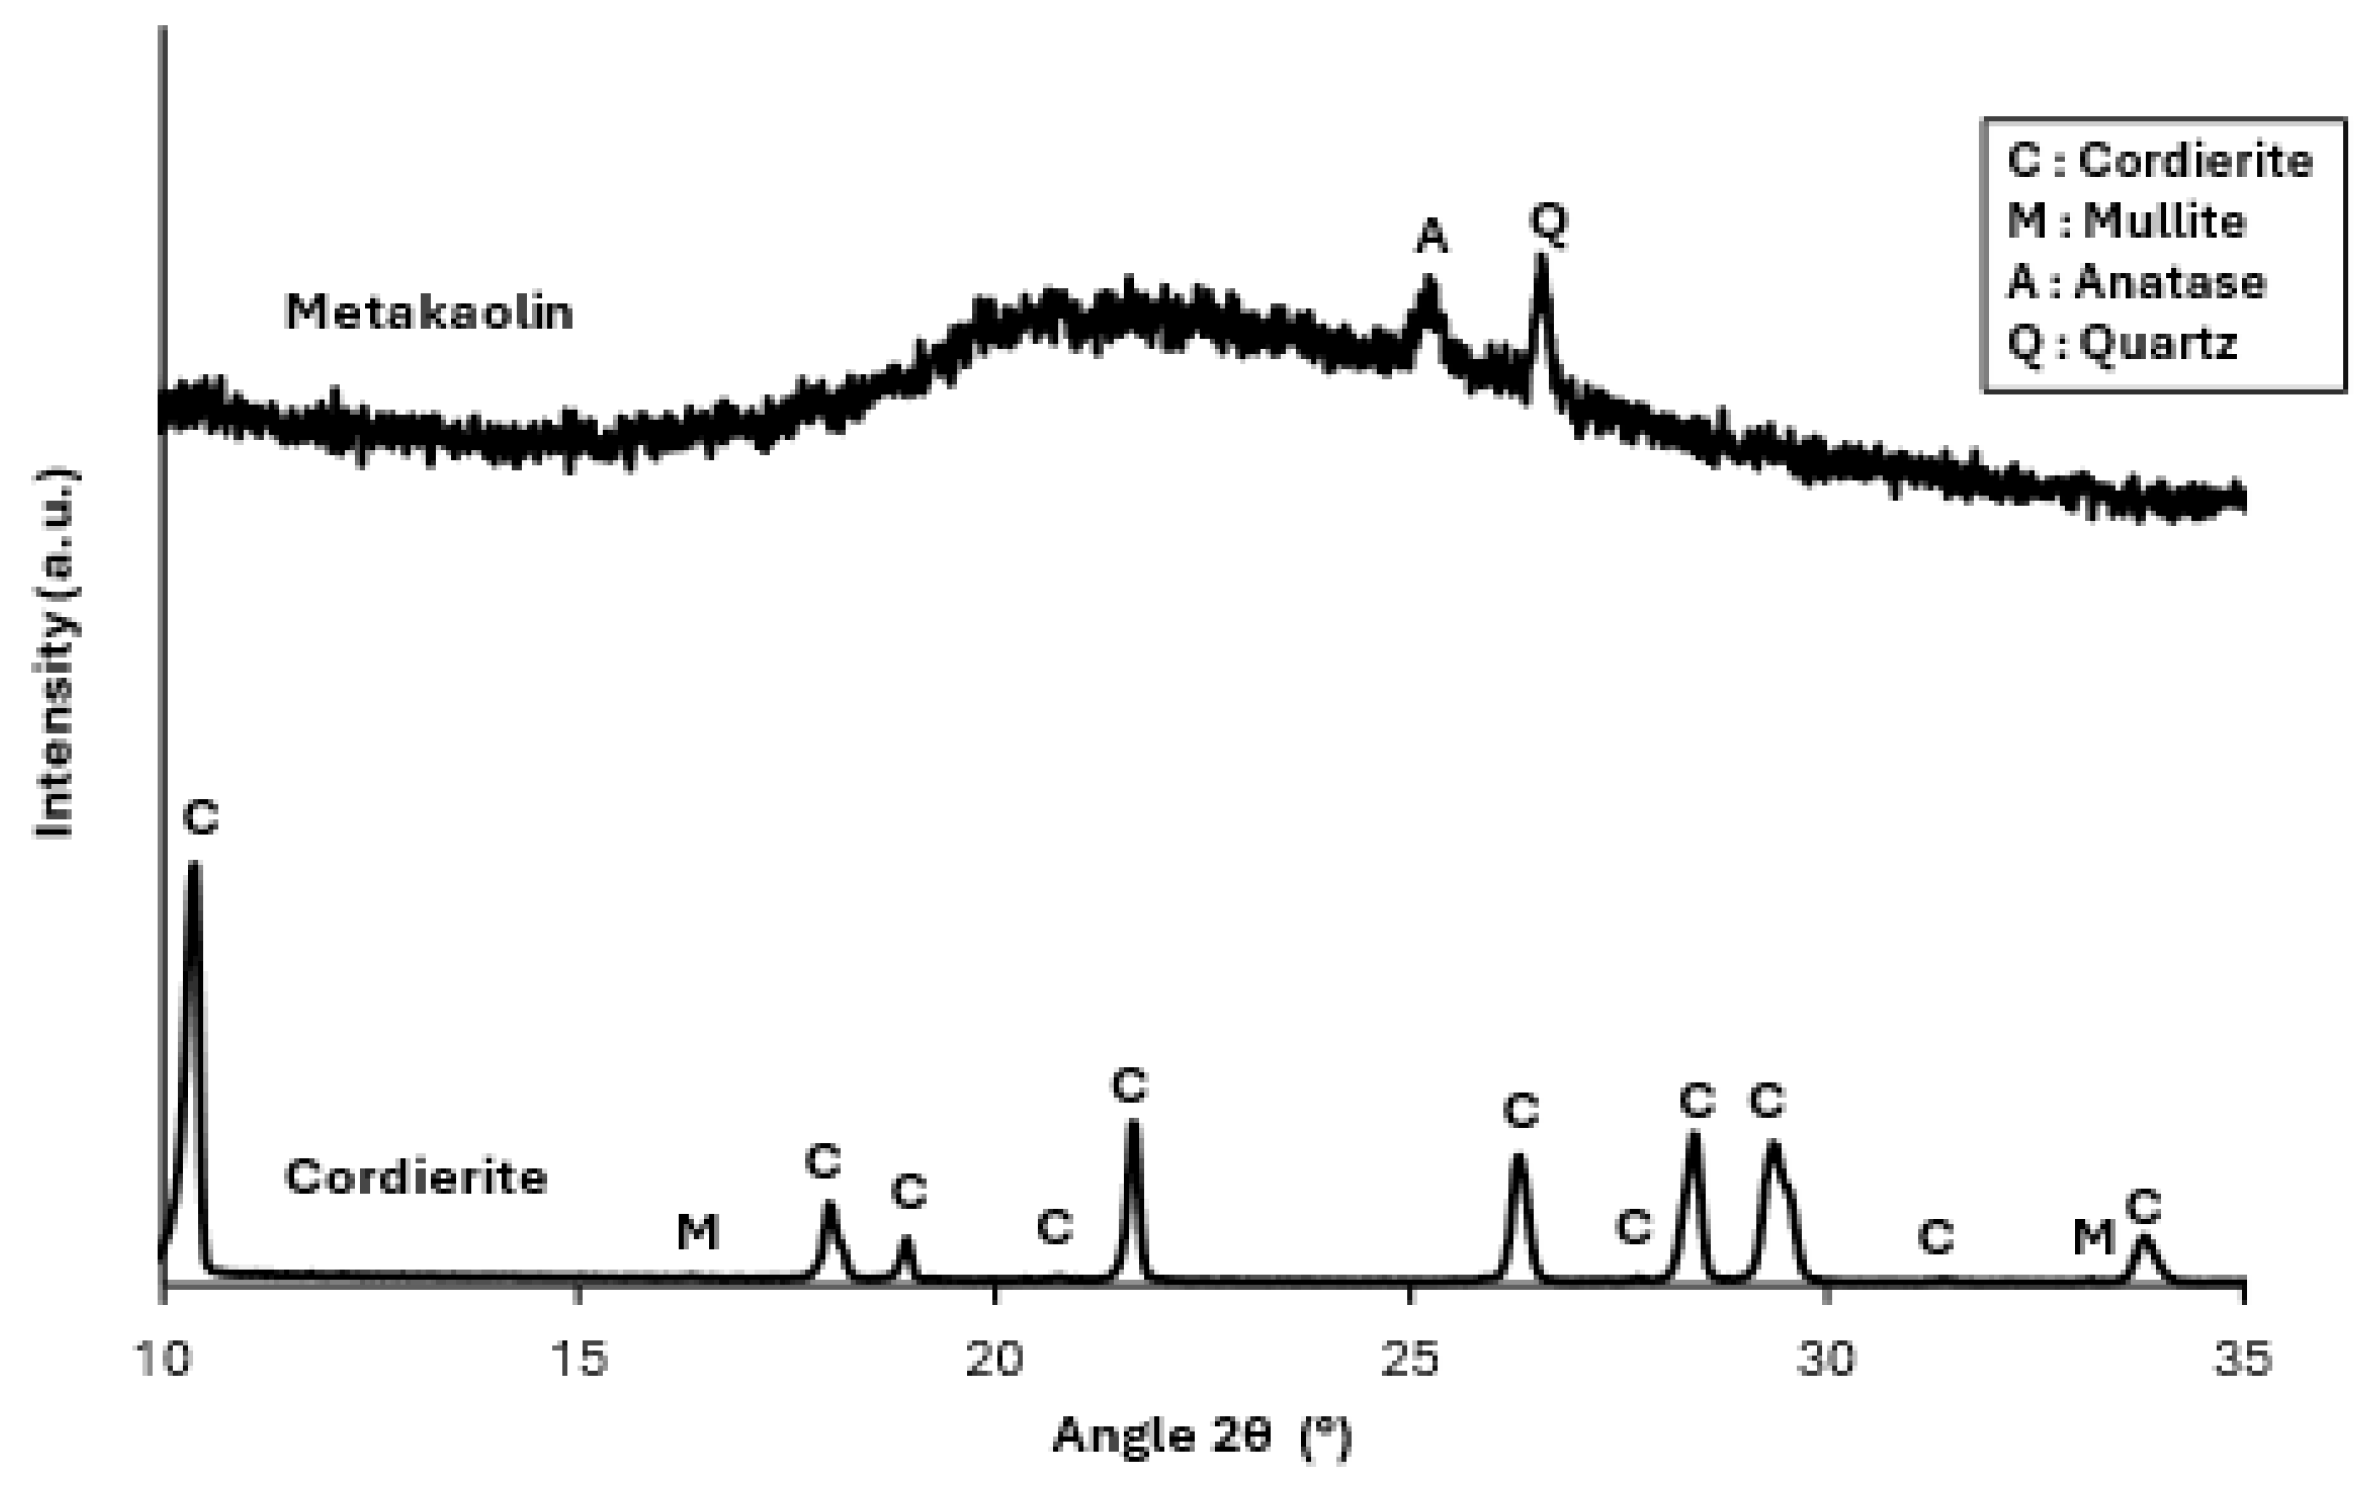
The particle size distribution of the final cordierite powder was characterized by using a Malvern Mastersizer 2000 laser granulometer (Malvern Panalytical, Malvern, UK) (Table 1). The median size of the particles d50 is 26.9 µm. An X-ray diffraction (XRD) analysis was performed on the powder using a Panalytical Empyrean diffractometer (Malvern Panalytical, Malvern, UK) with a Cu Kα radiation source. The X-ray pattern shows the diffraction peaks of cordierite (JCPDS #00-013-0294), and a small amount of mullite (JCPDS #00-015-0776) (Figure 1). An XRF analysis was performed with Horiba XGT 9000 equipment (Horiba, Kyoto, Japan) to ascertain the composition of the powder and compare it to the stoichiometric cordierite (Table 2).
The metakaolin (Al2O3·2SiO2) used for this work comes from Temcon-Solutions GmbH (Winnweiler, Germany) under the name Tempozz® M88. Its particle size distribution shows a median particle size d50 = 4.4 µm (Table 1). Its composition measured from XRF analysis (Table 2) indicates a ratio SiO2/Al2O3 = 2.01, which is very close to 2.00, corresponding to pure kaolinite. The XRD analysis (Figure 1) shows the characteristic background bump of an amorphous material, and two weak intensity peaks that can be attributed to the presence of small amounts of quartz (JCPDS #00-033-1161) and anatase (JCPDS #00-021-1272).
The potassium silicate used in this work comes from Wöllner GmbH (Ludwigshafen, Germany) and is named Geosil® 14517. The characteristics of the potassium silicate solution are listed in Table 3.

2.2. Preparation of Geopolymer Composites

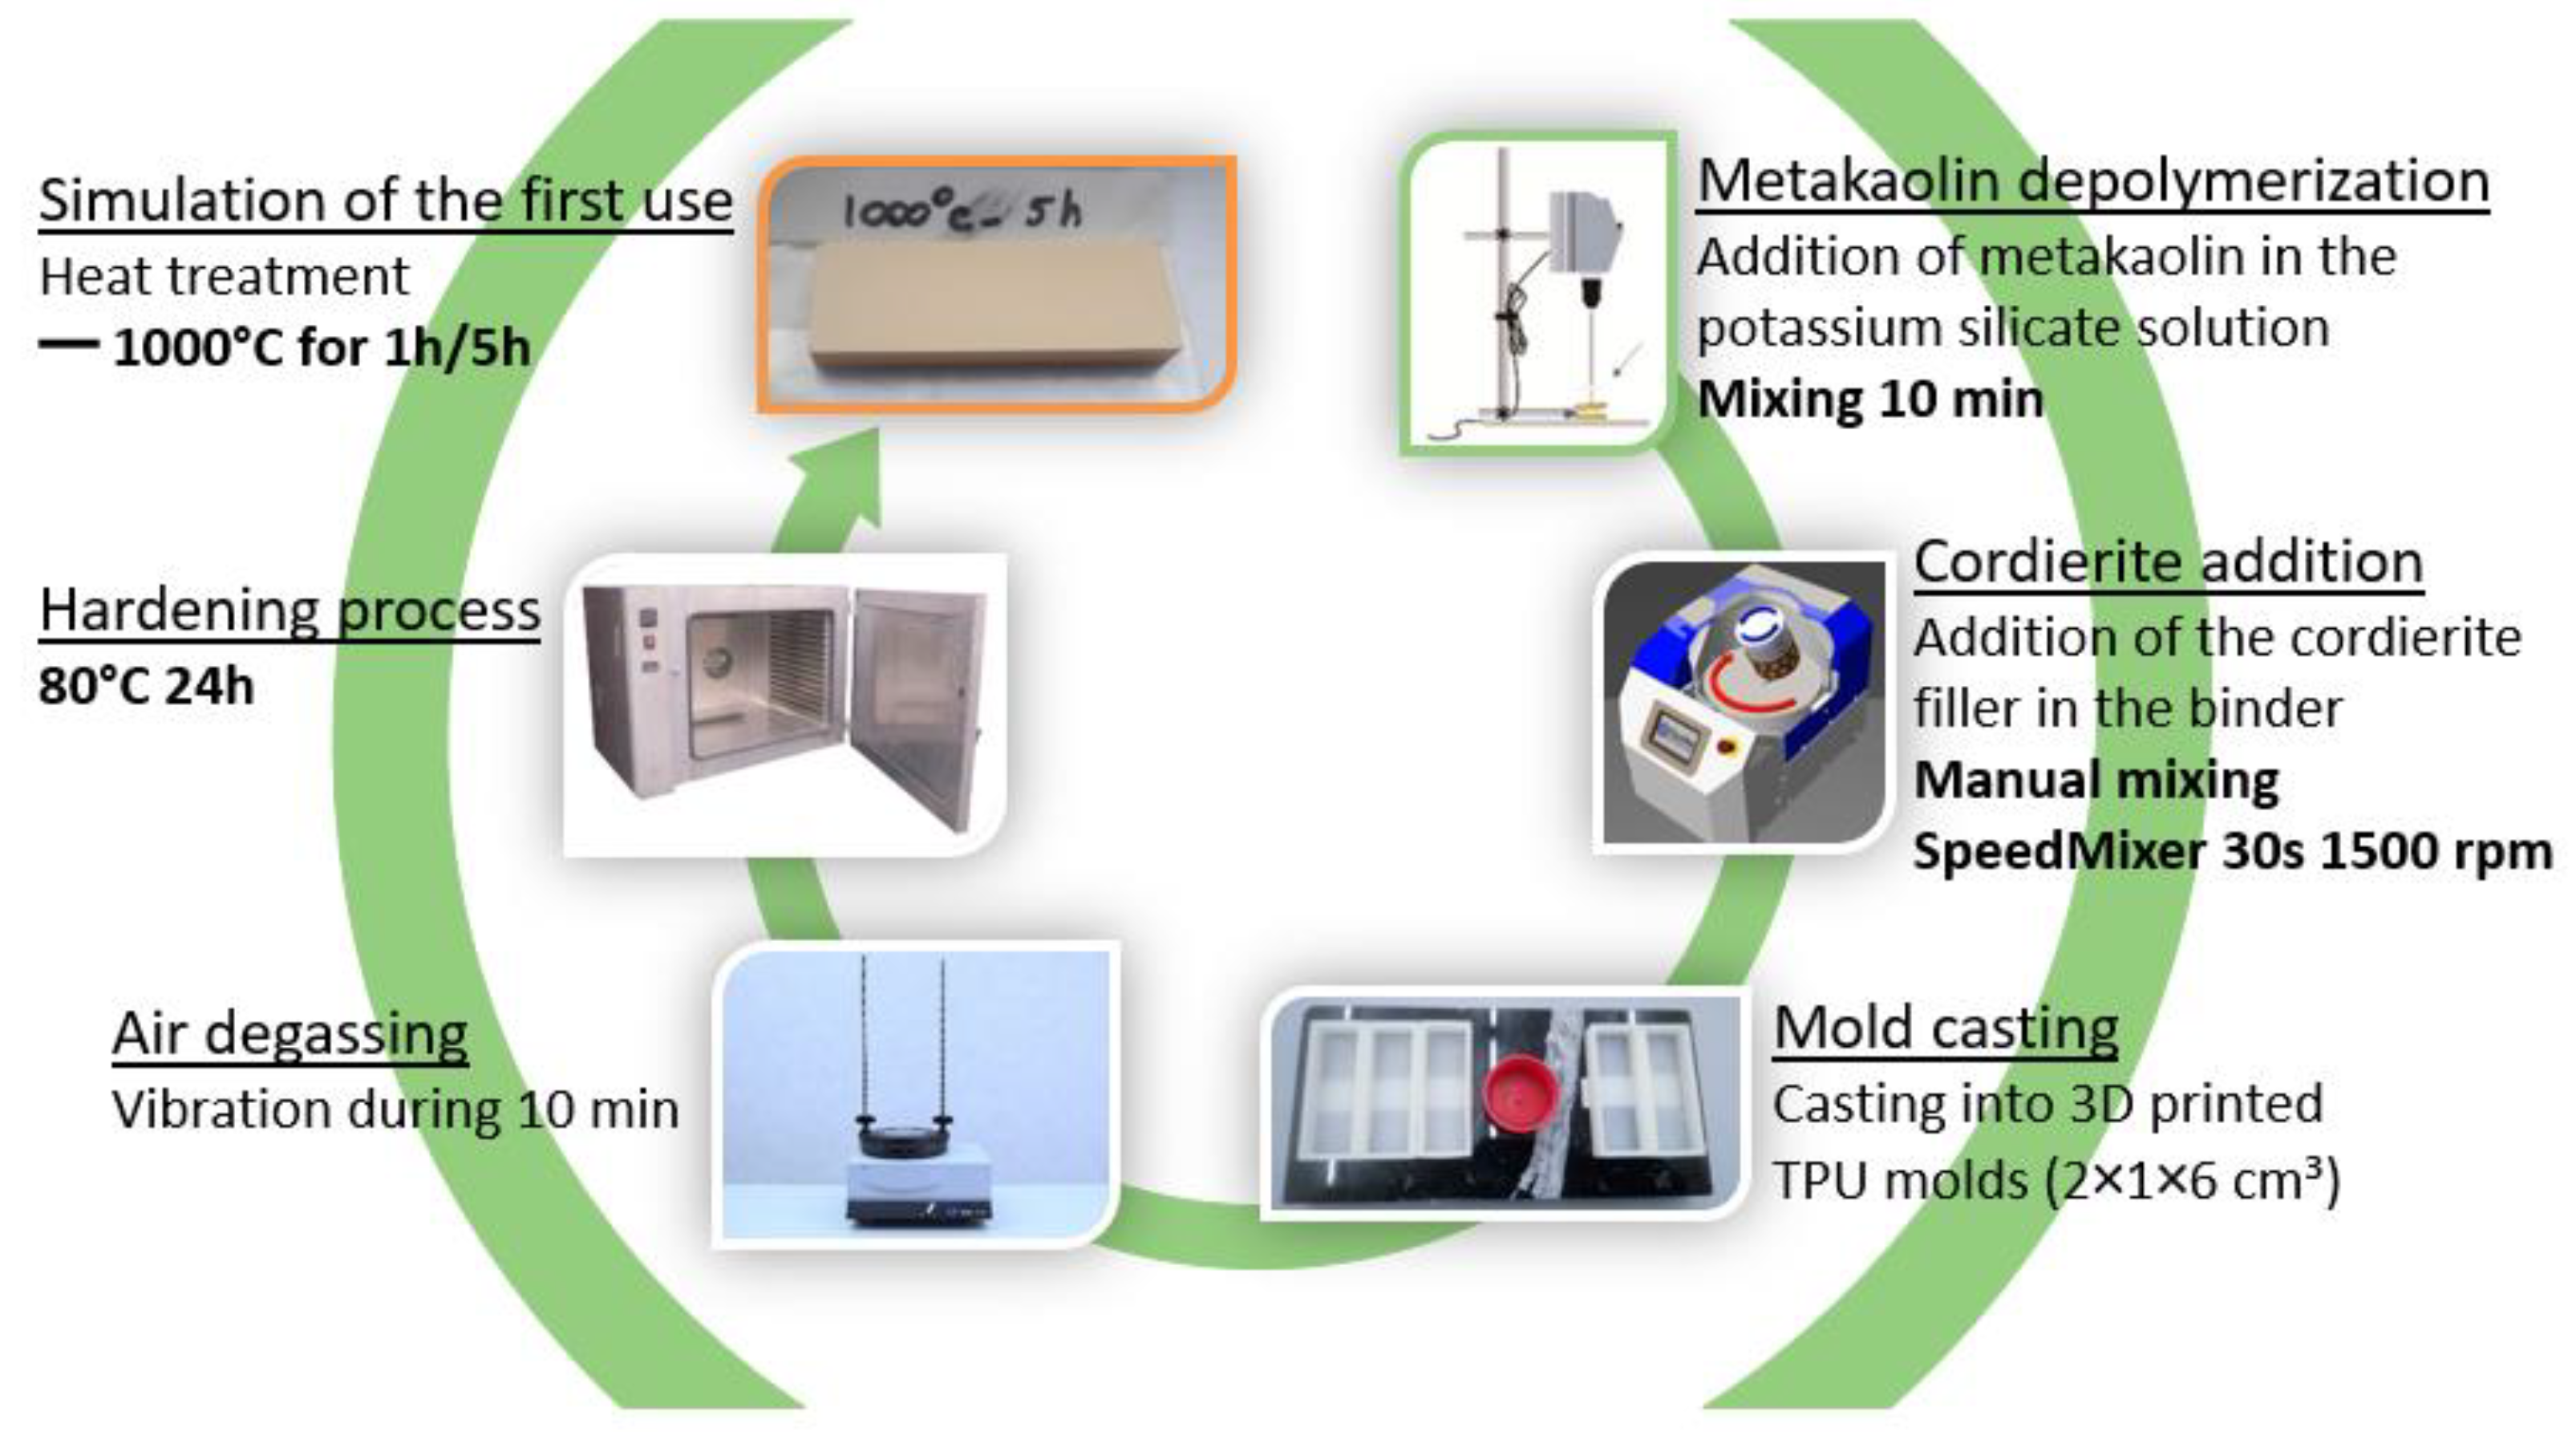
The process used for the synthesis of the geopolymer composites is shown in Figure 2.
  • Geopolymer paste:
The preparation of the geopolymer binder starts with the potassium silicate solution and the metakaolin. The metakaolin is added into the silicate solution and is mixed with a laboratory mixer for 10 min. During this stage, the depolymerization of the metakaolin takes place and there is formation of oligomers. The mixture is very fluid and easy to mix. For some samples of 100% geopolymer, no cordierite filler is added, and step 2 is skipped.
  • Cordierite addition:
When the geopolymer is ready, it is added to the cordierite powder and mixed by hand. Depending on the percentage of filler, the mixture is more difficult to mix, this is why a SpeedMixer at 1500 rpm for 30 s is used to obtain good homogeneity of the paste and avoid lumps. The geopolymer paste flows easily under agitation.
  • Mold casting
The mixture is then cast into 3D-printed TPU molds of dimensions 2 × 1 × 6 cm. The 3D-printed TPU molds are flexible and make it easier to remove the samples. They also limit the adhesion of the geopolymer paste from the walls.
  • Air degassing:
Due to its high viscosity, the geopolymer composite can capture air, which makes large pores. To prevent air in the samples, the filled molds are vibrated on a vibrating table for 10 min.
  • Hardening:
The samples are sealed in plastic bags with a water recipient to ensure constant humidity and to prevent water from evaporating. Then, the samples are kept in an oven at 80 °C for 24 h. Once the samples are cured, they are unmolded and polished at grade 120. Next, the characterization of the samples is performed.
  • Heat treatment:
To investigate the evolution of the properties of the composites during the first use at high temperature, some samples undergo heat treatment with the following conditions:
  • Heating ramp: 5 °C/min
  • Plateau: 1000 °C for 5 h
  • Cooling ramp: 5 °C/min

2.3. Investigated Compositions and Characterization Methods

The purpose of this work is to investigate the influences of (i) the K/Al ratio of the geopolymer binder and (ii) the cordierite fraction on the stability of the dimensions and porosity during heating at 1000 °C, and on the final Young’s modulus and coefficient of thermal expansion. Table 4 presents the compositions that were prepared using K/Al ratios of 0.75, 1, 1.5 and 2.3, and cordierite weight fractions of 0, 53%, 60% and 65%.
After curing, five samples of each composition are characterized in terms of:
  • Geometric apparent density da;
  • Absolute density d using a Micromeritics AccuPyc II 1340 device (Micromeritics, Norcross, GA, USA) (after milling);
  • Total porosity p calculated from the equation p = 1 − da/d;
  • Crystalline and amorphous phases by means of a Panalytical Empyrean diffractometer with a Cu kα radiation source with a range of 2θ between 9° and 35°. The detector is a PIXcel1D (RTMS detector) with an active length of 3.3473°. The step size and the counting time are 0.0131° and 8.67 s, respectively
  • Room temperature Young’s modulus E using the Impulse Excitation Technique (IET) with a GrindoSonic MK3 materials tester (Grindosonic, Heverlee, Belgium).
For each composition, the same characterization was also performed on one sample that underwent heat treatment at 1000 °C for 5 h.
For selected compositions, additional characterization techniques were applied on cured samples to follow the evolution of their properties during heat treatment at 1000 °C, with a soaking time of 1 h and heating ramp of 5 °C/min as follows:
  • Crystallographic changes by high-temperature diffraction (HT-XRD) on powdered samples by means of a Panalytical Empyrean (HTK-2000N) diffractometer with a Cu Kα radiation source with a range of 2θ between 9° and 35°. The detector is a 1Der detector (RTMS detector) with an active length of 2.1223°. The step size and the counting time are 0.0167° and 10.16 s, respectively
  • Dimension changes by dilatometry analysis on 5 × 5 × 20 mm3 samples using a Dil 402 Expedis dilatometer (Netzsch, Selb, Germany);
  • Evolution of the Young’s modulus E using a GrindoSonic MK7 non-destructive materials tester coupled with a Nabertherm furnace HT-1600 °C.

3. Results

3.1. Characterization of the Samples after Curing and after Heat Treatment

Figure 3 and Figure 4 show the pictures of the samples after curing. The top side of some samples clearly shows spherical pores that are the result of the trapping of air bubbles during the casting due to high viscosity of the paste. This is particularly the case when the K/Al ratio is low, and the cordierite fraction high. These pores influence the apparent density of the samples, and consequently their total porosity. Therefore, in this work, we will focus on the evolution of the porosity after thermal treatment, and not on the comparison of the absolute total porosity between the different compositions.
Table 5 shows the characteristics of the sample after curing (C) and after treatment (T). Due to the higher value of the absolute density of the cordierite (i.e., 2.55 g/cm3, experimentally measured by He pycnometry) by comparison to that of the geopolymer binder, the cured composites show an absolute density increasing with the cordierite load. We also note that the absolute density trend is of a decrease with increase in the K/Al ratio. After heat treatment, the differences are less, and all composites show a significant increase in the density ranging from 2.55 to 2.60 g/cm3. This difference in density influences the evolution of the porosity during the thermal treatment. The increase in the porosity is low for the composites with K/Al = 0.75 and 1, and large for K/Al = 1.5 and 2.3. Concerning the Young’s modulus, the composites with the lowest ratios (i.e., 0.75 and 1) show a strong increase in the Young’s modulus after heat treatment.
Figure 5 shows the XRD pattern of the composites with 53 wt% cordierite and K/Al = 0.75; 1.0; 1.5 and 2.3. After curing, only the diffraction peaks of cordierite are observed. After heat treatment of 5 h at 1000 °C, all the diffraction patterns highlight the presence of leucite KAlSi2O6 (JCPDS #00-038-1423), and the possibility of kalsilite KAlSiO4 (JCPDS #00-011-0579) when K/Al = 1.5 and 2.3.
The XRD patterns of the samples corresponding to K/Al = 1 and cordierite loads of 0, 53 and 60 wt% (Figure 6) evidence that the occurrence of the leucite is due to the crystallization of the geopolymer binder, whereas the presence of kalsilite after heat treatment is uncertain.
When K/Al = 2.3, the presence of kalsilite in addition to leucite is clear on the XRD patterns of the heat-treated geopolymer and of the composite loaded with 53 wt% cordierite (Figure 7). The composites loaded with 60 wt% and 65 wt% cordierite seem to contain only leucite.

3.2. HT-XRD

a.
Phases analysis
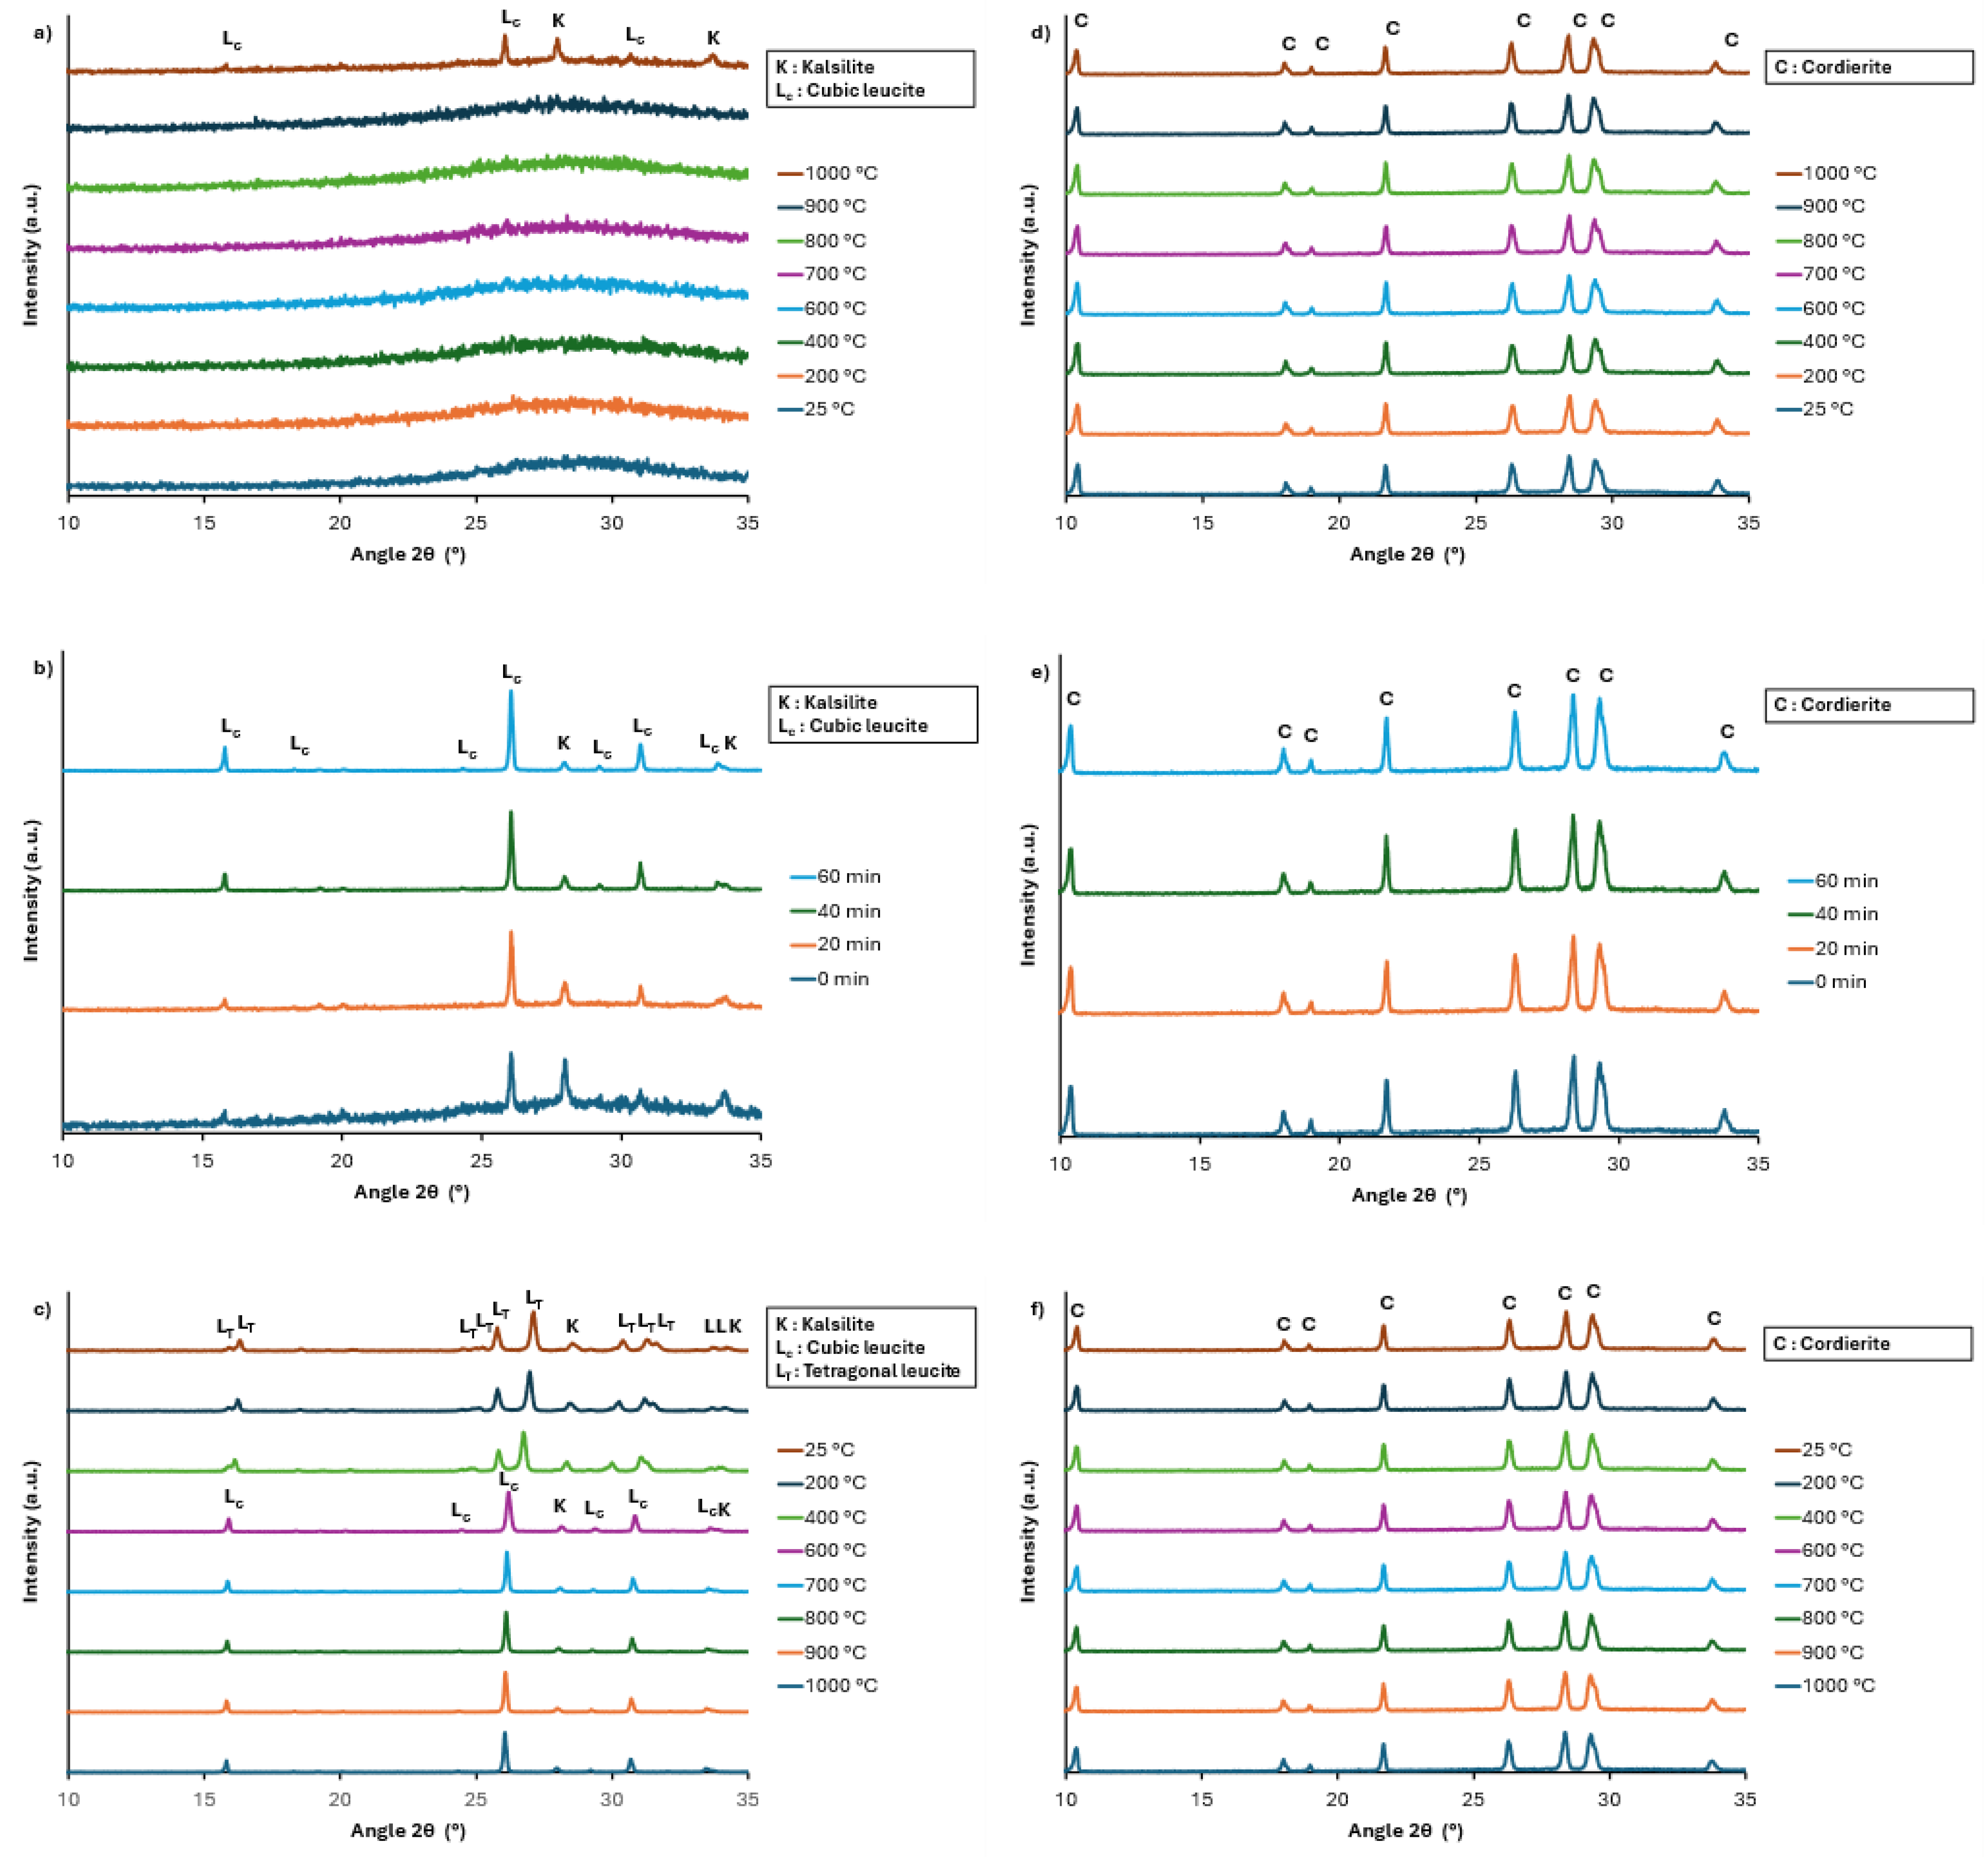
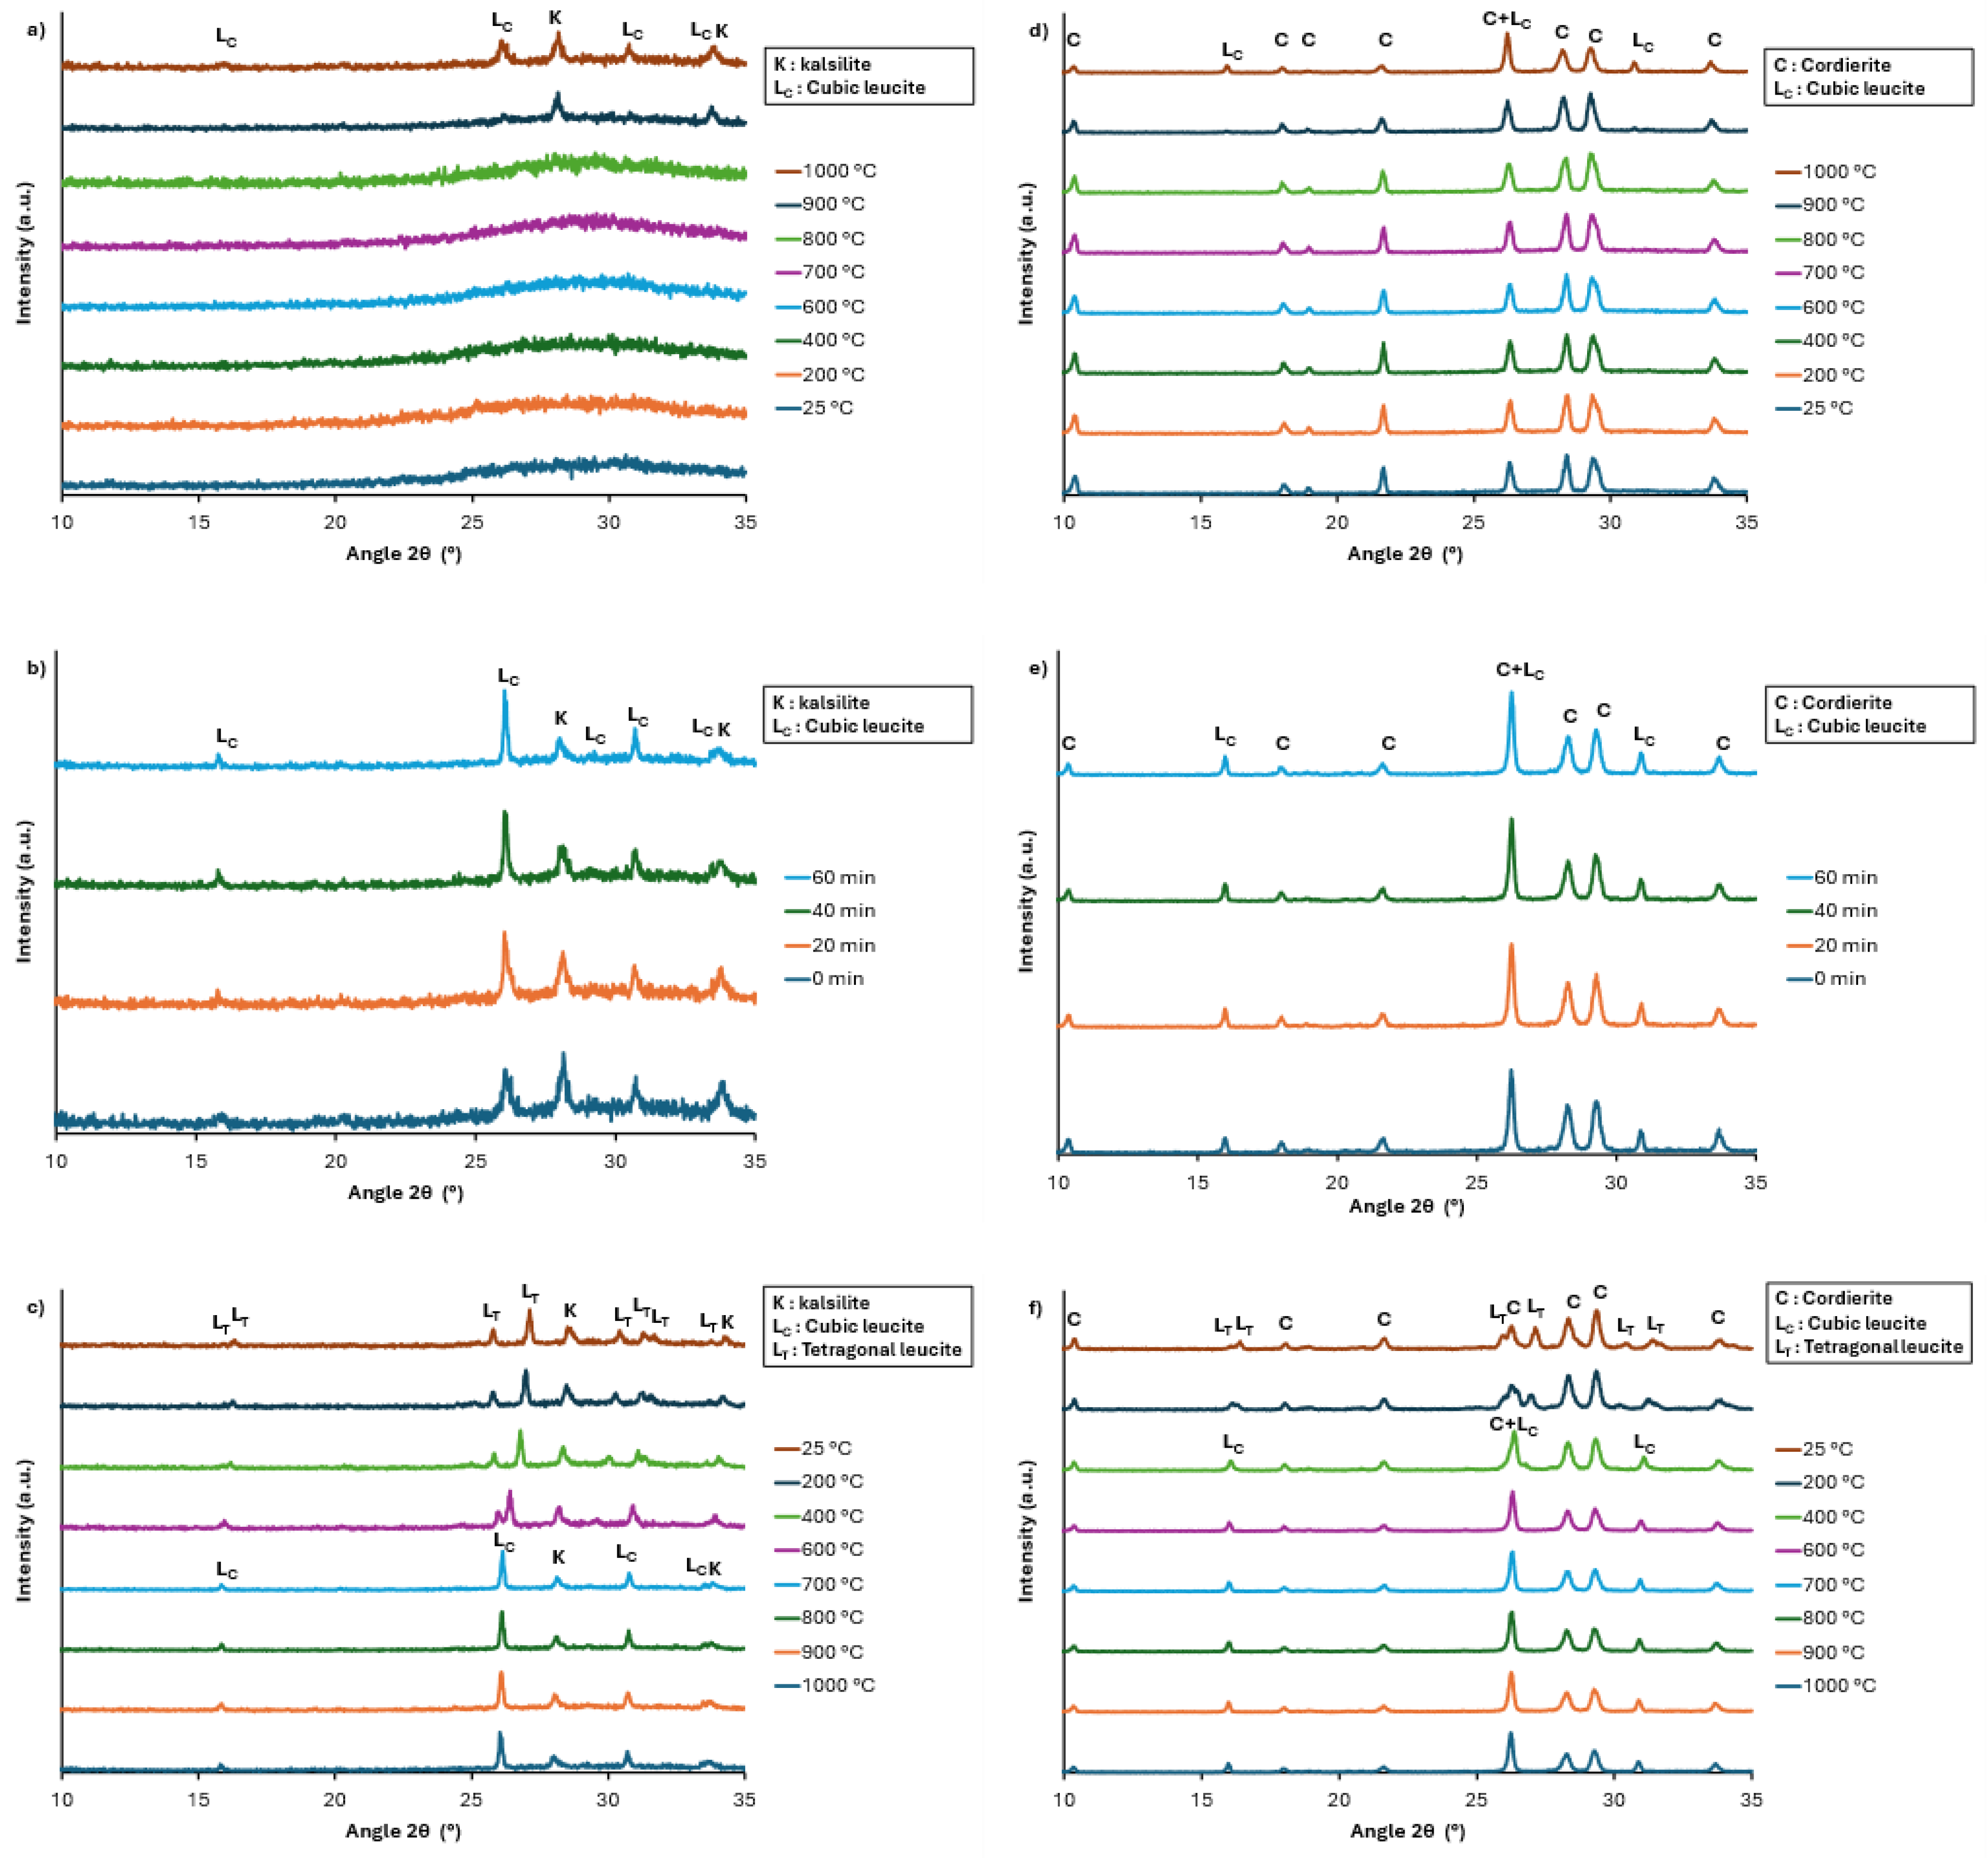
For a better understanding of the crystallographic changes occurring during the heat treatment, high-temperature XRD analysis was performed on the geopolymers and composites with 60 wt% cordierite with K/Al = 1 (Figure 8) and 2.3 (Figure 9).
For the geopolymer with K/Al = 1, the crystallization of leucite and kalsilite occurs between 900 °C and 1000 °C on heating. During the plateau, the intensities of the peaks of kalsilite decrease whereas those of leucite increase. The XRD patterns collected during the cooling to RT between 600 °C and 400 °C evidence the crystal symmetry transformation of leucite from the high-temperature cubic form (JCPDS #00-031-0967) to the low-temperature tetragonal form [33]. In the case of the composite with 60 wt% cordierite, the occurrence of kalsilite or leucite is not detected during the thermal cycle. It should be noted that the main diffraction peaks of kalsilite are convoluted with high intensity peaks of cordierite, so it is not possible to conclude with certitude the absence of a weak amount of this phase.
The HT-XRD analysis performed on the geopolymer with K/Al = 2.3 also shows the crystallization of kalsilite and leucite, but with the occurrence of kalsilite at a slightly lower temperature during heating (between 800 °C and 900 °C). As for the other geopolymer, the intensity of the peaks of leucite increases during the plateau at 1000 °C, and allotropic transformation of leucite is observed during cooling. For the composite with 60 wt% cordierite, the presence of leucite is also detected at 1000 °C during heating. The peaks of kalsilite are not observed but, as stated previously, this is possibly due to their convolution with strong peaks of cordierite.
b.
Evolution of the size of the cordierite unit cell
To evidence possible change in the unit cell parameters of the cordierite, Rietveld refinement was performed on all the HT-XRD patterns using the MAUD software (Version 2.996). Figure 10 and Table 6 and Table 7 show the evolution of the parameters a, b and c with temperature on heating and on cooling, for the cordierite powder, and for the composites with K/Al = 1 and 2.3 with 60 wt% cordierite. Table 8 and Table 9 give the values of the profile residuals calculated by the MAUD software. The graphs of Figure 10 highlight weak differences between the cordierite powder and the cordierite in the composite when the K/Al ratio of the binder is 1. By contrast, with the binder with K/Al = 2.3, all the unit cell parameters significantly increase when the temperature goes over 700 °C on heating. Moreover, the contraction of the cell during the cooling stage is slightly larger, especially along the c-axis.

3.3. Dimension Changes During the Thermal Cycle

a.
Effect of the K/Al ratio
Figure 11 shows the dilatometry curves recorded during heating up to 1000 °C, during the plateau of 1 h at 1000 °C, and on cooling to RT, for the composition with 53 wt% of cordierite and different K/Al ratios. When this ratio is 0.75 and 1, at low temperatures, the curves show a first stage corresponding to a moderate shrinkage (<2%), slowing down when the temperature increases. Next, when the temperature goes over 800 °C, a second stage leads to a rapid shrinkage greater than 2%. The plateau of 1 h at 1000 °C leads to a stabilization of the shrinkage. The curves recorded during the cooling are linear. The final shrinkage is around 5% for both compositions. When K/Al = 1.5 or 2.3, the second stage of the shrinkage starts at lower temperatures (i.e., 600 °C for K/Al = 2.3 and 700 °C for K/Al = 1.5) but stops soon after to be replaced by an expansion at higher temperatures. During the plateau, the expansion still slightly increases. During cooling, a rapid contraction is observed around 500 °C.
b.
Effect of cordierite load
Figure 12 shows the dilatometry curves recorded during heating up to 1000 °C, during the plateau of 1 h at 1000 °C, and on cooling to RT for the compositions with a ratio K/Al = 1.0 and cordierite loads of 0, 53 and 60 wt%. It is observed that the cordierite load seriously limits the shrinkage by comparison to the geopolymer alone. Moreover, the contraction observed around 500 °C for the geopolymer binder is not present for the composites.
When the ratio K/Al is 2.3, the increase in the cordierite load has no significant effect during the heating stage, but lowers the expansion observed during the soaking stage (Figure 13). On cooling, a rapid contraction around 400 °C is observed for both cordierite loads.
The coefficients of thermal expansion (CTEs) calculated from the slope of the curves recorded on cooling are given in Table 10. One notes the very high value (27.8 × 10⁻⁶ K−1) obtained for the pure geopolymer with K/Al = 1. The addition of the cordierite filler drastically lowers the CTE. The lowest value is obtained for the lowest K/Al ratio, whereas the maximum value is for K/Al = 1.5.

3.4. Evolution of the Young’s Modulus with Temperature

The evolution of the Young’s modulus E with temperature was characterized using an impulse excitation technique for compositions of different ratio K/Al and a cordierite load of 53 wt%. Figure 14 shows the relative evolution of the Young’s modulus E with respect to its initial value E0 measured at room temperature. During the heating, we observe first a slow increase in E for all compositions followed by a more rapid increase when the temperature reaches 900 °C for compositions with K/Al = 0.75 and 1. Moreover, for those two compositions, the value of E continuously rises until reaching a plateau during the soaking stage at 1000 °C and remains almost stable during cooling. For the composition with K/Al = 1.5, the value of E remains low during the plateau and rapidly decreases to its initial value on cooling.
For the binder K/Al =1, Figure 15 shows that the cordierite load has almost no influence on the evolution of the Young’s modulus during heating until the temperature reaches 1000 °C. However, during the plateau at 1000 °C, the increase in the modulus is larger for the lowest load.

4. Discussion

The HT-XRD analysis shows that for the geopolymer with K/Al = 1 (Figure 8), the crystallization of the leucite and kalsilite occurs during heating between 900 and 1000 °C. During the plateau at 1000 °C for 1 h, the amount of kalsilite decreases and that of leucite increases, thereby indicating the possible reaction (1):
K A l S i O 4 + S i O 2 K A l S i 2 O 6  
The XRD pattern of the geopolymer heat-treated at 1000 °C for 5 h (Figure 6) shows leucite as the single crystalline phase. For the composites synthesized with this geopolymer and 60 wt% cordierite, neither leucite nor kalsilite is detected during the HT-XRD analysis. When comparing the HT-XRD analysis to those performed at RT after heat treatment of 5 h (Figure 5 and Figure 6), which show the presence of weak peaks of leucite, we can conclude that the addition of cordierite to the geopolymer delays the crystallization of leucite. When K/Al = 2.3, the HT-XRD analysis evidences the crystallization of kalsilite between 800 °C and 900 °C, and leucite between 900 °C and 1000 °C during the heating stage (Figure 9). As for the geopolymer with K/Al = 1, a transformation of kalsilite to leucite occurs during the plateau of 1 h at 1000 °C. However, due to the higher potassium content, the XRD pattern of this geopolymer heat-treated during 5 h (Figure 7) still shows the presence of kalsilite. For the composites synthesized with this geopolymer and 60 wt% cordierite, the HT-XRD analysis also shows the crystallization of leucite at 1000 °C but does not allow the presence of kalsilite to be inferred. However, this latter is present on the XRD pattern of the composite heat-treated for 5 h (Figure 7). When comparing the results of the XRD analysis, according to the K/Al ratio, it is concluded that the addition of cordierite has a stronger influence on the crystallization of the geopolymer when K/Al is low. More specifically, the crystallization does not take place during the heating stage up to 1000 °C when K/Al = 1, in contrast to what happens when K/Al = 2.3. On the other hand, the calculation by Rietveld refinement of the unit cell parameters on the cordierite highlights the expansion of the cell when the temperature goes over 700 °C for the composite with K/Al = 2.3 and 60 wt% cordierite (Figure 10). This can be explained by the insertion of potassium ions in the channels of the structure of the cordierite [31,32]. This mechanism also involves the substitution of Si atoms by Al atoms in the tetrahedral sites, and possibly ends by the formation of the compound K0.5Mg2Al4.5Si4.5O18, which has a hexagonal symmetry (indialite-like):
2   M g 2 A l 4 S i 5 O 18 + 1 2 K 2 O + 1 2 A l 2 O 3 2 K 0.5 M g 2 A l 4.5 S i 4.5 O 18 + S i O 2  
The consequence is a change in the composition of the geopolymer that can modify its behavior at sintering and crystallization. This phenomenon is not observed when K/Al = 1.
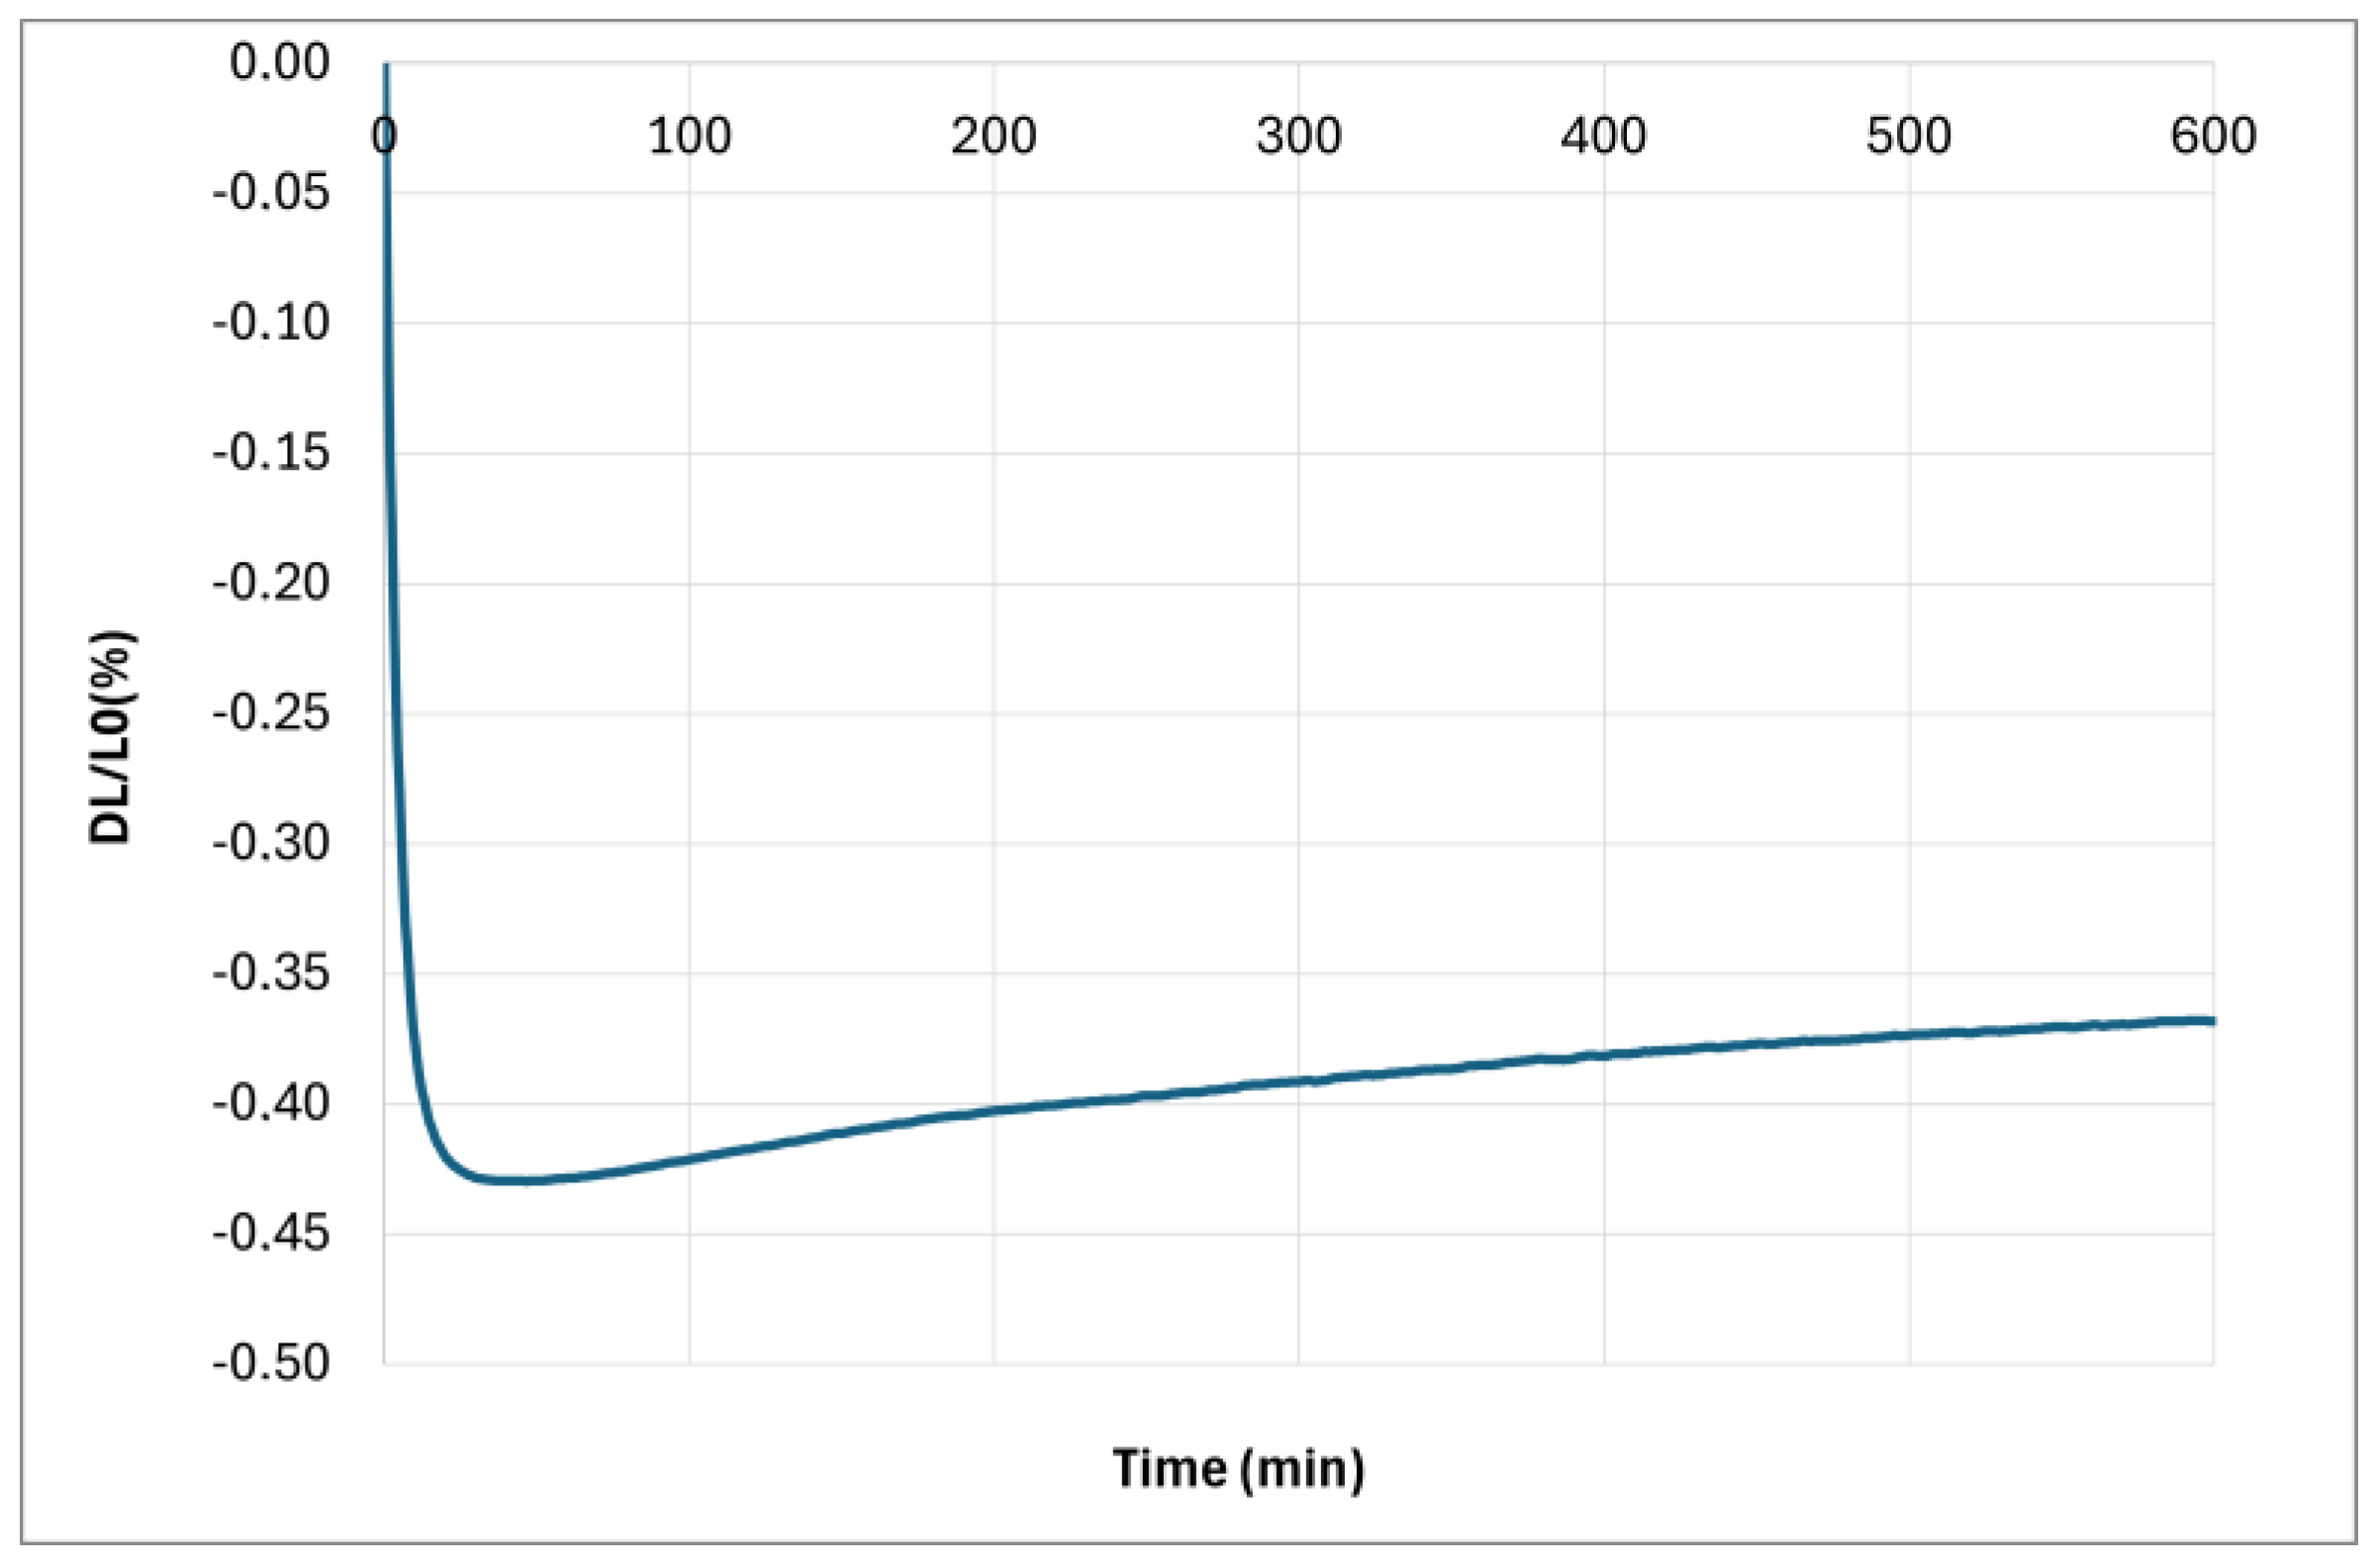
The crystallization of the geopolymer and the interaction between the geopolymer and the cordierite can explain the differences observed on the dilatometry curves (Figure 11, Figure 12 and Figure 13). Firstly, the first stage of shrinkage, from room temperature to 300 °C, is related to dehydration and dihydroxylation [25]. Secondly, the increase in the amount of K2O lowers the temperature of the beginning of the second stage of the shrinkage that can be associated with sintering of the material. This can be explained by the amorphous nature of the geopolymer that probably induces a viscous flow sintering mechanism [34,35]. On the other hand, the shrinkage due to sintering stops around 700 °C when K/Al = 2.3. This temperature corresponds to the beginning of the expansion of the unit cell of the cordierite, resulting in the diffusion of potassium ions in the structure. This phenomenon, together with the crystallization of kalsilite, lowers the K2O content in the geopolymer and thereby stops the viscous flow mechanism. Moreover, the transformation of kalsilite to leucite (Equation (1)) leads to a volume expansion due to the significantly lowest absolute density of leucite (2.47 g/cm3 against 2.60 g/cm3). The magnitude of this expansion depends on the density of the silica involved in the reaction, and consequently its state. This reaction may explain the dilatation observed on the dilatometric curves when the temperature is over 900 °C and during the plateau at 1000 °C, with dilatation enhanced by the geopolymer fraction (Figure 13). Finally, the presence of a significant amount of leucite after 1 h at 1000 °C in the composite when K/Al = 2.3 explains the non-linear contraction during the cooling by the allotropic transformation of cubic-leucite to tetragonal-leucite. It is noted that this transformation is also present for the composite with K/Al =1.5. By contrast, no diffusion of potassium ions in the cordierite nor crystallization of the geopolymer take place during the heating stage when K/Al = 1, and probably 0.75. So, a significant shrinkage due to sintering is observed between 800 °C and 1000 °C. Sintering still takes place during the plateau of 1 h at 1000 °C as the crystallization of leucite occurs later, as previously explained. To investigate the effect of this crystallization on the dimensions of the composite, a new dilatometry analysis, with a plateau of 10 h at 1000 °C, was performed. Figure 16 shows the relative variation in dimensions during the plateau. This new analysis confirms the shrinkage observed with the first analysis with a plateau of 1 h, but it also highlights a weak expansion after 1 h. If we attribute this expansion to the transformation of kalsilite to leucite, as explained previously, this leads to the inference of prior crystallization of a low amount of kalsilite.
In terms of absolute density (Table 5), after curing, the density decreases when the K/Al ratio increases because of the larger amount of potassium silicate used, which has a lower density (1.50 g/cm3) than the metakaolin (2.70 g/cm3). For a given K/Al ratio, the absolute density of the composite increases with the amount of cordierite, as the absolute density of cordierite is higher (2.55 g/cm3) than the geopolymer alone. After heat treatment, the absolute density of the composites increases due to the partial crystallization of the geopolymer in leucite (2.47 g/cm3) and/or kalsilite (2.60 g/cm3). Consequently, the variation in absolute density is larger when K/Al increases because of the lowest initial value, but also related to the presence of kalsilite in the heat-treated samples.
The differences in shrinkage, together with the differences in the evolution of the absolute density, explain why the porosity of the composite remains nearly constant when K/Al is low whereas it strongly increases when it is high (Table 5).
The fractions of leucite, kalsilite and cordierite in the composites play a key role in the coefficient of thermal expansion (CTE) (Table 10). A high fraction of cordierite and low fractions of leucite and kalsilite are favorable to a low value due to the very high CTEs of the two potassium aluminum silicates—20 × 10−6 K−1 for kalsilite, 22 × 10−6 K−1 for tetragonal leucite (above 600 °C) and 3 × 10⁻⁶ K−1 for cubic leucite (under 600 °C) [33,36]. Moreover, the CTEs given in the present work are the average values calculated between 1000 °C and RT, so they include the contraction due to the allotropic transformation of leucite. This explains the very high value measured for the pure geopolymer, but also the much lower CTEs of the composite with K/Al = 0.75 and 1 by comparison to those of the composites with K/Al = 1.5 and 2.3. The decrease in the CTE when K/Al increases from 1.5 to 2.3 is probably due to the crystallization of less leucite due to the insertion of a part of the potassium in the structure of the cordierite. This is also supported by the presence of kalsilite in the composite heat-treated during 5 h at 1000 °C, which evidences the non-complete transformation of kalsilite in leucite. One must also consider the effect of the insertion of the potassium ions and the aluminum/silicon substitution in the structure of the cordierite that possibly lowers the CTE when stabilizing the hexagonal symmetry [32]. However, the measurement of the unit cell parameters of orthorhombic cordierite derived from the HT-XRD patterns seems, by contrast, to highlight an increase in the variation with temperature (Figure 10). This point must be clarified in future work as the heating conditions could influence the relative importance of the diffusion and stabilization of the potassium ions in the cordierite structure, and their contribution to the crystallization of kalsilite and leucite.
Finally, the strong increase in the Young’s modulus of the composite with K/Al = 0.75 and 1 when the temperature goes over 900–950 °C during the heating stage of the thermal treatment (Figure 14 and Figure 15) evidences a consolidation mechanism correlated to the shrinkage due to sintering. The rapid decrease in the Young’s modulus during the cooling stage when K/Al = 1.5 occurs at the same temperature as the contraction observed on the dilatometry curve (Figure 11). This can be explained by damage due to internal stresses generated by the rapid volume change of 1.2% induced by the allotropic transformation of leucite [33].

5. Conclusions

Geopolymer composites containing 53 to 65 wt% of a recycled cordierite powder as filler were synthesized.
  • The K/Al ratio of the geopolymer plays a key role in the evolution of the dimensions and properties during thermal treatment at 1000 °C. A low K/Al ratio of 0.75 or 1 leads to shrinkage of around 5% due to sintering of the composite.
  • A higher ratio induces a reaction between the geopolymer and the cordierite filler that inhibits sintering, and greater crystallization of kalsilite and leucite. This influences the evolution of the properties.
  • A K/Al ratio of 0.75 or 1 is favorable to the stability of the porosity around 25 to 30%. Moreover, the lower amount of leucite is beneficial to a low coefficient of thermal expansion of 4 to 4.5 × 10⁻⁶ K−1. The stronger consolidation during sintering leads to a significant increase in the Young’s modulus and values of 40 to 45 GPa are obtained after heat treatment.

Author Contributions

Methodology, M.-F.G., C.L. and G.B.; investigation, F.C., A.M., S.A. and I.M.; writing—original draft preparation, F.C. and M.-F.G.; writing—review and editing, F.C., G.B. and M.-F.G.; supervision, M.-F.G.; project administration, M.-F.G.; funding acquisition, M.-F.G. All authors have read and agreed to the published version of the manuscript.

Funding

This research was partially funded by the Wallonia region and the E.U. within the FEDER-FTJ 21-27 project ECOMAT-UMONS.

Institutional Review Board Statement

Not applicable.

Informed Consent Statement

Not applicable.

Data Availability Statement

The original contributions presented in the study are included in the article, further inquiries can be directed to the corresponding authors.

Conflicts of Interest

The authors declare no conflicts of interest.

References

  1. Wang, H.; Wang, S.; Meng, Z.; Chen, Z.; Liu, L.; Wang, X.; Qian, D.; Xing, Y. Mechanism of Cordierite Formation Obtained by High Temperature Sintering Technique. Ceram. Int. 2023, 49, 20544–20555. [Google Scholar] [CrossRef]
  2. Camerucci, M.A.; Urretavizcaya, G.; Castro, M.S.; Cavalieri, A.L. Electrical Properties and Thermal Expansion of Cordierite and Cordierite-Mullite Materials. J. Eur. Ceram. Soc. 2001, 21, 2917–2923. [Google Scholar] [CrossRef]
  3. Evans, D.L.; Fischer, G.R.; Geiger, J.E.; Martin, F.W. Thermal Expansions and Chemical Modifications of Cordierite. J. Am. Ceram. Soc. 1980, 63, 629–634. [Google Scholar] [CrossRef]
  4. Rohan, P.; Neufuss, K.; Matějíček, J.; Dubský, J.; Prchlík, L.; Holzgartner, C. Thermal and Mechanical Properties of Cordierite, Mullite and Steatite Produced by Plasma Spraying. Ceram. Int. 2004, 30, 597–603. [Google Scholar] [CrossRef]
  5. Hosseini, S.; Moghaddas, H.; Masoudi Soltani, S.; Kheawhom, S. Technological Applications of Honeycomb Monoliths in Environmental Processes: A Review. Process. Saf. Environ. Prot. 2020, 133, 286–300. [Google Scholar] [CrossRef]
  6. Zhou, T.; Li, L.; Cheng, J.; Hao, Z. Preparation of Binary Washcoat Deposited on Cordierite Substrate for Catalytic Applications. Ceram. Int. 2010, 36, 529–534. [Google Scholar] [CrossRef]
  7. Fuji, M.; Shiroki, Y.; Menchavez, R.L.; Takegami, H.; Takahashi, M.; Suzuki, H.; Izuhara, S.; Yokoyama, T. Fabrication of Cordierite Filter by In-Situ Solidification for High Temperature Dust Collection. Powder Technol. 2007, 172, 57–62. [Google Scholar] [CrossRef]
  8. Nazarova, E.A.; Alimova, D.S.; Mikhaylov, V.I.; Krivoshapkina, E.F.; Krivoshapkin, P.V. Macroporous Ceramic Filters from Mineral Raw Materials for Machine Oils Filtration. Ceram. Int. 2019, 45 Pt A, 8767–8773. [Google Scholar] [CrossRef]
  9. Robles-Lorite, L.; Dorado-Vicente, R.; Torres-Jiménez, E.; Bombek, G.; Lešnik, L. Recent Advances in the Development of Automotive Catalytic Converters: A Systematic Review. Energies 2023, 16, 6425. [Google Scholar] [CrossRef]
  10. Williams, J.L. Monolith Structures, Materials, Properties and Uses. Catal. Today 2001, 69, 3–9. [Google Scholar] [CrossRef]
  11. Trinh, H.B.; Lee, J.; Suh, Y.; Lee, J. A Review on the Recycling Processes of Spent Auto-Catalysts: Towards the Development of Sustainable Metallurgy. Waste Manag. 2020, 114, 148–165. [Google Scholar] [CrossRef] [PubMed]
  12. Camerucci, M.A.; Urretavizcaya, G.; Cavalieri, A.L. Sintering of Cordierite Based Materials. Ceram. Int. 2003, 29, 159–168. [Google Scholar] [CrossRef]
  13. Ogiwara, T.; Noda, Y.; Shoji, K.; Kimura, O. Low Temperature Sintering of α-Cordierite Ceramics with Low Thermal Expansion Using Li2O–Bi2O3 as a Sintering Additive. J. Ceram. Soc. Jpn. 2011, 119, 557–562. [Google Scholar] [CrossRef]
  14. Duxson, P.; Fernández-Jiménez, A.; Provis, J.L.; Lukey, G.C.; Palomo, A.; van Deventer, J.S.J. Geopolymer Technology: The Current State of the Art. J. Mater. Sci. 2007, 42, 2917–2933. [Google Scholar] [CrossRef]
  15. Provis, J.L.; Van Deventer, J.S.J. 1—Introduction to Geopolymers. In Geopolymers; Provis, J.L., van Deventer, J.S.J., Eds.; Woodhead Publishing: Cambridge, UK, 2009; pp. 1–11. [Google Scholar] [CrossRef]
  16. Davidovits, J. Geopolymers: Ceramic-like Inorganic Polymers. J. Ceram. Sci. Technol. 2017, 8, 335–350. [Google Scholar] [CrossRef]
  17. Yuan, J.; Li, L.; He, P.; Chen, Z.; Lao, C.; Jia, D.; Zhou, Y. Effects of Kinds of Alkali-Activated Ions on Geopolymerization Process of Geopolymer Cement Pastes. Constr. Build. Mater. 2021, 293, 123536. [Google Scholar] [CrossRef]
  18. Farooq, F.; Jin, X.; Faisal Javed, M.; Akbar, A.; Izhar Shah, M.; Aslam, F.; Alyousef, R. Geopolymer Concrete as Sustainable Material: A State of the Art Review. Constr. Build. Mater. 2021, 306, 124762. [Google Scholar] [CrossRef]
  19. Djangang, C.N.; Tealdi, C.; Cattaneo, A.S.; Mustarelli, P.; Kamseu, E.; Leonelli, C. Cold-Setting Refractory Composites from Cordierite and Mullite–Cordierite Design with Geopolymer Paste as Binder: Thermal Behavior and Phase Evolution. Mater. Chem. Phys. 2015, 154, 66–77. [Google Scholar] [CrossRef]
  20. Mohd Mortar, N.A.; Abdullah, M.M.; Abdul Razak, R.; Abd Rahim, S.Z.; Aziz, I.H.; Nabiałek, M.; Jaya, R.P.; Semenescu, A.; Mohamed, R.; Ghazali, M.F. Geopolymer Ceramic Application: A Review on Mix Design, Properties and Reinforcement Enhancement. Materials 2022, 15, 7567. [Google Scholar] [CrossRef]
  21. Bernal, S.A.; Rodríguez, E.D.; Mejía de Gutiérrez, R.; Gordillo, M.; Provis, J.L. Mechanical and Thermal Characterisation of Geopolymers Based on Silicate-Activated Metakaolin/Slag Blends. J. Mater. Sci. 2011, 46, 5477–5486. [Google Scholar] [CrossRef]
  22. Lahoti, M.; Wong, K.K.; Yang, E.-H.; Tan, K.H. Effects of Si/Al Molar Ratio on Strength Endurance and Volume Stability of Metakaolin Geopolymers Subject to Elevated Temperature. Ceram. Int. 2018, 44, 5726–5734. [Google Scholar] [CrossRef]
  23. Kamseu, E.; Rizzuti, A.; Leonelli, C.; Perera, D. Enhanced Thermal Stability in K2O-Metakaolin-Based Geopolymer Concretes by Al2O3 and SiO2 Fillers Addition. J. Mater. Sci. 2010, 45, 1715–1724. [Google Scholar] [CrossRef]
  24. Hemra, K.; Aungkavattana, P. Effect of Cordierite Addition on Compressive Strength and Thermal Stability of Metakaolin Based Geopolymer. Adv. Powder Technol. 2016, 27, 1021–1026. [Google Scholar] [CrossRef]
  25. Bernal, S.; Deventer, J.; Provis, J. What Happens to 5 Year Old Metakaolin Geopolymers? The Effect of Alkali Cation; Springer: Dordrecht, The Netherlands, 2015; Volume 10. [Google Scholar] [CrossRef]
  26. Kohout, J.; Koutník, P.; Hájková, P.; Kohoutová, E.; Soukup, A. Effect of K/Al Molar Ratio on the Thermo-Mechanical Properties of Metakaolinite-Based Geopolymer Composites. Polymers 2021, 13, 3754. [Google Scholar] [CrossRef]
  27. Chen, W.; Garofalo, A.C.; Geng, H.; Liu, Y.; Wang, D.; Li, Q. Effect of High Temperature Heating on the Microstructure and Performance of Cesium-Based Geopolymer Reinforced by Cordierite. Cem. Concr. Compos. 2022, 129, 104474. [Google Scholar] [CrossRef]
  28. Bai, C.; Li, B.; Ma, C.; Li, X.; Wang, X.; Wang, B.; Yang, K.; Colombo, P. Open-Cell Cordierite-Based Foams from Eco-Friendly Geopolymer Precursors via Replica Route. Ceram. Int. 2024, 50 Pt A, 15340–15347. [Google Scholar] [CrossRef]
  29. Gasmi, A.; Pélegris, C.; Davidovits, R.; Guessasma, M.; Tortajada, H.; Jean, F. Advanced Refinement of Geopolymer Composites for Enhanced 3D Printing via In-Depth Rheological Insights. Ceramics 2024, 7, 1316–1339. [Google Scholar] [CrossRef]
  30. Kovacev, N.; Doustdar, O.; Li, S.; Tsolakis, A.; Herreros, J.M.; Essa, K. The Synergy between Substrate Architecture of 3D-Printed Catalytic Converters and Hydrogen for Low-Temperature Aftertreatment Systems. Chem. Eng. Sci. 2023, 269, 118490. [Google Scholar] [CrossRef]
  31. Mercurio, D.; Thomas, P.; Mercurio, J.P.; Frit, B.; Kim, Y.H.; Roult, G. Powder Neutron Diffraction Study of the Thermal Expansion of a K-Substituted Cordierite. J. Mater. Sci. 1989, 24, 3976–3983. [Google Scholar] [CrossRef]
  32. Kim, Y.H.; Mercurio, D.; Mercurio, J.P.; Frit, B. Structural Study of a K-Substituted Synthetic Cordierite. Mater. Res. Bull. 1984, 19, 209–217. [Google Scholar] [CrossRef]
  33. El-Meliegy, E.; van Noort, R. Leucite Glass-Ceramics. In Glasses and Glass Ceramics for Medical Applications; El-Meliegy, E., van Noort, R., Eds.; Springer: New York, NY, USA, 2012; pp. 167–192. [Google Scholar] [CrossRef]
  34. Duxson, P.; Lukey, G.C.; van Deventer, J.S.J. Thermal Evolution of Metakaolin Geopolymers: Part 1—Physical Evolution. J. Non-Cryst. Solids 2006, 352, 5541–5555. [Google Scholar] [CrossRef]
  35. Duxson, P.; Lukey, G.C.; van Deventer, J.S.J. The Thermal Evolution of Metakaolin Geopolymers: Part 2—Phase Stability and Structural Development. J. Non-Cryst. Solids 2007, 353, 2186–2200. [Google Scholar] [CrossRef]
  36. Ota, T.; Takebayashi, T.; Takahashi, M.; Hikichi, Y.; Suzuki, H. High Thermal Expansion KAlSiO4 Ceramic. J. Mater. Sci. 1996, 31, 1431–1433. [Google Scholar] [CrossRef]
Figure 1. XRD patterns of the cordierite powder and metakaolin powders.
Ceramics 07 00098 g001
Figure 2. Process used for the synthesis of the geopolymer composites.
Ceramics 07 00098 g002
Figure 3. Pictures of samples with 53%wt (a) and 60%wt (b) with different K/Al ratio.
Ceramics 07 00098 g003
Figure 4. Pictures of samples with K/Al ratio of 1 (a) and 2.3 (b) with different amounts in cordierite.
Ceramics 07 00098 g004
Figure 5. XRD patterns of the composites with 53 wt% cordierite and K/Al = 0.75, 1.0, 1.5 and 2.3 after curing (a) and after heat treatment (b).
Ceramics 07 00098 g005
Figure 6. XRD patterns of the composite with K/Al = 1 and cordierite loads of 0, 53 and 60 wt% after curing (a) and after heat treatment (b).
Ceramics 07 00098 g006
Figure 7. XRD patterns of the composites with K/Al = 2.3 and cordierite loads of 0, 53, 60 and 65 wt% after curing (a) and after heat treatment (b).
Ceramics 07 00098 g007
Figure 8. HT-XRD analysis of the geopolymer (ac) and composite (df) with K/Al =1 with heating until 1000 °C (a,d), plateau at 1000 °C (b,e) and cooling to RT (c,f).
Ceramics 07 00098 g008
Figure 9. HT-XRD analysis of the geopolymer (ac) and composite (df) with K/Al = 2.3 with heating until 1000 °C (a,d), plateau at 1000 °C (b,e) and cooling to RT (c,f).
Ceramics 07 00098 g009
Figure 10. Evolution of the unit cell parameters (ac) of cordierite on heating (left) and on cooling (right) for the cordierite powder, and for the composites with K/Al = 1 and 2.3 with 60 wt% cordierite.
Ceramics 07 00098 g010
Figure 11. Dilatometry curves during heating up to 1000 °C, during the plateau at 1000 °C for 1 h, and on cooling to RT for the compositions with 53 wt% of cordierite and K/Al = 0.75, 1, 1.5 and 2.3.
Ceramics 07 00098 g011
Figure 12. Dilatometry curves recorded during heating up to 1000 °C, during the plateau at 1000 °C for 1 h, and on cooling to RT for the compositions with a ratio K/Al = 1 and cordierite loads of 0, 53 and 60 wt%.
Ceramics 07 00098 g012
Figure 13. Dilatometry curves recorded during heating up to 1000 °C, during the plateau at 1000 °C for 1 h, and on cooling to RT for the compositions with a ratio K/Al = 2.3 and cordierite loads of 53 and 60 wt%.
Ceramics 07 00098 g013
Figure 14. Evolution of the Young’s modulus E during heating up to 1000 °C, during the plateau at 1000 °C for 1 h, and during the cooling to RT for the compositions with 53 wt% of cordierite and K/Al = 0.75, 1 and 1.5.
Ceramics 07 00098 g014
Figure 15. Effect of the cordierite load on the evolution of the Young’s modulus E during heating up to 1000 °C, during the plateau at 1000 °C for 1 h, and during cooling at RT for compositions with K/Al = 1 and a load of cordierite of 53 and 60 wt%.
Ceramics 07 00098 g015
Figure 16. Relative variation in dimension of the composite with K/Al = 1 and 53 wt% cordierite during a plateau of 10 h at 1000 °C.
Ceramics 07 00098 g016
Table 1. Particle size distribution of the cordierite and metakaolin powders.
D10 (µm)D50 (µm)D90 (µm)
Cordierite3.226.961.2
Metakaolin1.24.418.9
Table 2. Equivalent oxide composition (%mol) of the cordierite and metakaolin powders.
MgOSiO2Al2O3Fe2O3TiO2CaOOther
Cordierite powder21.755.721.40.30.30.10.5
Theoretical cordierite225622////
Metakaolin powder0.165.332.40.31.20.50.3
Table 3. Characteristics of the potassium silicate solution at 20 °C.
SiO2/K2O (Molar Ratio)Water
Fraction (wt%)
Density (g/cm3)pHViscosity (mPa·s)
Geosil 145171.7551.512.520
Table 4. The different compositions investigated, and the characterization techniques performed.
wt% Cordierite
0536065
K/Al0.75 P + D + I
1P + D + XP + D + IP + D + X + I
1.5 P + D + I
2.3(*) XP + DP + D + XP
P: Density/porosity/Young’s modulus after curing and after heat treatment; D = Dimension changes by dilatometry; X = HT-XRD; I = Measurement of E by IET in temperature; (*) In the case of the ratio K/Al = 2.3, without cordierite, the samples obtained after curing were seriously cracked, and it was not possible to perform most of the characterizations.
Table 5. Characteristics of the samples before (C) and after (T) heat treatment.
SampleApparent Density (g/cm3)Absolute Density (g/cm3)Porosity (%)Young’s Modulus (GPa)
CTCTCTCT
0–11.392.202.112.483412815
0–2.30--1.92-----
53–0.751.801.892.352.5723262032
53–1.001.771.892.362.5325252146
53–1.501.671.612.342.5728371416
53–2.301.921.562.242.581439913
60–1.001.781.812.362.5424292337
60–2.301.881.622.272.5918381114
65–2.301.871.682.312.6019361617
Table 6. Unit cell parameters of the cordierite measured by Rietveld refinement on the HT-XRD patterns of the cordierite powder and the composites 1–60 and 2.3–60 during heating.
Temperature Heating (°C)
252004006007008009001000
Cordieritea (pm)1703.91704.21705.31706.51707.01707.71708.31708.9
b (pm)973.8974.0974.7975.3975.7976.1976.5976.9
c (pm)933.9933.4933.2932.9932.9932.8932.8932.7
1–60a (pm)1704.11704.71705.61706.61707.11708.01708.41708.8
b (pm)973.3973.7974.3975.0975.3976.0976.9977.4
c (pm)933.6933.3933.1932.9932.9933.1933.4933.6
2.3–60a (pm)1704.81705.31706.11707.21708.01710.41711.21712.8
b (pm)973.5973.5974.3975.0975.3976.9978.7979.6
c (pm)934.2933.6933.4933.4933.5934.8937.0937.8
Table 7. Unit cell parameters of the cordierite measured by Rietveld refinement on the HT-XRD patterns of the cordierite powder and the composites 1–60 and 2.3–60 during cooling.
Temperature Cooling (°C)
100090080070060040020025
Cordieritea (pm)1708.71708.21707.41706.91706.31705.21704.01703.5
b (pm)976.9976.4976.0975.8975.4974.7974.0973.8
c (pm)932.6932.7932.7932.9933.0933.1933.4933.9
1–60a (pm)1708.61708.31707.71707.21706.61705.71704.41704.0
b (pm)977.7977.3977.2976.6976.3975.8975.2974.7
c (pm)933.5933.6933.6933.5933.4933.4933.7934.0
2.3–60a (pm)1712.61711.81710.81709.91708.31706.91706.01705.5
b (pm)979.6979.2978.8978.1977.4976.0975.6976.0
c (pm)937.7937.3937.0936.1935.6935.0935.1936.4
Table 8. Weighted profile residual Rwp, Bragg residual Rb, and expected profile residual Rexp of the Rietveld refinement performed on the XT-XRD patterns of the cordierite powder and of the composites 10–60 and 23–60 during heating.
Temperature Heating (°C)
252004006007008009001000
CordieriteRwp (%)17.3718.1018.3418.5918.9918.3318.6318.67
Rb (%)11.7512.1212.4812.3012.7712.2912.3112.54
Rexp (%)10.4010.5310.5410.6210.5710.5910.5910.54
1–60Rwp (%)12.2813.2313.9313.8513.7013.9814.3414.68
Rb (%)9.079.6310.0810.0810.0510.2910.8011.16
Rexp (%)9.9210.1210.2810.3910.4010.3910.4010.43
2.3–60Rwp (%)13.8214.5614.7815.6115.0515.6315.7017.35
Rb (%)10.0310.4510.5411.2010.6110.8211.4412.53
Rexp (%)11.8212.0412.2412.3412.3212.3512.3512.42
Table 9. Weighted profile residual Rwp, Bragg residual Rb, and expected profile residual Rexp of the Rietveld refinement performed on the XT-XRD patterns of the cordierite powder and of the composites 10–60 and 23–60 during cooling.
Temperature Cooling (°C)
100090080070060040020025
CordieriteRwp (%)19.3018.6419.0818.9218.9918.3218.2317.32
Rb (%)12.8612.3912.9812.7112.8412.1612.2711.81
Rexp (%)10.5510.4910.4710.4510.3810.3410.2510.02
1–60Rwp (%)14.6814.6114.7214.2414.2414.0913.3813.02
Rb (%)11.2011.2111.1410.7510.7510.6310.159.89
Rexp (%)10.4410.4010.3910.3510.3510.2410.159.90
2.3–60Rwp (%)17.5616.9117.4216.4517.1816.8215.7413.64
Rb (%)12.4812.0312.5612.9312.3512.7411.7610.14
Rexp (%)12.3412.2312.1512.1212.0911.9311.7711.50
Table 10. Average coefficient of thermal expansion (CTE) calculated between 1000 °C and RT during cooling after thermal treatment at 1000 °C for 1 h.
CTE (10−6 K−1)wt% Cordierite
05360
K/Al0.75-4.0-
127.84.64.1
1.5-6.7-
2.3-5.95.2
Disclaimer/Publisher’s Note: The statements, opinions and data contained in all publications are solely those of the individual author(s) and contributor(s) and not of MDPI and/or the editor(s). MDPI and/or the editor(s) disclaim responsibility for any injury to people or property resulting from any ideas, methods, instructions or products referred to in the content.