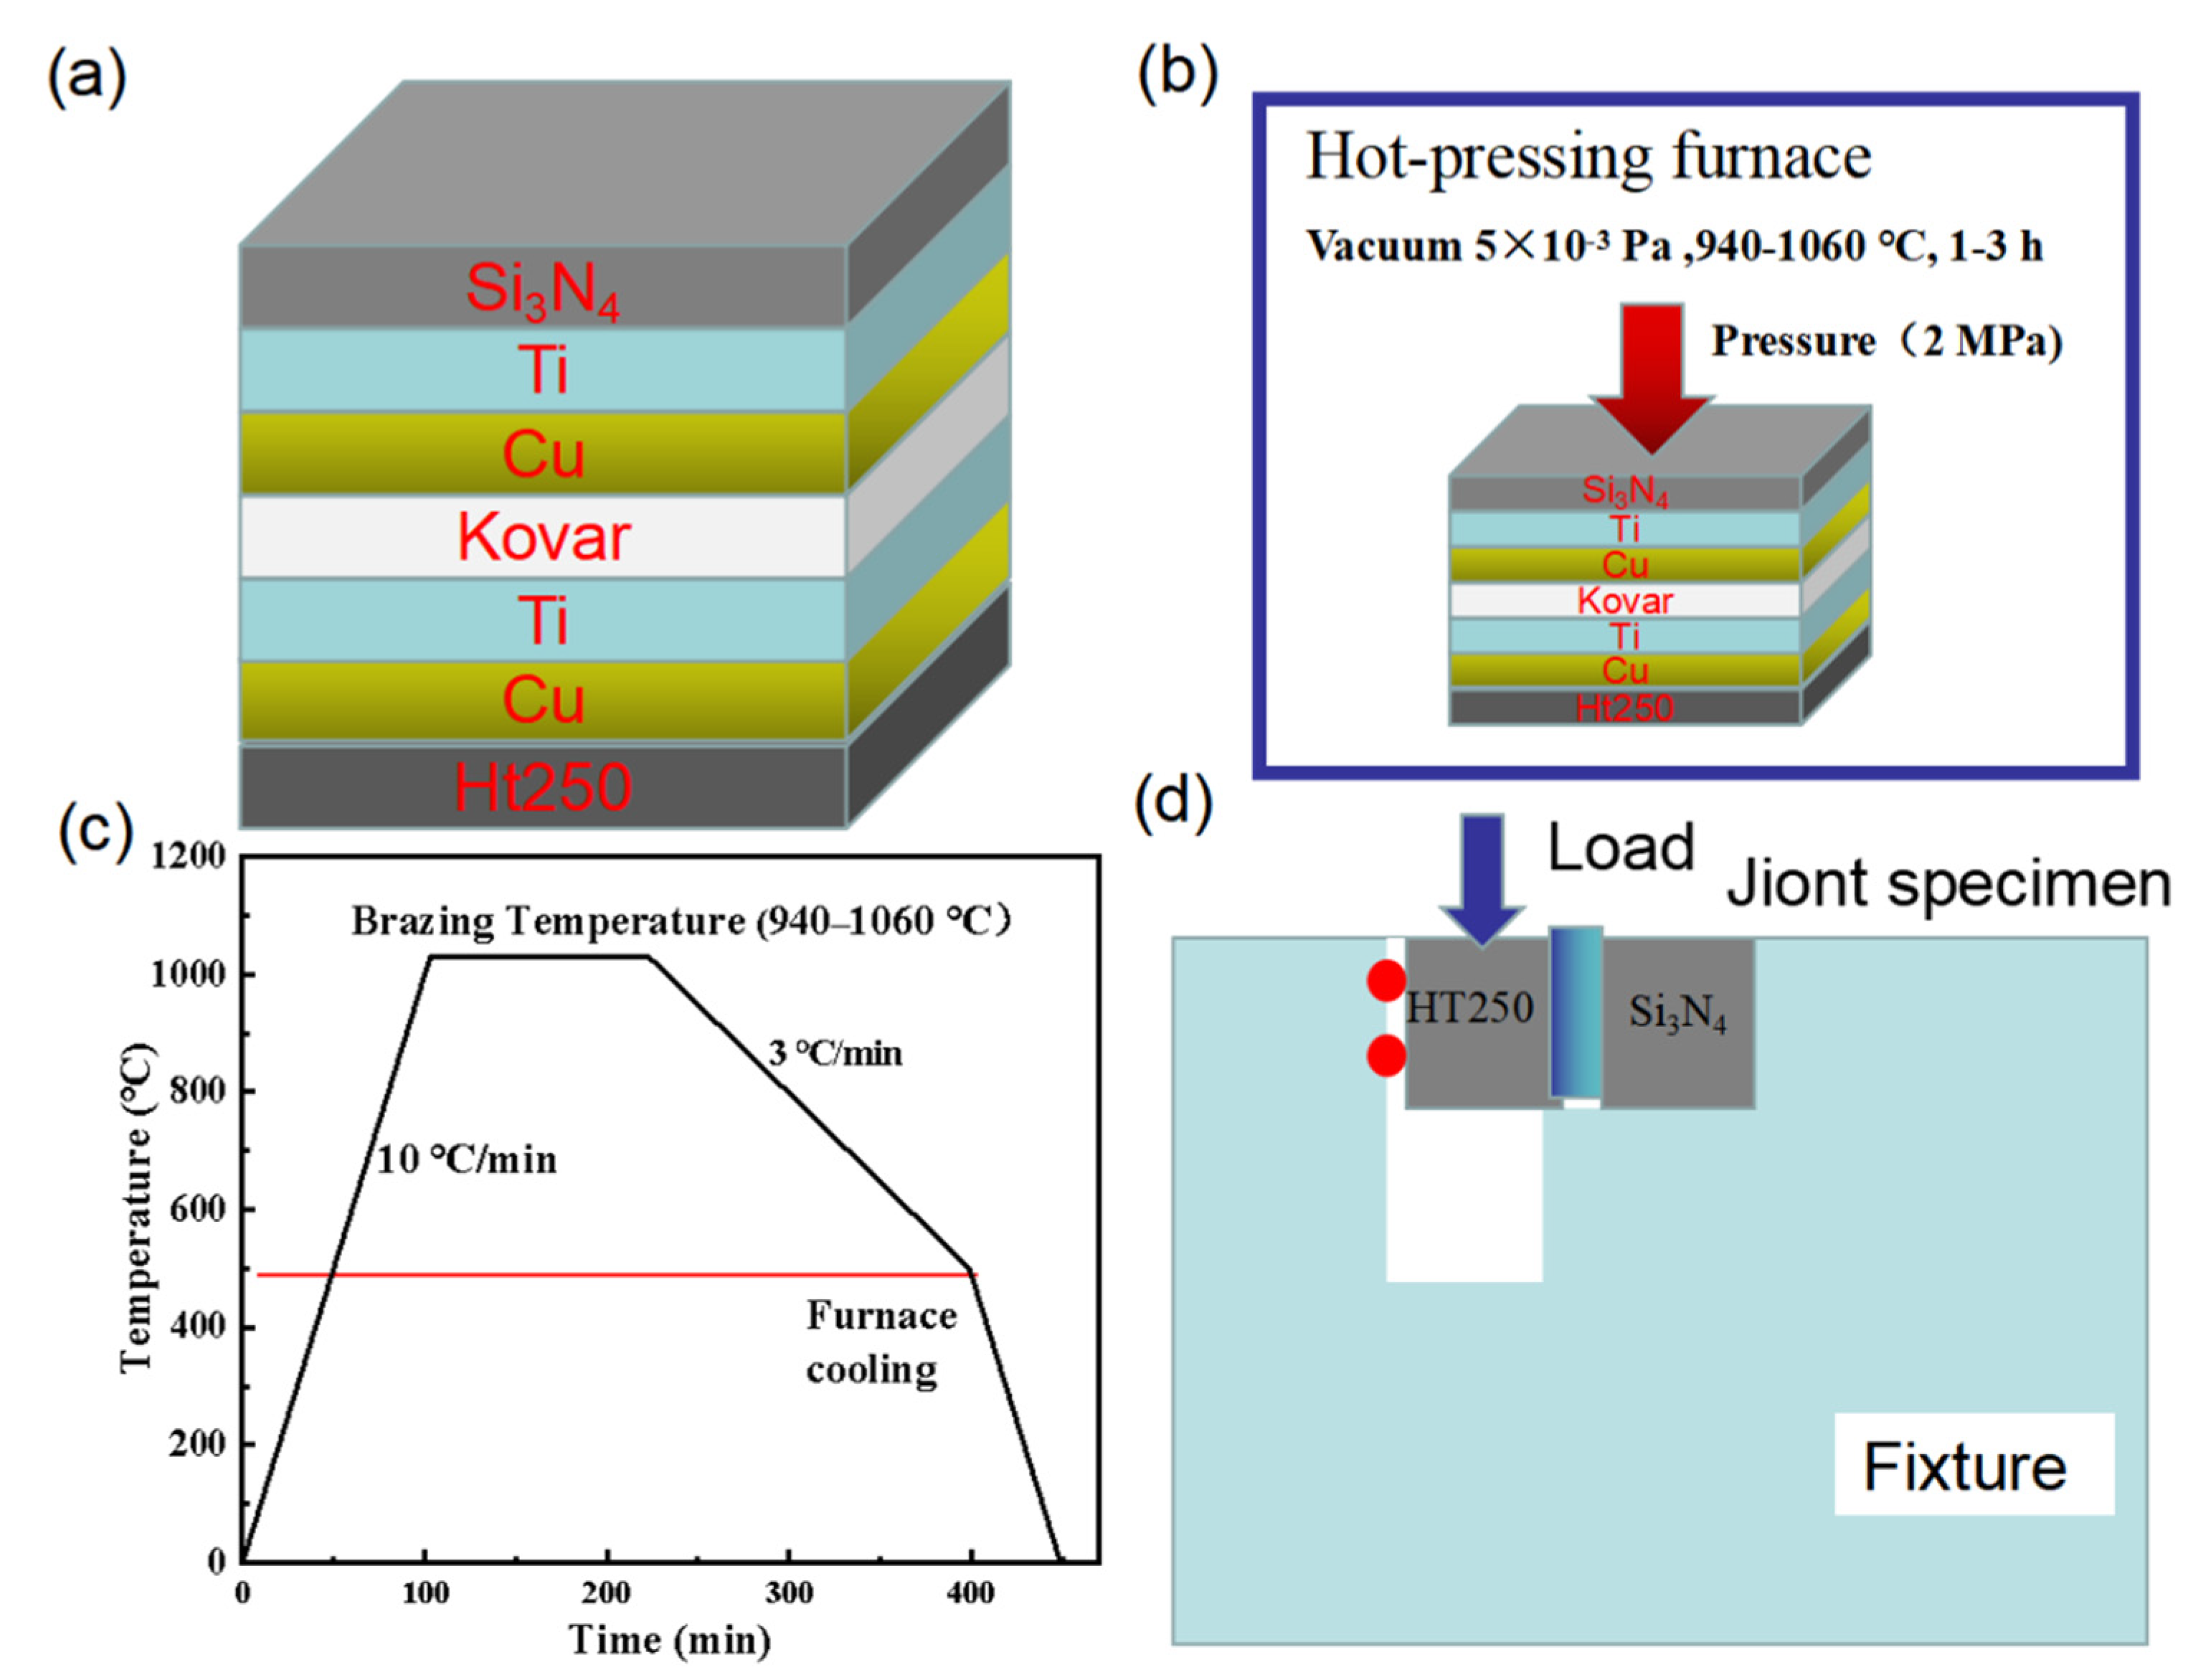
3.2.1. The Effect of Welding Temperature on PTLP Diffusion Bonding
When the welding pressure was 2 MPa and the holding time was 1 h, the Si3N4/Ti/Cu/Kovar/Cu/Ti/Ht250 was welded at 940 °C, 970 °C, 1000 °C, 1030 °C and 1060 °C. Because the whole joint was asymmetrical, the joints on both sides were analyzed separately.
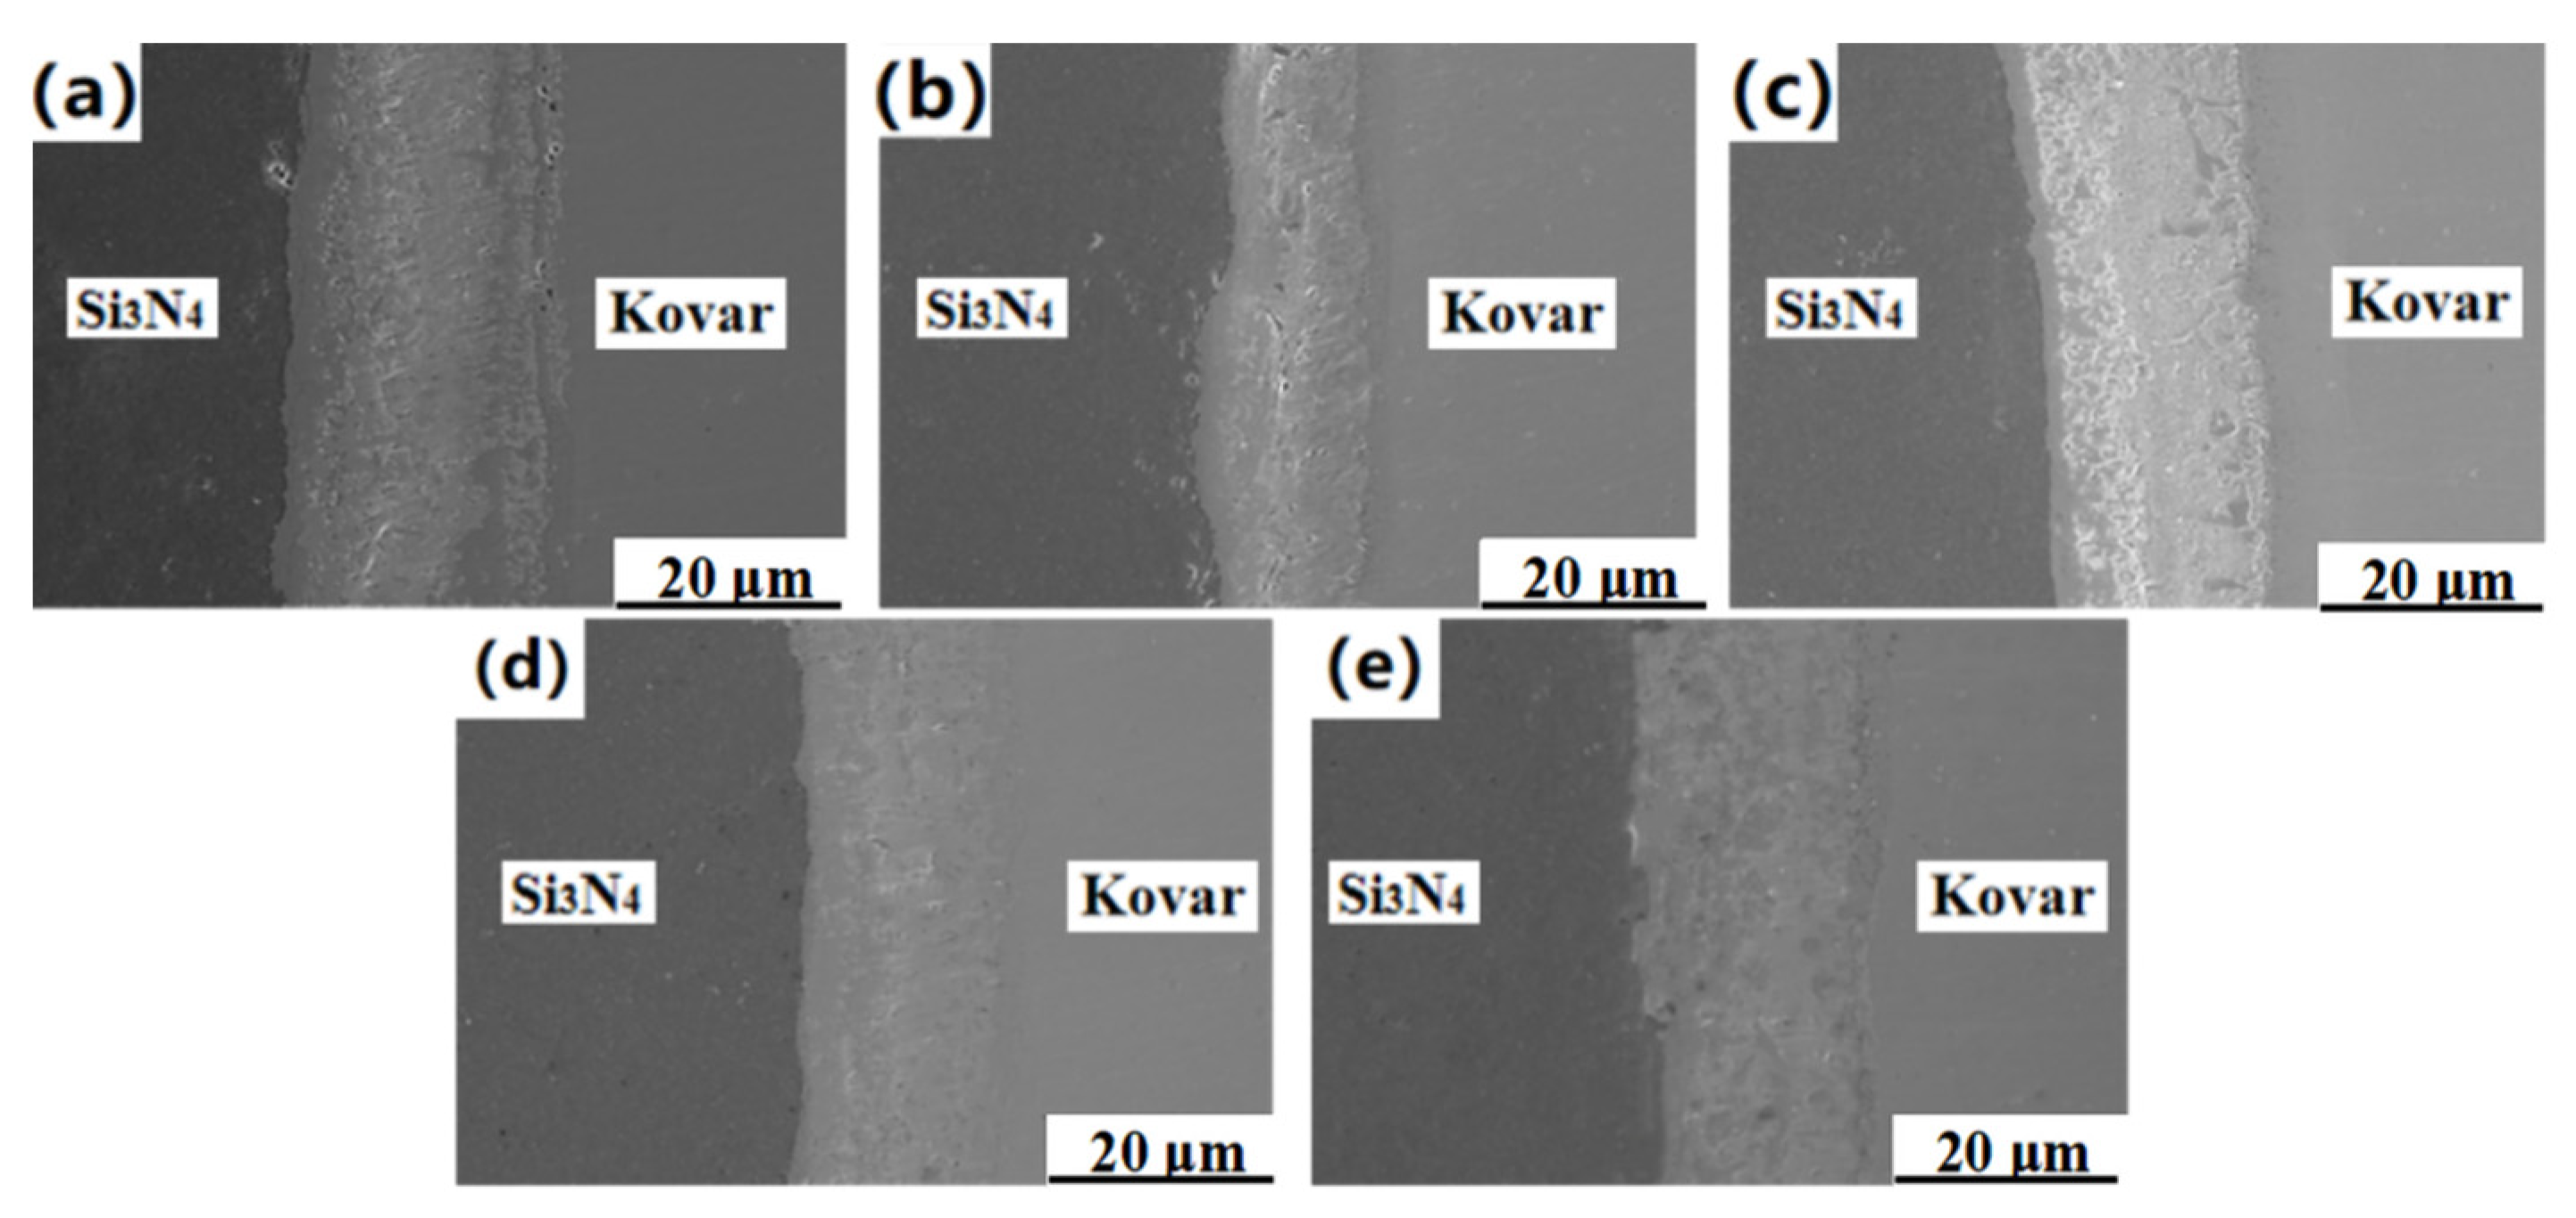
It can be seen from
Figure 6 that, in the temperature range of 940–1060 °C, tightly connected joints were obtained, but the thickness and distribution of the interface reaction layer were significantly different. At 940 °C, there were some tiny pores at the interface because the activation energy of interatomic diffusion is smaller at a lower temperature, which also made the diffusion of Ti atoms in the Cu–Ti liquid phase into the Kovar alloy lower. As a result, a large number of Ti–Fe and Ti–Ni compounds were segregated at the interface of the Kovar alloy, resulting in defects such as holes. When the temperature increased to 970 °C, the pores on the interface decreased. When the temperature further increased to 1000 °C, an obvious reaction layer formed at the Si
3N
4 ceramic interface, the distribution width of the dispersed reactants became wider, the joint transition was more natural, and the interface had no defects such as holes. When the welding temperature reached 1060 °C, the Si
3N
4 ceramics were closely combined with the Ti/Cu/Kovar intermediate layer. At this time, the dense reaction layer at the Si
3N
4 ceramic interface was integrated with the surrounding dispersed reactants, and the transition was natural. However, at 1060 °C, due to the high temperature, the Ti and Si atoms fully reacted, and finally a variety of Ti–Cu and Ti–Si intermetallic compounds were formed and grown, which was detrimental to the mechanical properties of the joint. Therefore, we hypothesize that the Si
3N
4/Ti/Cu/Kovar joints at different welding temperatures are all closely connected, but with an increase in temperature, the longer the Ti–Cu eutectic liquid phase lasts, the more interatomic diffusion there will be, and the transition of the reaction layer will be more natural. For further verification, EDS line scanning and point scanning analysis were performed on the interface under different welding temperatures.
At three different welding temperatures, the N, Si, Ti, and Cu elements were obviously diffused in the diffusion reaction layer, and no fault was seen. It can be seen from
Figure 7b that, at a welding temperature of 1000 °C, the width of the Si
3N
4 ceramic side diffusion reaction layer was about 13 μm, and that of the Kovar alloy side diffusion reaction layer was about 14 μm. There was sufficient time to diffuse to both sides, so the final diffusion reaction layer was more concentrated, and the new phase was more stable; the interdiffusion of Ti and Fe elements was more obvious on the Kovar side. In order to further study the effect of different soldering temperatures on the tight connection of the Si
3N
4/Ti/Cu/Kovar interface, a point analysis was carried out on some of the joints. The EDS results of chemical compositions and possible phases for these spots are shown in
Table 3.
It can be seen from
Table 3 that the Ti content at points A and E was higher than at point C. At point A, because the Ti element was not fully diffused, the liquid phase region had begun to solidify, resulting in a large number of Ti atoms remaining in the Kovar alloy. Near the interface, point E was because a large amount of Fe, Ni, and other elements in the Kovar alloy diffused to this point and reacted with the Ti element to form a Ti-containing compound. Points B, D, and F were all located inside the Kovar alloy. With the increase in temperature, the atomic diffusion ability increased, and the content of Ti and Cu elements in the area gradually increased; the Fe, Ni, and Co elements diffused to the Kovar alloy interface and liquid zone, and the content gradually decreased.
As shown in
Figure 8, at a temperature range of 940–1060 °C, tight joints were obtained, but the thickness and morphology of the diffusion reaction layer were significantly different. It can be seen from
Figure 8a that, at 940 °C, there was an obvious interface reaction layer at the Ht250 side interface, of about 3–4 μm, but only a few point-like reactants near the Kovar alloy interface; there were very few point-like reactants near the interface of the Kovar alloy, and obvious delamination at the joint, accompanied by cracks and hole defects. Defects such as joint delamination and voids were significantly improved when joined at higher temperatures. The dispersed reactants began to appear near the Ht250 interface reaction layer and gradually increased, extending to the Kovar alloy side; the reactants near the Kovar alloy interface also increased, and the transition to the two sides became more natural. Therefore, we deduce that the diffusion interface of Kovar/Cu/Ti/Ht250 at is more tightly welded a higher temperature and the diffusion between atoms is more sufficient. In order to verify this hypothesis, the bonding interface at different welding temperatures was analyzed by EDS line scanning and point scanning, as shown in
Figure 9.
At three different temperatures, the cps value of each element continuously changed at the interface, and there was no gap or fracture, indicating that Ht250 was closely combined with the Ti/Cu/Kovar/Ti/Cu interlayer. With the increase in temperature, the diffusion of Ti element to the Kovar alloy side became more and more obvious. The diffusion distance of Ti element to the Kovar alloy was 4 μm at 940 °C, about 10 μm at 1000 °C, and about 19 μm at 1060 °C.
Figure 9c shows that the Fe, Ni, and Co elements in the Kovar alloy diffused from the interface of 16 μm to 20 μm, and formed a reaction layer with Ti, which did not occur at other temperatures. On the Ht250 side, with the increase in temperature, the interdiffusion of Ti and Cu was more obvious, and it was easier to form Ti–Cu compounds at the joint. These reactants corresponded to the diffused reactants near the Ht250 interface reaction layer in the figure.
A point analysis of some characteristic points of the joint at different temperatures was carried out. According to
Table 4, the content of Ti and Cu elements at point A was only 7.36 at.% and 0.15 at.%, respectively. It can be seen that the ability of Ti and Cu to diffuse into the Kovar alloy was weaker at a lower temperature. As can be seen from
Figure 9a, the amount of Ti-containing reactants at point A was relatively small, and the Ti content at points C and E was 24.85 at.% and 25.19 at.%, respectively. Points B, D, and F were located on the right side of the Kovar alloy interface. Point B also contained a large amount of Cu (50.21 at.%), while the Cu content at the other two points was very low.
3.2.2. Effect of Holding Time on PTLP Diffusion Bonding
In the 1–3 h holding time interval, tightly connected joints were obtained, but the thickness and distribution of the interface reaction layer were significantly different. As seen in
Figure 10a, there was a 3–4-μm-thick reaction layer at the interface of Si
3N
4 ceramics, and dispersed reactants on the right side of the reaction layer. Dispersed reactants formed at the interface of the Kovar alloy. Notably, the width of the Si
3N
4 ceramic interface reaction layer and the nearby dispersed reactants both became thicker, the transition was more natural, and the reaction layer at the Kovar alloy interface became more obvious (
Figure 10b). When the holding time reached 3 h, it can be seen from
Figure 10c that the dispersed reactants on the Si
3N
4 ceramic side continued to extend to the Kovar side, almost connecting with the Kovar alloy interface reaction layer. Therefore, we suggest that the joints of Si
3N
4 ceramics/Ti/Cu/Kovar under different holding times are all tightly welded, but with the increase in holding time, the distribution of dispersed reactants in each reaction layer and the vicinity of the reaction layer changes. For further verification, EDS line scan and point scan analysis were performed on the connection interface under different incubation times.
The cps value of each element changed continuously at the interface, and there was no fault phenomenon, but the distribution of each element was very different. It can be seen from
Figure 10b that, with the increase in the holding time, the range of the Cu elemental region in the joint was greatly reduced, and more Ti and Si elements diffused from the side of the Si
3N
4 ceramic, which corresponds to the one in
Figure 10c. The dispersed reactants extended to the Kovar alloy side. At the same time, with the increase in holding time, the diffusion level of Ti into the Kovar alloy decreased, and Ti accumulated on the surface of the Kovar alloy; the corresponding area was the Kovar interface reaction layer.
The EDS results of chemical compositions and possible phase for these spots are shown in
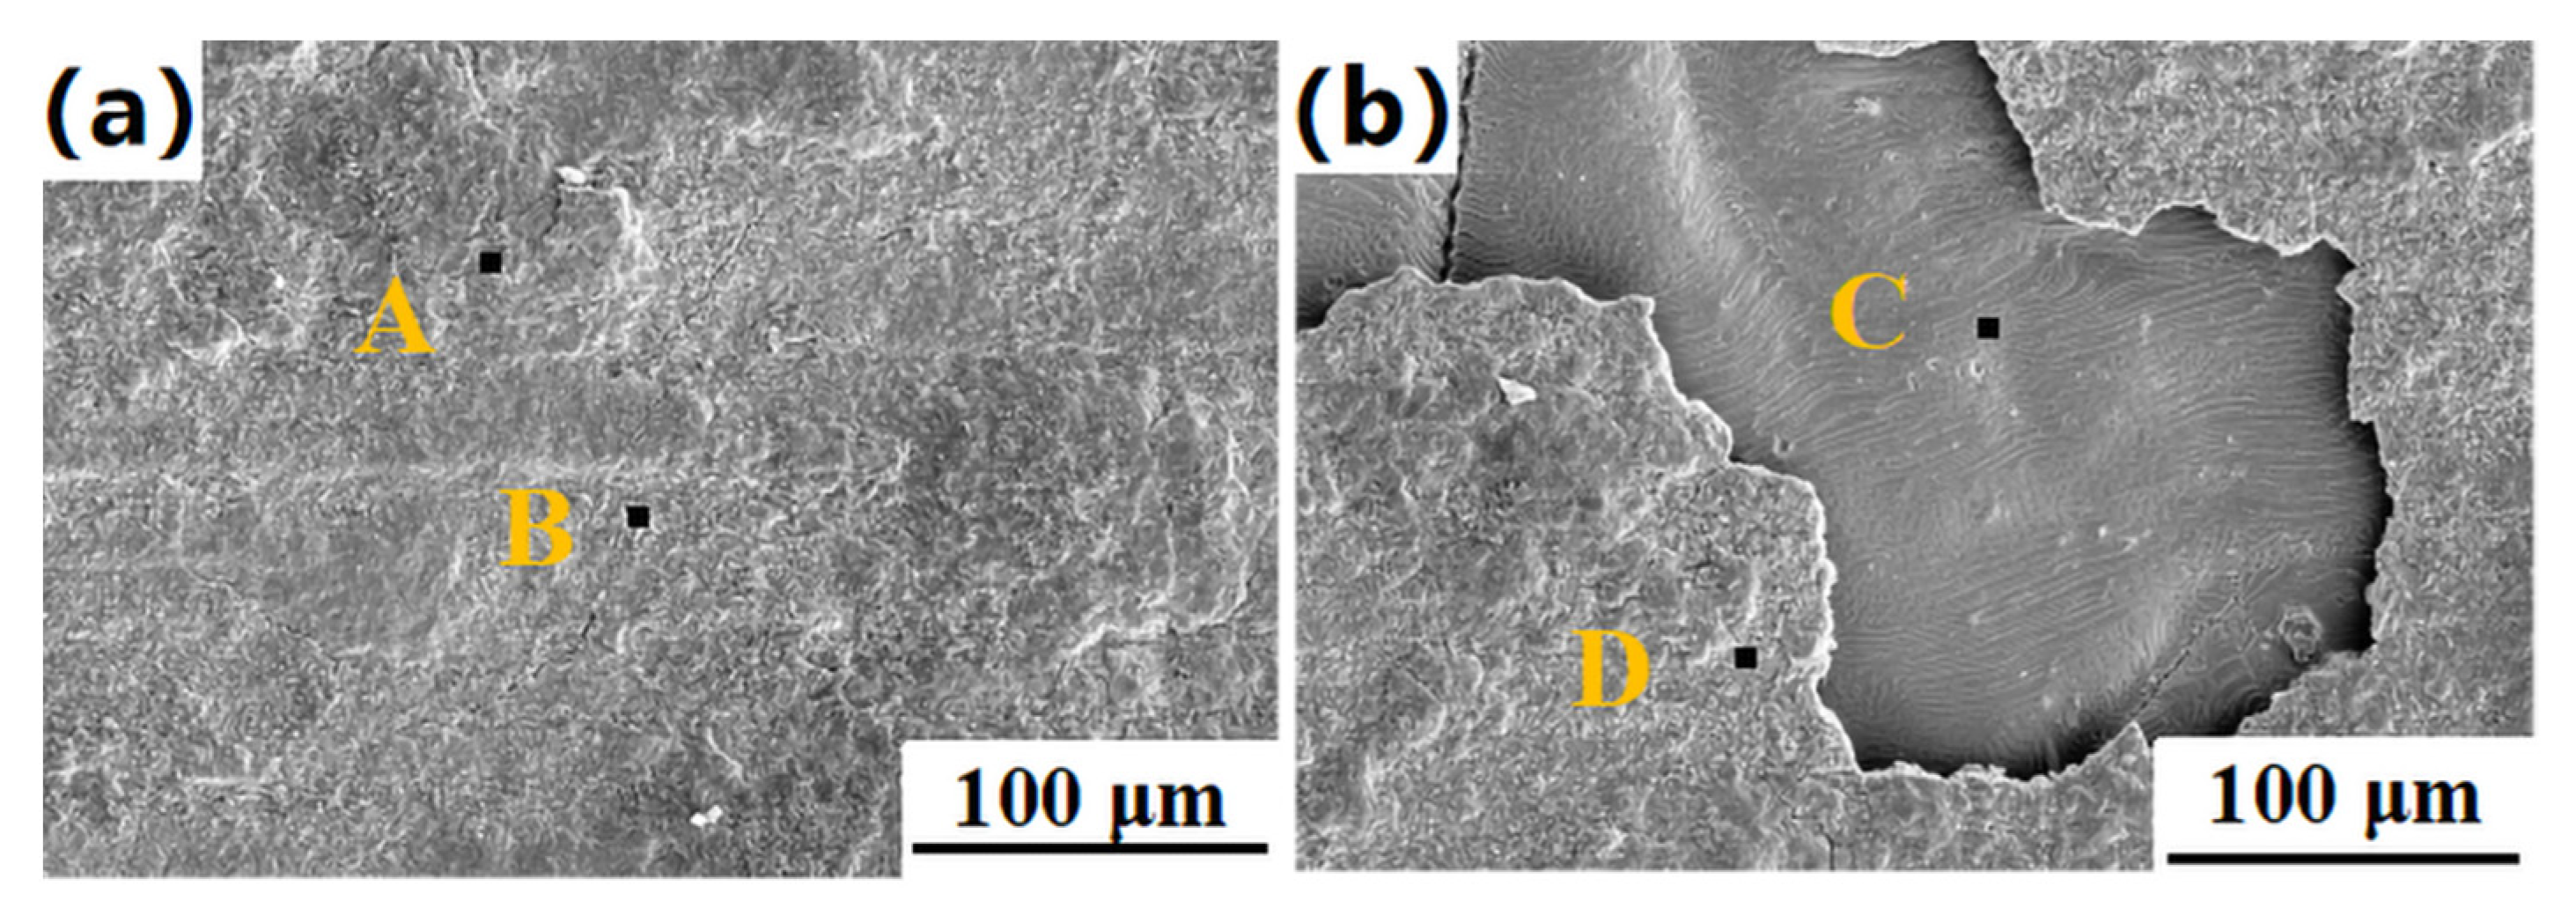
Table 5. The Cu element content at point A, located in the central area of the joint, was as high as 96.41 at.%, while the Cu content at points C and E was only 54.08 at.% and 22.97 at.%, respectively, and the content of Ti and Si increased significantly, which indicates that, with the increase in holding time, the diffusion distance of Ti, Si, and other elements at the interface of Si
3N
4 ceramics increased. In addition, point B was mainly composed of Ti, Cu, and Ni, and the content of Ni was 37.69 at.%. At this time, the diffusion ability of Ni was very strong. When the holding time was 2 h, the Kovar interface reaction layer was most obvious. The element composition at point D was Si 4.32 at.%, Ti 63.94 at.%, Cu 2.78 at.%, Fe 28.9 at.%, and Ni 0.06 at.%, indicating that the reaction layer was mainly TiFe and α-Ti phase, which hindered the diffusion of Ni and Co alloy elements to the Si
3N
4 side.
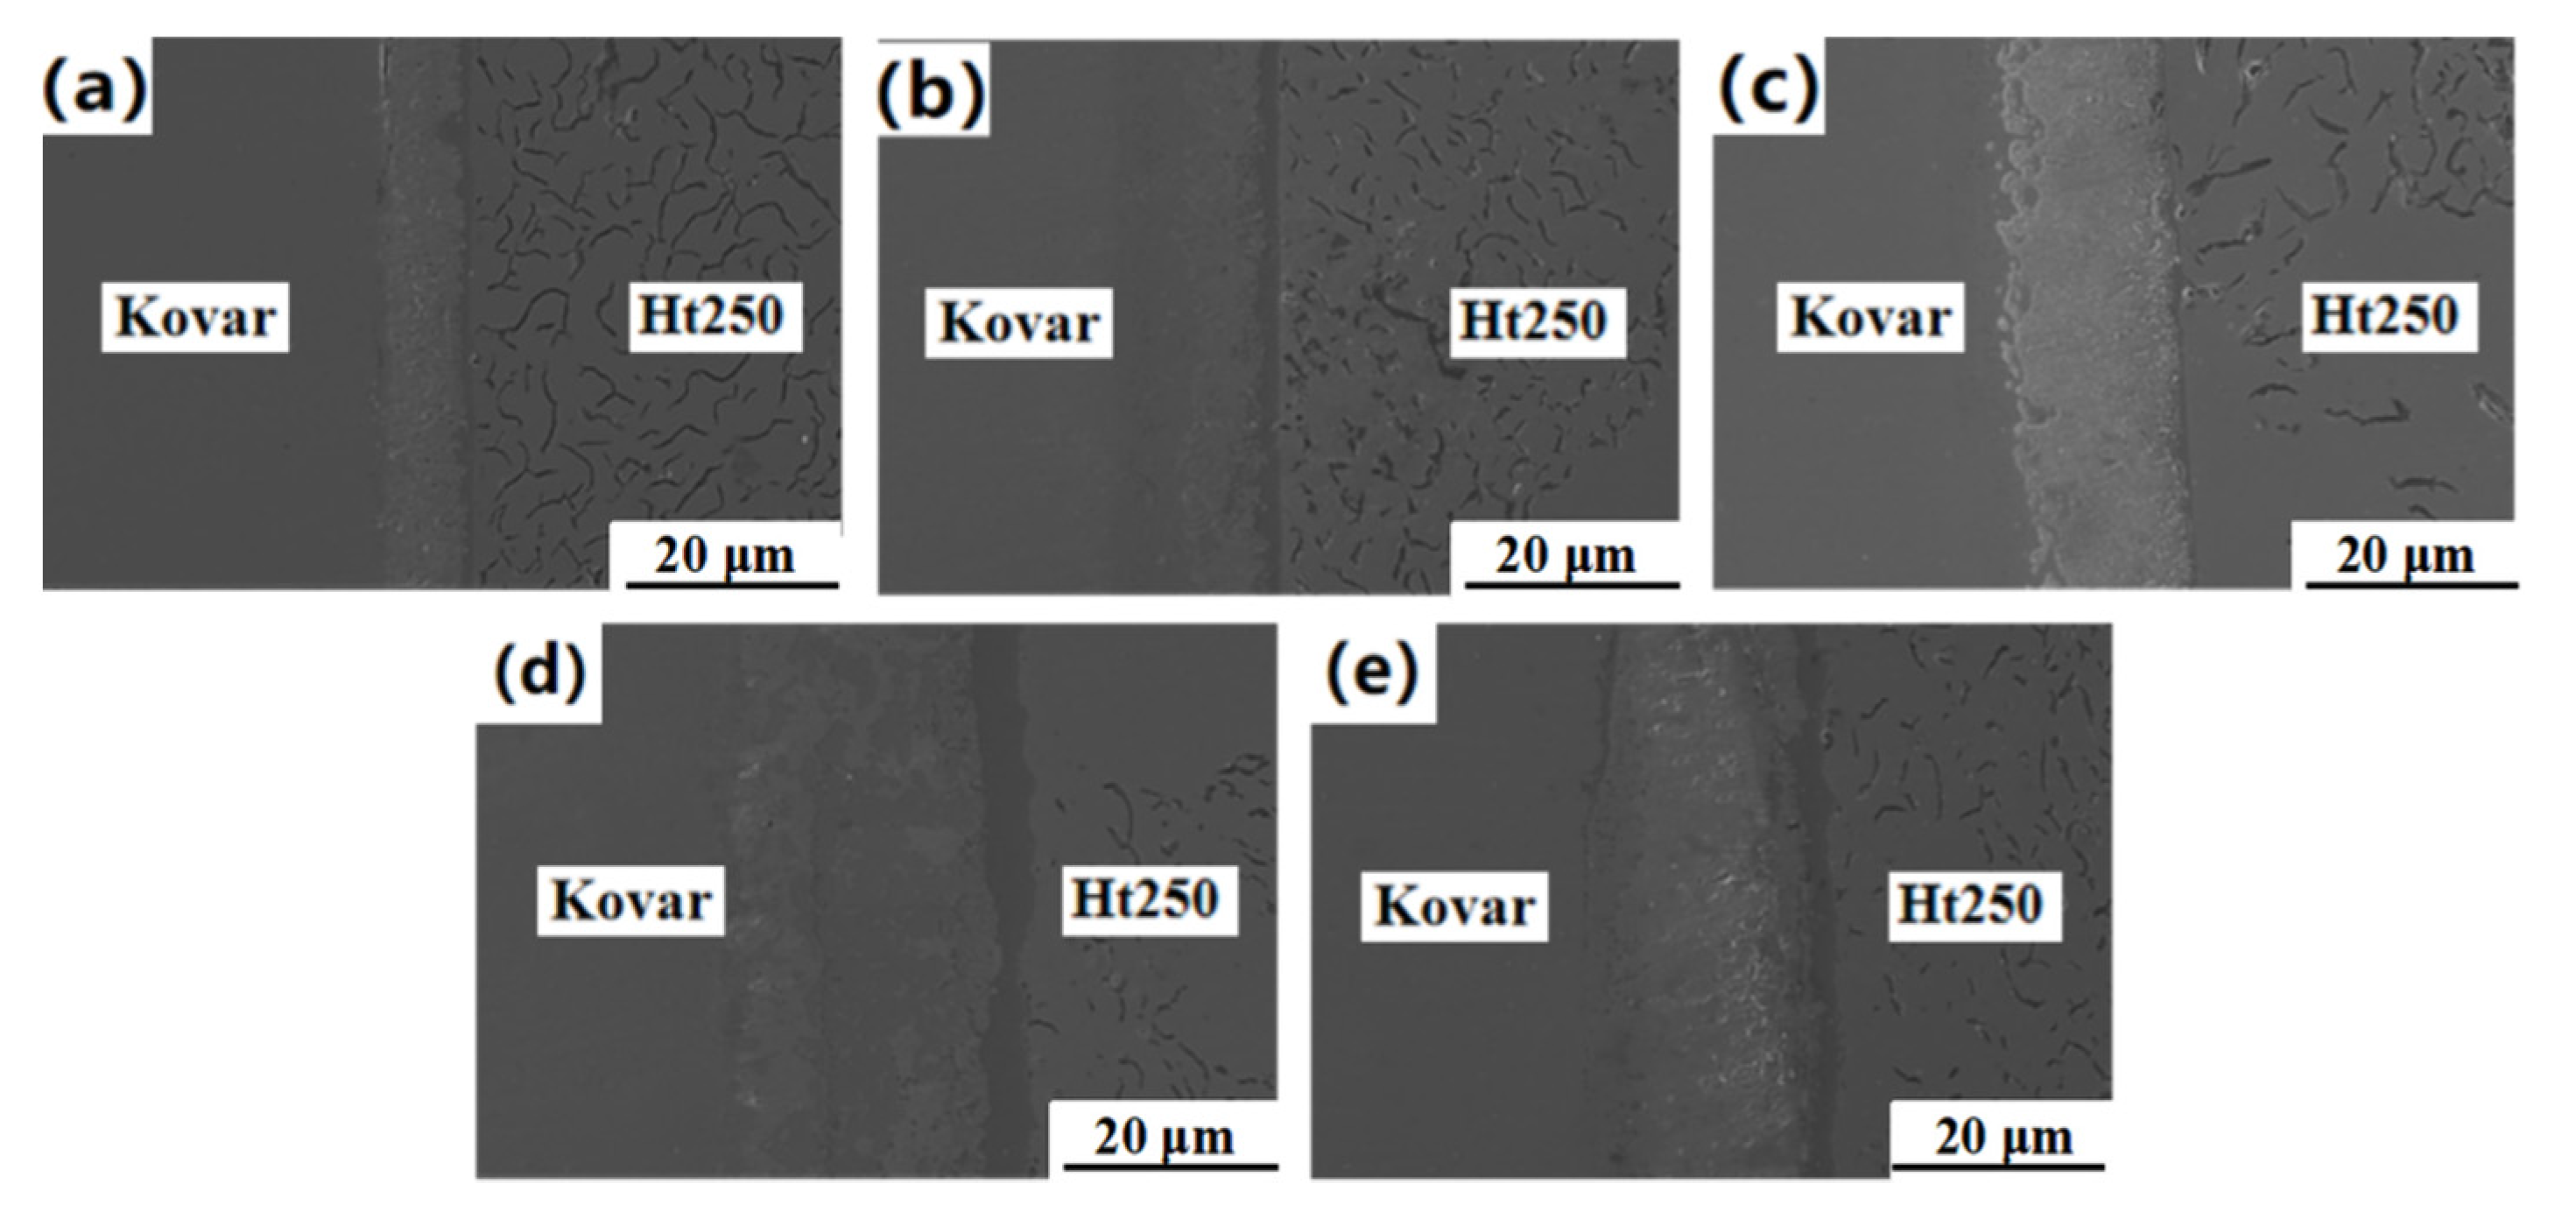
As shown in
Figure 11, the Ht250 and Ti/Cu/Kovar/Ti/Cu intermediate layers were closely connected within the holding time interval of 1–3 h, without holes, cracks, or other defects, but the morphology and transition of the interface reaction layer were significantly different. When the holding time was 1 h, there was obvious delamination at the Kovar interface, and with the increase in the holding time, the delamination improved until it was completely homogenized. When the holding time was 3 h, the thickness of the reaction layer at the Ht250 interface increased, and the dispersed reactants near the reaction layer turned into thin strips, extending all the way to the Kovar alloy side, with light-colored areas between the strips. The transition of the Kovar/Cu/Ti/Ht250 joint under a longer holding time was smoother and more natural. For further verification, EDS line scan and point scan analysis were performed on the joint connection interface under different incubation times. Similar to the Si
3N
4-side joint, with the increase in the holding time, the Cu elemental region in the Ht250 and Kovar joints decreased greatly, and the width of the Ti-rich reaction zone at the Ht250 interface increased. It can be seen from
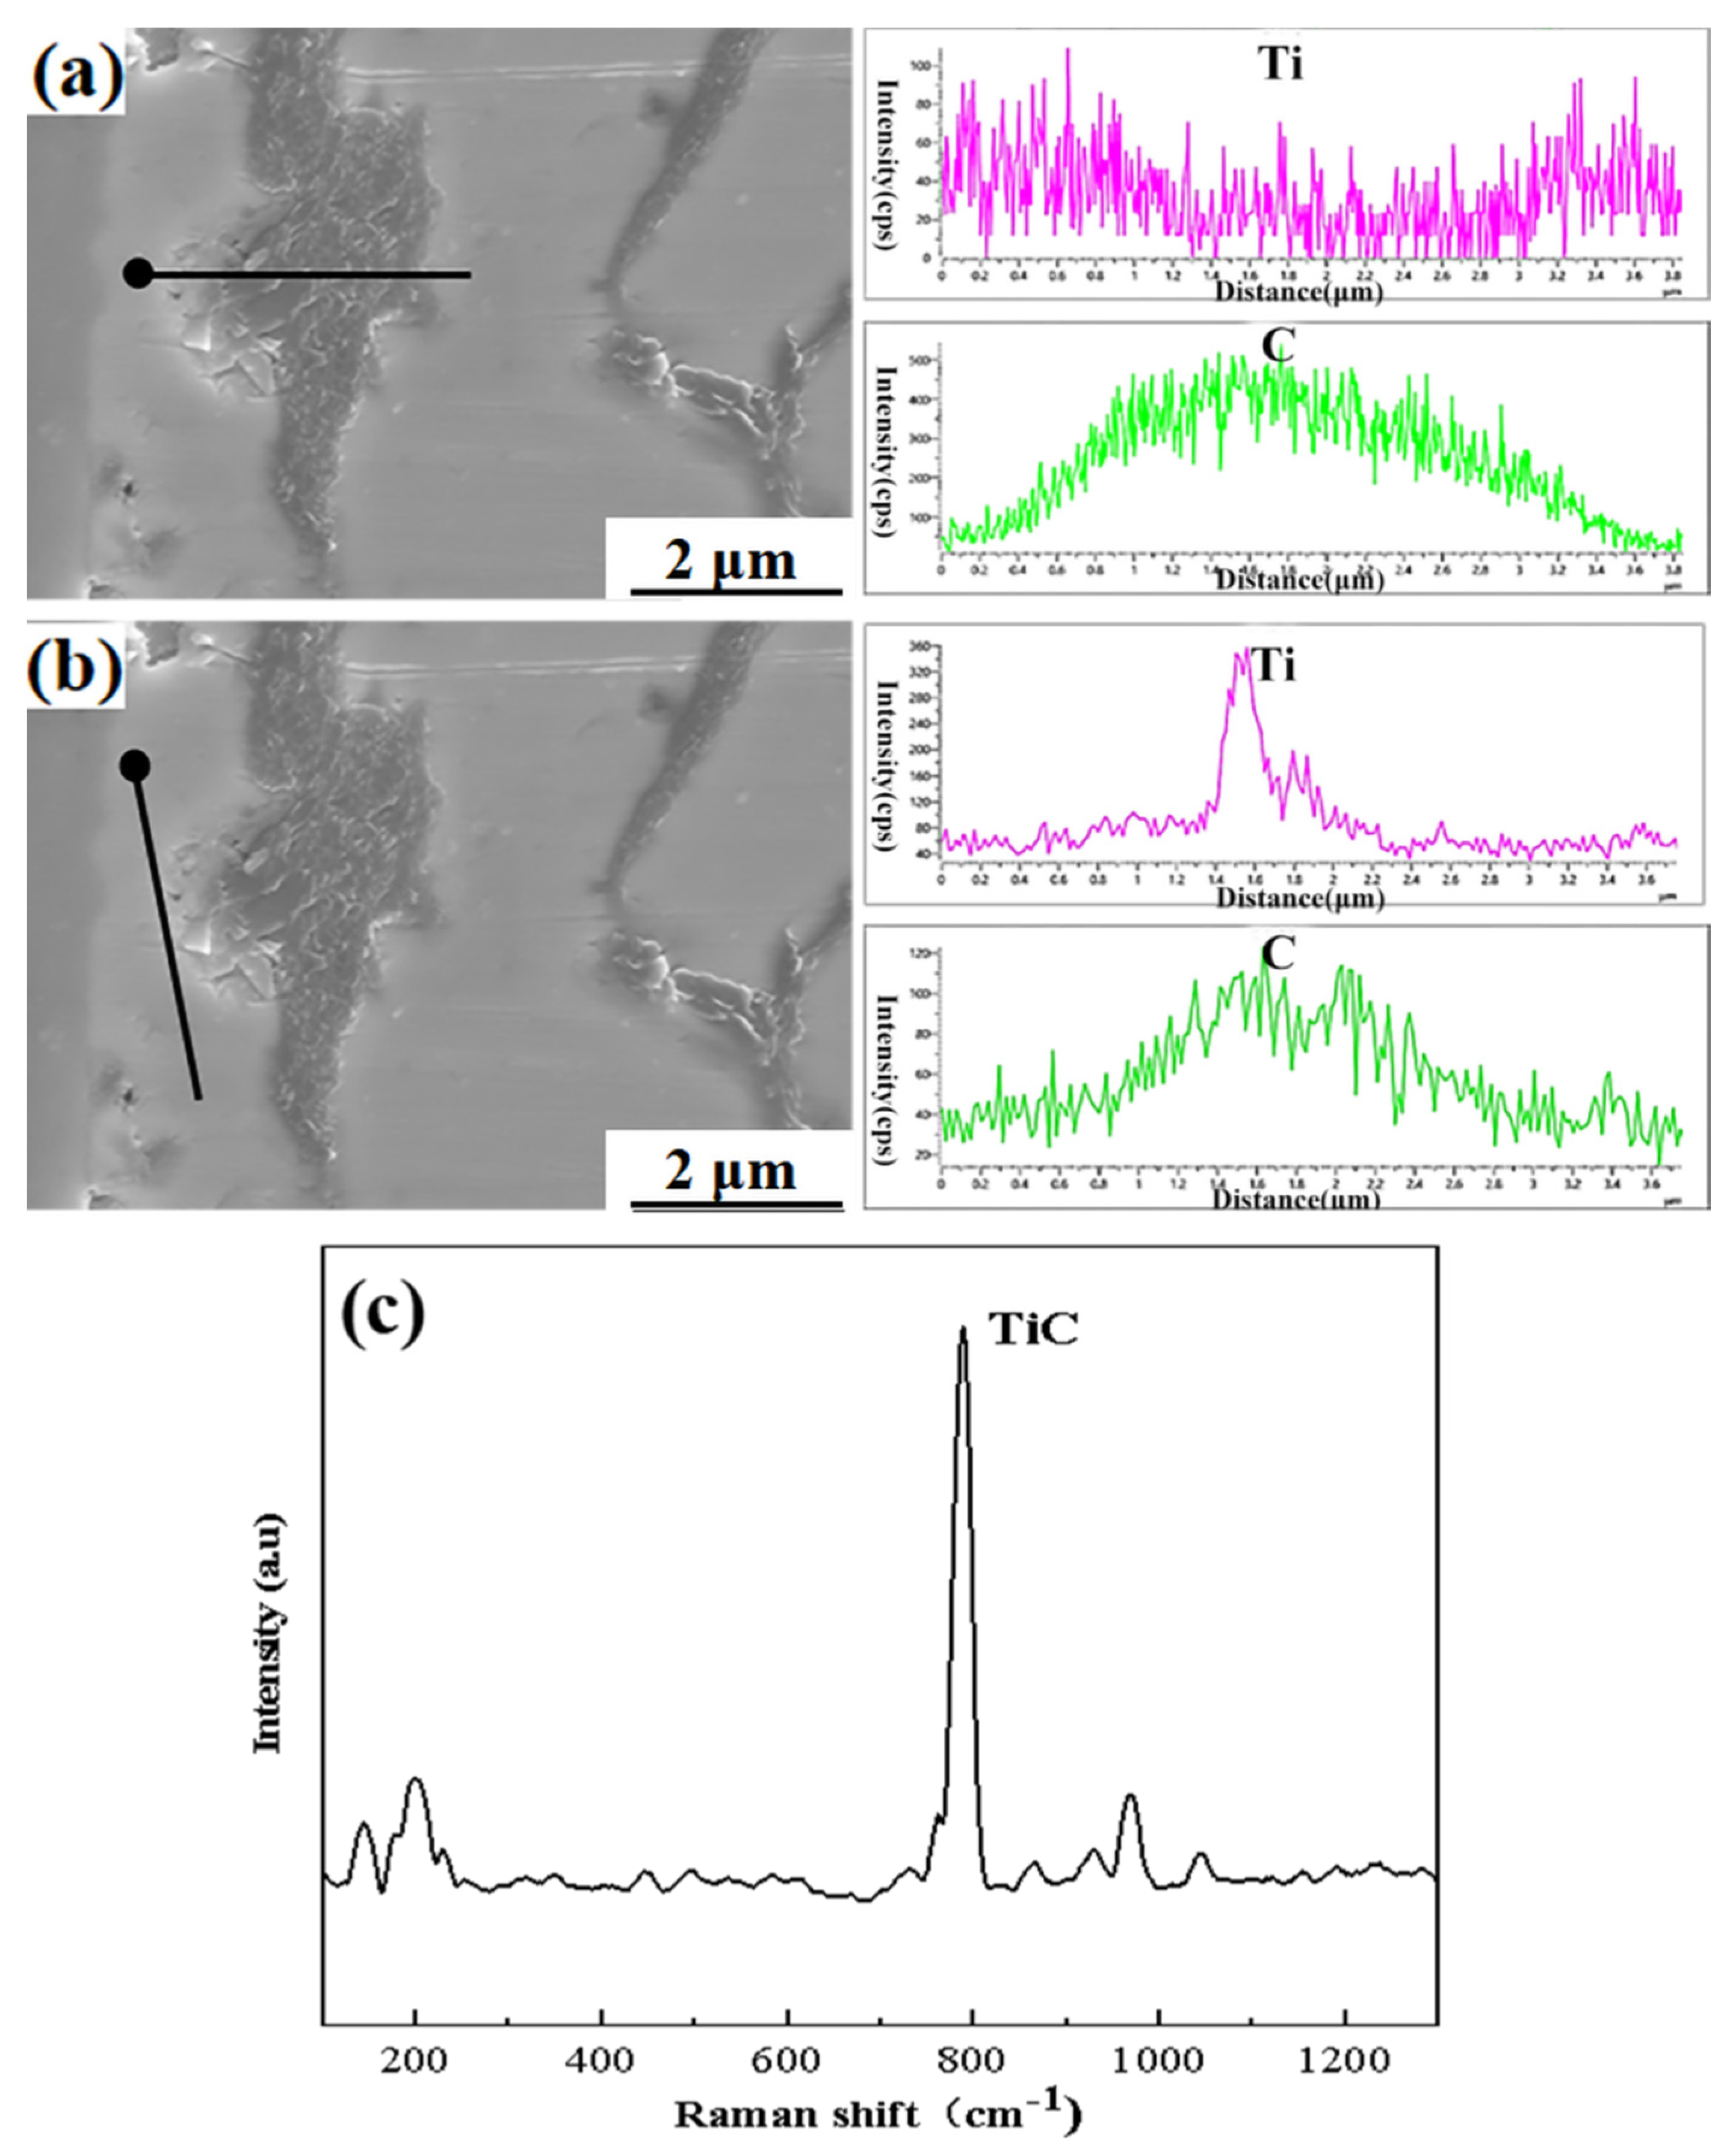
Figure 11c that, when the holding time was 3 h, the Fe element in the Kovar alloy diffused to the Ht250 side along the Cu–Ti liquid phase region, and the diffusion distance was about 10 μm.
Figure 12 shows the concentration curves of Ti and C in
Figure 11c. The peaks of Ti and C elements correspond to the band-shaped reaction layer near the Ht250 interface in
Figure 11c. We speculate that the main phase is TiC. At this point, various brittle phases filled the entire joint structure.
It can be seen from
Table 6 that the Cu content at points A and C was very high—72.5 at.% and 60.78 at.%, respectively—but the Cu element content at point E, which was also located in the middle area of the Kovar alloy and Ht250, was only 1.74 at.%. The contents of C and Ti were as high as 42.03 at.% and 52.72 at.%, respectively, which correspond to the thin ribbon-shaped reaction zone in
Figure 11c, which was mainly composed of TiC. The element compositions and contents at points B, D, and F of the Ht250 interface reaction layer were similar, indicating that the increase in holding time only changed the thickness of the Ht250 interface reaction layer, but not its composition.


