Abstract
LaF3 is commonly added to oxide glass, in particular to silica, to form oxyfluoride glass. After appropriate thermal treatment at a temperature lower than 800 °C, usually, glass ceramics are obtained. Recently, LaF3 nanoparticles have been used as precursors to obtain amorphous nanoparticles of undefined composition in optical fiber. However, fiber fabrication necessitates temperature much higher (typically up to 2000 °C) than the one required for bulk glass. In this article, we report on the reactivity of fluoride ions in LaF3 with SiO2 and GeO2 (a common dopant used to dope optical fiber) powders at high temperature. TGA, EDX-SEM, XRD and Raman analyses were performed. Above 1000 °C, LaF3 starts to react, preferentially with SiO2, to form SiF4 gaseous species. The remaining lanthanum ions form La2Si2O7 and La2Ge2O7 phases. These results could contribute to improve material development for the fiber optics community.
1. Introduction
The pioneering work of Auzel et al. and Wang and Ohwaki modified the approach to design optical materials [1,2]. They have demonstrated that the optical properties could no longer be modified by considering the composition of the glass as a whole but by changing the composition locally via the formation of particles. This approach then allows an engineering of the luminescence properties of the rare earth ions or of the nonlinear properties [3,4]. However, in order to limit optical loss induced by light scattering, particles must be of nanometric dimension.
Among the various materials developed, glass ceramics based on oxylfuride glass have gained particular growth [5]. They are made of a silicate glass containing fluoride nanocrystals. Among the various fluoride phases studied, LaF3 constitutes a material of choice for the modifications of the luminescence properties of rare earth ions. This structure has demonstrated its full potential both in the form of nanoparticles and in oxyfluoride glasses [6,7,8,9,10]. The formation of the latter is generally completed in two stages. A first step consists of preparing a homogeneous glass by the melt-quenching process and then reheating it to initiate the formation of nanocrystals and to control their growth. The temperature involved for the a posteriori heat treatment is of the order of 600–800 °C for 10 h.
More recently, the LaF3 phase doped with rare earth ions has been used as a precursor to prepare optical fibers [11,12,13]. Nanoparticles are introduced during the solution-doping step to be adsorbed on the porous layer, which will form the fiber core. Beneficial effects of this doping have been reported for luminescence properties [11,14,15]. However, the conditions for preparing optical fibers are very different from those of bulk glasses. In particular, the temperature involved during the manufacture of the optical fiber preform can reach 2000 °C.
In order to better understand the behavior of LaF3 phase under these processing conditions, we are interested in this article in its reactivity at high temperature with SiO2 and GeO2, which is a codopant commonly used in optical fibers. The binary systems SiO2-LaF3 and GeO2-LaF3 are first studied before analyzing the ternary system SiO2-GeO2-LaF3. The analyses show that LaF3 reacts preferentially with SiO2 by forming a new solid phase La2Si2O7, the fluorine evaporating in the form of SiF4. Thus, following doping with LaF3 nanoparticles, the fiber would no longer contain fluorine, which could evaporate during the sintering phase of the porous core, and the new particles observed would be lanthanum silicates.
These results clearly demonstrate that fluoride ions react with the matrix during manufacturing, which takes place at very high temperatures (typically 2000–2200 °C), and lead to the formation of new nanoparticles. Despite this transformation, we reported that the spectroscopic properties of Tm3+ ions inserted by doping the LaF3 nanoparticles are improved compared to ionic doping (La3+, Tm3+) [14,15].
In this context, it was important to understand the reactivity at high temperature of LaF3 with the host matrix, in particular to identify the new formed phases. The studied silica (SiO2) fiber is doped with germanium dioxide (GeO2) in order to increase the refractive index of the core compared to the optical cladding. With the presence of SiO2 and GeO2 in the medium, the first hypothesis is that the LaF3 nanoparticles reacted, either with one of the oxides, or with both at the same time, to form a gaseous metallic tetrafluoride. Consequently, it was necessary to study the possible reactions at high temperature between these three compounds present in the optical fiber’s core in order to elucidate the composition of the new nanoparticles formed during the drawing of the fiber.
In this paper, we are interested in clarifying the disappearance of the fluoride from the optical fiber, so our goal is to study the chemical reactivity at high temperature in the ternary system SiO2-GeO2-LaF3. It worth noting that in the previous works, GeO2 and LaF3 quantities do not exceed 2% each in the optical fiber, with a very large excess of silica is present. However, we proposed involved reactions when the quantities of SiO2 and GeO2 are equal to more understand the real competition between the two oxides. The used amount of LaF3 was the molar stoichiometry of the metal oxide. In this ternary system, the closest to the conditions in the previous works, pure LaF3 grains were studied and not LaF3 nanoparticles nor thulium-doped LaF3.
2. Materials and Methods
Silicon dioxide (SiO2, granular, ≥99.99%), germanium dioxide (GeO2, powder, 99.999%) and lanthanum trifluoride (LaF3, anhydrous, powder, 99%) were all purchased from Sigma-Aldrich. The main physicochemical properties of these three compounds are presented in Table 1 below [16].

Table 1.
Main physicochemical properties of the three studied compounds [16]. a Tg; b Mp.
The possible reaction between each oxide and LaF3 in a binary system is:
3.5 MO2 + 2 LaF3 → 1.5 MF4 ↑ + La2M2O7
M = Si or Ge
In the ternary system, the two oxides can react with LaF3 according to the following reaction:
3.5 SiO2 + 3.5 GeO2 + 2 LaF3 → x SiF4 ↑ + y GeF4 ↑ + A
The study consists of physically and separately mixing each oxide with LaF3, as well as mixing the three compounds together, according to the stoichiometric amounts present in the two Equations (1) and (2). The starting amounts of each compound in each reaction are indicated in Table 2.
Table 2.
Starting amounts of each compound in each reaction.
The dried powders were mixed by grinding them together in the presence of ethanol for 15 min to ensure the homogenization and the distribution of the grains, which allows a submicrometric granulometry (less than 0.5 μm). Then, they were heated at 60 °C for 1 h to ensure the elimination of any ethanol traces. The presence of a liquid generally allows to reduce the significant constraints applied to the grains, which can cause changes in phases, redox and stoichiometry [20].
After grinding, a part of each mixture was placed in a furnace under air. The temperature was increased with a heating rate of 5 °C/min to reach 1500 °C (the highest temperature reachable with the furnace at our disposal) and maintained for 5 h. Then, the furnace was cooled down to room temperature (5 °C/min), and the obtained powders were taken out and placed directly in a desiccator to avoid any contamination from their environment (hydration in particular); then, they were characterized by XRD, EDX-SEM and Raman spectroscopy. To analyze the evaporation of the fluorinated compound, thermogravimetric analyses (TGA) were performed to estimate the mass loss of the various mixtures. The other parts of each mixture were heated to 1450 °C with a heating rate of 2 °C/min in an alumina crucible, and then they were maintained at 1450 °C for 60 min.
X-Ray Diffraction (XRD) experiments were performed using an X’Pert MPD θ-θ diffractometer (Philips, Amsterdam, Netherlands) with Cu Kα radiation (λ = 1.5418 Å). It is equipped with the X’Celerator detector and nickel filter. Analyses were carried out between 12 and 70° as the interval with a step size of 0.033. The obtained patterns were treated with the X’Pert Highscore software (PANalytical) for phase identification. The used Energy-Dispersive X-ray Spectroscopy coupled Scanning Electron Microscope (EDX-SEM) is an X-max 50 mm2 from OXFORD INSTRUMENT. The measurements were taken at an acceleration voltage of 15 KeV with a working distance (WD) of 10 mm. Raman spectra were recorded by a Raman T64000 Jobin-Yvon® spectrometer equipped with a CCD detector. The light source was a laser operating at 488 nm with a typical output of 100 mW on the sample. The integration time was 300 s, and all the spectra were recorded between 50 and 1100 cm−1. TGA was performed using a Netzsch STA 409 PC Luxx (TGA/DSC) machine with a mass resolution of 2 µg and a highest attainable temperature of 1450 °C.
3. Results and Discussion
3.1. Starting Compounds
Before studying the mixtures, it is necessary to understand the behavior of each reagent and to study the evolution of the chemical structure under thermal treatment of all the starting compounds. Therefore, we carried out the same thermal studies for each reagent taken separately. A thermal treatment at 1500 °C was applied in addition to the same TGA protocol. SEM images of a mixture of three compounds before thermal treatment show three different areas (Figure 1); each mainly corresponds to one of the compounds.
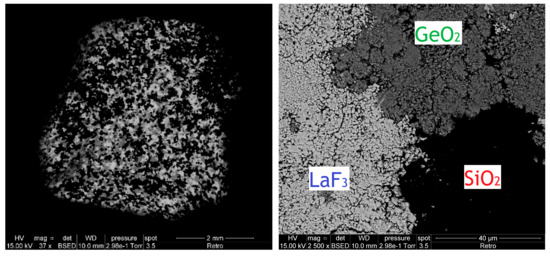
Figure 1.
SEM images by backscattered electrons of a mixture of three compounds before thermal treatment: SiO2 (black), GeO2 (dark gray) and LaF3 (light gray).
This difference in color is due to the contrast in composition (or atomic number) caused by the variation of the emission cross-section with the atomic number. The emission cross-section of the backscattered electrons increases sharply with the atomic number. Areas rich in heavy elements therefore appear lighter than areas rich in light elements. We can therefore have a relative estimate of the difference in atomic number from one zone to another. Thus, the lanthanum which is a heavy element (Z = 57) appears light gray, and the silicon which is a light element (Z = 14) appears black, while the germanium where its atomic number is between the two others (Z = 32) appears dark gray.
Based on the EDX measurements presented in Table 3 and comparing the theoretical values expected for each pure compound, the black area in the image taken by backscattered electrons (Figure 1) mainly corresponds to silica, the dark gray mainly corresponds to germanium dioxide, and the light gray mainly corresponds to lanthanum trifluoride. None of these three zones corresponds to a pure compound, and each shows the presence in a smaller quantity of the phases other than the majority.
Table 3.
Theoretical and average atomic percentages obtained by EDX of the different elements constituting the three studied compounds before thermal treatment.
We started by studying with TGA the mass losses of each compound (SiO2, GeO2, LaF3). Figure 2 shows the losses measured as a function of temperature.
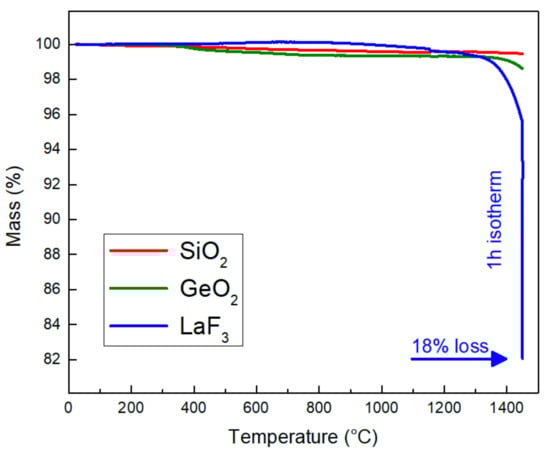
Figure 2.
TGA curves of the different starting compounds.
The two oxides show very low losses up to around 1200 °C, which are caused by the dehydration and dehydroxylation of the materials. These results show that the oxides do not undergo major modifications in air at this temperature (decomposition, disproportionation, etc.). However, germanium dioxide begins to lose mass from around 1400 °C, which is close to its evaporation temperature (from 1500 °C). While the mass of LaF3 remains almost stable with the increasing of temperature up to around 1300 °C, notable mass losses are observed at higher temperatures. It is important to note that after one hour of isotherm at 1450 °C, the sample has lost approximately 18% of its initial mass. We limited the high-temperature measurement to one hour to avoid any damage on the TGA device. The evaluated loss mass (≈18%) is very close to expected one (16.8%), indicating that LaF3 was totally oxidized into La2O3. B. Zhu et al. [21] reported the formation of LaOF from a thermal treatment of LaF3 at 800 °C for 2 h with a mass loss of 10%. In addition, Zachariasen reported that a 5 h thermal treatment of LaF3 at 920 °C leads to the formation of LaOF with a mass loss close to 15% [22]. He also noticed that a phase of La2O3 begins to appear after 31 h at this temperature. An increase in temperature up to 1130 °C with a 19 h plateau leads to a total oxidation of LaF3 to La2O3 with a loss of 18.5% compared to the initial mass of the sample. Reactions (3) and (4) show the two possible products when LaF3 reacts with oxygen in the air, as well as the theoretical mass losses which accompany these two reactions.
LaF3 + O2 → LaOF + OF2 ↑
24%
24%
2 LaF3 + 3 O2 → La2O3 + 3 OF2 ↑
33%
33%
After thermal treatment of LaF3, the XRD pattern gives important information by informing us about the final product obtained. To follow the evolution of the structure as a function of the temperature, a heat treatment at 1000 °C was applied in a furnace. A LaOF formation around 1000 °C is confirmed by comparing the patterns of our heated sample with that of the literature [21,23] with an almost perfect match (Figure 3). EDX results support the production of this product with average atomic percentages of 34.1, 33.2 and 32.7% of lanthanum, oxygen and fluorine, respectively. Theoretically, these values are equal to 33.33% for each element.
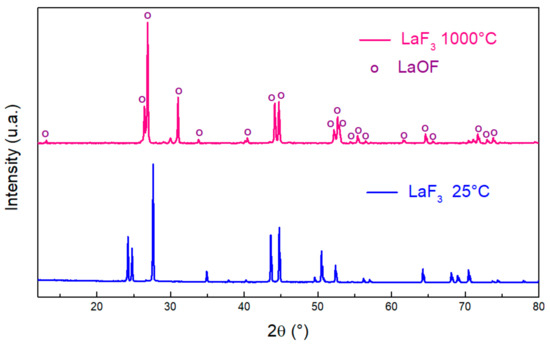
Figure 3.
XRD patterns of LaF3 before (blue) and after (pink) thermal treatment at 1000 °C.
On the other hand, the peaks present in the XRD pattern of the sample after thermal treatment of LaF3 in a furnace at 1500 °C correspond mainly to the known peaks of La2O3 (red pattern in Figure 4) [24]. However, some peaks do not correspond to the La2O3 structure. To puzzle out this problem and better understand the origin of these peaks, our sample was studied by XRD a week after its thermal treatment, and the same XRD pattern appears. We then performed the XRD of the same sample after 4 weeks. The obtained pattern shows a structure very close to that of La(OH)3 [25] (green pattern in Figure 4). The production of lanthanum hydroxide is due to a reaction, at room temperature, between La2O3 and water from the atmosphere [26,27].
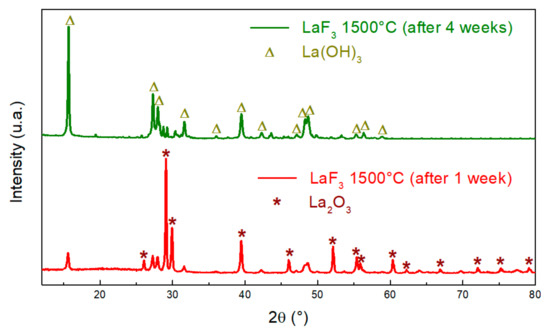
Figure 4.
XRD patterns of the LaF3 heated at 1500 °C after 1 week (red) and after 4 weeks (green).
Consequently, the thermal treatment of LaF3 at very high temperature leads to the formation of La2O3, which is a compound confirmed by EDX measurements with average atomic percentages very close to those theoretically calculated (Table 4). The presence of fluorine in very small quantity (0.9%) is always observed, which is probably coming from the residual non-evaporated fluorine because of the shape of the crucible, preventing oxidation of the entire sample. However, the exposure of the product to humidity in the air leads to its hydrolysis to give La(OH)3. To avoid this hydrolysis, the product will be stored under an inert atmosphere.
Table 4.
Theoretical and average atomic percentages obtained by EDX of the different elements constituting the three studied compounds after thermal treatment.
Concerning the two oxides, the obtained results by the EDX show that the changing of their composition by thermal treatment remains very limited. Indeed, the average atomic percentages obtained from the elements are very close to the expected values.
Germanium dioxide evaporates completely at 1500 °C. Therefore, we applied a thermal treatment at 1000 °C; it retains its structure without any reaction with air humidity, as shown in the XRD pattern in Figure 5.
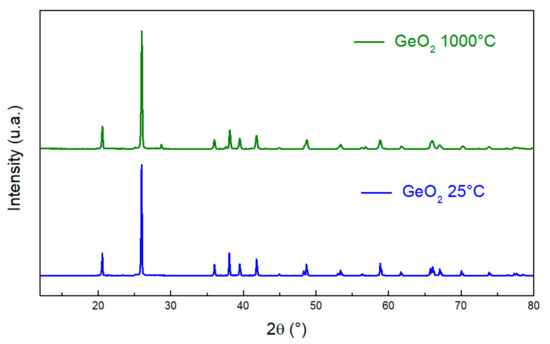
Figure 5.
XRD patterns of GeO2 before (blue) and after (green) thermal treatment at 1000 °C.
On the other hand, the amorphous structure of silica begins to crystallize into quartz [28] at 1100 °C; and at 1500 °C, it gives the cristobalite crystalline phase (Figure 6) [29].
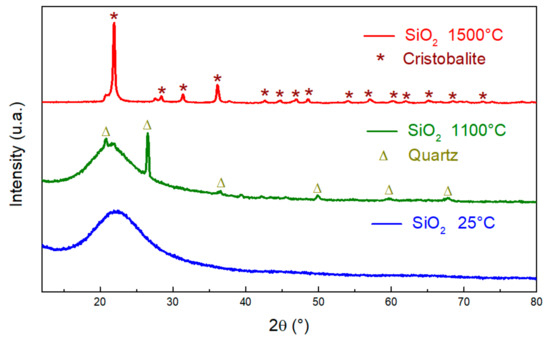
Figure 6.
XRD patterns of SiO2 before (blue) and after thermal treatment at 1100 °C (green) and 1500 °C (red).
3.2. Binary and Ternary Systems
The expected reactions between silica and LaF3 (Reaction 5) and between germanium dioxide and LaF3 (Reaction 6) as well as the theoretical mass loss after a thermal treatment are as follows:
3.5 SiO2 + 2 LaF3 → 1.5 SiF4 ↑ + La2Si2O7
26%
26%
3.5 GeO2 + 2 LaF3 → 1.5 GeF4 ↑ + La2Ge2O7
29%
29%
After mixing of the three compounds according to Reaction (7), assuming that one oxide reacts completely with LaF3 before the other steps in, the mass losses take theoretically the following values:
3.5 SiO2 + 3.5 GeO2 + 2 LaF3 → 1.5 SiF4 or 1.5 GeF4 + X
16% 23%
16% 23%
The nomenclature of these different mixtures is presented in Table 5.
Table 5.
Nomenclature of different studied mixtures.
3.2.1. TGA of All Mixtures
The evolution of the mass during the thermal treatment of the different mixtures is presented in Figure 7.
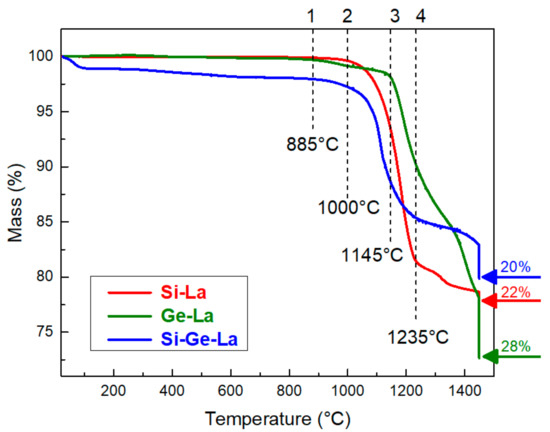
Figure 7.
TGA curves of the three different mixtures.
The total mass losses of Si-La, Ge-La and Si-Ge-La reach 22, 28 and 20%, respectively. These values evolve with the same tendency compared to the theoretical ones. We can also note that these losses are low for Si-La during the isotherm at 1450 °C, while they are important for Ge-La and Si-Ge-La. This difference of loss values for Ge-La and Si-Ge-La can be explained by an evaporation of germanium dioxide, which does not react with LaF3.
It is quite clear that Si-La begins to lose mass at a lower temperature than Ge-La. Indeed, for Si-La, the loss begins at around 1000 °C, and it falls very fast until 1235 °C after losing about 19% of its mass; then, it continues in a less marked way. This temperature (1235 °C) is close to that of the start of loss for LaF3 alone (1300 °C) (Figure 2). The Ge-La curve shows that the mass decreases almost 1.5% between 885 and 1145 °C when it decreases rapidly; then, it slows down a little from 1235 °C. This common inflection point between Si-La and Ge-La curves may be due to the existence of two simultaneous reactions at this high temperature: a first between the oxide and LaF3 already in progress, and a second, which would take place with LaF3 not having not yet reacted and the oxygen.
Looking at the Si-Ge-La curve, we can notice a mass loss of about 1% at the start of the study before 100 °C. This is due to the dehydration of the mixture, which could adsorb water from the atmosphere during preparation. Then, the sharp decrease in mass begins at 1000 °C. It is slower at the same inflection point of Si-La and Ge-La (1235 °C) but at an intermediate value of mass loss (15%). We can notice that the shapes of the curves of Si-La and Si-Ge-La are similar but with a lower loss for Si-Ge-La.
3.2.2. Si-La
After thermal treatment, the binary mixture between silica and LaF3 (Si-La) shows by SEM imaging two different areas: light gray and black (Figure 8). This observation indicates that the reactions are incomplete or produce several compounds. The obtained results by EDX after the analysis of each zone are presented in Table 6. These values indicate that there is a small amount of fluorine that can be attributed to residual LaOF, and that the black area essentially corresponds to unreacted silica. Meanwhile, the other zone may correspond to a product resulting from the reaction between the two compounds in the presence or absence of traces of fluorine or silica.
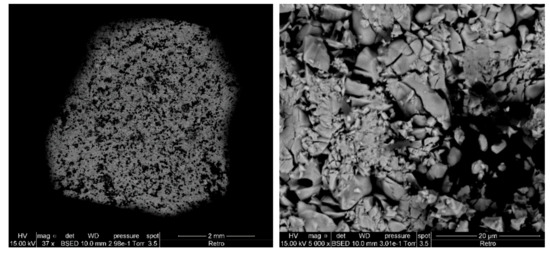
Figure 8.
SEM images of Si-La after thermal treatment at 1500 °C.
Table 6.
EDX results of Si-La after thermal treatment.
The XRD pattern (Figure 9) of the Si-La corresponds perfectly to that of a monoclinic La2Si2O7 [30,31]. The intense peak around 2θ = 22° is attributed to the crystallized silica with a cristobalite structure (Figure 9). The thermal treatment crystallized the silica, which did not react with LaF3 or which did not have the necessary time to react.
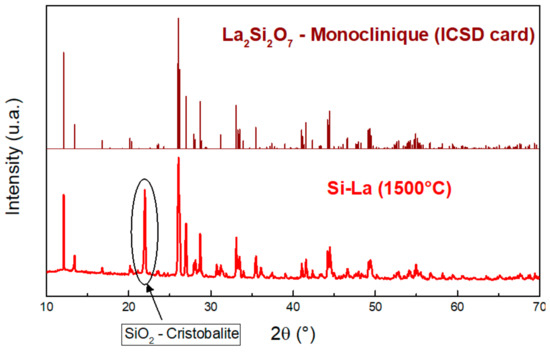
Figure 9.
XRD patterns of Si-La after thermal treatment with the ICSD card of monoclinic La2Si2O7 [30,31]. Adapted with permission from Ref. [30]. Copyright 2022, Zeitschrift fur Kristallographie. Adapted with permission from Ref. [31]. Copyright 2022, Royal Society of Chemistry.
The Raman spectrum in Figure 10 shows that the spectrum of Si-La corresponds strongly to that of La2Si2O7 [32]: especially the two peaks between 450 and 500 cm−1 and the two intense peaks around 750 and 1000 cm−1, respectively. This comes in good agreement with the results obtained previously.
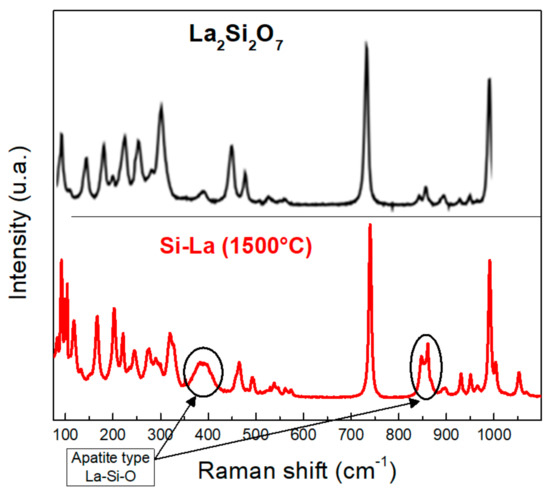
Figure 10.
Raman spectra of Si-La after thermal treatment and La2Si2O7 [32]. Adapted with permission from Ref. [32]. Copyright 2022, American Chemical Society.
We can notice the presence of two different main peaks in the spectrum of Si-La compared to that of La2Si2O7: at 400 and 850 cm−1. This appearance is explained by the formation of other materials. These two peaks are present mainly in the Raman spectra of two La-Si-O apatite types: La9.33Si6O26 and La9.67Si6O26.5 [33].
The XRD results were confirmed by EDX analyses. Table 7 presents the theoretical atomic percentages of the chemical elements in case of obtaining a mixture of La2Si2O7 and silica or each taken separately.
Table 7.
EDX results of the light gray zone and the theoretical atomic percentages of different elements of the possible products in Si-La.
From the comparison of these values with the results obtained by EDX in the light gray zone, noting that the experimental percentage of silicon is higher than that of lanthanum, it appears that the thermal treatment of SiO2 and LaF3 at 1500 °C leads to obtaining a mixture of two products: La2Si2O7 and SiO2. The Raman spectrum agrees with the results obtained by XRD and EDX. However, the latter does not show the existence of apatite in the mixture. The presence of two peaks at 400 and 850 cm−1 in the Raman spectrum can mean that one of these two apatites is formed in small quantities in our final product. As they are obtained from a mixture of La2O3 (itself resulting from the reaction between LaF3 and oxygen in the air) and SiO2 at a temperature above 1250 °C [34], their formation is very difficult under our conditions, which could explain its low concentration in the final product. As shown above, the LaF3 does not evaporate; it reacts with oxygen to form LaOF (at around 1000 °C) and La2O3 (at around 1100 °C). This latter will react with the SiO2 present in the medium, leading also to La2Si2O7 formation through a second way. The multiple reactions of LaF3 with the SiO2 on one hand and the oxygen from air on the other hand make the reacting quantity of silica less than expected, which explains the close numbers between the experimental results and those theoretically calculated for 30/70 and not 50/50 of La2Si2O7 and SiO2. The amount of fluorine obtained by EDX can be explained by LaF3 traces encapsulated in the mixture that did not have the opportunity to react.
3.2.3. Ge-La
The SEM image of the binary mixture between GeO2 and LaF3 after thermal treatment (Ge-La) shows two zones, light gray and dark gray (Figure 11). This also means the presence of two products in the medium after thermal treatment. Table 8 presents the obtained results by EDX after the analysis of each zone. It can be noted that germanium dioxide is always present in the medium regardless of the studied zone despite its evaporation at 1500 °C when it was studied alone.
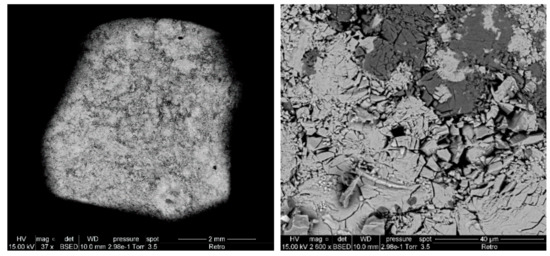
Figure 11.
SEM images of Ge-La after thermal treatment at 1500 °C.
Table 8.
EDX results of the Ge-La after thermal treatment and the theoretical atomic percentages of different elements of the possible products in Ge-La.
The XRD pattern of Ge-La after thermal treatment (Figure 12) shows that the structure of the obtained product corresponds to that of La2Ge2O7 [35].
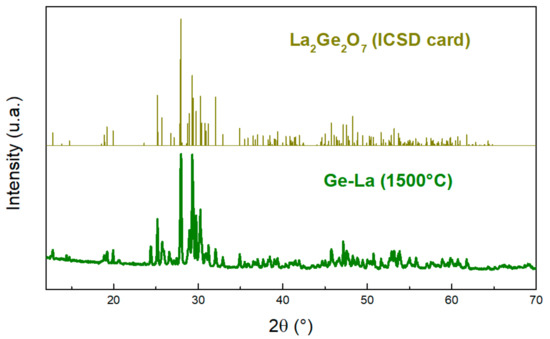
Figure 12.
XRD patterns of Ge-La after thermal treatment with the ICSD card of La2Ge2O7 [35]. Adapted with permission from Ref. [35]. Copyright 2022, Elsevier.
We have not found a Raman spectrum of La2Ge2O7 in the literature to compare it with that of Ge-La after thermal treatment. However, Figure 13 gives us an idea of the expected shape; we compared our spectrum with that of LaBGeO5 [36]. The comparison of these two Raman spectra tends to show that the obtained product could be some type of lanthanum germanium oxide, especially the peaks around 600, 780, 800 and 850 cm−1. According to XRD, the pattern indicates that it would be La2Ge2O7. In addition, the measured composition by EDX in the light gray zone agrees with this composition whose theoretical percentages of the elements in La2Ge2O7 are 63.6% of oxygen and 18.2% of germanium and lanthanum each. The dark gray zone could be associated with the majority presence of GeO2.
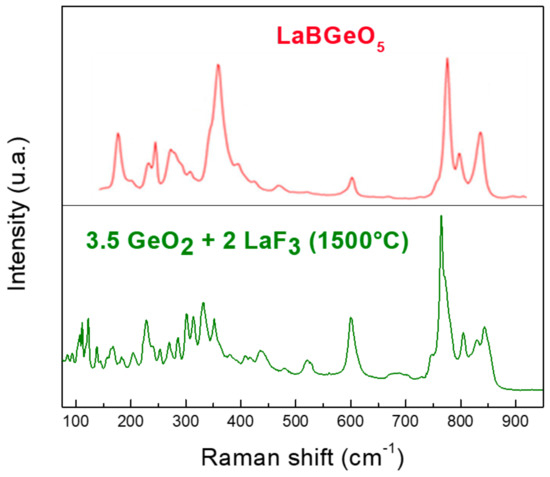
Figure 13.
Raman spectra of Ge-La and LaBGeO5 [36]. Adapted with permission from Ref. [36]. Copyright 2022, John Wiley & Sons.
3.2.4. Si-Ge-La
The SEM image once again shows zones heterogeneity (Figure 14). After analysis by EDX of the dark zones, it was shown that it is mostly silica: 33.20% silicon and 62.60% oxygen with traces of germanium and fluorine. Concerning the light zones, the obtained percentages of the chemical elements for several zones are shown in Table 9. The EDX results show that, for all light zones, the amounts of germanium are relatively low with the presence of traces of fluorine. Meanwhile, those of silicon and lanthanum are very close to each other in the presence of a large amount of oxygen.
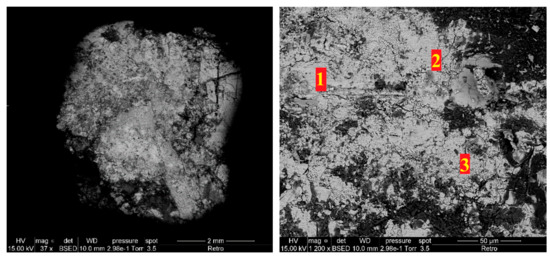
Figure 14.
SEM images of Si-Ge-La after thermal treatment at 1500 °C.
Table 9.
EDX results of light zones of Si-Ge-La after thermal treatment.
The XRD gives a pattern of Si-Ge-La after thermal treatment close to that of La2Si2O7 (Figure 15), but the obtained crystal structure from the latter is tetragonal [37], which is different from that obtained for Si-La after thermal treatment, which was monoclinic. However, as in Si-La after thermal treatment, the intense peak at 2θ = 22° comes from the presence of cristobalite in the medium. In addition, there are no corresponding peaks to a crystallized compound that contains germanium.
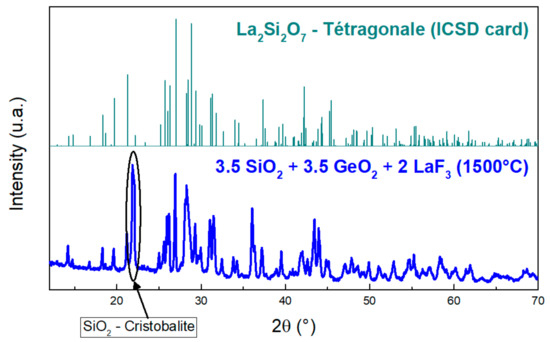
Figure 15.
XRD pattern of Si-Ge-La after thermal treatment with the ICSD card of tetragonal La2Si2O7 [37]. Adapted with permission from Ref. [37]. Copyright 2022, John Wiley and Sons.
Figure 16 shows the Raman spectra of the ternary mixture Si-Ge-La after thermal treatment. This Raman spectrum has many peaks and is clearly distinguished from those obtained for Si-La and Ge-La after thermal treatment. In particular, we do not find the intense peak around 750 cm−1 characteristic of La2Si2O7, but we have its peak around 1000 cm−1 [32]. We can also see the peak around 850 cm−1 characteristic of apatite type La-Si-O [33]. In addition, the shoulder around 650 cm−1 has been attributed to the existence of oxide ions in interstitial sites, which leads to the formation of the germanium atom in coordination 5 [38], which confirms obtaining an apatite-type La-Ge-O.
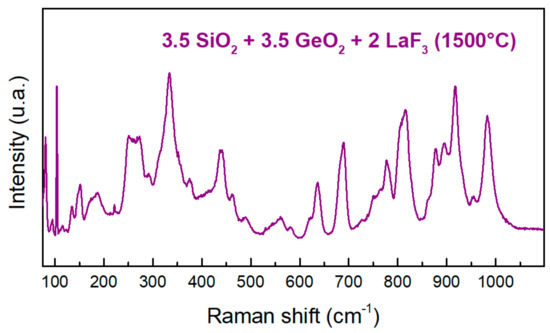
Figure 16.
Raman spectrum of Si-Ge-La after thermal treatment.
According to the TGA curves already presented, the mass loss for Si-La begins 150 °C before that of Ge-La. In addition, mass losses for Si-La and Si-Ge-La start at the same temperature (1000 °C). This may mean that in the ternary mixture, the reaction begins between silica and lanthanum trifluoride to form La2Si2O7. This reaction consumes all of LaF3 before reaching the reaction temperature between the latter with GeO2, which in its turn mostly evaporates in the absence of another reagent. The atomic percentages obtained by EDX of the elements La, Si and O can be attributed to the presence of La2Si2O7. The EDX also shows that a small amount of GeO2 succeeds to react in the medium to give some type of La-Ge-O compound in small amounts, which is in agreement with the obtained Raman spectrum of Si-Ge-La after thermal treatment.
The obtained results go in the direction of the presence of a reaction between fluoride ions and silicon oxide with the release of SiF4. This release was observed in the two binary mixtures but also in the ternary. Fluoride is considered to be a very nucleophilic ion with a high electron density, allowing it to attack the metal center, which is considered to be electrophilic and able to extent its coordination number [39]. The high stability of the M–F bond generates a breaking of the M-O bond, whose bond energies are lower (case of Si). The repetition of these attacks on M leads to the formation of MF4. As an example, the SiF4 formation mechanism is presented in Figure 17. The release of this gas leads to the formation of La2Si2O7 and La2Ge2O7 after the thermal treatment of Si-La and Ge-La, respectively.
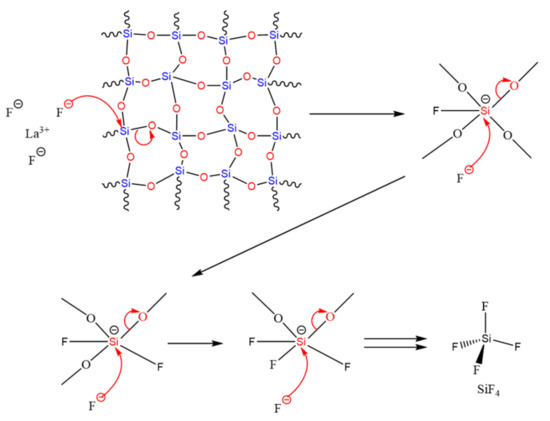
Figure 17.
SiF4 release mechanism after a reaction between at high temperature silica and fluoride ions from LaF3.
TGA has shown that the reaction in mixtures Si-La and Si-Ge-La begins at a temperature approximately 150 °C lower than that in Ge-La. The weaker energy of the Si-O bond than that of the Ge-O bond (Table 10) promotes a reaction in Si-La at a lower temperature.
Table 10.
The main bond energies.
The similarity of the TGA curve shapes between SiO2-LaF3 and SiO2-GeO2-LaF3, as well as that of the EDX and DRX results, clearly shows that the reaction between fluoride and silicon in the ternary system is in favor compared to that with germanium. The difference in the energies of the metal bonds with oxygen makes the break of the Ge-O bond less favored in the ternary mixture.
The silica quantity is sufficient to react with all of the LaF3, giving the mixed oxide La2Si2O7. The lower temperature of this reaction leads to the consumption of the majority of LaF3 by silica, which leaves only a small amount to react with the germanium dioxide, which at this point has already started to evaporate from the mixture.
The high energy of the Ge-O bond compared to that of F-Ge explains the persistence of germanium oxide noticed by EDX-SEM in GeO2-LaF3 after thermal treatment, which can be explained by a reaction between GeF4 with oxygen of air at the high temperature that leads to the formation of new GeO2.
4. Conclusions
We have studied in this paper the different in the binary systems SiO2-LaF3 and GeO2-LaF3 as well as in the ternary system SiO2-GeO2-LaF3 in order to understand the reactivity of the fluoride ions in the co-doped optical fiber LaF3: Tm3+ which after drawing showed a disappearance of the fluorine as well as an appearance of new nanoparticles in the fiber.
The results showed that silica reacts at lower temperatures than germanium dioxide with lanthanum trifluoride. In addition, the predominant product after a reaction in a ternary mixture is La2Si2O7, always with a tetragonal crystal structure.
In this study, we proposed reactions involved when the quantities of SiO2 and GeO2 are equal. The used amount of LaF3 was the molar stoichiometry of the metal oxide. In the previous studies, the GeO2 and LaF3 quantities do not exceed 2% each in optical fiber. Silica is the raw material that is in very large excess compared to the other two compounds. This means that the predominant reaction, and maybe the only reaction, during the fabrication of the optical fiber is that between LaF3 with an excess of SiO2, which releases SiF4 and produces nanoparticles of La2Si2O7. Considering the required temperatures for this reaction, such a mechanism may start from the densification phase of the porous layer during the MCVD process.
Author Contributions
Conceptualization, W.B. and A.M.; methodology, H.F., D.R.N., W.B. and A.M.; software, H.F.; validation, W.B. and A.M.; formal analysis, H.F.; investigation, H.F. and M.V.; resources, D.R.N., W.B. and A.M.; data curation, H.F.; writing—original draft preparation, H.F.; writing—review and editing, H.F., W.B. and A.M.; visualization, W.B. and A.M.; supervision, W.B. and A.M.; project administration, W.B. and A.M.; funding acquisition, W.B. and A.M. All authors have read and agreed to the published version of the manuscript.
Funding
This research was funded by Agence Nationale de la Recherche (ANR) grant number ANR-14-CE07-0016-01 (project Nice-DREAM).
Institutional Review Board Statement
Not applicale.
Informed Consent Statement
Not applicale.
Data Availability Statement
Not applicale.
Acknowledgments
The authors acknowledge the CNRS and the National Agency for Research (ANR) for their financial support to the project Nice-DREAM (ANR-14-CE07-0016-03).
Conflicts of Interest
The authors declare no conflict of interest.
References
- Auzel, F.; Pecile, D.; Morin, D. Rare earth doped vitroceramics: New, efficient, blue and green emitting materials for infrared up-conversion. J. Electrochem. Soc. 1975, 122, 101. [Google Scholar] [CrossRef]
- Wang, Y.; Ohwaki, J. New transparent vitroceramics codoped with Er3+ and Yb3+ for efficient frequency upconversion. Appl. Phys. Lett. 1993, 63, 3268–3270. [Google Scholar] [CrossRef]
- Gonçalves, M.C.; Santos, L.F.; Almeida, R.M. Rare-earth-doped transparent glass ceramics. Comptes Rendus Chim. 2002, 5, 845–854. [Google Scholar] [CrossRef]
- Liu, X.; Zhou, J.; Zhou, S.; Yue, Y.; Qiu, J. Transparent glass-ceramics functionalized by dispersed crystals. Prog. Mater. Sci. 2018, 97, 38–96. [Google Scholar] [CrossRef]
- Dejneka, M.J. Transparent oxyfluoride glass ceramics. Mrs Bull. 1998, 23, 57–62. [Google Scholar] [CrossRef]
- DiMaio, J.R.; Kokuoz, B.; Ballato, J. White light emissions through down-conversion of rare-earth doped LaF 3 nanoparticles. Opt. Express 2006, 14, 11412–11417. [Google Scholar] [CrossRef]
- Kumar, G.A.; Chen, C.W.; Ballato, J.; Riman, R.E. Optical characterization of infrared emitting rare-earth-doped fluoride nanocrystals and their transparent nanocomposites. Chem. Mater. 2007, 19, 1523–1528. [Google Scholar] [CrossRef]
- Kumar, G.A.; Riman, R.; Snitzer, E.; Ballato, J. Solution synthesis and spectroscopic characterization of high Er3+ content LaF3 for broadband 1.5 μm amplification. J. Appl. Phys. 2004, 95, 40–47. [Google Scholar] [CrossRef]
- Tanabe, S.; Hayashi, H.; Hanada, T.; Onodera, N. Fluorescence properties of Er3+ ions in glass ceramics containing LaF3 nanocrystals. Opt. Mater. 2002, 19, 343–349. [Google Scholar] [CrossRef]
- Gorni, G.; Balda, R.; Fernández, J.; Pascual, L.; Durán, A.; Pascual, M.J. Effect of the heat treatment on the spectroscopic properties of Er3+-Yb3+-doped transparent oxyfluoride nano-glass-ceramics. J. Lumin. 2018, 193, 51–60. [Google Scholar] [CrossRef]
- Kucera, C.; Kokuoz, B.; Edmondson, D.; Griese, D.; Miller, M.; James, A.; Baker, W.; Ballato, J. Designer emission spectra through tailored energy transfer in nanoparticle-doped silica preforms. Opt. Lett. 2009, 34, 2339–2341. [Google Scholar] [CrossRef] [PubMed]
- Vermillac, M.; Lupi, J.F.; Peters, F.; Cabie, M.; Vennegues, P.; Kucera, C.; Neisius, T.; Ballato, J.; Blanc, W. Fiber-draw-induced elongation and break-up of particles inside the core of a silica-based optical fiber. J. Am. Ceram. Soc. 2017, 100, 1814–1819. [Google Scholar] [CrossRef] [Green Version]
- Vermillac, M.; Fneich, H.; Turlier, J.; Cabié, M.; Kucera, C.; Borschneck, D.; Peters, F.; Vennéguès, P.; Neisius, T.; Chaussedent, S.; et al. On the morphologies of oxides particles in optical fibers: Effect of the drawing tension and composition. Opt. Mater. 2019, 87, 74–79. [Google Scholar] [CrossRef] [Green Version]
- Vermillac, M.; Fneich, H.; Lupi, J.F.; Tissot, J.B.; Kucera, C.; Vennéguès, P.; Mehdi, A.; Neuville, D.R.; Ballato, J.; Blanc, W. Use of thulium-doped LaF3 nanoparticles to lower the phonon energy of the thulium’s environment in silica-based optical fibres. Opt. Mater. 2017, 68, 24–28. [Google Scholar] [CrossRef]
- Vermillac, M.; Lupi, J.F.; Fneich, H.; Turlier, J.; Cabié, M.; Kucera, C.; Borschneck, D.; Peters, F.; Chaussedent, S.; Vennegues, P.; et al. Thulium-doped nanoparticles and their properties in silica-based optical fibers. In Fiber Lasers and Glass Photonics: Materials through Applications; International Society for Optics and Photonics: Bellingham, WA, USA, 2018. [Google Scholar]
- Haynes, W.M. CRC Handbook of Chemistry and Physics; CRC Press: Boca Raton, FL, USA, 2014. [Google Scholar]
- Smith, G.T.; Isaacs, P.B. The crystal structure of quartz-like GeO2. Acta Crystallogr. 1964, 17, 842–846. [Google Scholar] [CrossRef]
- Baur, W.H.; Khan, A.A. Rutile-type compounds. IV. SiO2, GeO2 and a comparison with other rutile-type structures. Acta Crystallogr. Sect. B Struct. Crystallogr. Cryst. Chem. 1971, 27, 2133–2139. [Google Scholar] [CrossRef]
- Staritzky, E.; Asprey, L.B. Crystallographic Data. 157. Lanthanum Trifluoride, LaF3; 158. Neodymium Trifluoride, NdF3. Anal. Chem. 1957, 29, 856–857. [Google Scholar] [CrossRef]
- Neuville, D.R. From Glass to Crystal: Nucleation, Growth and Phase Separation: From Research to Applications; EDP Sciences: Les Ulis, France, 2017. [Google Scholar]
- Zhu, B.; Chen, N.; Zhu, D.; Li, Y.; Sun, W.; Liu, G.; Du, G. Thermal annealing of LaF3: Eu3+ nanocrystals synthesized by a solvothermal method and their luminescence properties. J. Sol-Gel Sci. Technol. 2013, 66, 126–132. [Google Scholar] [CrossRef]
- Zachariasen, W. Crystal chemical studies of the 5f-series of elements. XIV. Oxyfluorides, XOF. Acta Crystallogr. 1951, 4, 231–236. [Google Scholar] [CrossRef]
- Wyckoff, R. Crystal Structures, Interscience. N. Y. 1963, 1, 254. [Google Scholar]
- Müller-Buschbaum, H.; Schnering, H. Zur Struktur der A-Form der Sesquioxide der Seltenen Erden. Strukturuntersuchungen an La2O3. Z. Anorg. Allg. Chem. 1965, 340, 232–245. [Google Scholar] [CrossRef]
- Beall, G.; Milligan, W.T.; Wolcott, H.A. Structural trends in the lanthanide trihydroxides. J. Inorg. Nucl. Chem. 1977, 39, 65–70. [Google Scholar] [CrossRef]
- Gangwar, B.P.; Palakollu, V.; Singh, A.; Kanvah, S.; Sharma, S. Combustion synthesized La2O3 and La(OH)3: Recyclable catalytic activity towards Knoevenagel and Hantzsch reactions. RSC Adv. 2014, 4, 55407–55416. [Google Scholar] [CrossRef]
- Singh, A.; Palakollu, V.; Pandey, A.; Kanvah, S.; Sharma, S. Green synthesis of 1, 4-benzodiazepines over La2O3 and La(OH)3 catalysts: Possibility of Langmuir–Hinshelwood adsorption. RSC Adv. 2016, 6, 103455–103462. [Google Scholar] [CrossRef] [Green Version]
- Gualtieri, A.F. Accuracy of XRPD QPA using the combined Rietveld–RIR method. J. Appl. Crystallogr. 2000, 33, 267–278. [Google Scholar] [CrossRef]
- Pluth, J.; Smith, J.; Faber, J., Jr. Crystal structure of low cristobalite at 10, 293, and 473 K: Variation of framework geometry with temperature. J. Appl. Phys. 1985, 57, 1045–1049. [Google Scholar] [CrossRef]
- Nørlund Christensen, A. Investigation by the use of profile refinement of neutron powder diffraction data of the geometry of the [Si2O7]6− ions in the high temperature phases of rare earth disilicates prepared from the melt in crucible-free synthesis. Z. Krist.-Cryst. Mater. 1994, 209, 7–13. [Google Scholar] [CrossRef]
- Wan, J.; Liu, Q.; Liu, G.; Zhou, Z.; Ni, J.; Xie, R.J. A novel Eu2+ activated G-La2Si2O7 phosphor for white LEDs: SiC-reduction synthesis, tunable luminescence and good thermal stability. J. Mater. Chem. C 2017, 5, 1614–1623. [Google Scholar] [CrossRef]
- Fukuda, K.; Asaka, T.; Hamaguchi, R.; Suzuki, T.; Oka, H.; Berghout, A.; Béchade, E.; Masson, O.; Julien, I.; Champion, E.; et al. Oxide-ion conductivity of highly c-axis-oriented apatite-type lanthanum silicate polycrystal formed by reactive diffusion between La2SiO5 and La2Si2O7. Chem. Mater. 2011, 23, 5474–5483. [Google Scholar] [CrossRef]
- Guillot, S.; Beaudet-Savignat, S.; Lambert, S.; Roussel, P.; Tricot, G.; Vannier, R.N.; Rubbens, A. Local relaxation in lanthanum silicate oxyapatites by Raman scattering and MAS-NMR. J. Raman Spectrosc. 2011, 42, 1455–1461. [Google Scholar] [CrossRef]
- León-Reina, L.; Losilla, E.R.; Martínez-Lara, M.; Bruque, S.; Llobet, A.; Sheptyakov, D.V.; Aranda, M.A. Interstitial oxygen in oxygen-stoichiometric apatites. J. Mater. Chem. 2005, 15, 2489–2498. [Google Scholar] [CrossRef]
- Vetter, G.; Queyroux, F. Détermination structurale de la forme de haute température du composé La4 [Ge3O10][GeO4]: Analyse comparative des structures tricliniques des germanates de terres rares de formule globale Ln2Ge2O7. J. Solid State Chem. 1988, 73, 287–297. [Google Scholar] [CrossRef]
- Assi, F.; Ferriol, M.; Cochez, M.; Aillerie, M. Growth of LaBGeO5 crystal fibers by the micro-pulling down technique. Cryst. Res. Technol. 2016, 51, 87–93. [Google Scholar] [CrossRef]
- Müller-Bunz, H.; Schleid, T. Über den H-und A-Typ von La2 [Si2O7]. Z. Anorg. Allg. Chem. 2000, 626, 2549–2556. [Google Scholar] [CrossRef]
- Orera, A.; Sanjuán, M.L.; Kendrick, E.; Orera, V.M.; Slater, P.R. Raman spectroscopy studies of apatite-type germanate oxide ion conductors: Correlation with interstitial oxide ion location and conduction. J. Mater. Chem. 2010, 20, 2170–2175. [Google Scholar] [CrossRef] [Green Version]
- Carre, F.; Chuit, C.; Corriu, R.J.; Fanta, A.; Mehdi, A.; Reye, C. Use of the 2, 6-bis [(dimethylamino) methyl] phenyl ligand for the study of nucleophilic substitution at hexacoordinate silicon centers. evidence suggestive of a heptacoordinate silicon transition state. Organometallics 1995, 14, 194–198. [Google Scholar] [CrossRef]
- Solomon, E.I.; Scott, R.A.; King, R.B. Computational Inorganic and Bioinorganic Chemistry; John Wiley & Sons: Hoboken, NJ, USA, 2013. [Google Scholar]
- Ehlert, T.; Margrave, J. Mass-Spectrometric Studies at High Temperatures. II. The Dissociation Energies of the Monofluorides and Difluorides of Silicon and Germanium. J. Chem. Phys. 1964, 41, 1066–1072. [Google Scholar] [CrossRef]
- Farber, M.; Srivastava, R. Mass spectrometric determination of the heats of formation of the silicon fluorides SiF(g), SiF2(g) and SiF3(g). J. Chem. Soc. Faraday Trans. 1 Phys. Chem. Condens. Phases 1978, 74, 1089–1095. [Google Scholar] [CrossRef]
- Pedley, J.; Marshall, E. Thermochemical data for gaseous monoxides. J. Phys. Chem. Ref. Data 1983, 12, 967–1031. [Google Scholar] [CrossRef] [Green Version]
Publisher’s Note: MDPI stays neutral with regard to jurisdictional claims in published maps and institutional affiliations. |
© 2022 by the authors. Licensee MDPI, Basel, Switzerland. This article is an open access article distributed under the terms and conditions of the Creative Commons Attribution (CC BY) license (https://creativecommons.org/licenses/by/4.0/).