Article

Crack Growth Tests in Air Plasma-Sprayed Yttria Coatings for Alumina Ceramic Matrix Composites

German Aerospace Center (DLR), Institute of Materials Research, D-51170 Cologne, Germany
*
Author to whom correspondence should be addressed.
Ceramics 2019, 2(3), 514-524; https://doi.org/10.3390/ceramics2030039
Submission received: 26 June 2019 / Revised: 16 July 2019 / Accepted: 1 August 2019 / Published: 19 August 2019

Abstract

:
Yttria coatings for all-oxide combustor walls were tested for their crack-growth behavior. These environmental and thermal barrier Y2O3-coatings were processed by atmospheric plasma spraying (APS). The stiffness and strength were measured for as-received and aged samples that were heat treated at 1000 °C, 1100 °C and 1200 °C for a 10 h dwell time. The results show a clear development with respect to the aging conditions. The changes of the modulus and the bending strength indicate that the microstructural changes are not completed, even after aging at 1200 °C for 10 h. The fracture toughness was tested for different orientations on samples aged at 1200 °C. Bending tests as well as indentation experiments were conducted. Furthermore, a bending device was designed to observe the crack-growth in situ. The device had to be rigid and is driven by a piezo stack. The crack growth resistance shows differences in the rise of the R-curves for different orientations of the crack propagation. This is in agreement with the microstructure that results from the plasma spray process.

1. Introduction

All-oxide ceramic matrix composites (CMC) are alternatives to metallic materials for the combustor walls of aero-engines and gas turbines for power generation. The benefit is the higher operation temperature, but problems due to a lower thermal conductivity and hot gas corrosion have to be taken into account. Cooling problems can be reduced by comprehensive cooling concepts and thermal barrier coatings (TBC). Furthermore, the material needs to be protected by environmental barrier coatings (EBC) from thermochemical attacks such as corrosion caused by hot gas, ingested dust, sand or volcanic ash. Plasma sprayed yttria coatings are a favorable choice as TBC/EBCs for all-oxide combustor walls for several reasons [1]. The coefficient of thermal expansion matches the alumina-based substrate, and the resistance to corrosion is high in comparison to formerly tested yttria partially stabilized zirconia (Y-PSZ).
Alumina CMCs coated with atmospheric plasma sprayed yttria (APS-Yttria) had been tested in the framework of a combustor project at the German Aerospace Center (DLR) [2,3]. A thickness of some 0.3 mm was a reasonable limit for the physical vapor deposition technique, which was used before. The deposition rate of the plasma coating process enabled thicknesses of 1 mm and more. Hereby, the temperature level of the substrate toward the hot gas side was distinctly reduced. Two can-type combustion liners were designed and manufactured for the High Pressure Cooling Rig (HPCR) at the facilities of the Institute of Propulsion Technology. Figure 1 shows the liner with an APS-Yttria TBC/EBC (thickness 1 mm) and 3540 laser drilled effusion holes. The axes of the cooling holes are strongly inclined. The angle is only 25° with respect to the surface plane. From the perspectives of modelling and stress analysis, these coatings were regarded as only having a thermal function. No mechanical aspects in terms of the stiffness and strength were then taken into account. Basically, the mechanical data of the specific Y2O3-plasma coatings had not been determined at that time. The paper presents the beginning of the mechanical characterization of this coating material, especially given that the desired coating thicknesses will rather increase for this substrate and its potential application as combustor walls.

2. Materials and Methods

2.1. Coating Procedure, Sample Preparation and Microstructural Analysis

The high deposition rate of air plasma spraying allows for the processing of thick coatings and samples that are suitable for mechanical testing in the comfortable geometry of bending bars. The processing was conducted by the Leibniz University of Hannover at the Materials Institute/Department FORTIS in Witten (Germany). A plasma spray gun (Sulzer-Metco, Wohlen, Switzerland) was used at a working distance of 130 mm from the substrate. A spray powder (99.9% Y2O3) with a particle size of 25–45 µm from GTV mbH (Luckenbach, Germany) was processed.
The substrates were plates of highly porous alumina CMCs and had dimensions of 110 × 110 × 3 mm3. Three plates (P1–P3) were processed for the investigations. After grinding off the substrate, free-standing yttria samples of 3.5 mm thickness were obtained. The bending bars were cut from the samples by a diamond saw. They were ground and polished before the subsequent thermal treatment. The dimensions of the bending bars are 45 × 5.5 × 3.5 mm3. Microstructural analyses of polished in-plane and through-thickness cross sections were performed by means of a scanning electron microscope (SEM-DSM Ultra 55, Carl Zeiss NTS, Wetzlar, Germany).
Slots were introduced for the fracture mechanical tests and subsequently sharpened by means of a razor blade device. With the oscillating razor blade and a 3 µm diamond particle suspension, small notch radii of 15–20 µm could be achieved.
Besides material in the as-received state, thermally aged materials were investigated. The specimens were heat treated at three different temperatures (1000 °C, 1100 °C and 1200 °C). The dwell time was 10 h for all of the aged samples. A maximum aging temperature of 1200 °C was chosen as this temperature appears to be a reasonable limit for a long-term application. Though the dwell temperature seems to be comparably short, it was assumed that at least major shares of the microstructural changes occur in the first few hours of aging.

2.2. Mechanical Testing

The bending tests with respect to the stiffness and bending strength were conducted by a standard spindle drive test machine UTS (Zwick, Ulm, Germany). The deflection was recorded by means of one central and two outer linear variable displacement transducers (LVDT), which enable the determination of the bending line and consequently the Young’s modulus. The bending tests were conducted as 4-point bending tests. The inner span was 20 mm and the outer span 40 mm.
The fracture toughness KIc was determined by a single edge notched beam specimen (SENB) and by indentation strength in bending (ISB). In the case of SENB, the fracture toughness is calculated by:
K Ic = Y I σ B a
where σB is the bending stress, a is the crack length, and YI is the corresponding geometry function of the crack length a for SENB [4]:
Y I = 1.1215   π β 3 / 2   [ 5 8 5 12 α + 1 8 α 2 + 5 α 2 β 6 + 3 8 exp ( 6.1342 α β ) ]
α = a W ,   β = 1 α and W is the sample height.
The fracture toughness via ISB was determined according to Chantikul et al. [5]:
K Ic = 0.59 ( E H ) 1 / 8 ( σ c   · F ind 1 / 3 ) 3 / 4
Here, the Vickers hardness H, the nominal bending strength σc of the specimen and the indentation force Find are used. Hardness tests were conducted with “Finotest 38163” (Karl Frank, Germany).
The fracture toughness under shear load (Mode II) was tested by means of an asymmetric four point bending fixture (Figure 2). Here, geometrical arrangements are preferred, showing a negligible Mode-I contribution [4,6]. The sample height W ≈ 4 mm and the half axial distance D = 2 mm of the inner rollers to the notch were chosen to score the middle of the range 0.375 < D/W < 0.625, where the approximation for the geometry function YII is valid [7]:
Y II = 6.949 α 9.092 α 2 + 25.624 α 3 46.601 α 4 + 30.261 α 5
A suitable device was designed and built for the observation of the crack growth resistance (“R-curves”). The aim was to have a test device that is small enough to fit into a conventional microscope and that is as rigid as possible to enable stable crack growth even for rather brittle ceramics like the yttria coatings. A massive frame was chosen to achieve a minimum deformation under load. A brief stress FE-analysis showed that the deformation for the maximum expected loads of 100 N is less than half a micron for the load frame in the vicinity of the outer load bearing rollers. The inner rollers are positioned on a crowned support to compensate for minor deviations from the parallelism of the sample surfaces. The load is applied by means of a stiff piezo stack (PI Instrumente, Germany) that has either a maximum force of 3 kN or a maximum travel of 60 µm. Since the displacement of the actuator is limited, a preload spindle is integrated into the load frame. The load cell (500 N, HBM, Darmstadt, Germany) is positioned between the piezo actuator and the support for the inner rollers. Figure 3 shows the piezo bending device. The crack propagation was observed by means of a light microscope Keyence VHX-1000 (Keyence, Neu-Isenburg, Germany), in combination with an x-y-stage and an LVDT to display the position of the crack tip. The crack tip is kept in the cross hairs of the ocular. As the crack propagates, the x-y-stage has to be repositioned to keep the crack tip in the center of the cross hairs. The displacement of the stage directly corresponds to the crack propagation. Data pairs of force and crack propagation (F; Δa) are obtained, resulting in R-curves via Equations (1) and (2). A preliminary test with an yttria bending beam showed stable conditions of crack propagation starting from α = 0.5 up to α = 0.9, where the test could be stopped without a catastrophic failure, even though the ligament size was less than half a millimeter at that time. Facing the fact that yttria materials are rather brittle and that the crack can be driven over the limit of the validity of the K-concept (see below), this simple but rigid device turned out to be more than sufficient for the investigations presented here.

3. Results and Discussion

3.1. Bending Tests

The results of Young’s Modulus from the plates P1–P3 are summarized in Figure 4. The limited number of samples leads to the circumstance that all aging conditions could be tested only from P3. Nevertheless, the stiffness shows a drastic increase with an increasing aging temperature, especially in the case of the samples from P2 and P3. The samples from P1 show a higher stiffness in the as-received state but a distinctly lower increase and lower absolute values at 1200 °C than the samples from P2 and P3. Therefore, a scatter from plate to plate is obvious. The results of the bending strength of these samples are shown in Figure 5 for the different stages of aging, as above for the modulus. The tendencies which were found for the stiffness are reflected in the results of the bending strengths. The strength increases with the aging temperature, and the relationship, when compared to the plates, correlates with the findings on the modulus above.
The moduli are low compared to the data derived from dense yttria, where for example a modulus in the range of 170 GPa was ascertained [8,9] for hot isostatic pressed materials. A brief test of nine as-received samples revealed a density of 92% of the theoretical density. Mechnich and Braue [1] reported a similar value of 93% for former batches of the present material. Nevertheless, no established porosity model can explain a loss in stiffness from 170 GPa down to 74 GPa (1200 °C/10 h) or even 47 GPa (as-received) simply based on the magnitude of the porosity of ≈ 9% for this material. Leigh et al. [10] reported elastic moduli in the range of 12–78% for thermally sprayed alumina and yttria stabilized zirconia. The loss of stiffness could not be explained by the amount of porosity in a porosity model. The pore morphology and an anisotropic microstructure were the reasons for the decrease. In [11], the elastic moduli for Yb2SiO5- and Al6Si2O13-coatings from the APS deposition were reduced to half of the values of the corresponding bulk materials. In that investigation, crack patterns, and not the porosity itself, were found to be the reason for the decreased stiffness.
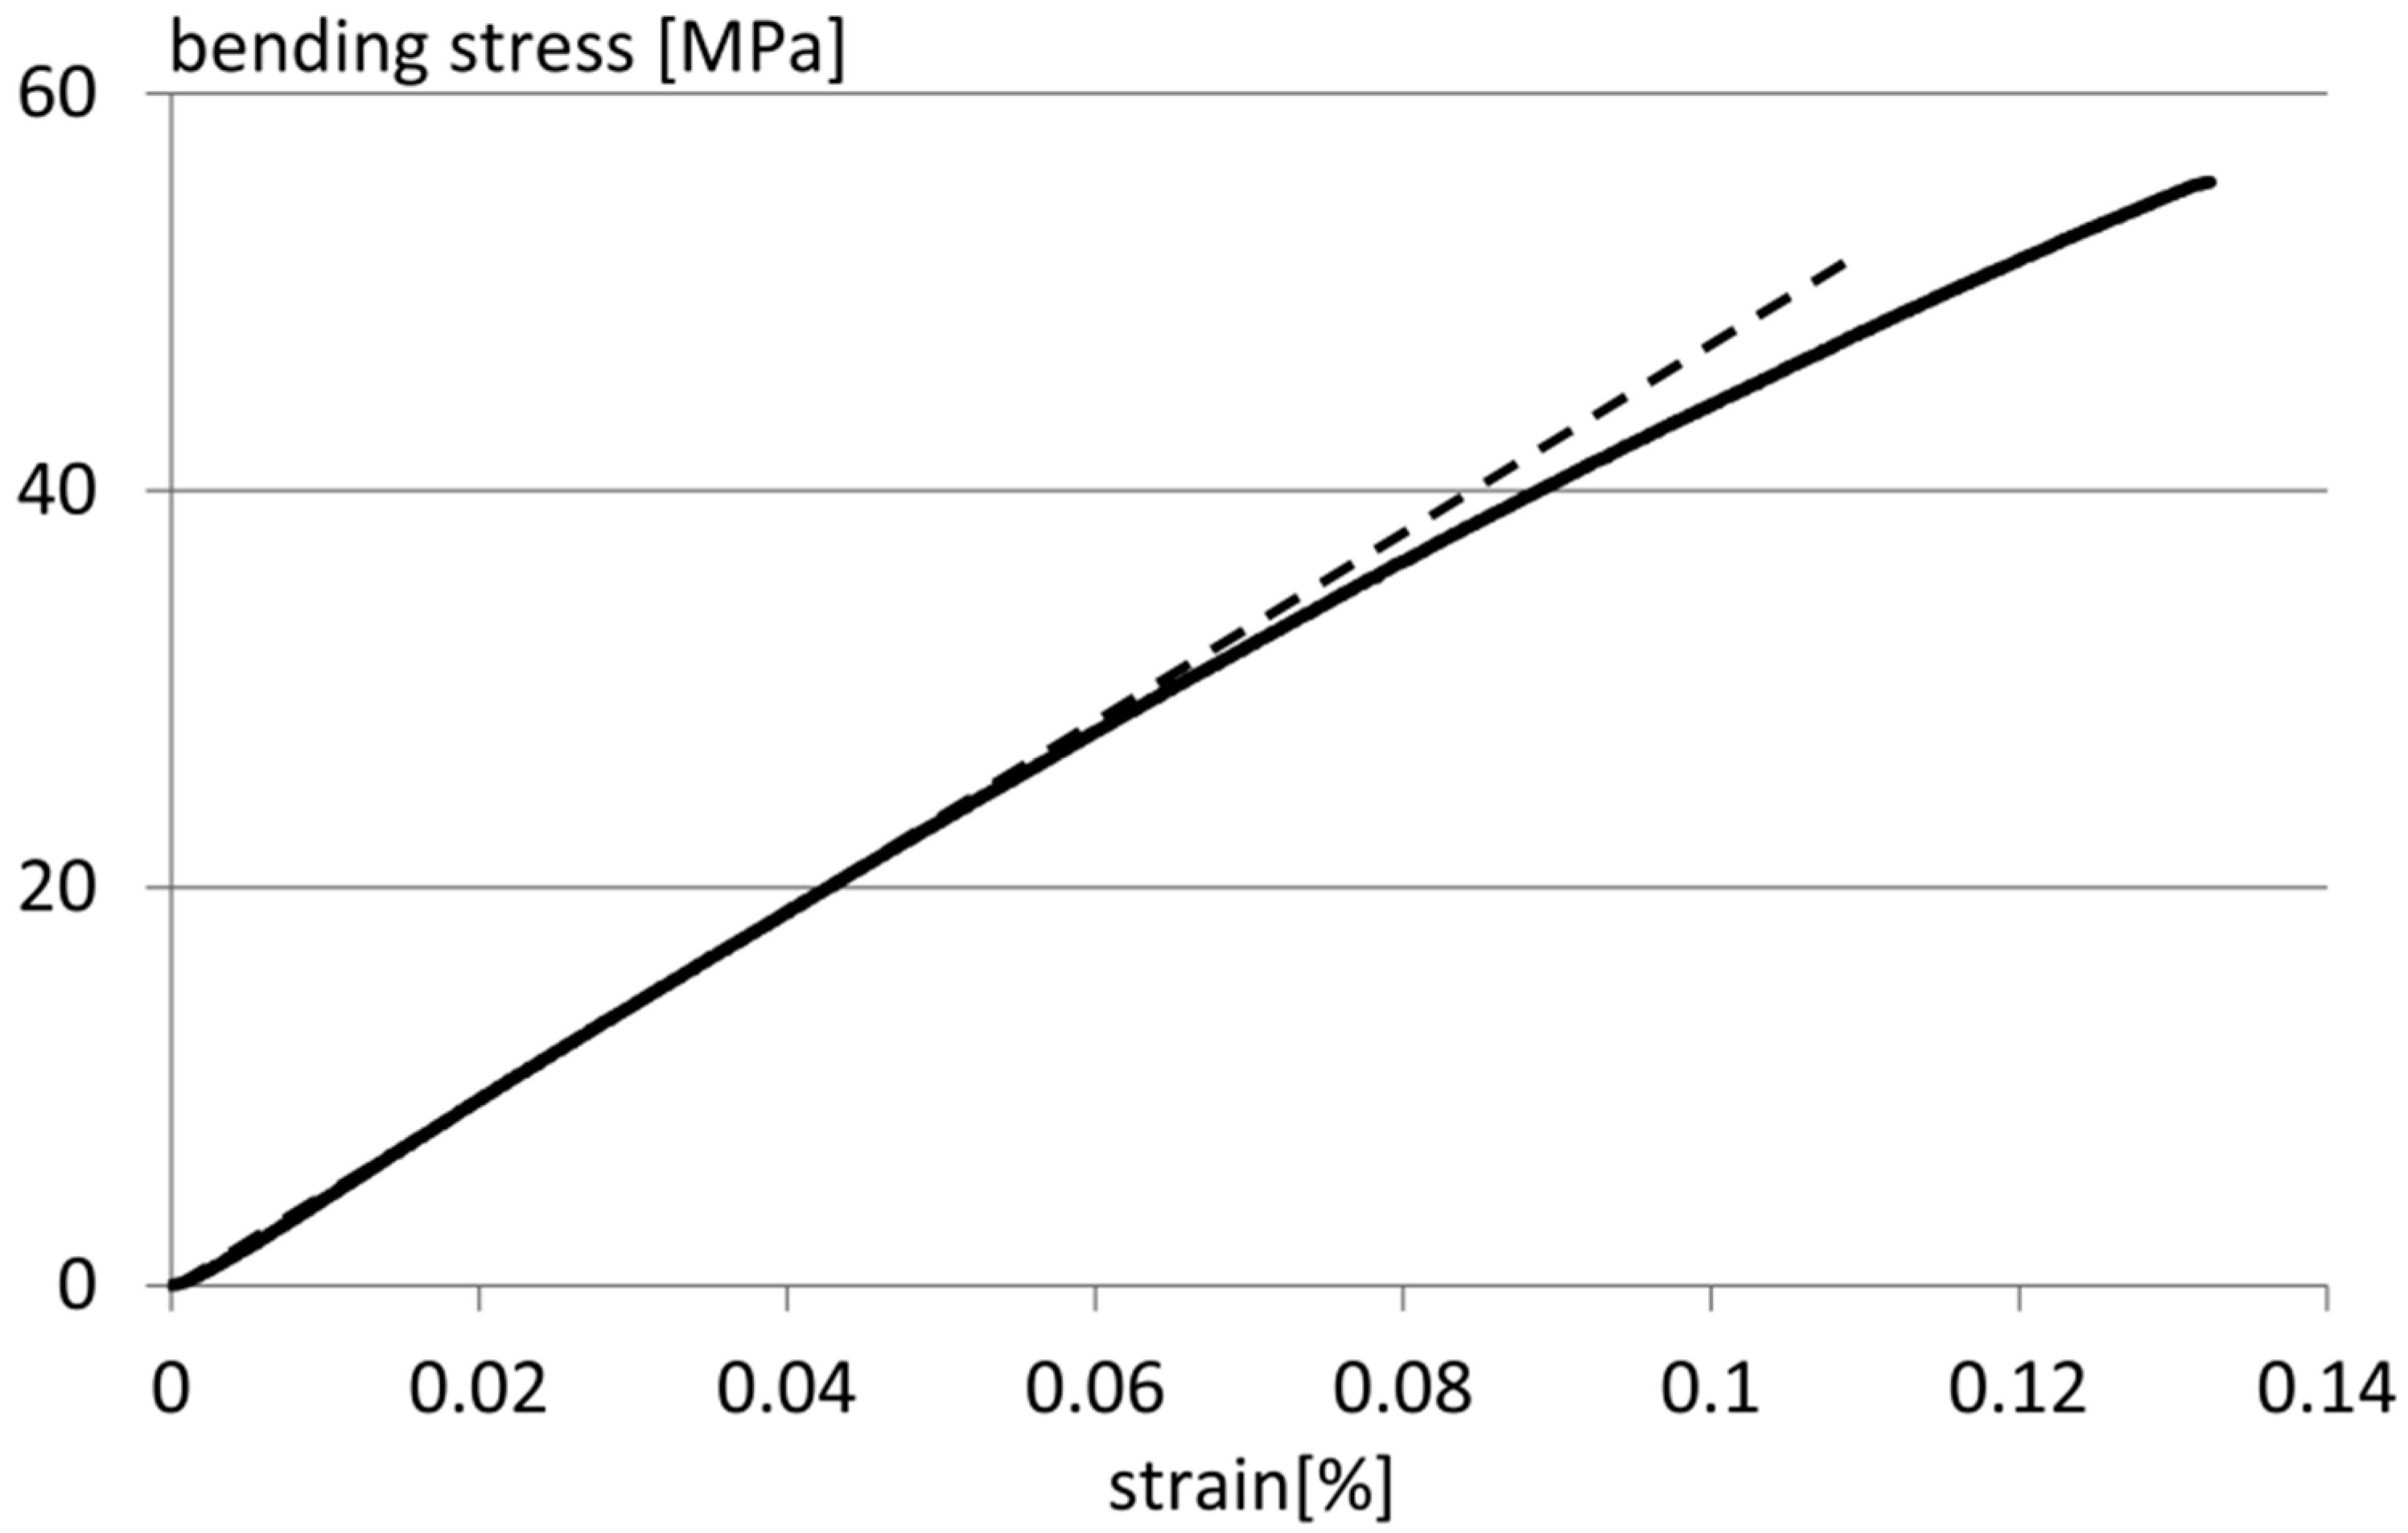
Hence, the loss in stiffness here can rather be explained by the fine crack patterns between the splats that are formed from droplets during the plasma spray process. These cracks have a comparably low influence on the porosity but a larger effect on the ability to transfer the load from splat to splat. In Figure 6, a stress-strain graph of an as-received sample is shown in combination with an extended line of the linear elastic range. The material behavior already deviates at an early point from linear-elastic conditions at stresses of about half of the critical bending stress. This can only be explained by the frictional sliding of the splats or, more likely, by the noticeable onset of damage. This observation also points to the previous findings, as the fine crack pattern in Figure 7 will inevitably lead to an early onset of damage in comparison to materials that are devoid of these cracks.
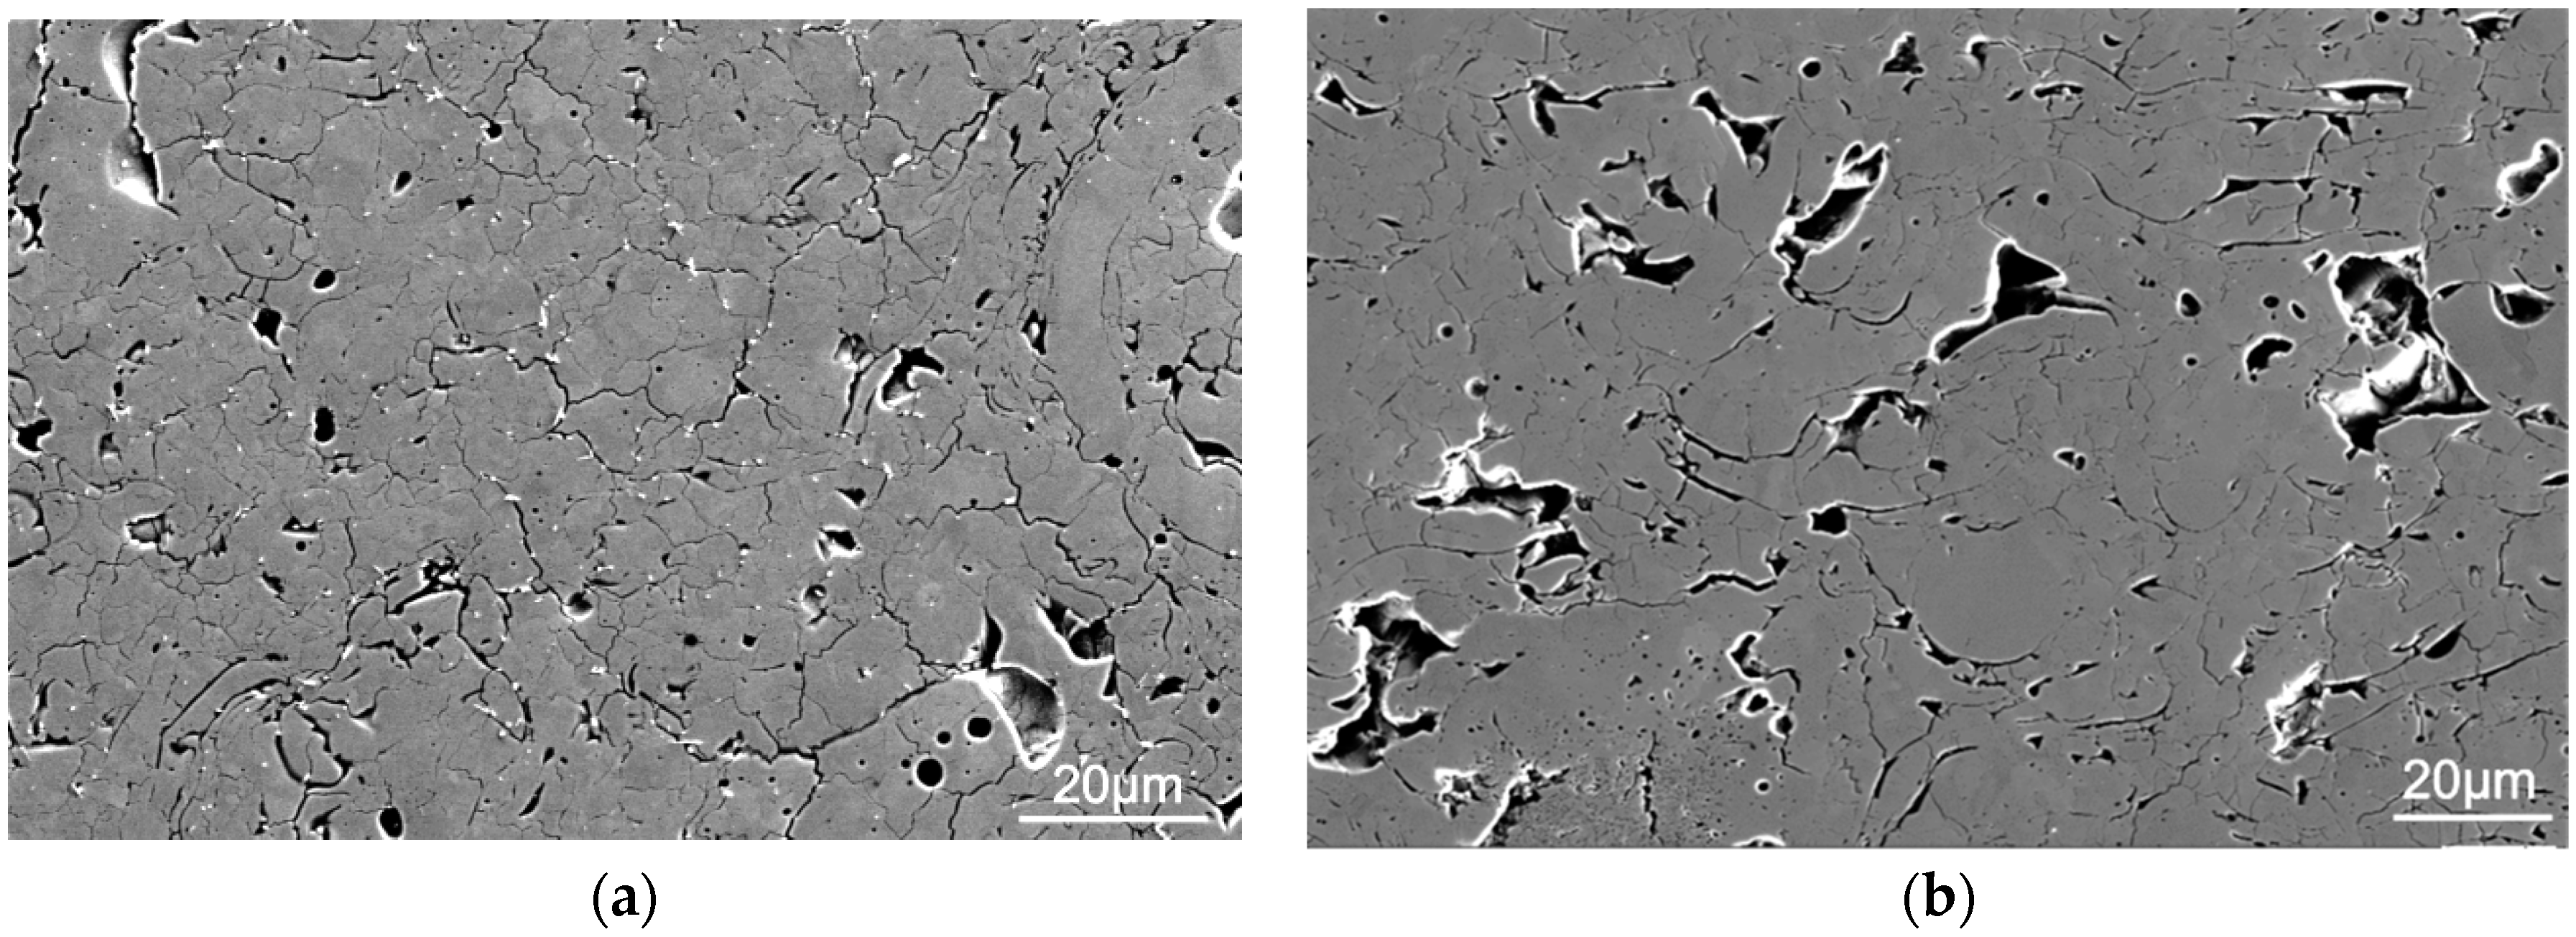
Certainly, the reasons for the increasing stiffness and strength with an aging temperature can be found in microstructural changes. SEM images from two different samples are shown in Figure 7. The “as-received” sample (Figure 7a) has rounded pores, as well as a fine and dense pattern of sharp cracks. The microstructure of the sample with the highest aging temperature (1200 °C) in Figure 7b also clearly shows pores and cracks, but the latter have a lower density. An apparent grain size was analyzed by the linear intercept method [12]. Cracks instead of grain boundaries were used to define the intercepts. The apparent grain size of the as-received sample was 5.8 ± 0.8 µm. The apparent grain size of the aged sample was 8.0 ± 1.1 µm. Thus, the crack density of the aged sample decreased. The porosities were 9 Vol.% for both images.
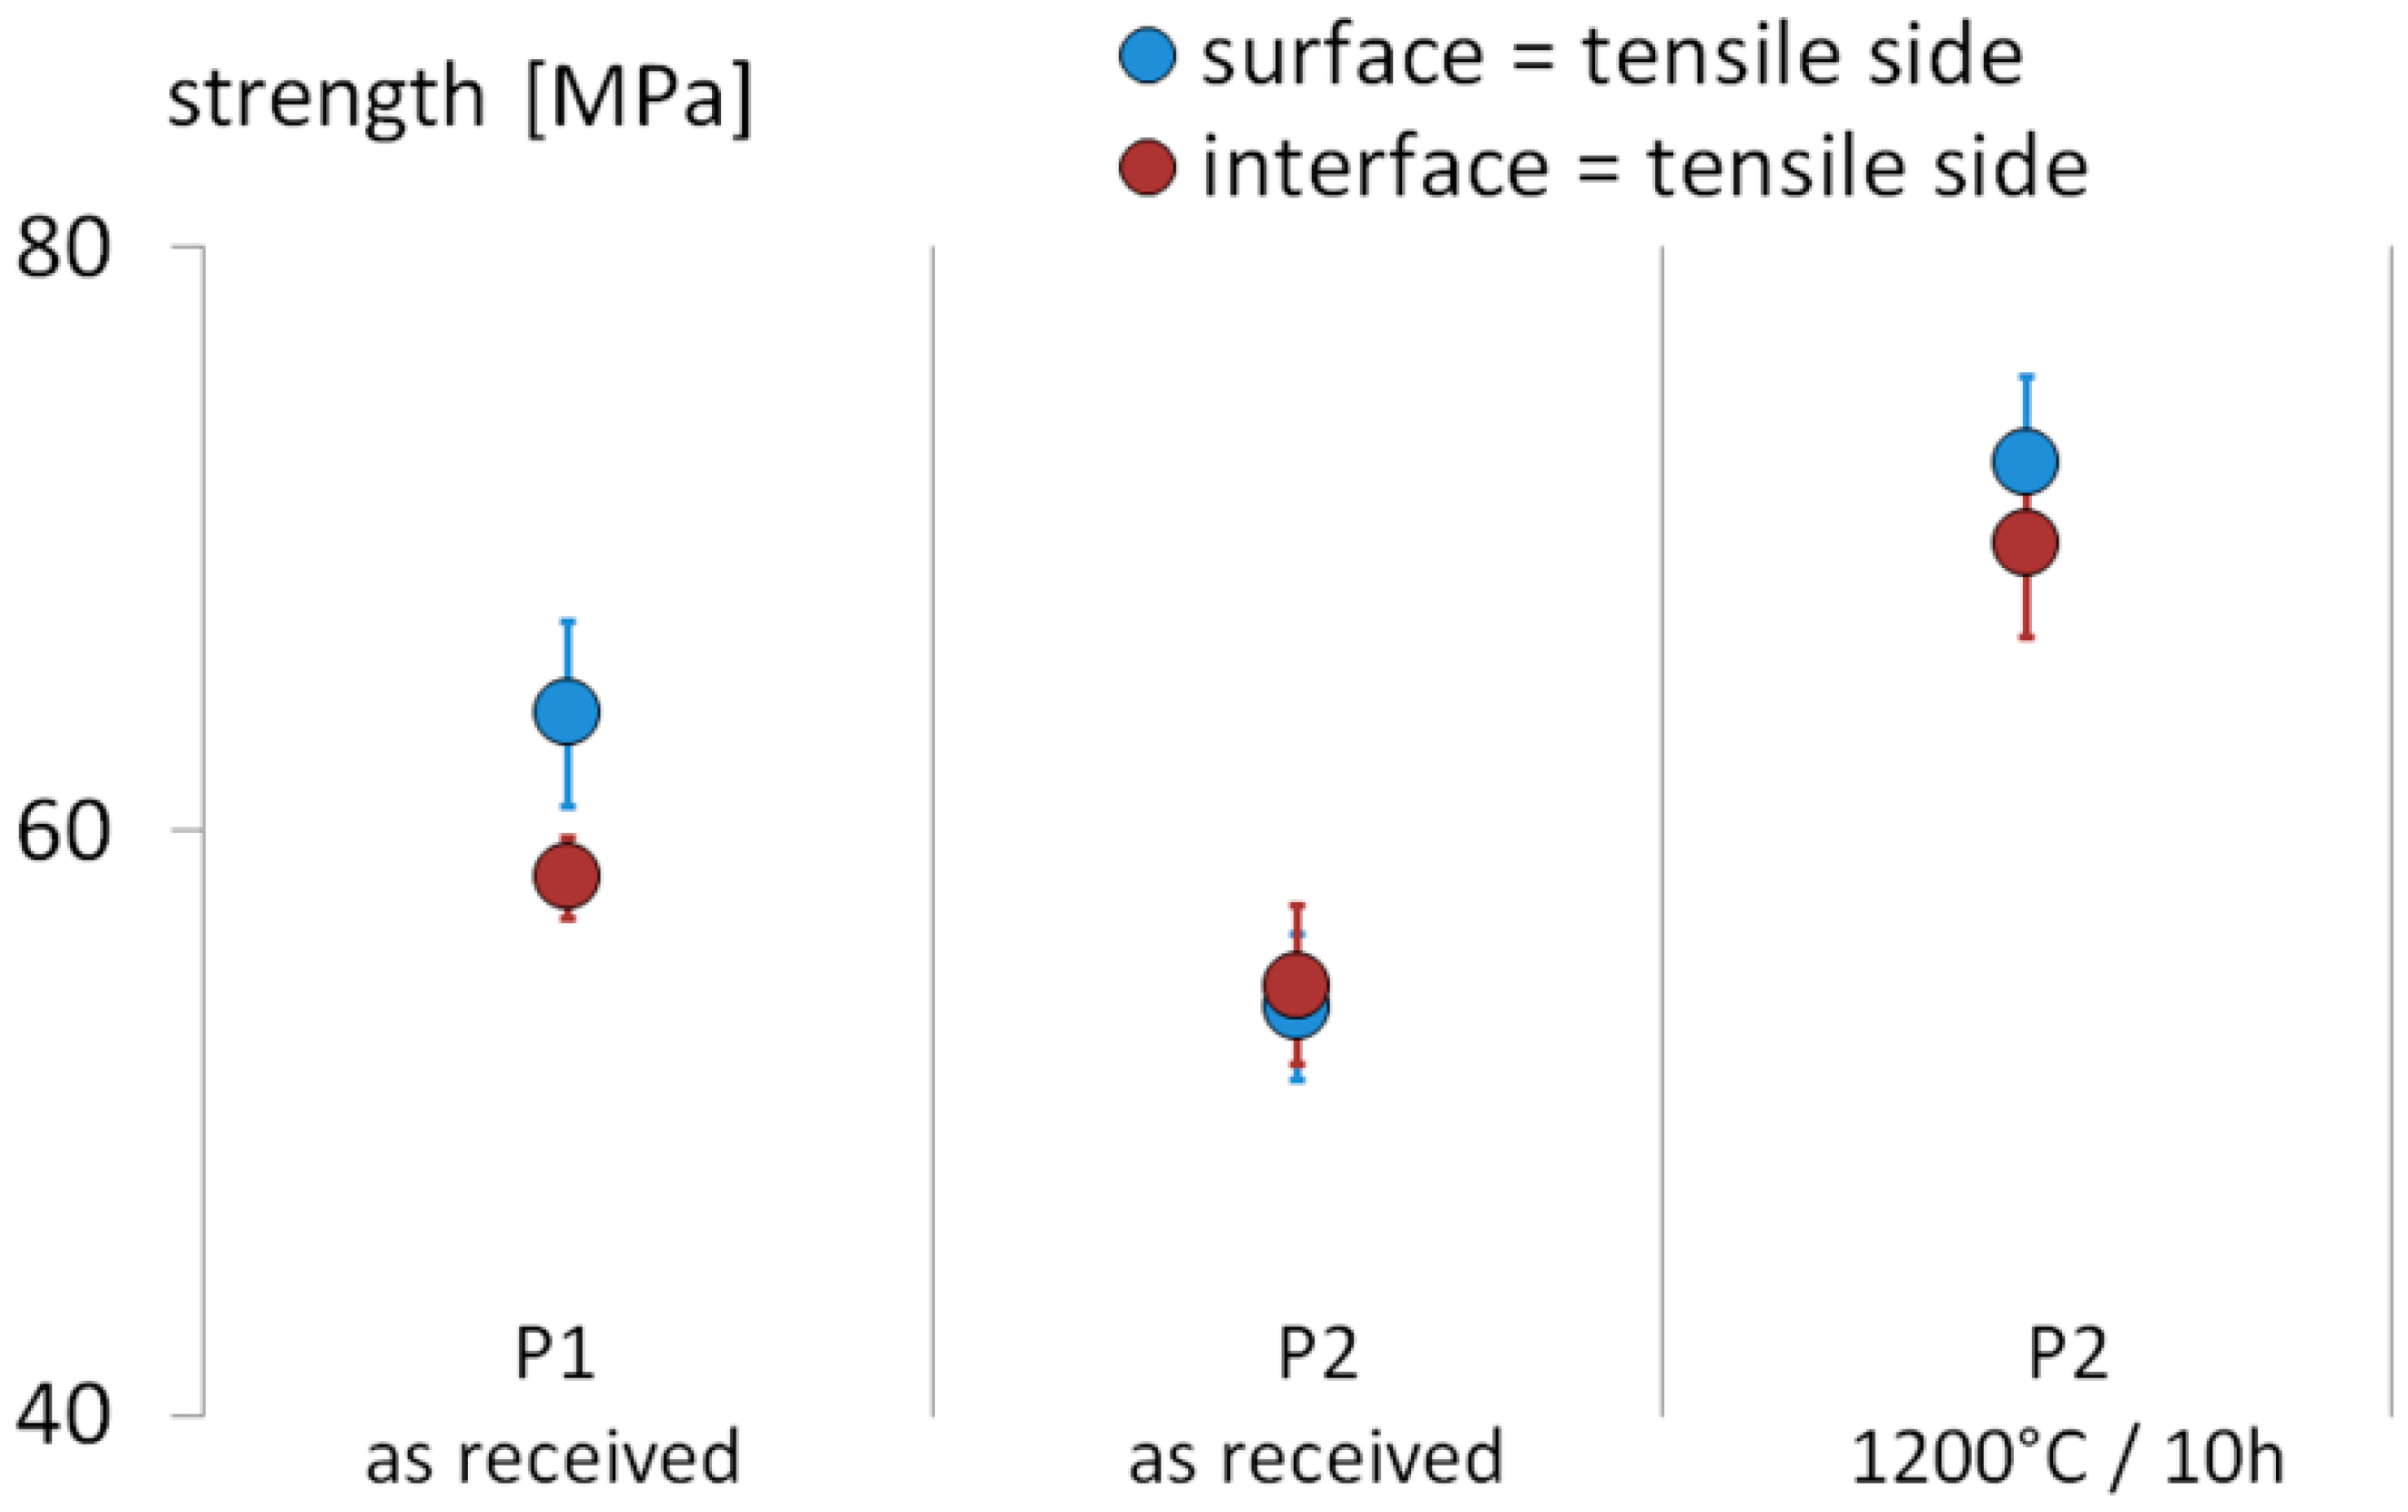
The failure in bending tests occurs on the tensile side. Hence, the samples of the bending tests were split into two groups, where the tensile side of the experiment corresponds to the surface side or the interface side facing the removed substrate. Only little deviations in plate P1 could be found, as shown in 
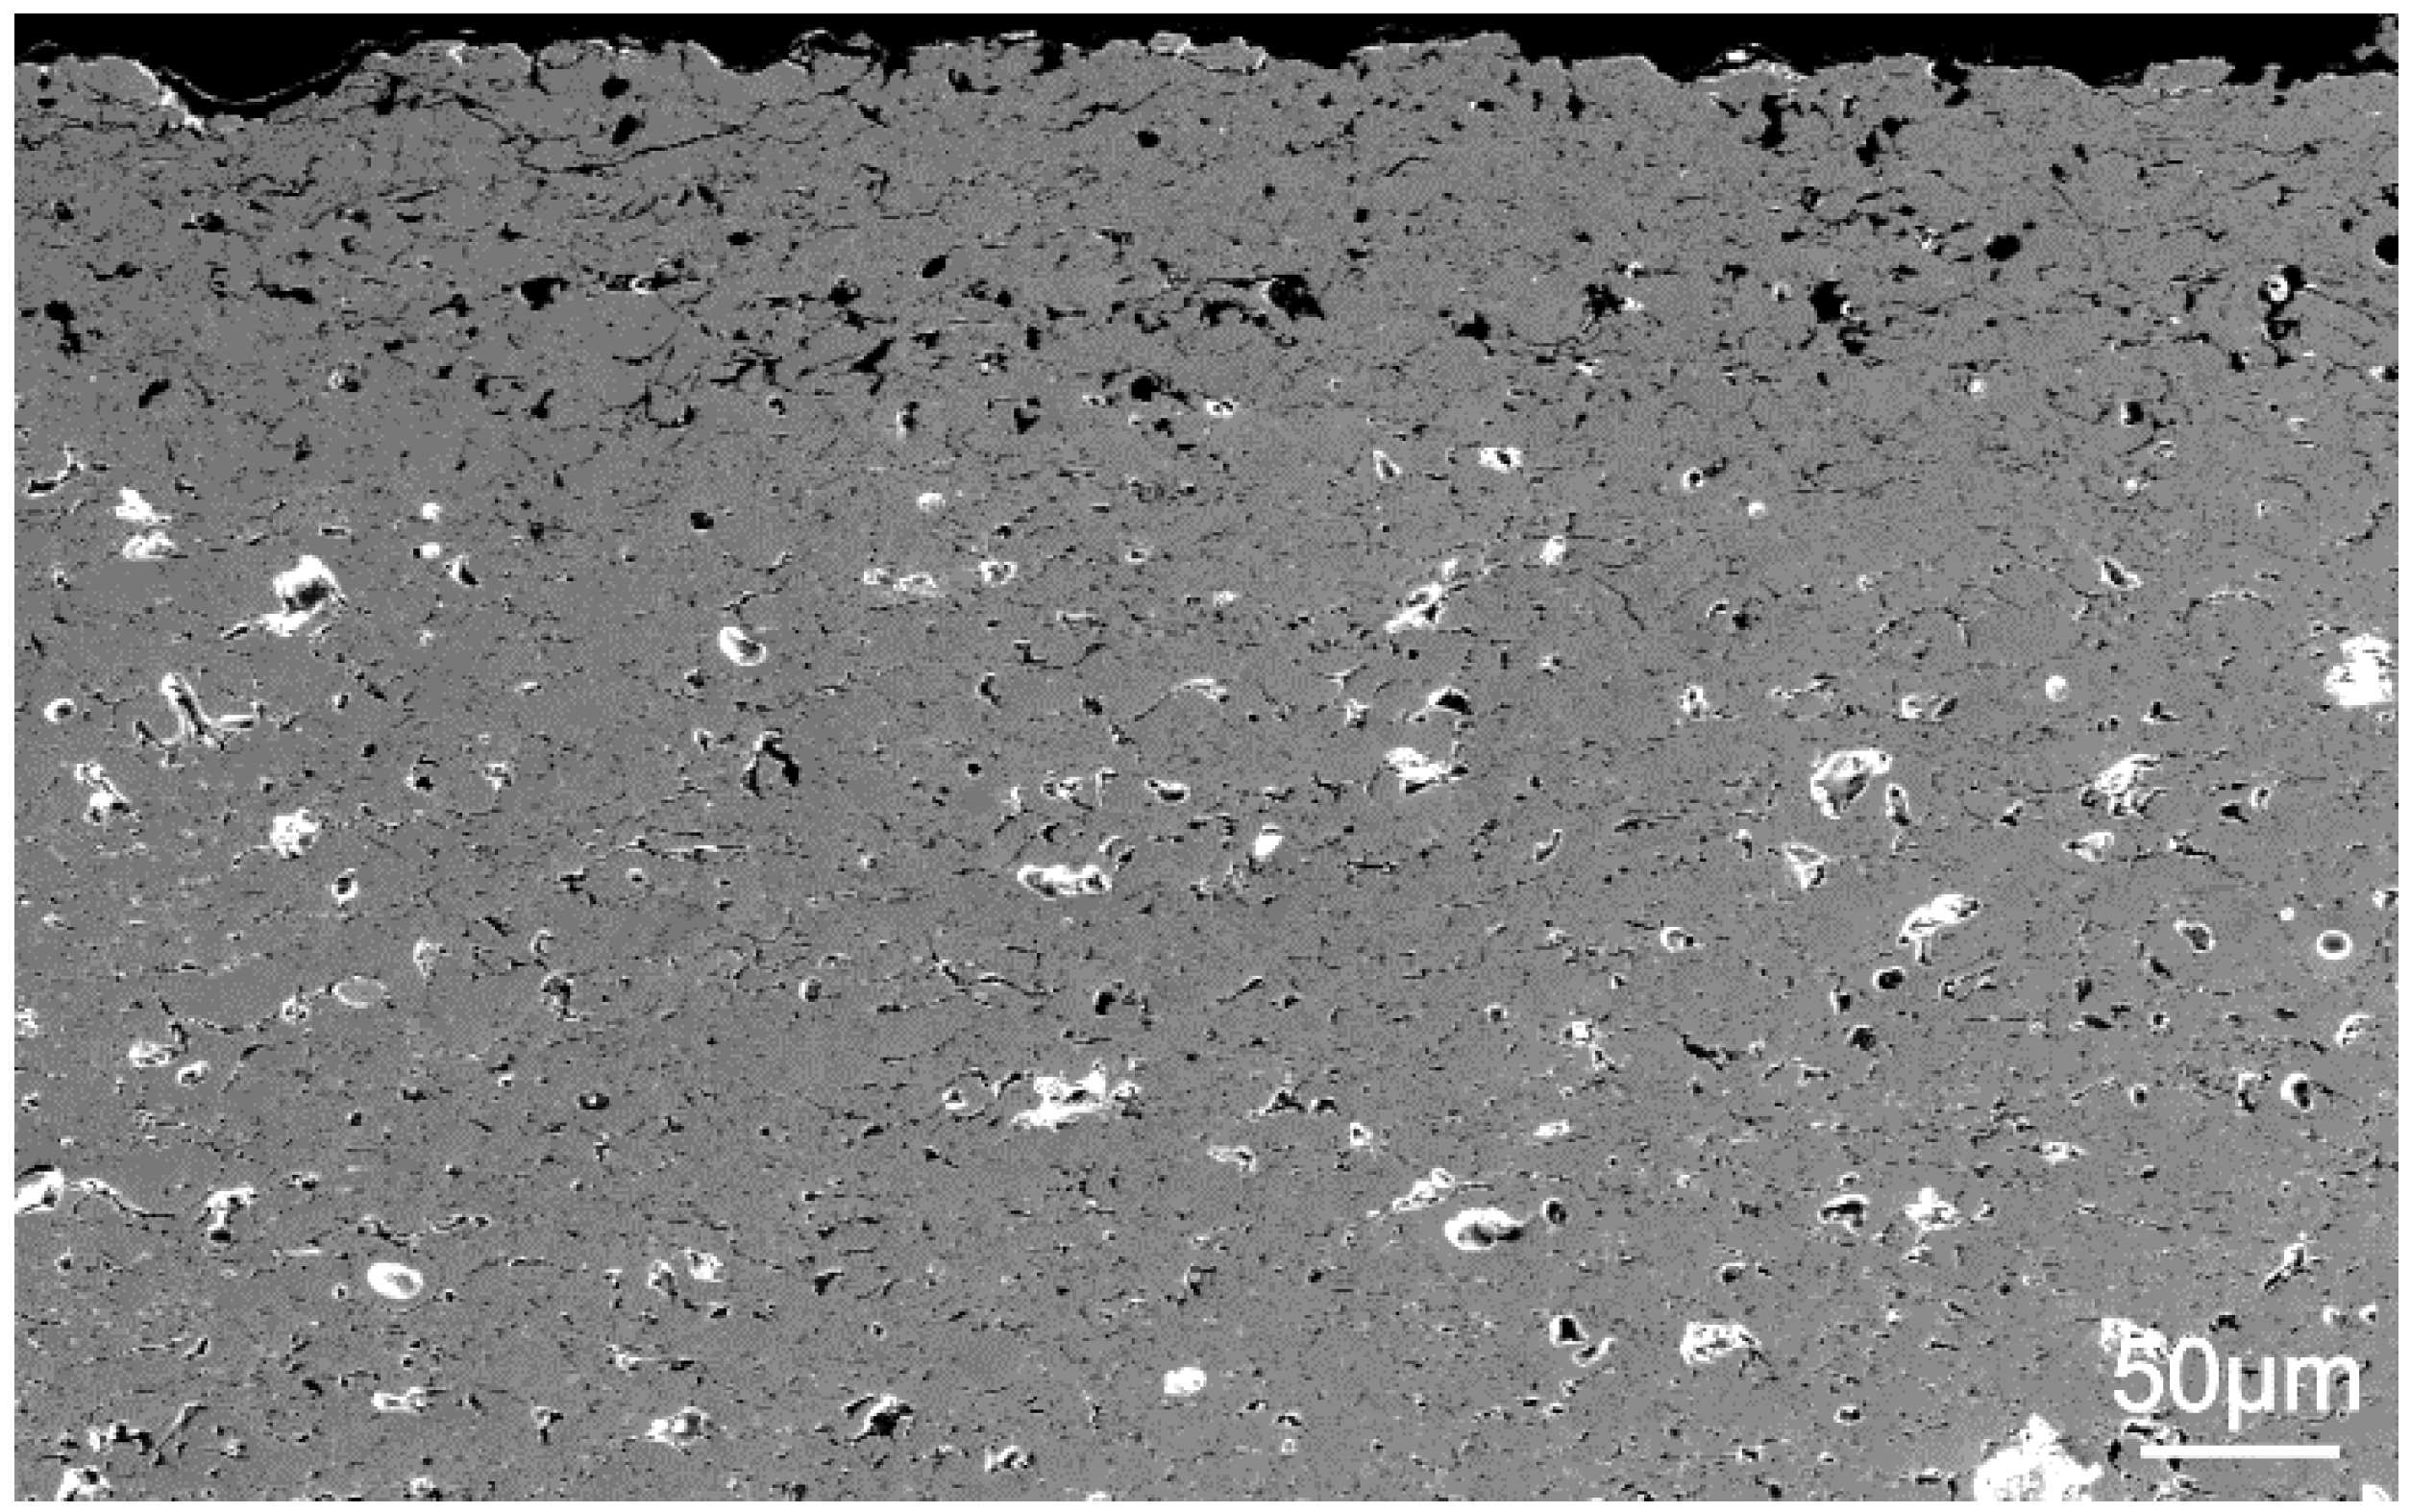
Figure 8. However, these results have to be seen with care. As the surfaces of the bending bars had to be as plain as possible, the outermost material was removed, even though this was done carefully. The SEM photo in Figure 9 shows a cross section of yttria near the surface. The region near the surface seems to have a slightly higher porosity, but this layer of 50–100 µm was removed during the sample preparation of the bending bars. A sample preparation was required, as the surface was slightly curved when received. The thickness of the coating was not constant all over the plate. It was 0.1–0.2 mm higher toward the edges of the plates.

3.2. Fracture Toughness

The fracture toughness K
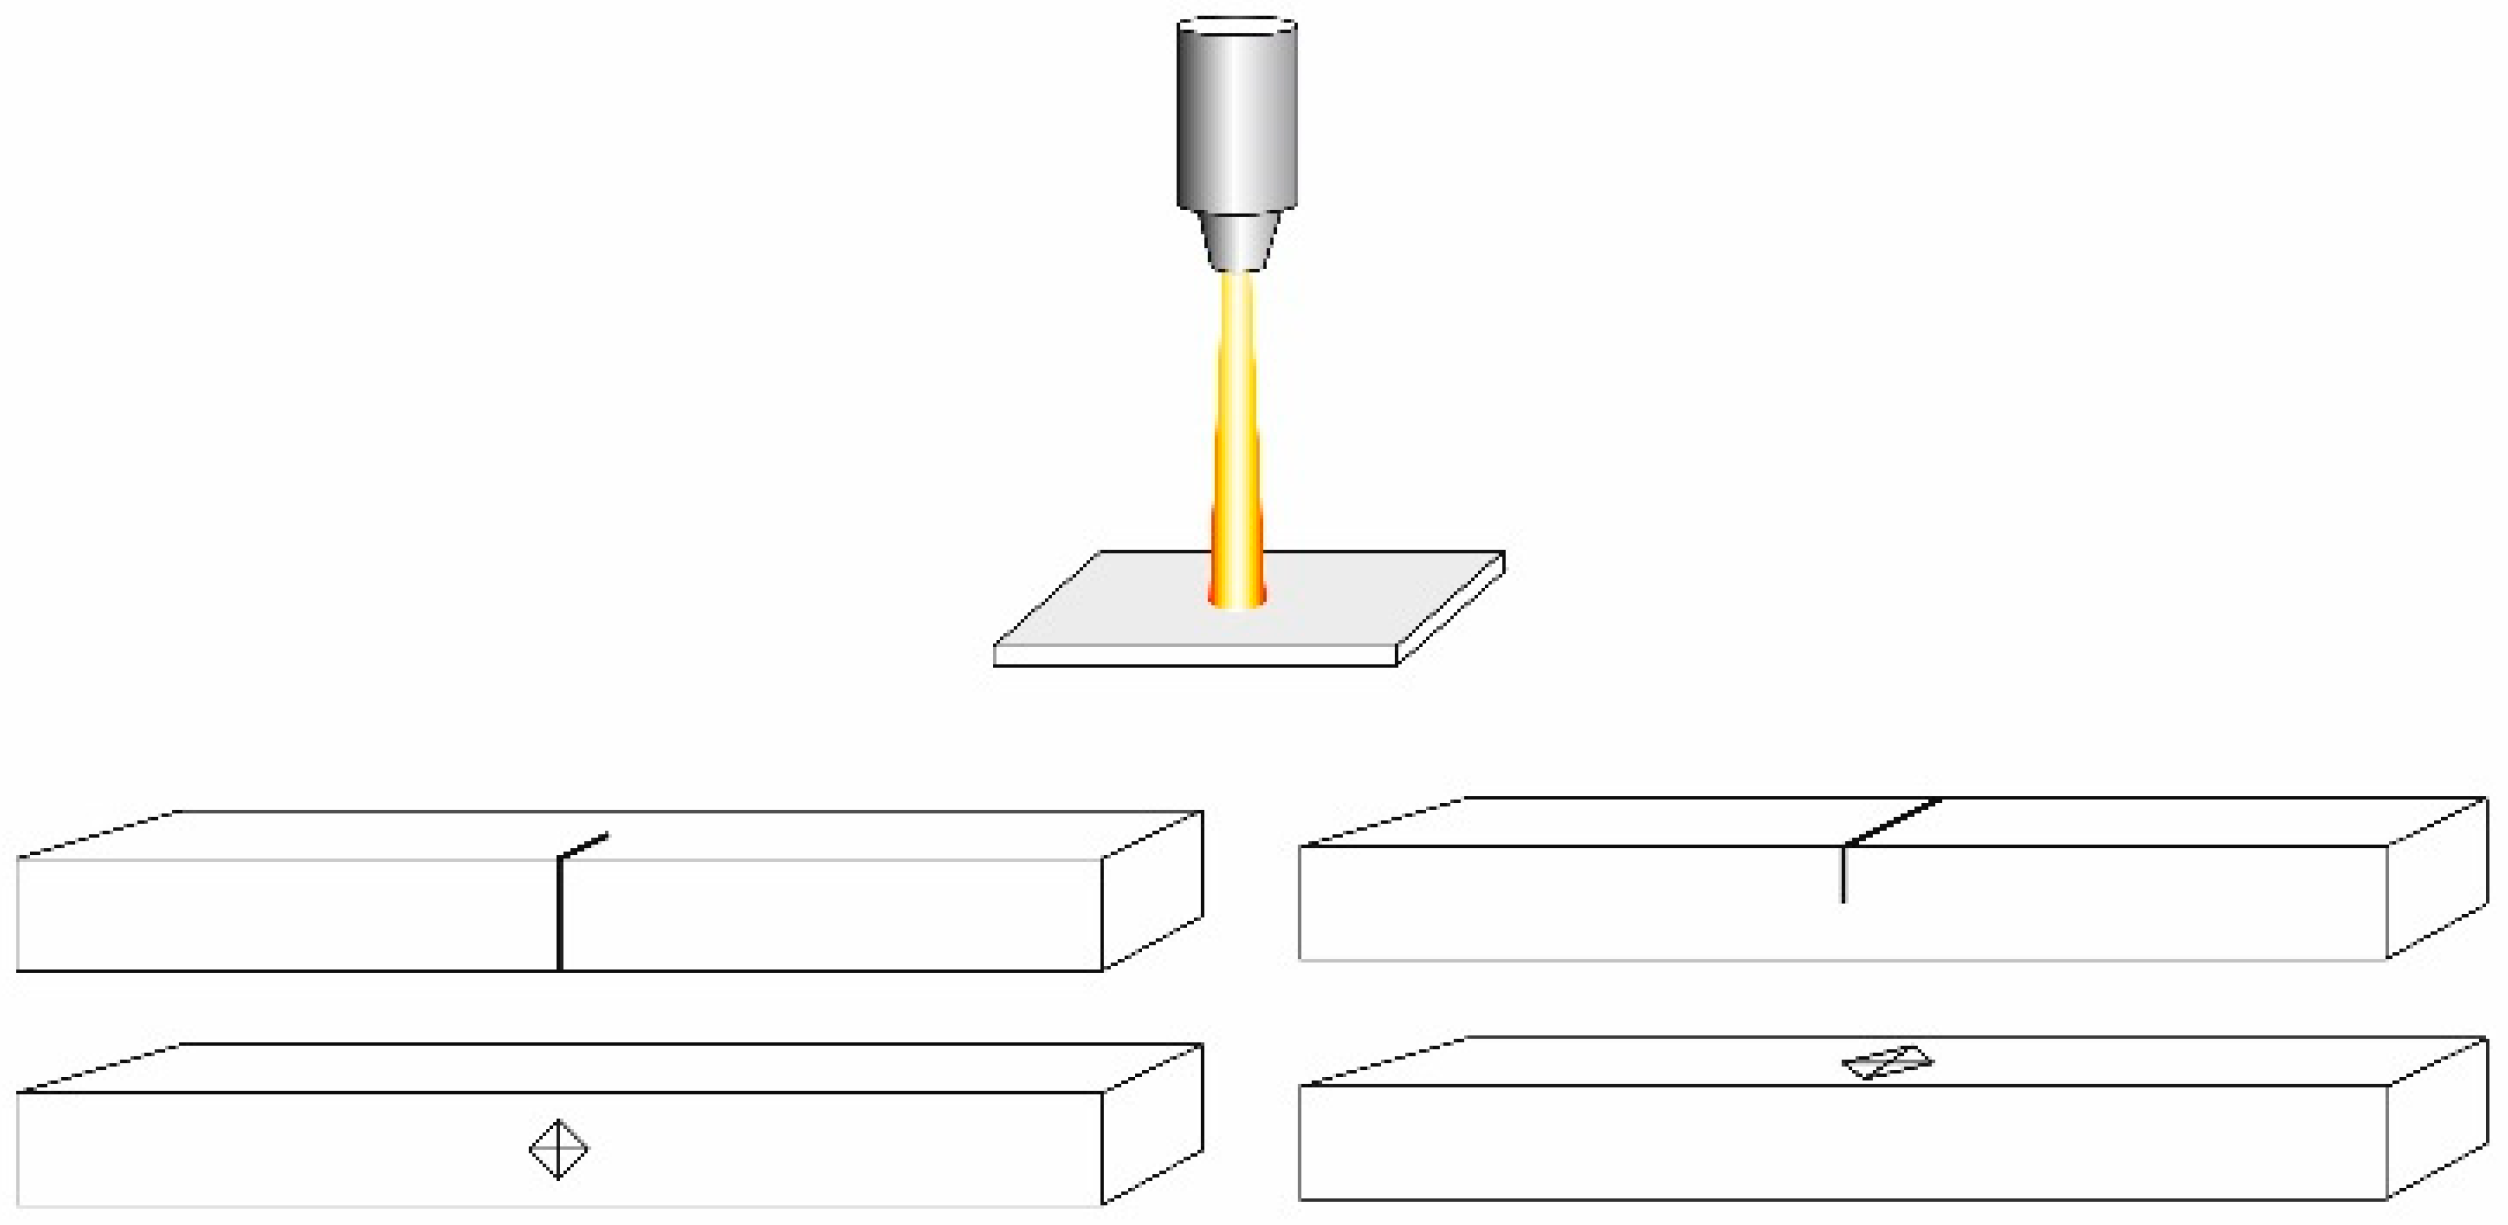
Ic was tested in two directions, as shown in Figure 10. All samples were aged at 1200 °C. The vertical setup had a crack propagation in the thickness direction of the coating. The horizontal crack propagation had an orientation where the crack front was parallel to the thickness direction. The results of the SENB fracture toughness tests show no difference between the vertical toughness and horizontal toughness: KIc_hor. = 1.21 ± 0.15 MPa√m and KIc_vert. = 1.21 ± 0.05 MPa√m.
The results of the indentation strength in bending (ISB) are somewhat lower than the values derived from the SENB tests. The vertical fracture toughness by ISB was 1.00 ± 0.09 MPa√m. One sample could be tested in the horizontal direction and showed a fracture toughness via ISB of 1.13 MPa√m. A reason for the difference could be the position of the artificial flaw by notch or indentation. The lowest toughness stems from the indentation method in the vertical direction and therefore from a location near the surface of the plasma sprayed plate. It should be mentioned here that the difference is small and that it might be influenced by scatter and possible uncertainties in the calculation of the indentation strength.
For further bending tests with an in-plane crack propagation orientation, samples can only be obtained by processing coatings that are as unreasonably thick as the length of the bending bars. Furthermore, a wedge-driven double-cantilever beam was not available so far for the test series. In order to estimate the fracture toughness for this orientation, a series of indentation cracks HV10 was made on the surface and the side face of a sample. The crack length on the surface was independent of the direction of the crack extension, as both sets from the corners of the indents were identical. For indentations on the side face of the sample (horizontal configuration), the crack length of in-plane cracks was longer than the crack length along the coating thickness. A ratio of 1.50 was found in this case. The increased crack length points to a lower fracture toughness when the crack front propagates in-plane through the coating. Munz and Fett [4] stated that the fracture toughness is related to the crack length KIc ∝ (c/a)−3/2, where 2a is the diagonal of the indentation, l is the crack length from the corner of the indentation, and the total crack length is c = l + a. Using this proportionality, a ratio of 1.50 for the total crack length c results in a ratio of the fracture toughness of the in-plane to horizontal direction of 1.83. Thus, the horizontal fracture toughness of 1.21 MPa√m and the ratio of 1.83 leads to an estimate of 0.66 MPa√m for the in-plane fracture toughness. Since the in-plane cracks propagate along splat interfaces, a lower in-plane fracture toughness is reasonable.
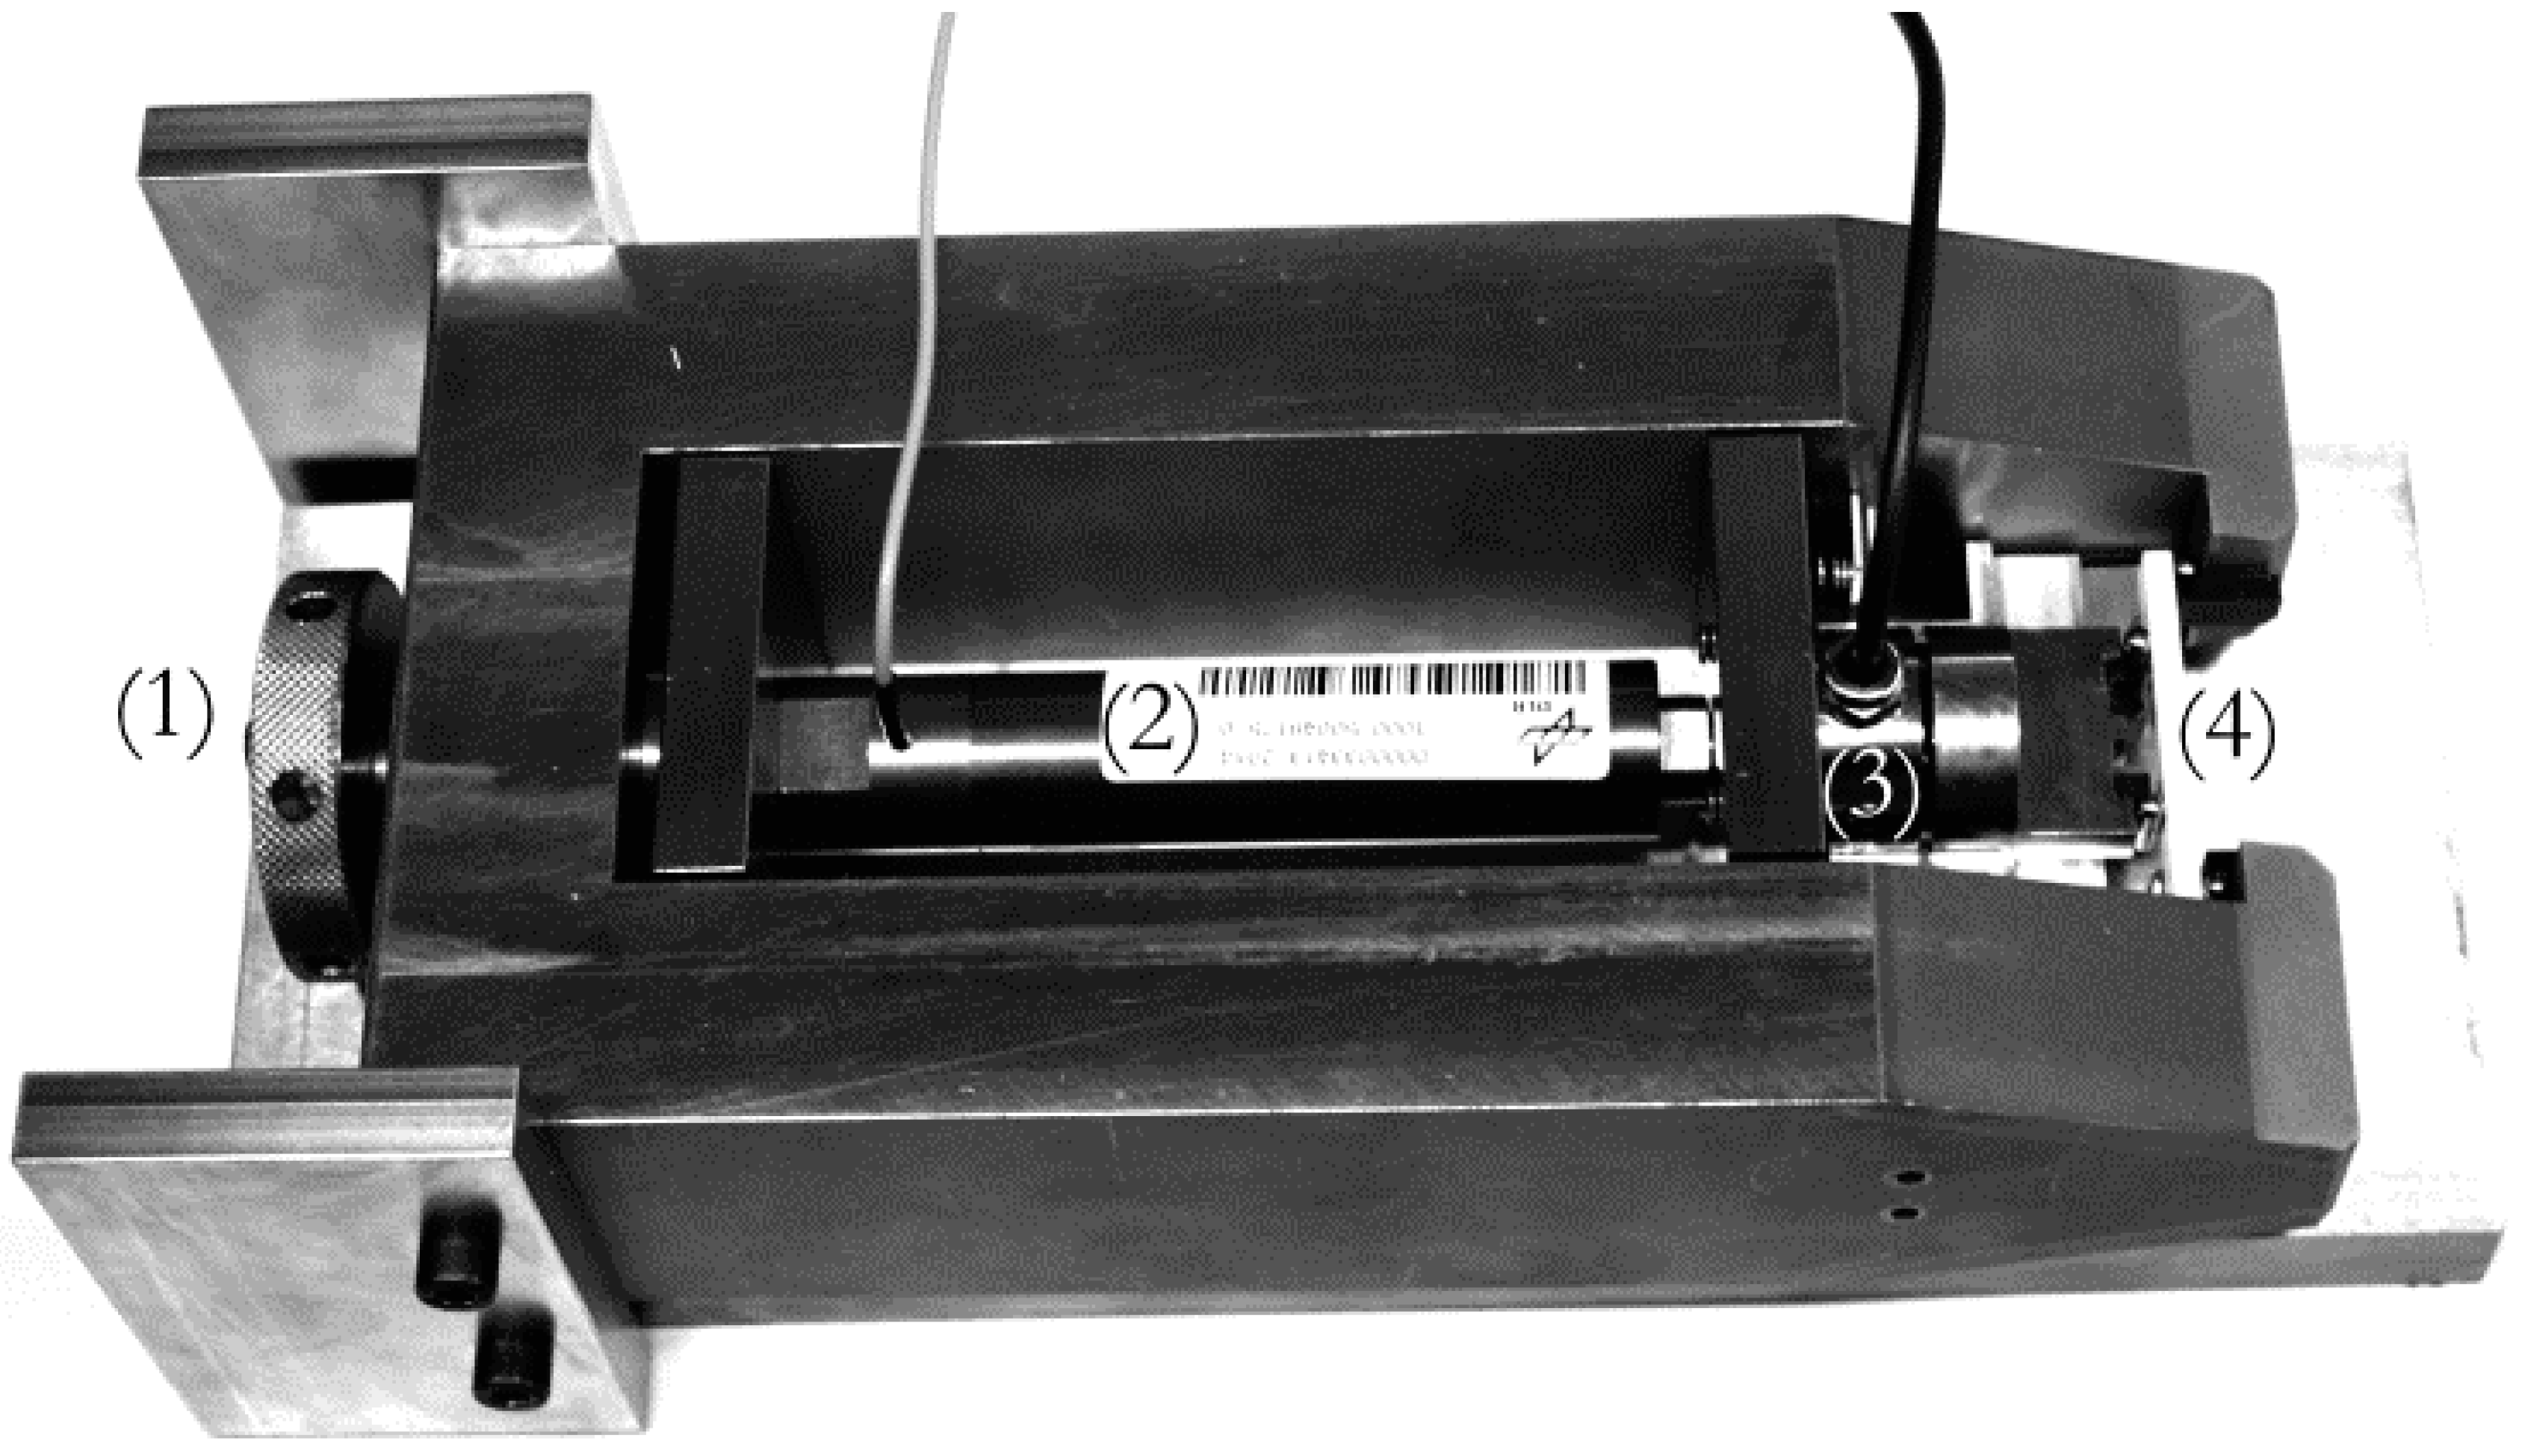
The fracture toughness under shear load (Mode II) was tested with the asymmetric four point bending fixture, as explained above. The direction of the crack propagation was horizontal, and the measured toughness was KIIc = 0.56 ± 0.08 MPa√m. Hence, the toughness in the shear mode is lower than the toughness in tensile Mode I. Predominantly, a Mode II toughness in the literature is higher than the corresponding tensile Mode I values for monolithic ceramic materials, but the contrary case can also be found: Li and Sakai [13] found KIIc/KIc-values of 0.53–0.74 for glass and alumina. Choi et al. [14] measured KIIc/KIc = 0.63 at room temperature for plasma-sprayed Y-PSZ. No KIIc-values for plasma-sprayed Y2O3 or even yttria from other processing routes were found from other authors. A finite element analysis of one of the asymmetric four point bending samples showed a stress intensity factor of KI ≤ 0.025 MPa√m when loaded to the critical force. Therefore, an early failure due to the influence of Mode I can be excluded.

3.3. Crack Growth Resistance
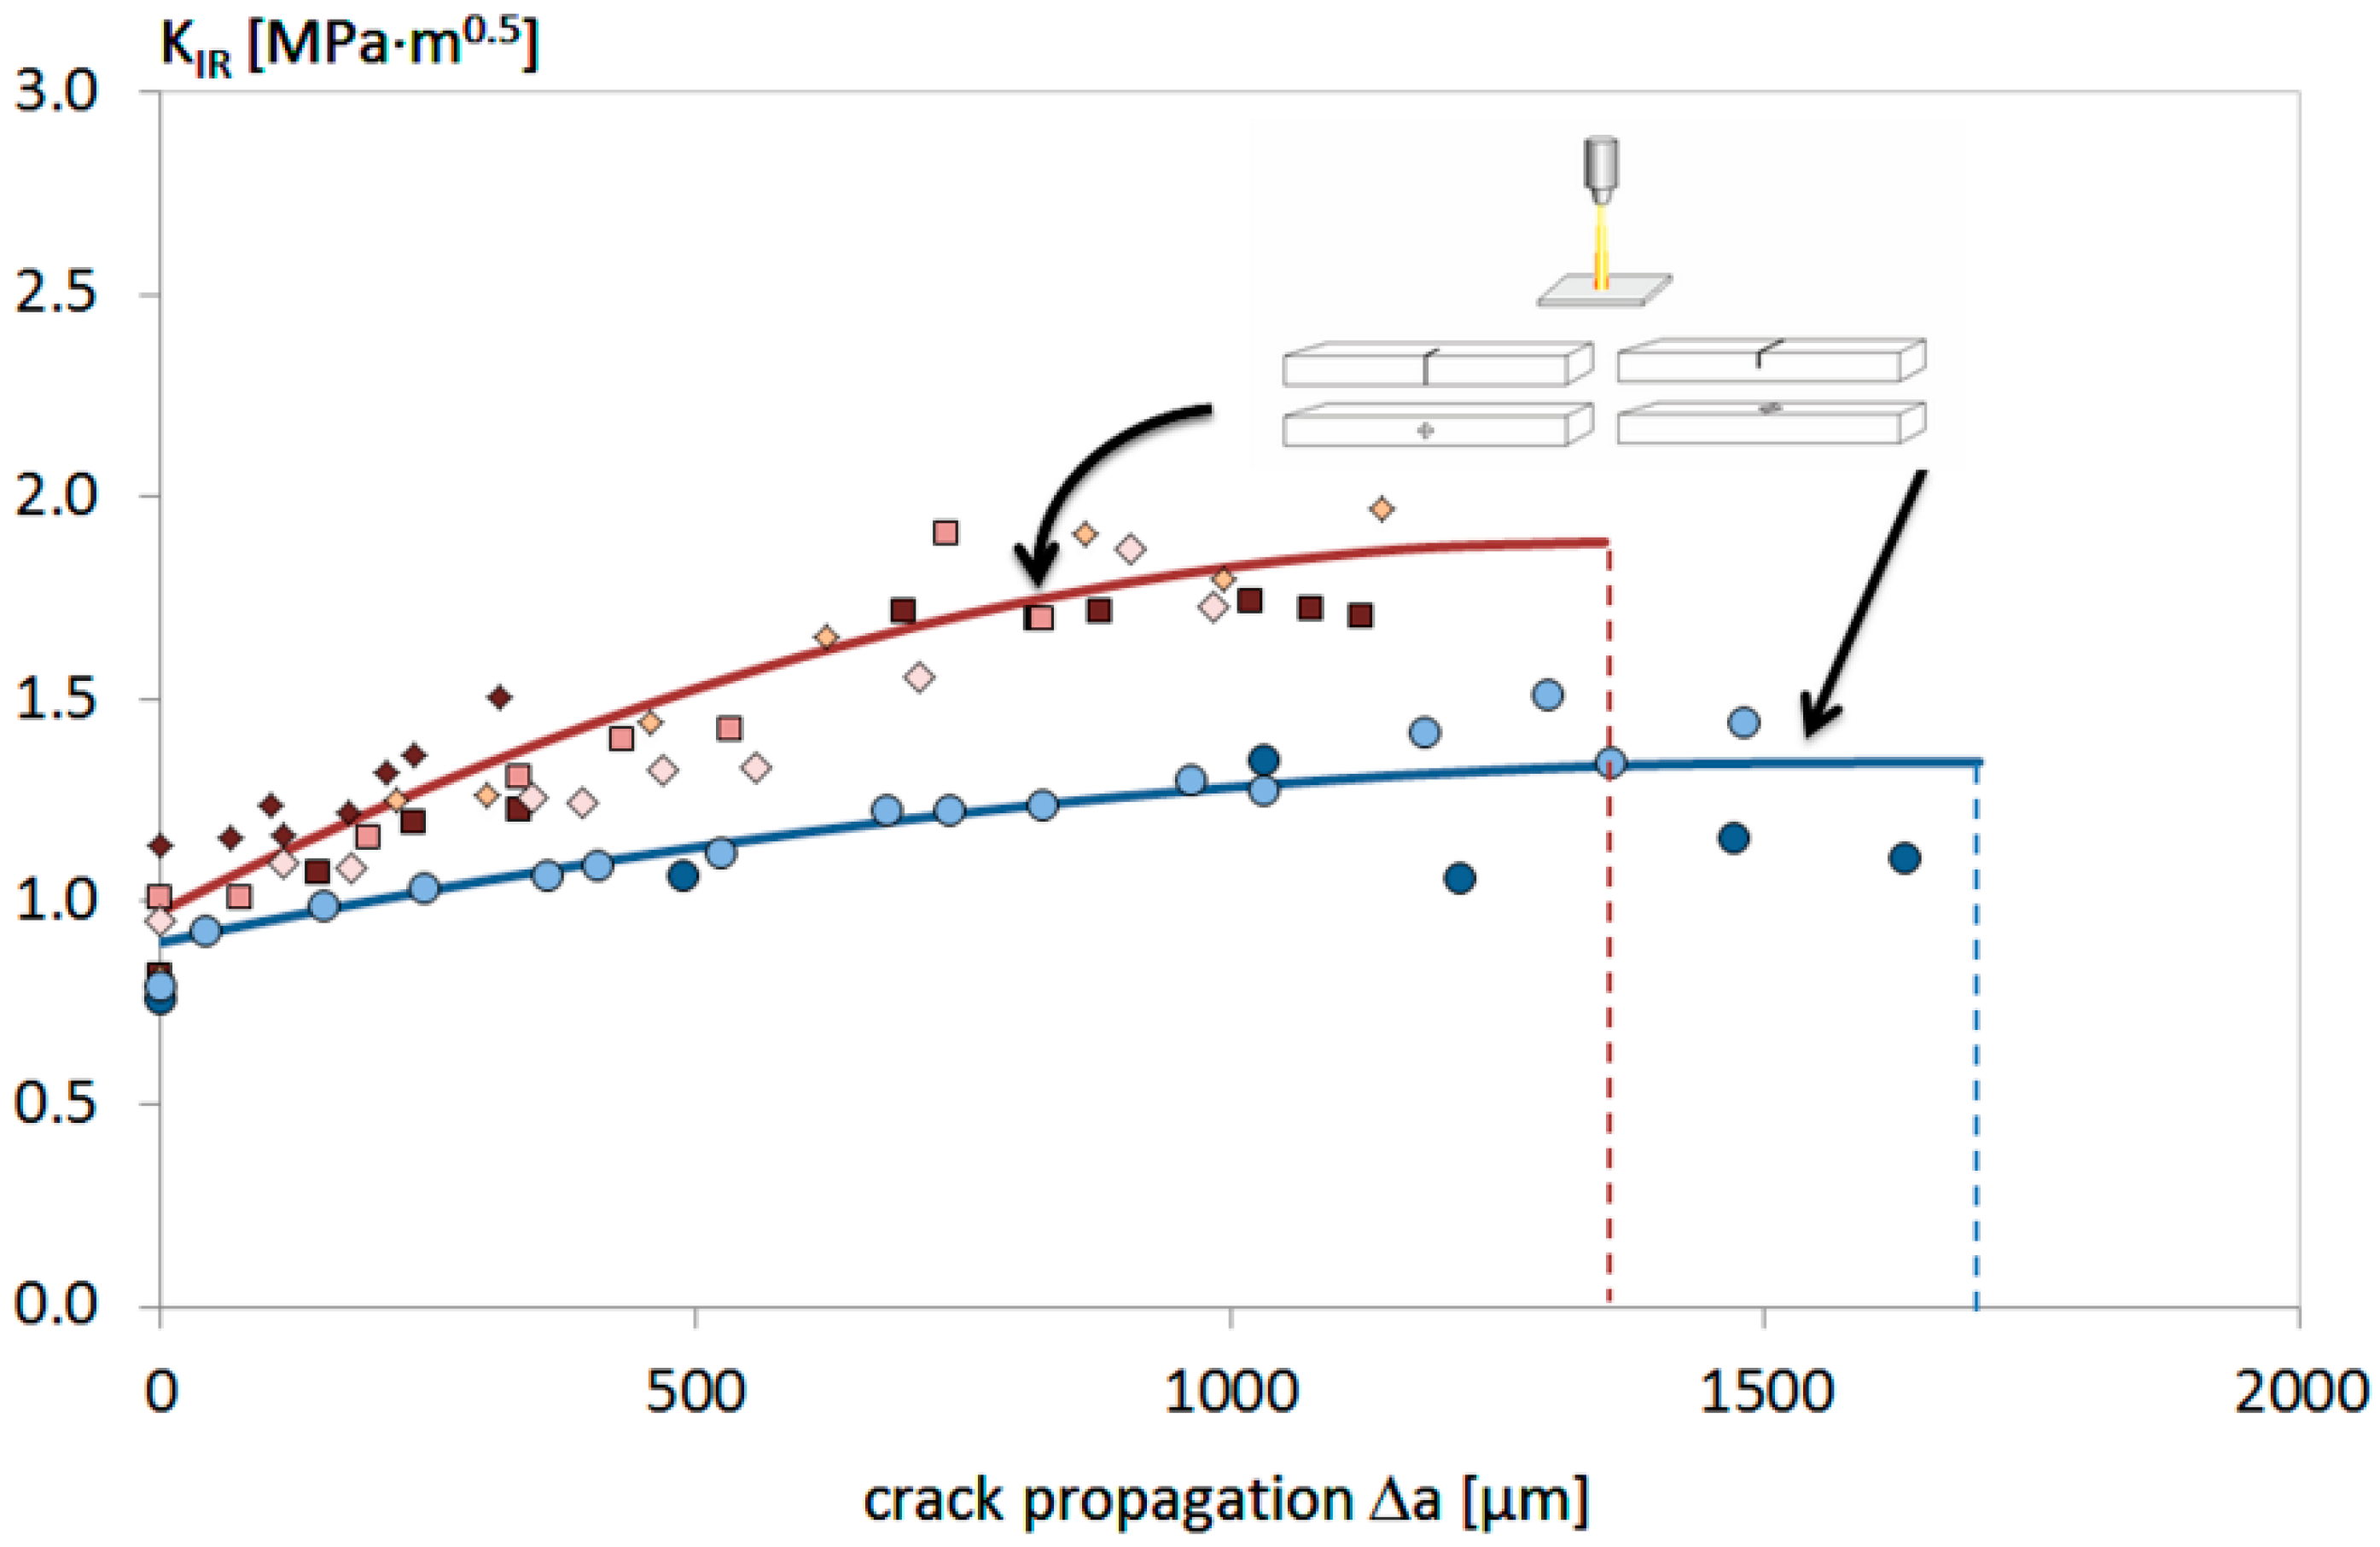
In Figure 11, the results of the R-curve experiments are shown. Again, all samples discussed here were aged at 1200 °C. As above, two directions of crack propagation were tested in the horizontal and vertical direction, as defined in Figure 10. The data points shown here fulfill the limits of the linear elastic fracture mechanics [15,16]. The data toward higher crack propagations Δa were beyond these limits, as the ligament length (W-a) became too small:
a , B , ( W a ) 2.5 ( K I σ c ) 2
Here, setting σc to the corresponding bending strength of ~70 MPa, the minimum ligament is 0.66 mm for a stress intensity KI = 1.8 MPa√m. Thus, a sample height of W = 3.5 mm and an initial crack size a0 ≈ 1.5 mm result in a limit of Δa ≈ 1.35 mm. For KI = 1.1 MPa√m, the limit is 0.25 mm for the ligament and 1.7 mm for Δa. The skipped data showed a progressive rise of KIR(Δa), up to values of 2.9 MPa√m and therefore an overestimated and artificial rise of the R-curves.
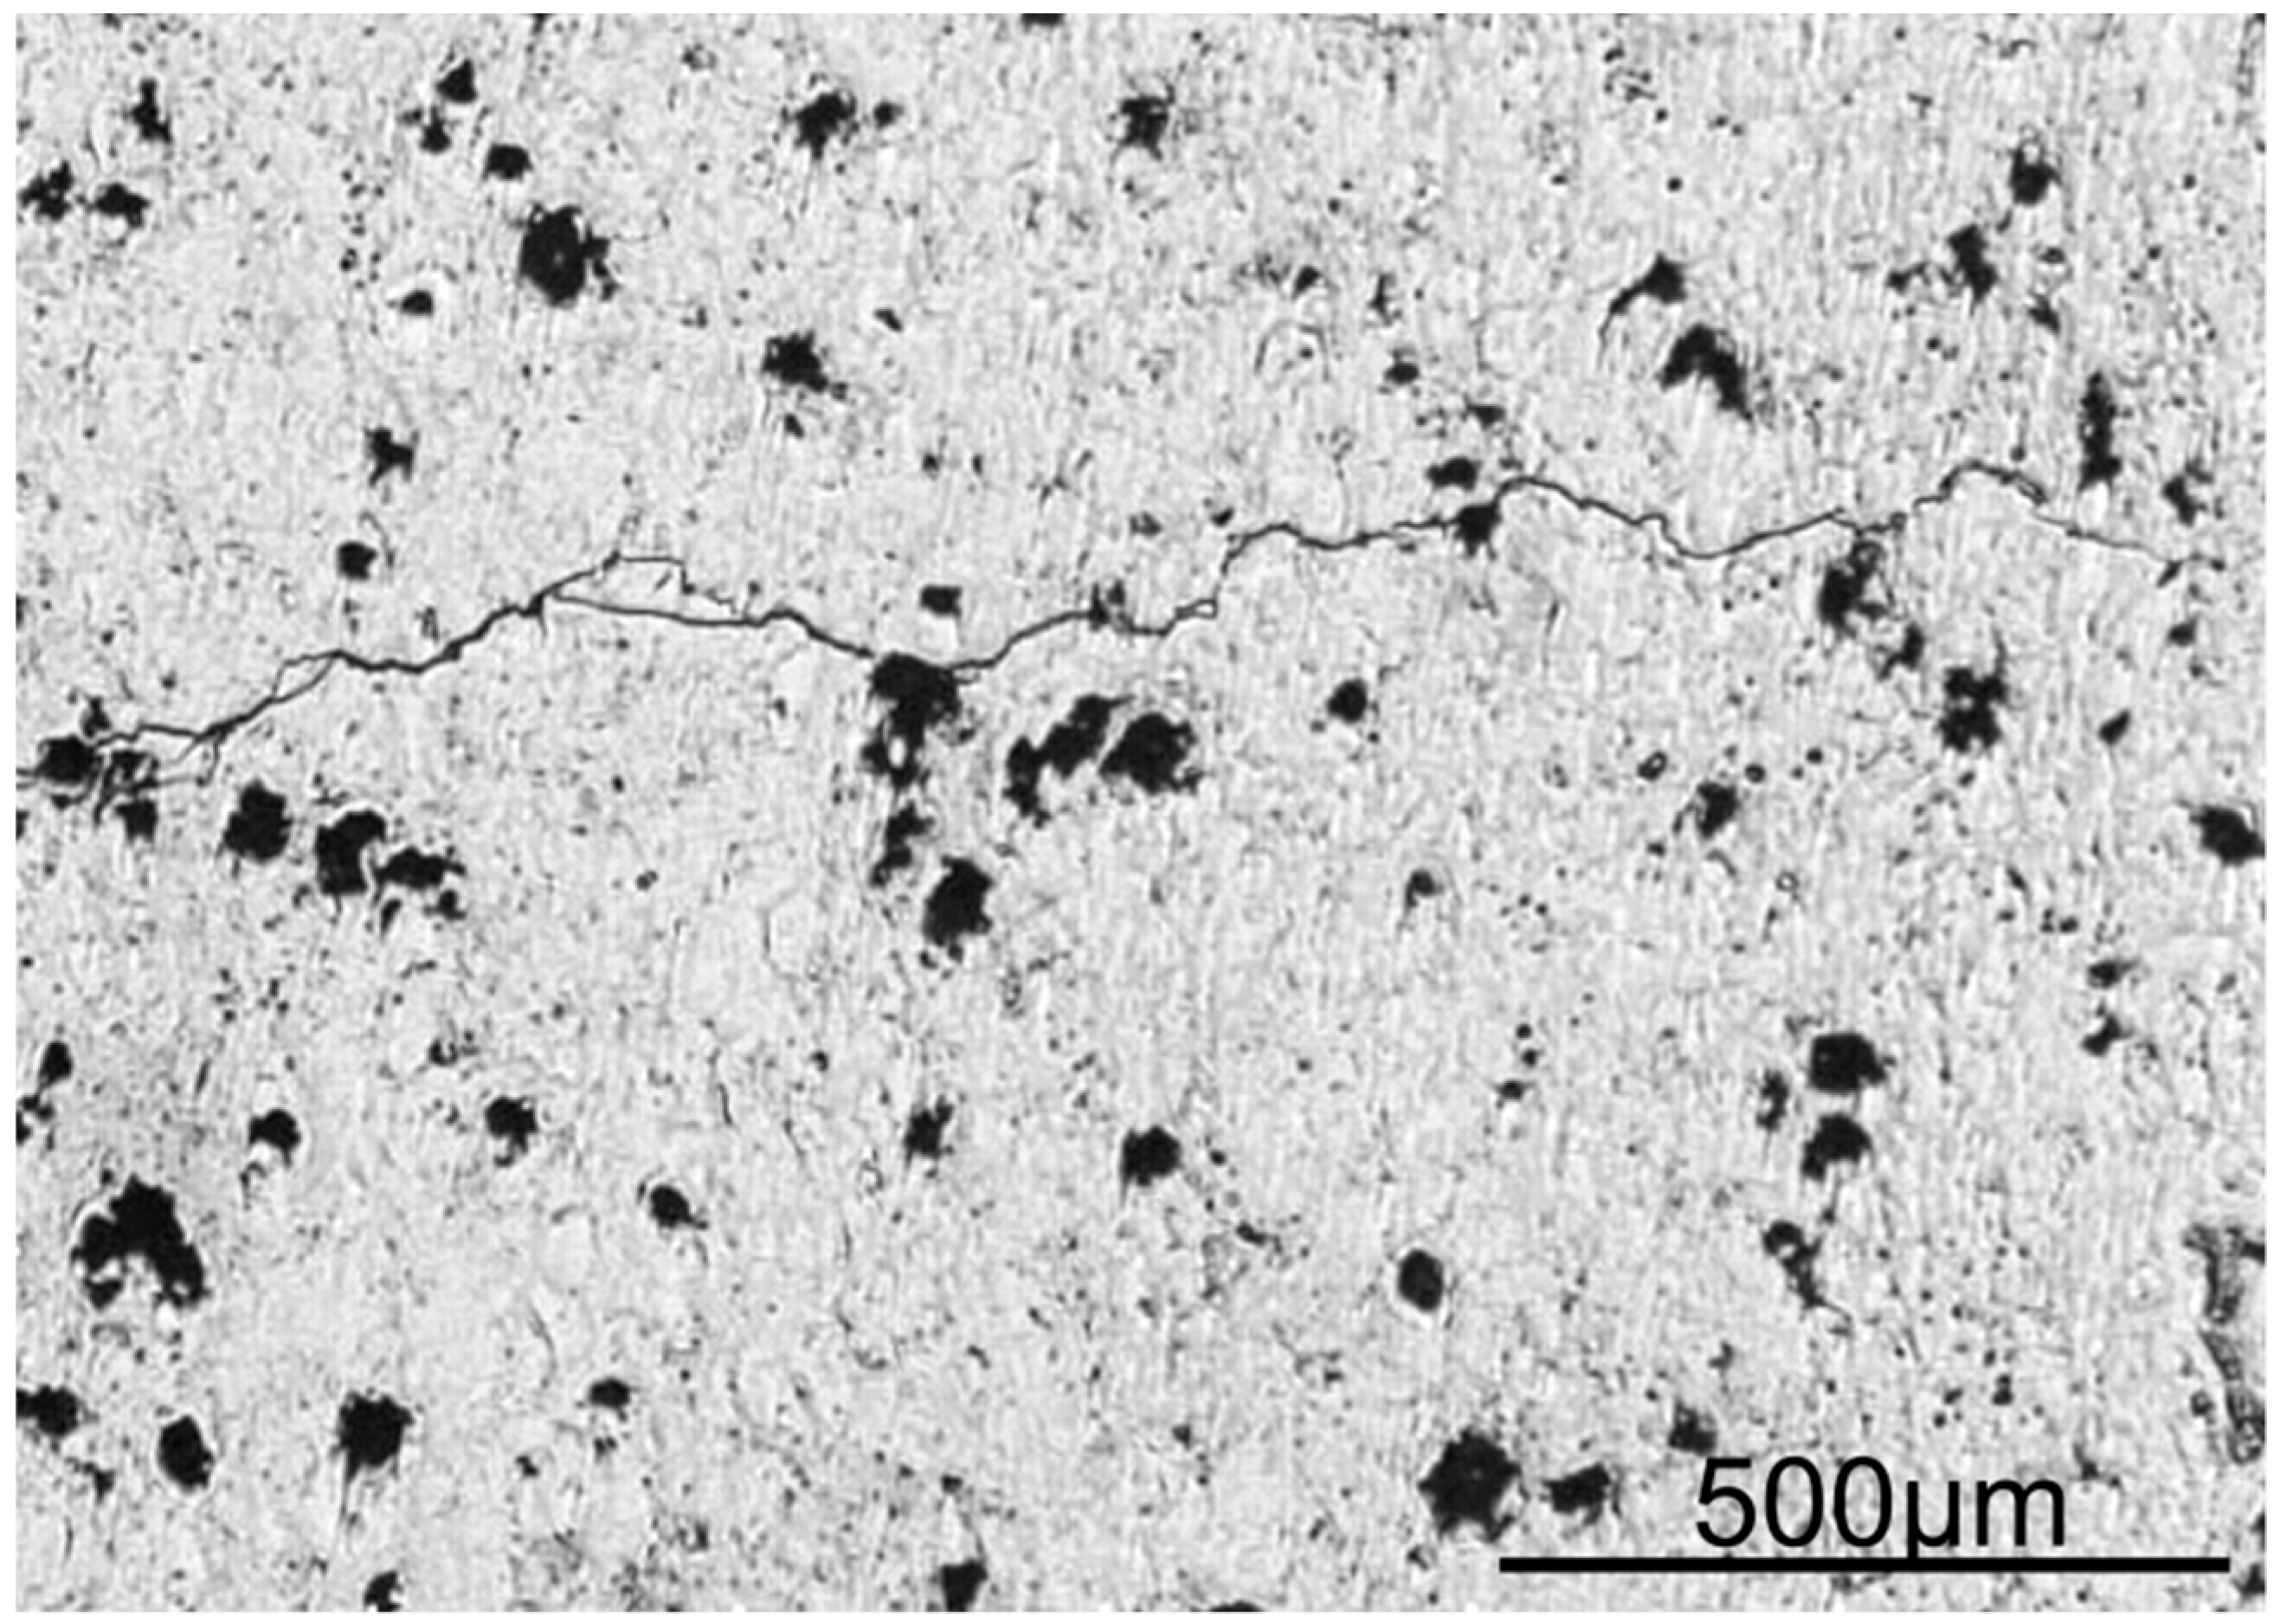
The horizontal cracks, whose crack fronts are parallel to the through-thickness direction, show just a little rise in toughness with an initial value of 0.95 MPa√m and a plateau-like value of 1.1 MPa√m after a millimeter of crack elongation. Cracks in the thickness (vertical) direction perpendicular to the surface have similar initial values of 1.0 MPa√m, but they exhibit a more substantial rise of the R-curve up to 1.8 MPa√m. Here, a plateau also develops after a crack propagation of 1 mm. The rise of the toughness itself can be explained by crack deflections and bifurcations (Figure 12), which enhance the measured toughness with the developing crack length. The higher rise of the R-curves in the thickness direction can be attributed to the splat-like structure of the material, which should have a directional influence on the crack development and the crack growth resistance as the crack length increases.
The initial values of both directions are somewhat below the KIC values observed above (Table 1). As the sample preparation was quite the same with respect to notching and pre-cracking, it is likely that the different load rates in the R-curve and fracture toughness experiments have an influence here. The KIc-tests were conducted at a displacement rate of 0.5 mm/sec; hence, the failure occurred after a couple of seconds. In contrast, the R-curves were measured quite slowly. In particular, the onset of the crack propagation has to be detected by visual observation under the microscope. It is rather likely that the R-curves tend toward the range of subcritical crack growth with a slower crack growth at lower stress intensities, whereas the KIC measurements show an unstable crack growth, which typically occurs at higher stress intensities.

4. Conclusions

The basic mechanical properties of atmospheric plasma sprayed yttria coatings were determined. Despite their obvious suitability in combustor tests, the conducted toughness tests showed that the material is rather brittle with a toughness that, markedly, does not exceed values of KIc = 1.2 MPa√m. The toughness and crack growth showed measures that depend on the direction of the crack propagation, which should be taken into account in future modelling, e.g., in the vicinity of effusion holes or other exposed areas. The results of the modulus and the bending strength indicate that the microstructural changes are not completed, even after aging at 1200 °C for 10 h. Hence, experiments on materials with elongated aging times are advisable.
Finally, the designed piezo bending device turned out to be suitable for these investigations, with rather brittle and fragile samples as the ligament vanished. This can especially be attributed to the uncompromising rigid frame design and piezo stack.

Author Contributions

Conceptualization, S.H.; methodology, S.H.; formal analysis, S.H.; investigation, S.H.; resources, S.H.; writing—original draft preparation, S.H.; writing—review and editing, S.H. and M.B.; visualization, S.H. and M.B.; supervision, M.B.

Funding

This research received no external funding.

Acknowledgments

The authors would like to thank M. Hilleringmann, F. Flucht and U. Fuchs for assistance in mechanical testing and U. Krebber for the SEM-images. In addition, discussions with P. Mechnich and his preparation of the substrate surfaces prior the coating process are highly appreciated.

Conflicts of Interest

The authors declare no conflict of interest.

References

  1. Mechnich, P.; Braue, W. Air plasma-sprayed Y2O3 coatings for Al2O3/Al2O3 ceramic matrix composites. J. Eur. Cer. Soc. 2013, 33, 2645–2653. [Google Scholar] [CrossRef]
  2. Behrendt, T.; Richter, T.; Söhngen, A.S. Characterization of Advanced Combustor Cooling Concepts for Metallic Walls and Oxide Ceramic Matrix Composites in a Reacting Flow. ASME. Turbo Expo: Power for Land, Sea, and Air, Volume 5C: Heat Transfer. In Proceedings of the ASME Turbo Expo 2014: Turbine Technical Conference and Ex-position GT-2014, Düsseldorf, Germany, 16–20 June 2014. [Google Scholar]
  3. Behrendt, T.; Hackemann, S.; Mechnich, P.; Shi, Y.; Hönig, S.; Hofmann, S.; Koch, D. Development and Test of Oxide/Oxide Ceramic Matrix Composites Combustor Liner Demonstrators for Aero-engines. J. Eng. Gas Turbines Power 2017, 139, 031507. [Google Scholar] [CrossRef]
  4. Munz, D.; Fett, T. Ceramics Mechanical Properties, Failure Behaviour, Materials Selection; Springer Science & Business Media: Berlin, Germany, 2001. [Google Scholar]
  5. Chantikul, P.; Anstis, G.R.; Lawn, B.R.; Marshall, D.B. A Critical Evaluation of Indentation Techniques for Measuring Fracture Toughness, II: Strength Method. J. Am. Cer. Soc. 1981, 64, 539–543. [Google Scholar] [CrossRef]
  6. He, M.Y.; Cao, H.C.; Evans, A.G. Mixed-mode fracture: The four point shear specimen. Acta Metall. Mater. 1990, 38, 839–846. [Google Scholar] [CrossRef]
  7. Fett, T.; Gerteisen, G.; Hahnenberger, S.; Martin, G.; Munz, D. Fracture tests for ceramics under mode-I, mode-II and mixed-mode loading. J. Eur. Cer. Soc. 1995, 15, 307–312. [Google Scholar] [CrossRef]
  8. Albayrak, I.C.; Basu, S.; Sakulich, A.; Yeheskel, O.; Barsoum, M.W. Elastic and Mechanical Properties of Polycrystalline Transparent Yttria as Determined by Indentation Techniques. J. Am. Cer. Soc. 2010, 93, 2028–2034. [Google Scholar] [CrossRef]
  9. Yeheskel, O.; Tevet, O. Elastic Moduli of Transparent Yttria. J. Am. Cer. Soc. 1999, 82, 136–144. [Google Scholar] [CrossRef]
  10. Leigh, S.H.; Lin, C.K.; Berndt, C.C. Elastic Response of Thermal Spray Deposits Under Indentation Tests. J. Am. Ceram. Soc. 1997, 80, 2093–2099. [Google Scholar] [CrossRef]
  11. Richards, B.T.; Begley, M.R.; Wadley, H.N. Mechanisms of Ytterbium Monosilicate/Mullite/Silicon Coating Failure During Thermal Cycling in Water Vapor. J. Am. Ceram. Soc. 2015, 98, 4066–4075. [Google Scholar] [CrossRef]
  12. Lince—FG Nichtmetallische-Anorganische Werkstoffe—Technische Universität Darmstadt. Materials Science. Available online: https://www.mawi.tu-darmstadt.de/naw/nawstartseite/kompetenzen/gefuegeeigenschaften/sv_software.de.jsp (accessed on 15 July 2019).
  13. Li, M.; Sakai, M. Mixed-Mode Fracture of Ceramics in Asymmetric Four-Point Bending: Effect of Crack-Face Grain Interlocking/Bridging. J. Am. Cer. Soc. 1996, 79, 2718–2726. [Google Scholar] [CrossRef]
  14. Choi, S.R.; Zhu, D.; Miller, R.A. Mode I, Mode II, and Mixed-Mode Fracture of Plasma-Sprayed Thermal Barrier Coatings at Ambient and Elevated Temperatures. In Fracture Mechanics of Ceramics: Active Materials, Nanoscale Materials, Composites, Glass and Fundamentals; Bradt, R.C., Munz, D., Sakai, M., White, K.W., Eds.; Springer: Boston, MA, USA, 2005; Volume 14. [Google Scholar]
  15. Anderson, T.L. Fracture Mechanics. In Fundamentals and Applications; CRC Press: Boca Raton, FL, USA, 1991. [Google Scholar]
  16. E399-83, Standard Test Method for Plane-Strain Fracture toughness of Metallic Materials, American Society for Testing and Materials; ASTM: Philadelphia, PA, USA, 1983.
Figure 1. CMC-Liner with an outer diameter of 135 mm and 3540 laser drilled effusion holes. The thickness of the yttria coating on the inner surface was 1.0 mm.
Ceramics 02 00039 g001
Figure 2. Geometry of the asymmetric four point bending fixture.
Ceramics 02 00039 g002
Figure 3. Piezo bending device with preload spindle (1), piezo actuator (2), load cell (3) and bending bar (4) between the four rollers.
Ceramics 02 00039 g003
Figure 4. Young’s modulus for different aging conditions.
Ceramics 02 00039 g004
Figure 5. Bending strength for different aging conditions.
Ceramics 02 00039 g005
Figure 6. Stress-strain graph of sample 4SH35D (as-received).
Ceramics 02 00039 g006
Figure 7. (a) As-received 4SH24D sample; (b) 4SH38D—1200 °C/10 h.
Ceramics 02 00039 g007
Figure 8. A comparison of the bending strength with respect to the orientation of the tensile side, for different plates and aging conditions.
Ceramics 02 00039 g008
Figure 9. SEM image of a through-thickness cross section near the surface, sample 4SH38D—1200 °C/10 h; a higher porosity is visible at the surface.
Ceramics 02 00039 g009
Figure 10. Illustration of crack directions/notches and hardness indentations with respect to the coating process; on the left in the horizontal direction and on the right in the vertical direction.
Ceramics 02 00039 g010
Figure 11. The R-curves for two different orientations up to the discussed limits. The blue circles indicate data from two samples with the horizontal crack growth direction, and the red diamonds and squares correspond to four samples with the vertical crack growth direction.
Ceramics 02 00039 g011
Figure 12. Typical crack path (left → right) in APS-yttria with deflections and bifurcations; the crack propagation of this sample is in the through-thickness direction (vertical).
Ceramics 02 00039 g012
Table 1. Summary of the fracture toughness KIc [MPa√m].
IndentationSENBCalc.Initial Value R-Curves
VerticalHorizontalVerticalHorizontalIn-planeVerticalHorizontal
1.00 ± 0.091.131.21 ± 0.051.21 ± 0.150.661.0 ± 0.080.95 ± 0.05

