Abstract
The inclusion of the Internet of Things (IoT) in indoor agricultural systems has become a fundamental tool for improving cultivation systems by providing key information for decision-making in pursuit of better performance. This article presents the design and implementation of an IoT-based agricultural system installed in a plant growth chamber for hydroponic cultivation under controlled conditions. The growth chamber is equipped with sensors for air temperature, relative humidity (RH), carbon dioxide (CO2) and photosynthetically active photon flux, as well as control mechanisms such as humidifiers, full-spectrum Light Emitting Diode (LED) lamps, mini split air conditioner, pumps, a Wi-Fi surveillance camera, remote monitoring via a web application and three Nutrient Film Technique (NFT) hydroponic systems with a capacity of ten plants each. An ATmega2560 microcontroller manages the smart system using the MODBUS RS-485 communication protocol. To validate the proper functionality of the proposed system, a case study was conducted using lettuce crops, in which the impact of different nutrient solution concentrations (50%, 75% and 100%) on the phenotypic development and nutritional content of the plants was evaluated. The results obtained from the cultivation experiment, analyzed through analysis of variance (ANOVA), show that the treatment with 75% nutrient concentration provides an appropriate balance between resource use and nutritional quality, without affecting the chlorophyll content. This system represents a scalable and replicable alternative for protected agriculture.
1. Introduction
Agriculture is the set of human practices aimed at producing food, forage, fiber and other useful products through the management of plants and animals [1]. In a global context where the population exceeds 8 billion people and is projected to increase by another 2 billion by 2050, the United Nations [2] estimates that food production will need to increase by 70%. This challenge requires a transformation in production and consumption methods, prioritizing sustainable agricultural practices that balance food demand with environmental conservation.
Protected agriculture refers to the action of placing structures to protect crops, with the aim of obtaining a higher-quality harvest in less time or out of season [3]. Various techniques are used in this type of agriculture, including hydroponics.
The Nutrient Film Technique (NFT) is a soilless hydroponic cultivation method that uses inclined structures through which a thin and continuous flow of nutrient solution circulates [4]. This technique ensures that plant roots are consistently exposed to both nutrients and oxygen, promoting efficient absorption [5]. NFT is notable for its high water and nutrient use efficiency compared to other hydroponic techniques [6], as well as its adaptability to controlled environments, enabling year-round crop production [7]. Several studies have shown that this technique can accelerate plant growth by 10% to 50% compared to traditional agricultural practices [8]. However, NFT presents limitations, such as vulnerability to power outages, unsuitability for long-cycle crops (longer than 50 days) and a high risk of rapid spread of root diseases [9].
Indoor agriculture, also known as indoor farming, takes place in spaces with regulated environmental conditions, where factors like air temperature can be adjusted. Sunlight is replaced by artificial illumination systems. A controlled environment with artificial light is called a plant factory, growth chamber or plant production unit [10]. The advantages of these systems are clear, as technological advancements allow crops to be produced year-round without relying on climate patterns [11]. Currently, the most common crops in these systems include leafy vegetables (lettuce, spinach, etc.), tomatoes, cucumbers, berries and microgreens [12].
On the other hand, the Internet of Things (IoT) is a revolutionary technology that enables the interconnections between physical objects and the Internet, establishing continuous interaction between them [13]. In agriculture, the IoT refers to the integration of sensors, embedded devices, communication networks and digital platforms that allow for real-time data collection, analysis and monitoring. This enables automated control of various processes such as irrigation and fertilization, as well as data-driven decision-making, allowing for faster and more effective responses to adverse events, reducing resource waste and optimizing productivity [14]. However, the impact of IoT depends on proper implementation, technical feasibility and financial accessibility for end users [15].
Smart agriculture is based on the application of modern technologies to improve both the quantity and quality of the crops. This approach includes the use of tools such as IoT, databases, machine learning, cloud processing, machine-to-machine communication protocols, sensors, actuators and personal devices like phones and computers [16].
In [17], a smart agriculture framework is described as consisting of six layers. The first layer, or physical layer, contains a set of sensors, actuators and microcontrollers that collect and process data among the devices themselves. The second layer, or network layer, includes the Internet, Wi-Fi connections and wireless communication between devices. The third layer, or intermediate layer, is responsible for device management on the network, platform portability, security and authentication. The fourth layer, or service layer, provides cloud storage and software as a service for data management. The fifth layer, or analytics layer, utilizes various algorithms to process real-time data, enabling predictive analysis of various crop aspects. Finally, the sixth layer, or user experience layer, is where farmers use applications, such as social media, to share and disseminate agricultural knowledge.
Next, a review of recent studies (2020–2025) on the development and implementation of smart agricultural systems focused on small-scaled hydroponics is presented. The research explores significant advancements in technologies such as IoT and artificial intelligence (AI) applied to agriculture.
In [18], a small-scale IoT-based aeroponic system (90 cm × 60 cm × 40 cm) is proposed for cultivating water spinach (Ipomoea aquatica Forssk). In the physical layer of the system, a DHT-11 sensor is used to measure air temperature and relative humidity (RH) in the root chamber and control mechanisms including a Peltier cell for cooling, fans and mist generators. A Wemos D1 Mini microcontroller makes decisions based on internal air temperature and RH values. The network layer utilizes the microcontroller’s built-in Wi-Fi connectivity to transmit real-time data to the service layer, where the ThingSpeak platform [19] is used for visualization and recording of the information. The user experience layer is implemented via QR codes, enabling manual activation and deactivation of control mechanisms. The system was tested for 16 days, demonstrating stable environmental conditions in the root chamber.
In [20], an IoT aquaponics system architecture is proposed to monitor environmental variables for both plants and fish. For the physical layer, control mechanisms such as water pumps are used along with various sensors to monitor pH, electrical conductivity (EC), water level, water temperature, CO2 and ammonia. A NodeMCU microcontroller (Makerfabs, Shenzhen, China) handles decision-making and also functions as a gateway, transmitting data via Message Queuing Telemetry Transport (MQTT) to the service layer. The user experience layer is implemented through a web application for remote monitoring.
In [21], the design and development of an automated hydroponics system is presented. In the physical layer, multiple sensors are integrated to measure variables such as air temperature, RH, substrate moisture and water level in tanks. Various control mechanisms are also employed, such as Light Emitting Diode (LED) lamps, a refrigeration system, ventilation equipment and pumping devices for the nutrient solution. An ATmega microcontroller is used for decision-making.
The information collected by the monitoring system is sent via Zigbee protocol based on IEEE 802.15.4 [22] to the service layer for storage. In the user experience layer, the operator can visualize and control the connected devices through an interface developed in Laboratory Virtual Instrument Engineering Workbench (LabVIEW).
In [23], the development and implementation of a smart hydroponic system were carried out. The physical layer consists of several sensors for measuring environmental variables such as air temperature and light intensity, as well as nutrient solution variables such as pH, nitrogen and phosphorus and for capturing plant images. Control mechanisms are included for irrigation and lighting systems. A Raspberry Pi (Raspberry Pi Foundation, Cambridge, United Kingdom) serves as the decision-making central control unit and transmits data to the network layer. In the analysis layer, artificial intelligence is implemented using a deep learning convolutional neural network (DLCNN) prediction model for data analysis. These models estimate the nutrient values required by the plants based on reference values and environmental conditions. Additionally, in the user experience layer, a DLCNN classification system is used to send alerts via a mobile application.
In [24], a smart monitoring and control system for hydroponics applied to lettuce cultivation was designed. The physical layer consists of various sensors capable of measuring variables such as air temperature, water level, pH and total dissolved solids (TDS) in the water. It also includes control mechanisms such as pumps for water, nutrients and saline solutions to maintain the stability of the nutrient solution. An ESP32 microcontroller (Espressif Systems, Shanghai, China) is used for data collection, decision-making and sending information to the cloud. The service layer is implemented using the Blynk platform. The user experience layer is applied through a mobile application for user data visualization.
In [25], a vertical indoor aeroponic system architecture is proposed. The physical layer consists of various sensors for monitoring variables such as pH, EC, water tank level, air temperature, RH and photosynthetically active radiation. The system uses a Raspberry Pi as the central control unit for decision-making, managing the activation of three peristaltic pumps for precise nutrient management using feedback control and two LED lamps to provide adequate lighting. The collected data is sent to an MQTT broker. The service layer generates alerts about the system status, which are displayed to the operator through the user experience layer.
In [26], an IoT hydroponic system was developed with the dimensions of 150 cm × 150 cm × 235 cm. For the physical layer, sensors were integrated for the measurement of environmental variables such as air temperature and RH, as well as nutrient solution variables such as pH, water temperature and EC. They include various control mechanisms such as fans, full-spectrum LED lamps, a heating system and pumps for water and nutrient circulation. A NIDO ONE central controller [27] is used for data collection, decision-making and communication with the database. The collected information is processed and displayed to the user via the NIDO PRO platform.
In [28], a hydroponic system with a nano bubble generator is proposed. The system’s physical layer includes sensors capable of measuring variables in nutrient solutions such as Dissolved Oxygen (DO), TDS and pH; similarly, air temperature and RH are monitored. The only control mechanism in the system is the nano bubble generator. Multiple microcontrollers (Arduino UNO, NodeMCU, ESP32-E) are used to gather sensor data. A Raspberry Pi is employed as a local server and for decision-making processes. In the service layer, the data is sent to the Antares platform. The user experience layer is supported through both a web application for real-time monitoring and a local monitor serving the same purpose.
In [29], an automated IoT-based hydroponic system for indoor cultivation was developed. The system’s physical layer was implemented using a series of sensors to measure environmental variables such as air temperature and RH, as well as nutrient solution variables such as pH and TDS. For automation, pumps were integrated for nutrient control, along with white LED lights. An Arduino UNO microcontroller is responsible for collecting the data, which is transmitted via a Raspberry Pi to a platform built-in Node-RED [30]. In the service layer, the data are stored in a MongoDB database and visualized through the user experience layer via a web application accessible from a computer or a mobile device connected to the same network.
In [31], a Deep Water Culture (DWC) IoT hydroponic monitoring system is presented. The physical layer includes sensors for measuring variables such as pH and water temperature. A NodeMCU microcontroller [32] is used to collect data, perform decision-making tasks and transmit information to the cloud. In the service layer, the Firebase platform [33] is used to store the data. The analysis layer is implemented through a Mamdani fuzzy logic algorithm [34] to determine whether the system conditions are within normal limits or out of range. In the user experience layer, the users receive alerts generated by the fuzzy logic algorithm via WhatsApp and view the information through a web application. The system does not include control mechanisms, as it is limited to monitoring only.
Table 1 summarizes the main characteristics of the systems presented in the studies described above. The second column describes the cultivation technique used, the third column shows the type of crop used for system validation and columns four to six indicate the type of microcontroller (MCU) used, the variables that were monitored and the control mechanisms implemented. Finally, the seventh column indicates how the end user visualizes the monitored variables.

Table 1.
Main features of the system used in [18,20,21,23,24,25,26,28,29,31]. For each study, the corresponding reference is provided, along with the crop used to test the described system, the microcontroller implemented, the measured variables, the control mechanisms employed to keep those variables within the appropriate ranges, as well as the method used for data visualization.
In the present work, the design and implementation of a smart agriculture system is proposed, which is capable of perceiving its environment, processing and transmitting the collected information to the cloud and acting accordingly [13,17]. The system is installed in a plant growth chamber designated for hydroponic lettuce cultivation using NFT. This proposal presents an integrated solution that monitors and controls environmental conditions within the chamber, incorporates video surveillance and enables remote data visualization in the cloud, all within a closed and controlled infrastructure.
The proposed system is capable of monitoring environmental variables such as air temperature and RH, carbon dioxide concentration (CO2) and photosynthetically active photon flux (PPF). These variables are fundamental for the control of agricultural microclimates in closed environments. The system also includes control mechanisms capable of manipulating these variables and managing the pumping system of the hydroponic cultivation system. All the information collected from the monitoring and control of these variables is transmitted to the cloud and made available to users for real-time visualization through a web application. Additionally, the system includes an automatic email alert mechanism—indicating a possible system failure.
Through a case study, the proposed smart agriculture system was validated through the cultivation of lettuce using three different nutrient solution concentrations over a complete growth cycle. The experiment allowed monitoring the performance of the proposed system in terms of environmental control and crop tracking; however, conclusions regarding nutritional efficiency should be limited solely to the experiment carried out in this case study. This proposal presents an alternative approach to urban plant production that aligns with the automation of agricultural processes.
With the features demonstrated by the proposed smart system, this article contributes to the field of smart agriculture, as listed below:
- The smart agriculture system presented is not limited to the sensors described here, as the use of the RS-485 communication bus allows for the connection of up to 31 additional slave devices on a single channel. This feature provides scalability and flexibility, facilitating the integration of new sensors or actuators based on the specific needs of the crop or future research.
- A responsive web application and a mobile application were developed for monitoring environmental variables and modifying their reference values (setpoints). Our system represents an improvement compared to [21,25,26,28,29], where data transmission and visualization are performed locally. The development of a customized web application allows for a user interface that is adaptable and tailored to the information displayed, unlike [24,26], which rely on Platform-as-a-Service (PaaS) solutions with predefined visualizations.
- This article also presents a case study that describes the cultivation experiment used to validate the system, in which three treatments with different nutrient solution concentrations (T100, T75 and T50) were applied. An analysis of variance (ANOVA) is presented to compare the phenological and biochemical results obtained. Additionally, a comparison with international standards is provided, demonstrating that the biochemical characteristics of the harvested lettuce are competitive.
The article is organized as follows: Section 2, Materials and Methods, describes the methodology used to condition the space designated as the plant growth chamber, the characteristics of the NFT hydroponic systems, the cultivation experiment conducted in the case study and the proposed smart agriculture system. Section 3, Results, presents the findings related to the behavior of the smart agriculture system and the variables recorded during the cultivation experiment of the case study. Section 4, Discussion, analyzes the results obtained from the proposed system and the case study used for its validation. Finally, Section 5, Conclusions, outlines the general conclusions and the future work.
2. Materials and Methods
To evaluate the behavior of hydroponic crops under controlled conditions using smart technologies, a smart agriculture system was designed and developed and installed in a dedicated plant growth chamber. This section provides a detailed description of the infrastructure, implemented equipment and the architecture of the IoT-based smart agriculture system and the experimental methodology used for a case study conducted to verify the proper functioning of the proposed system using lettuce cultivation. It includes the specifications of the physical space, characteristics of the hydroponic system, technological integration for automation of the cultivation environment and the monitored variables considered during the experiment.
2.1. Growth Chamber
The space designated as the growth chamber, with dimensions of 3 m × 2 m × 2.5 m, is illustrated in the diagram shown in Figure 1. An extended surface of 75 cm in depth was added to accommodate three NFT hydroponic systems used in the experiment. Additionally, the walls were coated with latex paint to prevent the development of fungi and mold. The chamber was equipped with an IoT-based monitoring and control system for environmental variables such as air temperature, RH, CO2, PPF and photoperiod; capable of controlling up to 20 full-spectrum LED lamps, the pumps used in the NFT systems and up to six ultrasonic humidifiers; it also includes a Mirage X32 mini split air conditioning system for air temperature control, as well as a video monitoring system.
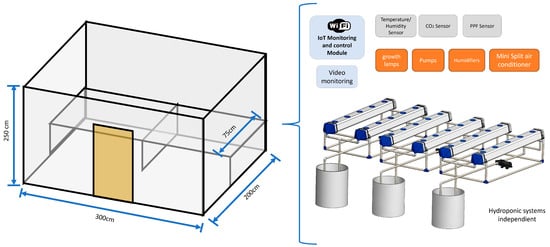
Figure 1.
Schematic diagram of the plant growth chamber used in the experiment, measuring 3 m × 2 m × 2.5 m (length × width × height). Inside, there are three independent NFT-type hydroponic systems. The system includes an IoT monitoring and control module with Wi-Fi connectivity, environmental sensors (air temperature/RH, CO2 and photosynthetically active radiation), ultrasonic humidifiers, water pumps, LED growth lamps, a mini split air conditioning unit and video monitoring.
2.2. NFT Hydroponic System
The hydroponic system shown in Figure 2 consists of two channels with a trapezoidal cross-section made of polyvinyl chloride (PVC), each featuring five planting cavities spaced 20 cm apart. The systems also include a frame constructed from chlorinated polyvinyl chloride (CPVC), designed with a 2% slope [35], which is essential for maintaining a continuous flow and ensuring the proper operation of the Nutrient Film Technique (Figure 2,E). Several components of this system were custom designed and manufactured using 3D printing technology, as suitable commercial alternatives were not available to meet the specific functional requirements. The dimensions of each system are 100 cm in length, 50 cm in width and 27 cm in height.
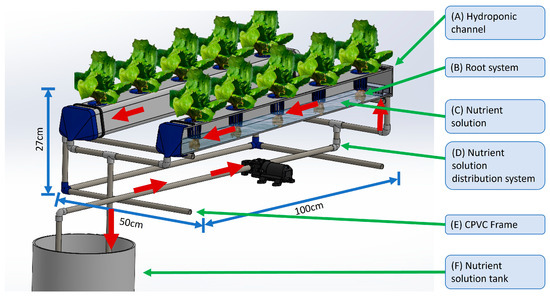
Figure 2.
Model of the NFT hydroponic system used in the experiment. The system is composed of (A) hydroponic channels; (B) root system exposed to the flow of the nutrient solution; (C) nutrient solution circulating through the channels; (D) nutrient solution distribution system powered by a pump; (E) support structure constructed with CPVC piping measuring 100 cm long, 50 cm wide and 27 cm high; and (F) nutrient solution storage tank. The arrows indicate the direction of the solution flow.
The NFT hydroponic system operates as follows: the nutrient solution flows from a 20 L tank (Figure 2,F) through a 10 mm diameter hose (Figure 2,D) and into a 12 V DC diaphragm water pump (model TOPINCN, 0.48 MPa, 3.5 L/min; TOPINCN, Shenzhen, China) and then into the hydroponic channels (Figure 2,A), where the plant roots (Figure 2,B) absorb the essential nutrients for growth while the remaining solution returns to the tank by gravity.
The proposed system was specifically designed for lettuce cultivation but also has the ability to adapt and be applied to the other vegetables such as spinach (Spinacia oleracea L), cabbage (Brassica oleracea var. Capitata) and aromatic plants like cilantro (Coriandrum sativum) due to their similar dimensions.
2.3. Monitoring and Control System
For the implementation of the monitoring and control system, based on the state of the art, continuous monitoring of critical environmental variables such as air temperature, RH, CO2 and PPF was identified as a priority. These variables directly affect photosynthesis [20,21], making them a priority for the automation of the growth chamber.
The proposed smart monitoring and control system was developed based on the architecture presented by [17,36], which suggests a six-layer structure. However, this work simplifies the architecture into five layers: physical layer (Figure 3A), network layer (Figure 3B), middleware layer (Figure 3C), service layer (Figure 3D) and user experience layer (Figure 3E). The analysis layer is not considered in the proposed architecture, as it is planned for future work.
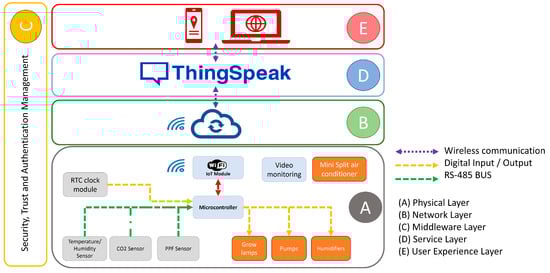
Figure 3.
Architecture of the proposed smart agricultural monitoring and control system based on IoT architecture. The system consists of five layers: (A) physical layer, which includes environmental sensors, a real-time clock module, video monitoring, growth lamps, humidifiers, pumps, a mini split air conditioner, the ATmega2560 microcontroller and an IoT module; (B) network layer, which enables data transmission via the internet; (C) middleware layer; (D) service layer, based on the ThingSpeak platform; and (E) user experience layer, accessible from mobile devices or computers via a web connection.
The physical layer of the proposed system, shown in Figure 4, utilizes a board based on the ATmega2560 microcontroller (Microchip Technology Inc., Chandler, AZ, USA) (Figure 4I) to collect data every minute from sensors that monitor environmental conditions within the growth chamber, including air temperature, RH, CO2 and PPF (Figure 4H). Based on this data, decisions are made using an ON/OFF control scheme with hysteresis to regulate the activation of actuators. RH was stabilized using four ultrasonic humidifiers (model UH200, Bontill, Plano, Texas, USA), each with a 2.5 L capacity (Figure 4D). Their activation is managed via a relay module (Figure 4E), which also controls the pumps responsible for delivering the nutrient solution in the NFT system (Figure 4B). Air temperature is maintained using a mini split air conditioner (model X32, Mirage, Monterrey, Mexico) (Figure 4A). Additionally, a real-time clock (RTC) circuit (model DS1302, Maxim Integrated, San Jose, CA, USA) (Figure 4F) was implemented to automate decisions based on the time of day, ensuring photoperiod regulation through full-spectrum LED lamps (model INWT80421265Ec, Barrina Inc., Livermore, CA, USA) (Figure 4C). The program is executed automatically every minute.
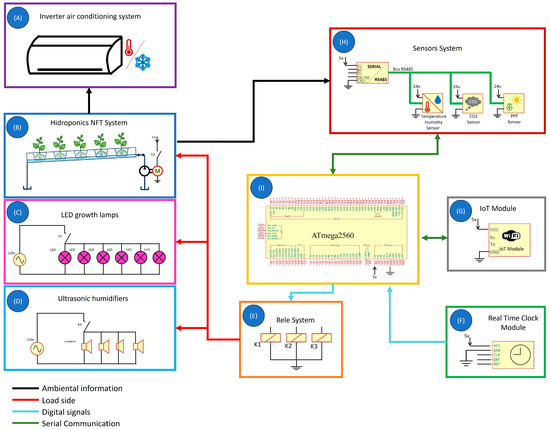
Figure 4.
Diagram of the physical layer of the proposed agricultural monitoring and control system. The architecture includes (A) mini split air conditioning unit for air temperature control; (B) NFT hydroponic system for plant cultivation; (C) full-spectrum LED lamps; (D) ultrasonic humidifiers; (E) relay module responsible for actuating the control mechanisms; (F) real-time clock circuit; (G) IoT module for data transmission; (H) set of sensors for environmental monitoring; and (I) development board based on the ATmega2560.
The selection of the ATmega2560 microcontroller (Microchip Technology Inc., Chandler, AZ, USA) was based on its accessibility, ease of implementation and the extensive range of available documentation, which facilitates rapid development of embedded systems. Its compatibility with the MODBUS RS-485 communication protocol via the Universal Asynchronous Receiver-Transmitter (UART) module, along with the wide availability of reliable libraries, enabled the integration of various industrial sensors for environmental monitoring.
Although there are more advanced development boards such as the STM32, which offer greater processing capacity, modular architecture and support for real-time operating systems, these platforms require more specialized programming environments and are associated with higher costs.
Using the MODBUS RS-485 communication protocol, the microcontroller retrieves data from the sensors. This protocol enables the interconnection of up to 32 devices on a single bus segment, with a communication range of up to 1200 m under standard conditions. Agronomic sensors with an IP67 rating were selected, providing dust resistance and allowing them to function effectively under higher RH conditions compared to other types of sensors. The selected sensors for each variable, along with their measurement ranges, are detailed in Table 2.
Table 2.
Sensors used in the physical layer of the proposed system. The table presents the model, manufacturer, city and country of origin, as well as the environmental variable measured by each sensor and its respective measurement range.
All sensors were used with their factory calibration, in accordance with the specifications provided by the manufacturer. Their proper functioning was verified by comparison with other measurement systems.
Programming logic enables automatic activation of control mechanisms, such as ultrasonic humidifiers and full-spectrum LED lamps, based on ambient conditions inside the growth chamber and predefined schedules.
As described in Listing 1, humidity control was implemented by reading the air temperature and RH sensor at one-minute intervals. The system compares the measured value with predefined maximum (hum_max) and minimum (hum_min) RH thresholds. When the RH inside the growth chamber drops below the minimum threshold, the humidifier activates; conversely, when the humidity exceeds the maximum threshold, the humidifier switches off.
| Listing 1. Code snippet used to control the activation and deactivation of the humidifiers based on ambient RH. |
| void pedirHumTemp() { if (node.readHoldingRegisters(0x0000, 2) == node.ku8MBSuccess) { Humedad = node.getResponseBuffer(0x00) / 10.0f; //RH Temp = node.getResponseBuffer(0x01) / 10.0f; //Air Temperature } } void control_humedad() { if (Humedad < hum_min) { digitalWrite(HUMID, LOW); // Activate humidifiers } else if (Humedad > hum_max) { digitalWrite(HUMID, HIGH); // Disactivate humidifiers } } |
Figure 5 shows the behavior of the environmental variables—air temperature, RH, CO2 and PPF—inside the plant growth chamber. The control over the lamps can be observed, as they are turned on at 2:00 P.M. and turned off at 4:00 A.M. the following day. Similarly, control actions to maintain air temperature and humidity within the established ranges are also evident. As a closed system capable of controlling its internal environmental variables, it offers the advantage of programming an artificial photoperiod that is offset from the natural light cycle. This allows the full-spectrum LED lamps to operate during non-working hours, providing greater convenience to the user in case access is required to perform adjustments or measurements. Furthermore, scheduling them at night represents an additional advantage, as in many regions, electricity rates are typically higher during daylight hours than at night [37].
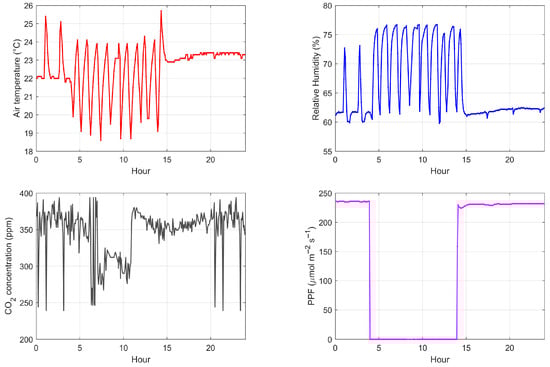
Figure 5.
Recorded behavior on 21 June 2024 of the environmental variables inside the plant growth chamber: air temperature (top left), RH (top right), CO2 (bottom left) and PPF (bottom right). The graphs show the control actions carried out by the system.
The network layer is implemented using an IoT module (G in Figure 4), which transmits environmental measurements every five minutes via HyperText Transfer Protocol (HTTP) protocols to the Service Layer. In this layer, the ThingSpeak platform is used for storing and analyzing the collected data.
The user experience layer employs a responsive web application that displays real-time graphs of environmental variables (air temperature, RH, CO2 and PPF) within the growth chamber. Likewise, the use of a mobile application for the same purpose is of utmost importance for users’ accessibility to information. An alert system notifies users via email in the event of a failure that prevents data transmission to the web server for periods exceeding 30 min.
For video surveillance, a Wi-Fi video camera, model HDC10_wjmozu-gj (WJMOZU, Shenzhen, China), with an integrated microphone was used. This device is compatible with the Tuya Smart mobile application [38], enabling users to view the crop status in real time, monitor the operation of full-spectrum LED lamps and, through the microphone, verify whether the pumps in the NFT hydroponic systems are functioning properly.
On the other hand, in order to obtain a precise estimate of the electrical energy consumption of the main devices in the proposed system, measurements were conducted using PZEM-004T v3.0 energy sensors (Peacefair, Shenzhen, China) during 24 h of continuous system operation. These sensors were temporarily connected to the main energy-consuming devices: the mini split air conditioner, full-spectrum LED lamps, recirculation pumps and ultrasonic humidifiers. This setup allowed us to record energy consumption, facilitating an evaluation of the system’s energy cost.
2.4. Case Study: Validation of the Proposed System Through Lettuce Cultivation
To validate the correct operation of the proposed system, a case study was conducted under controlled conditions using the NFT hydroponic technique.
The hydroponic lettuce experiment was conducted from 3 June (transplanting day) to 29 June 2024 (harvest day), in a controlled-environment growth chamber located at the Tecnológico Nacional de México in Celaya with the coordinates 20°32′15.422″ N, 100°48′54.604″ O. The experiment was divided into five stages, as illustrated in Figure 6.
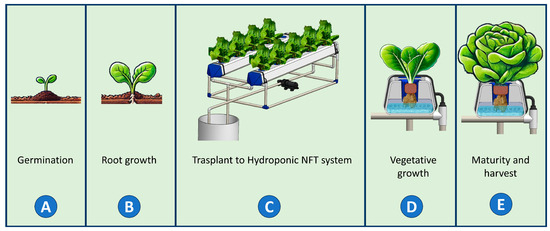
Figure 6.
Stages of the hydroponic lettuce cultivation experiment. The process is divided into five phases: (A) seed germination in substrate; (B) root development prior to transplanting; (C) transplanting into the NFT hydroponic system; (D) vegetative growth under controlled conditions of light, air temperature, RH and nutrients; and (E) plant maturity and harvesting.
During the germination stage (Figure 6A), lettuce seeds (Lactuca sativa cultivar ‘Rodhenas’) were placed in hydroponic net pots filled with peat moss and germinated for two days. In the root growth stage (Figure 6B), seedlings remained for 28 days in a greenhouse until they reached a height of approximately 8 cm. For the transplanting into the hydroponic systems (Figure 6C), seedlings were inserted into foam pads with their roots protruding from the bottom and placed inside hydroponic net pots. The seedlings were distributed into treatment groups of 10 plants each. During the vegetative growth stage (Figure 6D), the plants remained in the growth chamber for the following 26 days. Finally, during the harvest stage (Figure 6E), on the 25th day after transplanting (DAT), the nutrient solution was replaced with tap water to prevent bitterness in the lettuce at the time of consumption.
In the plant growth chamber, the air temperature was regulated at 20 ± 2 °C, while the RH was maintained at 60 ± 10% RH. The ambient CO2 concentration was kept close to 400 parts per million (ppm). A photoperiod of 14 h per day was applied and the PPF was stabilized at 200 ± 20 µmol m−2 s−1. PPF measurements were performed by placing the quantum sensor at the height of the tallest true leaf. The height of the full-spectrum LED lamps was adjusted every three days depending on the growth stage in order to maintain the desired light intensity.
The nutrient solution used in the experiment followed a commercial Steiner formulation (Soluponics Lechuga, Inverfarms S.A. de C.V., Queretaro, Mexico) [39], containing the essential micro- and macronutrients required for proper lettuce growth. To prepare the solution, the pH of 20 L of water was initially adjusted to 6.0 using 70% nitric acid (HNO3), followed by the individual dissolution of mother solution bags A and B in 10 L of water each.
The treatments applied consisted of nutrient solution concentrations of 100% (T100), 75% (T75) and 50% (T50). For the T100 solution, water with an adjusted pH of 6.0 was utilized and 5 mL of Steiner A and 5 mL of Steiner B were added per liter, resulting in an EC of approximately 1970 µS cm−1. For T75 and T50, the same procedure was followed, adjusting the concentrations to obtain an EC of approximately 1621 µS cm−1 (T75) and 1272 µS cm−1 (T50), by adding 3.75 mL and 2.5 mL per liter, respectively. To ensure the stability of these values, daily manual measurements of pH, EC, TDS and temperature of the nutrient solution were taken at 8:00 a.m. using a multiparameter water quality meter (model C-600, VIHELM, Shenzhen, China), as shown in Figure 7.
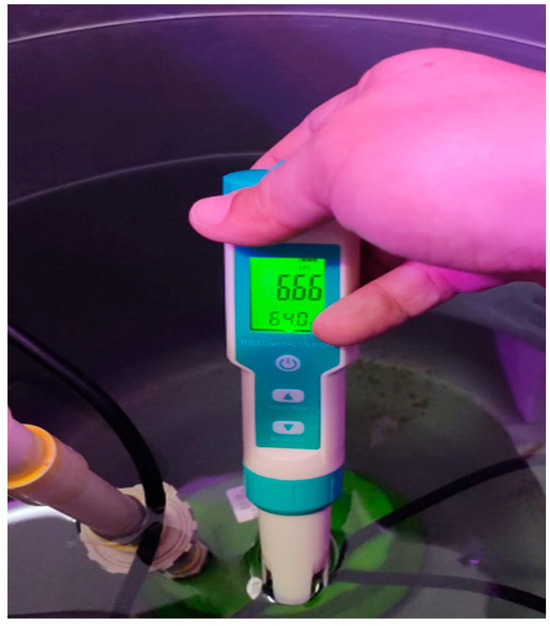
Figure 7.
Manual measurement of physicochemical parameters of the nutrient solution using a water quality meter (model C-600, VIHELM, Shenzhen, China).
2.5. Variables Obtained from the Cultivation Experiment
During the cultivation experiment, the Soil–Plant Analysis Development (SPAD) index was measured every 3 days between 8:00 AM and 9:00 AM using a portable chlorophyll meter (model MC-100, Apogee Instruments Inc., Logan, UT, USA) on the secondary leaves of the third and fourth leaf of each plant. The use of SPAD units is justified by their ability to provide fast, non-destructive and reliable measurements that correlate well with traditional destructive methods [40].
On 29 June 2024, 26 days after transplanting, seven lettuce plants from each treatment group were harvested to evaluate phenotypic variables. The lettuces were carefully removed from both the hydroponic net pot and the foam pad. The fresh weight of the entire plant, including the root system, was recorded, followed by individual measurement of each component. A tape measure was used to determine plant height and root length. The stem diameter at the intersection point with the root was measured using a Mitutoyo (model 500-196-30, Mitutoyo Corporation, Kanagawa, Japan) digital caliper. The number of leaves was determined by manual counting. To obtain dry weight, each lettuce and its corresponding root system were individually placed in Kraft paper bags and dried in an incubator (model FE-131AD, Scientific Equipment F.E.L.I.S.A. S.A. de C.V., Ciudad de México, México) at 70 °C for 72 hrs. Subsequently, the dry mass was measured using a digital scale (model GY20002, Goyojo, Guangzhou, China).
The three remaining lettuces from each treatment were used to determine the proximal composition of the moisture percentage, protein content, fat, fiber, ash and carbohydrate levels. For the analysis, samples were collected from the upper, middle and lower sections of each plant. Moisture content was determined by drying the sample at 70 °C in a vacuum oven until it reached constant weight. Protein content was calculated using the Kjeldahl method [41], employing a micro digester (model MDK-6, Novatech Equipos Científicos S.A. de C.V., Naucalpan, México) and a nitrogen to protein conversion factor of 6.25 to estimate crude protein. The ash content was determined through calcination in a muffle furnace (model 273, Indef S.R.L., Buenos Aires, Argentina) at an air temperature of 550 °C for 24 h. Total fat content was determined using the Soxhlet method [42], with n-hexane as the extraction solvent. Finally, carbohydrate content was calculated by difference.
For statistical analysis of the collected data, normality was first verified using the Shapiro–Wilk test. Subsequently, an analysis of variance (ANOVA) was performed to identify significant differences among the treatments used. Mean comparisons were conducted using Tukey’s test at a 5% significance level. Statistical procedures were performed using Microsoft Excel (version 2021), with its built-in data processing tools.
3. Results
3.1. NFT Hydroponic System
The proposed hydroponic system is presented in Figure 8, where two hydroponic channels (Figure 8,A) are shown, each capable of housing up to five plants. The hydraulic pump (Figure 8,B) is responsible for delivering the nutrient solution from the tank through the hoses (Figure 8,C), while the return pipe (Figure 8,D) facilitates the recirculation of the remaining nutrient solution. Additionally, the CPVC frame (Figure 8,E) provides the necessary inclination for the system to function properly.
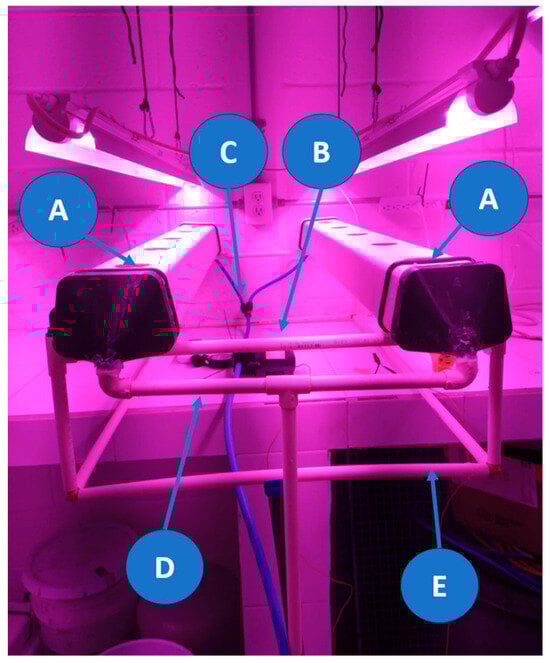
Figure 8.
Photograph of the developed NFT hydroponic system. The system consists of two hydroponic channels (A), each capable of holding up to five plants. The hydraulic pump (B) is used to drive the nutrient solution through 10 mm diameter hoses (C). The return pipe (D) allows the recirculation of the unabsorbed solution. The entire setup is supported by a CPVC structure (E).
3.2. Plant Growth Chamber
Figure 9 shows the plant growth chamber, where smart monitoring and control system is employed (Figure 9,A). The chamber includes a CO2 parts-per-million sensor (Figure 9,B), a PPF sensor (Figure 9,C), an air temperature and RH sensor (Figure 9,D), an inverter-type air conditioning system (Figure 9,E), full-spectrum LED lamps (Figure 9,F) and the developed NFT hydroponic systems: T100 (Figure 9,G), T75 (Figure 9,H) and T50 (Figure 9,I).
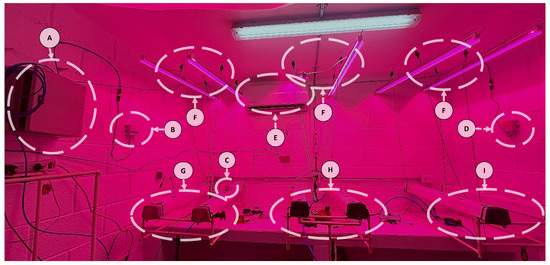
Figure 9.
Developed plant growth chamber. The chamber includes: the smart monitoring and control system (A), CO2 sensor (B), photosynthetically active radiation sensor (C), air temperature and RH sensor (D), inverter-type air conditioner (E) and full-spectrum LED lamps (F). Also shown are the three NFT hydroponic systems used: T100 (G), T75 (H) and T50 (I).
The system’s operation was verified through a 26-day case study. Data for environmental variables were recorded at 5 min synchronization intervals, resulting in 29,980 entries per variable, allowing real-time tracking of their behavior.
As shown in Figure 10, a responsive web application (Figure 10a) was developed to visualize environmental variables in real time through graphical representations. Likewise, an Android mobile application (Figure 10b) was designed for the same purpose. A failure alert system was implemented which sends email notifications if data transfer to the server is interrupted for more than 30 min. It is important to note that both applications allow users to modify the setpoints for environmental variables via text input fields and export historical data for further analysis and decision-making.
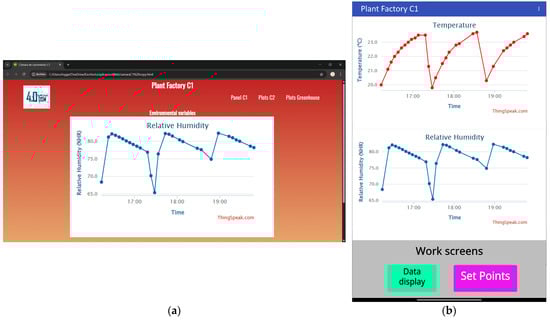
Figure 10.
(a) Responsive web application that enables real-time monitoring through intuitive graphics. (b) Android mobile application with the same functionality, optimized for small-screen devices.
Figure 11 shows the daily behavior of air temperature and RH throughout the experiment. The air temperature averaged 23 ± 3 °C, while the RH averaged 65 ± 5%HR.
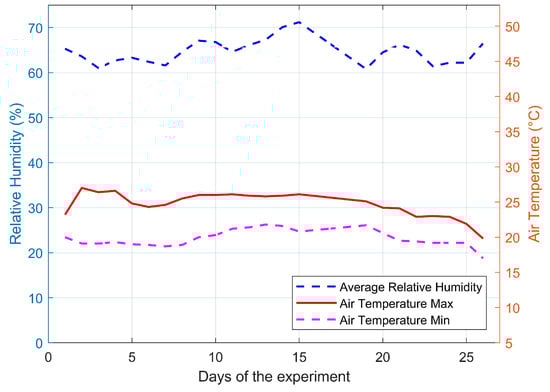
Figure 11.
Daily behavior of air temperature and RH recorded inside the plant growth chamber using the smart agriculture system during the cultivation experiment.
The behavior of CO2 within the plant growth chamber is shown in Figure 12. The daily average concentration was approximately 347 ppm, which is lower than the expected ambient average of 420 ppm [43]. This difference is attributed to the photosynthetic activity of the plants within the enclosed environment. The presence of users inside the growth chamber influences CO2 concentration due to human respiration. Days with higher human activity correlate with elevated values in the graph, demonstrating a direct impact of human presence on the controlled environment.
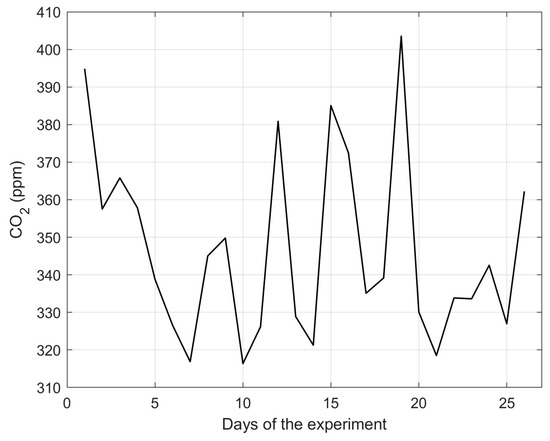
Figure 12.
Average daily behavior of CO2 levels recorded inside the plant growth chamber using the smart agriculture system during the cultivation experiment.
3.3. Video Monitoring
The combination of control technologies and IoT-based environmental monitoring, along with the video surveillance system within the plant growth chamber, provides comprehensive oversight of the cultivation environment. This enhances security, improves response efficiency in case of system failures and ultimately drives higher productivity and sustainability. Figure 13 presents a view of the implemented video monitoring system, displaying the operational status of the full-spectrum LED lamps and the condition of the hydroponic channels.
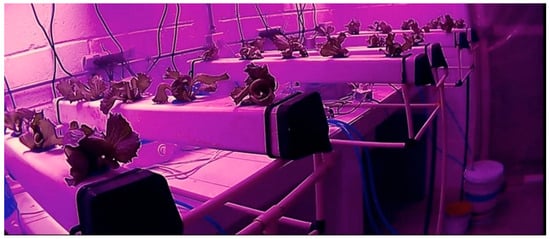
Figure 13.
View of the surveillance camera implemented inside the plant growth chamber. The image shows the operational state of the full-spectrum LED lamps and the condition of the NFT hydroponic channels with plants in the development phase.
3.4. Case Study Results: Nutrient Solution Behavior
Figure 14 illustrates the behavior of the physicochemical variables measured during the experiment. The pH level remained between 5.4 and 6.6 across the three treatments, averaging 6.11 for T100, 6.04 for T75 and 6.14 for T50. The average EC for T100 during the experiment was 2003.84 µS cm−1, ranging between 1850 and 2300 µS cm−1; for T75, the average conductivity was 1589.15 µS cm−1 fluctuating between 1399 and 1740 µS cm−1; finally, T50 had an average conductivity of 1195.46 µS cm−1, with a minimum value of 1039 µS cm−1 and a maximum of 1286 µS cm−1. Since the experiment was conducted in a controlled environment, the recorded temperature of the nutrient solution showed very similar behavior across the three treatments throughout the experiment.
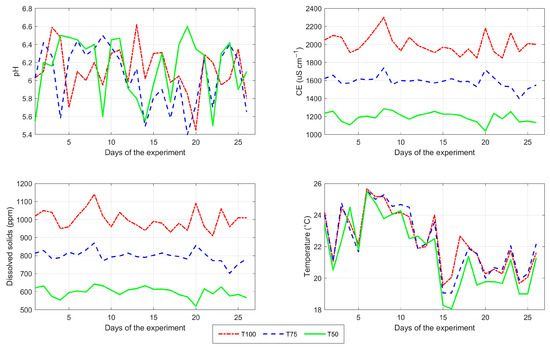
Figure 14.
Daily behavior of the physicochemical variables of the nutrient solution during the cultivation experiment for the three treatments: T100 (100%), T75 (75%) and T50 (50%) nutrient concentration. The following values are shown: pH (top left), EC (top right), TDS (bottom left) and nutrient solution temperature (bottom right).
3.5. Case Study Results: Statistical Analysis of Lettuce Phenotypic Variables
Lettuce is one of the most important vegetables grown in protected agriculture and is consumed in large quantities worldwide in salad preparation due to its phytonutrient content, which provides health benefits for humans [44]. For this reason, various technologies have been developed to monitor its growth under different cultivation techniques [45].
The combination of the controlled-environment chamber and the implemented NFT hydroponic technique resulted in a positive effect on the development of the harvested lettuces, as shown in Figure 15. This figure illustrates the cultivation experiment three days before harvest, revealing that the lettuces grown across all three treatments exhibited uniform growth.
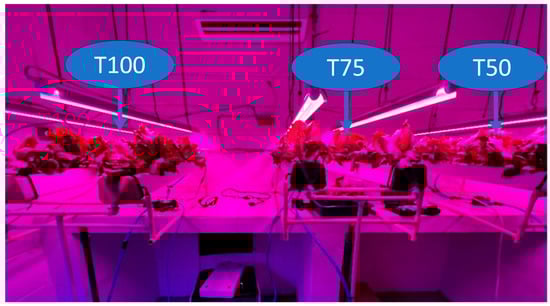
Figure 15.
Photograph of the cultivation experiment conducted in the plant growth chamber using the NFT hydroponic system (taken three days before harvest). The three applied treatments are shown: T100 (100%), T75 (75%) and T50 (50%) nutrient concentration.
Table 3 presents the results obtained from the lettuce cultivation experiment. It can be observed that all growth variables, such as plant height, root length, stem diameter and number of leaves, showed no statistically significant differences among treatments, according to the ANOVA test with a 5% significance level. The results are presented as mean ± standard deviation (SD).
Table 3.
Means and standard deviations (±SD) of the evaluated growth variables, including height, number of leaves, fresh and dry leaf mass, fresh and dry root mass, root length, stem width, leaf water mass and leaf chlorophyll content, according to the treatments applied during the cultivation experiment.
Regarding fresh matter, a significant difference of 8.17 g was observed between T75 and T100 for root fresh mass. For leaf fresh mass, no significant difference was found, with the largest difference being 25.84 g between T75 and T100.
In terms of dry mass, a statistically significant difference was found between T100 and the other treatments. This may be explained by a lower moisture concentration and a higher nutrient concentration in the T100 treatment. The observed difference in dry mass was 6.59 g between T100 and T75.
During the cultivation period, chlorophyll content in the leaves was measured using SPAD index values, shown in Table 3. There were no significant differences in chlorophyll content among treatments, suggesting that the consistent PPF values contributed to the homogeneity of chlorophyll levels, as illustrated in Figure 16. Leaf water mass was calculated by subtracting the dry leaf mass from the fresh leaf mass.
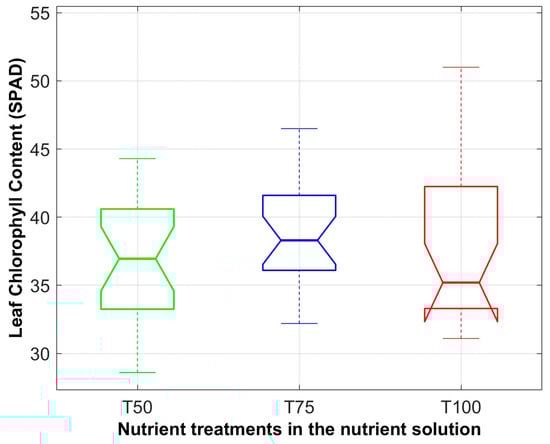
Figure 16.
Box plot of chlorophyll content in lettuce leaves measured using SPAD index values during the cultivation experiment for treatments T50, T75 and T100. Each box represents the interquartile range (Q1–Q3), the central line marks the median and the whisker ends indicate the minimum and maximum values, excluding outliers.
To evaluate crop efficiency, dry leaf mass was measured for each treatment, revealing that the T100 treatment showed significantly higher values of leaf dry mass compared to T75 and T50, suggesting that greater nutrient availability promotes biomass accumulation. Figure 17 shows the arithmetic means of chlorophyll and dry leaf mass in the different treatments.
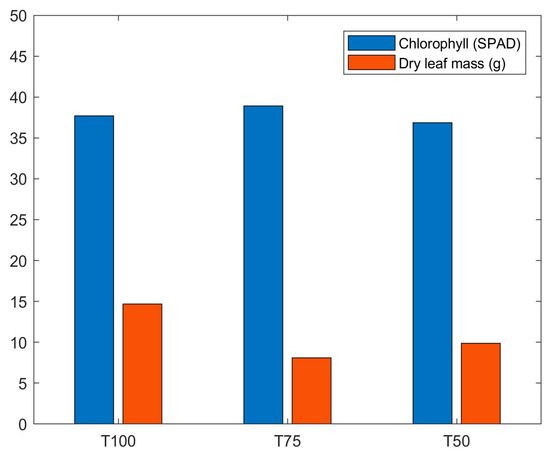
Figure 17.
Comparison of the arithmetic means of chlorophyll content (SPAD index values) and leaf dry mass (g) in treatments T100, T75 and T50.
3.6. Case Study Results: Proximal Analysis
Lettuce is a vegetable belonging to the Compositae family, it is low in calories and serves as a good source of folic acid, vitamins A and C, as well as dietary fiber, which has significant benefits for digestive health. However, its overall nutritional value is relatively low, as it consists mostly of water. Additionally, lettuce possesses antioxidant properties due to its carotenoid levels and phenolic compounds [46].
Table 4 presents the biochemical variable data obtained from the proximal analyses conducted on 100 g of lettuce from the different treatments with the purpose of highlighting the nutritional benefits of each treatment and determining whether they meet the basic compositional criteria. The results are presented as mean ± standard deviation (SD).
Table 4.
Means and standard deviations (±SD) of the biochemical variables per 100 g of lettuce obtained from the experimental treatments.
No significant differences were found among the treatments in terms of carbohydrates, fats and fiber content. However, for protein content, significant differences were observed, with T100 showing the highest values and a maximum difference of 0.7 g between treatments. Regarding moisture content, a deficiency of 0.71 g was recorded for T100.
No significant differences were observed among treatments for iron and magnesium content. In contrast, significant differences were found in ascorbic acid, potassium and sodium levels between T50 and T100, but not between T75. Lastly, for zinc content, significant differences were observed across all three treatments, with T50 presenting the lowest values, causing reduced nutrient concentration in this treatment.
Table 5 presents a comparison of some biochemical variables from T100, T75 and T50 against 100 g of commercially available iceberg lettuce, as reported by the United States Department of Agriculture (USDA) [47]. As observed, the carbohydrate values in all three treatments are slightly lower than those reported by [47], yet remain within a comparable range, indicating that the implementation of the smart agriculture system does not negatively impact the lettuce’s energy contribution. An increasing trend in protein content was observed with higher nutrient solution concentrations, with T75 and T100 exceeding the values reported in [47]. Moisture content was higher in all three treatments compared to the reference, which may be attributed to the hydroponic technique used, as it provides a greater amount of water to the plants during growth. Finally, the treatments also showed higher fiber content than the reference, with T75 exhibiting the highest value.
Table 5.
Means of biochemical variables in 100 g of lettuce obtained in the experiment treatments.
3.7. Case Study Results: Energy Measurements
Energy analysis is a fundamental component in evaluating the performance of agricultural systems in controlled environments, as it helps identify critical loads and supports the development of optimization strategies [48].
An energy consumption monitoring process was conducted with a 16 s update rate for the main devices comprising the proposed system. The total energy expenditure for one day of system operation was 13.65 kWh, of which 53% (7.22 kWh) was attributed to air conditioning—this being the component with the highest energy demand due to the continuous thermal regulation required for crop development. Secondly, full-spectrum LED lamps accounted for 28% (3.82 kWh) of daily consumption, reflecting their extended operation during the defined photoperiod. Hydraulic pumps, used to recirculate the nutrient solution, consumed 13% (1.78 kWh), while ultrasonic humidifiers represented the lowest energy consumption at 6% (0.83 kWh). On average, the system consumes 0.46 kWh per plant per day.
To estimate daily energy costs, several factors must be considered such as geographical location, the type of contract with the electricity provider and the time of year. Based on the location of the system during the case study and referencing the current average residential electricity rate of $0.058 USD/kWh, the average daily energy cost for operating the proposed system was calculated at $0.80 USD, which corresponds to an approximate expenditure of $0.027 USD per plant.
4. Discussion
The purpose of a plant growth chamber is to create controlled environmental conditions that favor the growth and productivity of agricultural crops. Developing such structures requires appropriate infrastructure that ensures the maintenance of ideal conditions, as well as the implementation of an environmental monitoring and control system. In this project, the smart monitoring and control system proved effective by providing real-time data on environmental conditions, thus ensuring a favorable environment for the development of hydroponic crops.
The implementation of the NFT hydroponic technique within the growth chamber proved beneficial for the year-round cultivation of lettuce, as it created favorable environmental conditions regardless of the season. This favored uniform plant growth, as no significant differences were observed in the phenotypic characteristics of the harvested lettuce, including chlorophyll content. However, the proximal analyses revealed significant differences between treatments, particularly in protein, Sodium, Potassium and Zinc content.
The T75 treatment proved to be the most effective of the treatments used in the growth chamber, as it showed the fewest significant differences in the proximal analyses compared to T100 and T50, promoting lettuces with acceptable phenotypic characteristics while achieving 25% nutrient savings.
The developed system offers benefits that contribute to a sustainability-oriented approach in agriculture. First, by employing the NFT hydroponic technique, it achieves a 90% reduction in water usage compared to traditional farming methods [49]. Second, supplying nutrients in a controlled manner helps minimize waste. Third, as the system operates within a closed and controlled environment, plant exposure to external factors is minimized significantly reducing the need for agrochemicals and promoting cleaner, more environmentally friendly practices.
Although the current energy consumption per plant (0.46 kWh/day) is relatively high, this value can be lowered by optimizing space usage through increased plant density (plants per m3), integrating renewable energy sources and applying energy optimization algorithms. Therefore, the system shows strong potential for sustainability.
According to the studies reviewed in the state of the art, when comparing environmental management IoT technologies with our proposal, similarities were found in the microcontroller used, as reported in [21,28], as well as in the monitored variables, which align with those reported in [18,21,23,26]. Similarities were also found across all studies regarding the use of mobile or web applications for data visualization. The main differences are highlighted in Table 6.
Table 6.
Comparison with related studies.
In comparison with systems described in previous studies, the system proposed in this work presents several advantages. One of its main strengths lies in its ability to simultaneously monitor multiple environmental variables: air temperature, RH, CO2 concentration, photoperiod and PPF. In most of the reviewed works, only two or three variables were monitored, as seen in [18,21], with [20] being the only one comparable to the system described in this article.
Similarly, the described system stands out by offering complete microclimate control in a fully enclosed indoor environment, including automatic regulation of air temperature via air conditioning, ultrasonic humidification and photoperiod control using full-spectrum LED lamps. This level of automation was only partially addressed in [18], which focused on aeroponic systems with more limited environmental control.
Another significant contribution is the implementation of a responsive web application and a mobile app for visualizing and modifying the setpoints of environmental variables, unlike [21,25,28,29], the proposed system allows remote access to data outside the local network. This feature greatly enhances the system’s accessibility, enabling users to monitor and adjust crop parameters from any location with Internet access.
An additional contribution is the automatic email alert system triggered by data transmission failures, which strengthens the system’s operational reliability. This is only comparable to the WhatsApp alert system used in [31].
Regarding experimental validation, this study not only presents the behavior of environmental variables but also evaluates phenotypic and nutritional characteristics of the harvested crops like fresh and dry weight, number of leaves, plant height, root length and content of proteins, fiber and carbohydrates. This comprehensive approach sets it apart from studies such as [20,23,24,25,28,31], which do not assess the direct impact of environmental conditions on final crop quality.
Despite the proper performance of the proposed system, one of the main limitations identified compared to [24] is the absence of an automated control loop for adjusting nutrient solution variables such as pH, EC and TDS. In its current version, these adjustments must be made manually. It is anticipated that future implementations will incorporate control mechanisms and algorithms capable of regulating these variables in real time, thereby improving nutrient solution management.
Additionally, although an IoT architecture based on five layers is proposed, the current implementation does not incorporate artificial intelligence for predictive analysis, as seen in the system developed by [23].
5. Conclusions
This article presents the development of a smart agriculture system that monitors and controls various environmental variables, supported by a web application and a mobile app for data visualization. Additionally, this study analyzed the growth of lettuce (Lactuca sativa) in hydroponic systems, evaluating three treatments with different nutrient concentrations: 50%, 75% and 100% of the Steiner solution, respectively.
The presented system demonstrates effective integration of sensors and actuators in an indoor hydroponic environment, using an ATmega2560 microcontroller and the MODBUS RS-485 communication protocol. This configuration enabled real-time monitoring and control of environmental conditions, maintaining stable key variables for plant development such as air temperature, RH, PPF and photoperiod, thereby promoting uniform plant growth. Additionally, the proposed architecture supports expansion of up to 31 slave devices, including sensors and control mechanisms, providing high adaptability for deployment in scenarios that require a greater number of variables to be monitored and controlled.
The implementation of the smart agriculture system enabled the evaluation, through an experimental design using 50%, 75% and 100% nutrient concentration treatments of the phenotypic and nutritional development of lettuce under controlled conditions. The finding of few significant differences between treatments suggests that controlled environmental variables contribute to crop uniformity, regardless of variations in the applied nutrient solution.
The integration of the smart agriculture system not only ensured efficient control of environmental conditions, maintaining stability over 26 days without technical failures, but also enabled continuous access to crop data via electronic means and offered opportunities for improvement, such as the integration of alarm systems.
The inclusion of a responsive web application and a mobile app for environmental monitoring and control represents a substantial improvement over local or limited-access solutions. This design facilitates remote interaction, interface customization and efficient management of crop parameters, providing a user-centered approach that is key for adoption in diverse contexts.
The presented system is scalable and adaptable with potential applications in both commercial production and educational and research environments. Furthermore, its implementation promotes sustainable agricultural practices by reducing environmental impact, as hydroponic systems can save up to 90% of water compared to traditional farming methods [49] and contributes to the technological advancement of the agricultural sector.
However, it is important to note that the proposed system does not yet incorporate an automated control loop for adjusting nutrient solution variables such as pH, EC and TDS. This limitation represents a key aspect to be considered in future research.
Future Work
Although the development board based on the ATmega2560 microcontroller proved to be suitable for managing various sensors and control mechanisms, and for maintaining communication with the IoT module to send and receive data from the cloud server, the proposed architecture has been designed with scalability and adaptability in mind.
This design allows for easy migration to more robust microcontrollers such as the STM32 in future implementations. This capability will be crucial for integrating artificial intelligence modules that require greater processing power.
As future work, it is planned to expand the system’s implementation toward different leafy crops such as spinach and Swiss chard to evaluate its effectiveness. Parallel to this, automated monitoring and control sub-systems for the nutrient solution will be integrated to ensure homogeneity at all crop stages.
To address the need for intelligent management highlighted by current research, the integration of low-complexity supervised machine learning models, such as decision trees or logistic regression, is proposed. These models will enable the identification of patterns in historical data and the generation of alerts regarding crop conditions, such as deviations in pH or EC ranges [50], thereby reducing agronomic risks and improving the final product’s quality.
Finally, the implementation of a cloud-based recommendation system is proposed, using rule-based and trend-driven logic to support decisions such as adjusting irrigation cycles or modifying reference values for environmental variables [51]. This enhancement will enable more precise and timely adaptation of the cultivation environment, improving overall performance, reducing unnecessary resource consumption and supporting better long-term management.
Author Contributions
Conceptualization, E.B.-Á. and J.M.-N.; methodology, C.M.-N.; software, V.S.-O. and R.H.-A.; validation, C.M.-N., C.M.-A. and J.M.-N.; formal analysis, C.M.-A.; investigation, R.H.-A.; resources, V.S.-O.; data curation, R.H.-A.; writing—original draft preparation, R.H.-A.; writing—review and editing, J.M.-N. All authors have read and agreed to the published version of the manuscript.
Funding
This research received no external funding.
Data Availability Statement
The raw data supporting the conclusions of this article will be made available by the authors on request.
Conflicts of Interest
The authors declare no conflicts of interest.
References
- Sumberg, J.; Giller, K.E. What is ‘conventional’ agriculture? Glob. Food Secur. 2022, 32, 100617. [Google Scholar] [CrossRef]
- Food and Agriculture Organization of the United Nations. The State of Food Security and Nutrition in the World 2023; FAO: Rome, Italy, 2023. [Google Scholar] [CrossRef]
- Banjare, C.; Mahanta, D.; Sahu, P.; Choudhary, R. A Comprehensive Review on Protected Cultivation: Importance, Scope and Status. Int. J. Environ. Clim. Change 2024, 14, 46–55. [Google Scholar] [CrossRef]
- Mamatha, V.; Kavitha, J.C. Machine learning based crop growth management in greenhouse environment using hydroponics farming techniques. Meas. Sens. 2023, 25, 100665. [Google Scholar] [CrossRef]
- Nursyahid, A.; Helmy, H.; Karimah, A.I.; Setiawan, T.A. Nutrient Film Technique (NFT) hydroponic nutrition controlling system using linear regression method. IOP Conf. Ser. Mater. Sci. Eng. 2021, 1108, 012033. [Google Scholar] [CrossRef]
- Gillani, S.A.; Abbasi, R.; Martinez, P.; Ahmad, R. Comparison of energy-use efficiency for lettuce plantation under nutrient film technique and deep-water culture hydroponic systems. Procedia Comput. Sci. 2023, 217, 11–19. [Google Scholar] [CrossRef]
- Zhu, Z.; Yogev, U.; Keesman, K.J.; Rachmilevitch, S.; Gross, A. Integrated hydroponics systems with anaerobic supernatant and aquaculture effluent in desert regions: Nutrient recovery and benefit analysis. Sci. Total Environ. 2023, 904, 166867. [Google Scholar] [CrossRef] [PubMed]
- Goddek, S.; Joyce, A.; Kotzen, B.; Burnell, G.M. Aquaponics Food Production Systems; Springer: Cham, Switzerland, 2019. [Google Scholar] [CrossRef]
- Palmitessa, O.D.; Signore, A.; Santamaria, P. Advancements and future perspectives in nutrient film technique hydroponic system: A comprehensive review and bibliometric analysis. Front. Plant Sci. 2024, 15, 1504792. [Google Scholar] [CrossRef]
- Zhang, X.; He, D.; Niu, G.; Yan, Z.; Song, J. Effects of lighting on hydroponic lettuce. Int. J. Agric. Biol. Eng. 2018, 11, 33–40. [Google Scholar] [CrossRef]
- Wong, C.E.; Teo, Z.W.N.; Shen, L.; Yu, H. Seeing the lights for leafy greens in indoor vertical farming. Trends Food Sci. Technol. 2020, 106, 48–63. [Google Scholar] [CrossRef]
- Lubna, F.A.; Lewus, D.C.; Shelford, T.J.; Both, A.J. What you may not realize about vertical farming. Horticulturae 2022, 8, 322. [Google Scholar] [CrossRef]
- Nižetić, S.; Šolić, P.; López-de-Ipiña, D.; Patrono, L. Internet of things (IoT): Opportunities, issues and challenges towards a smart and sustainable future. J. Clean. Prod. 2020, 274, 122877. [Google Scholar] [CrossRef] [PubMed]
- Madushanki, A.A.R.; Halgamuge, M.N.; Wirasagoda, W.A.H.S.; Syed, A. Adoption of IoT in agriculture and smart farming towards urban greening: A review. Int. J. Adv. Comput. Sci. Appl. 2019, 10, 11–28. [Google Scholar] [CrossRef]
- Gulzar, Y.; Reegu, F.A.; Soomro, A.B.; Mir, M.S.; Zahir, A.; Onn, C.W. Exploring the economic implications of IoT adoption in agriculture: A cost-benefit study in Jazan, Saudi Arabia. Sarhad J. Agric. 2025, 41, 51–65. [Google Scholar] [CrossRef]
- Sahu, B. Artificial intelligence and automation in smart agriculture: A comprehensive review of precision farming. Int. J. Sci. Res. 2024, 13, 656–665. [Google Scholar] [CrossRef]
- Ray, P.P. IoT for smart agriculture: Technologies and future direction. J. Ambient Intell. Smart Environ. 2017, 9, 395–420. [Google Scholar] [CrossRef]
- Jamhari, C.A.; Nurlaela, L.; Nasution, M.K.M. Design and implementation of IoT for aeroponic chamber temperature monitoring. In Proceedings of the 2020 International Conference on Vocational Education and Electrical Engineering (ICVEE), Surabaya, Indonesia, 3 October 2020. [Google Scholar] [CrossRef]
- MathWorks. ThingSpeak™: Learn More. Available online: https://thingspeak.mathworks.com/pages/learn_more (accessed on 14 July 2025).
- Khaoula, T.; Abdelouahid, R.A.; Ezzahoui, I.; Marzak, A. Architecture design of monitoring and controlling of IoT-based aquaponics system powered by solar energy. Procedia Comput. Sci. 2021, 191, 493–498. [Google Scholar] [CrossRef]
- Hostalrich, D.; Esteve, M.; Garcia, A.; Celma, S. Intelligent management of hydroponic systems based on IoT for agrifood processes. J. Sens. 2022, 2022, 9247965. [Google Scholar] [CrossRef]
- Allakany, A.; Saber, A.; Mostafa, S.M.; Alsabaan, M.; Ibrahem, M.I.; Elwahsh, H. Enhancing security in ZigBee wireless sensor networks: A new approach and mutual authentication scheme for D2D communication. Sensors 2023, 23, 5703. [Google Scholar] [CrossRef]
- Ramakrishnam Raju, S.V.S.; Kumar, M.R.; Subramanyam, T.; Suresh, P.; Sravani, B. Design and implementation of smart hydroponics farming using IoT-based AI controller with mobile application system. J. Nanomater. 2022, 2022, 4435591. [Google Scholar] [CrossRef]
- Abu Sneineh, A.; Shabaneh, A.A.A. Design of a smart hydroponics monitoring system using an ESP32 microcontroller and the Internet of Things. MethodsX 2023, 11, 102401. [Google Scholar] [CrossRef] [PubMed]
- Fasciolo, B.; Villa, C.; Pennati, A.; Rizzi, C. A smart aeroponic system for sustainable indoor farming. Procedia CIRP 2023, 116, 636–641. [Google Scholar] [CrossRef]
- Nikolov, N.V.; Yordanov, G.; Nikolova, N.; Petrova, P.; Ganeva, V. Design of a small-scale hydroponic system for indoor farming of leafy vegetables. Agriculture 2023, 13, 1191. [Google Scholar] [CrossRef]
- NIDO ONE Hydroponic Controller System. Available online: https://www.nidopro.com/en/prodotto/nido-one/ (accessed on 24 June 2025).
- Safira, M.; Rinaldi, R.; Setiawan, A.; Nurhasanah, A. Design and implementation of IoT-based monitoring system on nanobubble-based hydroponics farming. J. Tek. Pertan. Lampung 2023, 12, 470–483. [Google Scholar] [CrossRef]
- Niswar, M. Design and implementation of an automated indoor hydroponic farming system based on the Internet of Things. Int. J. Comput. Digit. Syst. 2024, 15, 337–346. [Google Scholar] [CrossRef]
- OpenJS Foundation & Contributors. Node-RED: Low-Code Programming for Event-Driven Applications. Node-RED. Available online: https://nodered.org/ (accessed on 24 June 2025).
- Sitanayah, L.; Nugroho, S.; Hartono, A.; Wijaya, T. A low-cost hydroponic monitoring system with Internet of Things and fuzzy logic. J. Comput. Theor. Appl. 2025, 2, 441–455. [Google Scholar] [CrossRef]
- NodeMCU Documentation. Available online: https://nodemcu.readthedocs.io/en/release/ (accessed on 14 July 2025).
- Firebase. Available online: https://firebase.google.com/?hl=en (accessed on 14 July 2025).
- MathWorks. Types of Fuzzy Inference Systems. Available online: https://la.mathworks.com/help/fuzzy/types-of-fuzzy-inference-systems.html (accessed on 14 July 2025).
- Urrestarazu, M. Manual Práctico del Cultivo sin Suelo e Hidroponía; Mundi-Presa: Madrid, Spain, 2015. [Google Scholar] [CrossRef]
- Santiteerakul, S.; Phasuk, S.; Pongnumkul, S.; Boonchieng, E. The role of smart technology in sustainable agriculture: A case study of Wangree plant factory. Sustainability 2020, 12, 4640. [Google Scholar] [CrossRef]
- Comisión Federal de Electricidad—Tarifas GDMTH. Available online: https://app.cfe.mx/Aplicaciones/CCFE/Tarifas/TarifasCRENegocio/Tarifas/GranDemandaMTH.aspx (accessed on 1 August 2025).
- Tuya Smart. Available online: https://www.tuya.com/ (accessed on 14 July 2025).
- Inverfarms. Soluponics Lechuga. Available online: https://inverfarms.com/product/soluponics-lechuga/ (accessed on 14 July 2025).
- Zhang, H.; Ge, Y.; Xie, X.; Atefi, A.; Wijewardane, N.K.; Thapa, S. High throughput analysis of leaf chlorophyll content in sorghum using RGB, hyperspectral and fluorescence imaging and sensor fusion. Plant Methods 2022, 18, 60. [Google Scholar] [CrossRef] [PubMed]
- Alimentos, C.; Kjeldahl, T. Cambios en los métodos oficiales de análisis de la AOAC. AOAC Int. 2020, 79, 1060–3271. [Google Scholar]
- United States Environmental Protection Agency (US EPA). Method 3540C Soxhlet Extraction; EPA: Washington, DC, USA, 1996. Available online: https://www.epa.gov/sites/default/files/2015-12/documents/3540c.pdf (accessed on 24 June 2025).
- National Oceanic and Atmospheric Administration (NOAA). Global Monitoring Laboratory—Global Greenhouse Gas Reference Network; NOAA: Washington, DC, USA, 2025. Available online: https://gml.noaa.gov/ccgg/trends/gl_trend.html (accessed on 25 June 2025).
- Lara-Izaguirre, A.; Padilla-Ramírez, J.S.; Peña-Gómez, M.C.; Sánchez-del Castillo, F.; Muñoz-Rodríguez, L. Respuesta fotosintética de lechuga hidropónica a relaciones de NO3−/NH4+ en verano y otoño. Rev. Fitotec. Mex. 2020, 43, 565–573. [Google Scholar] [CrossRef]
- Monroy-García, O.; Sánchez-Velázquez, E.; Hernández-Ramírez, J.; Téllez-Velázquez, A.; Sánchez-Pérez, J.A. Sistema inalámbrico modular de bajo costo para supervisar variables ambientales en invernaderos: Un respaldo al agricultor de pequeña escala. Rev. Científica 2017, 29, 164–179. [Google Scholar] [CrossRef]
- Sularz, O.; Ciska, E.; Drabińska, N.; Grembecka, M.; Stangierski, J. Chemical composition of lettuce (Lactuca sativa L.) biofortified with iodine by KIO3, 5-iodo- and 3,5-diiodosalicylic acid in a hydroponic cultivation. Agronomy 2020, 10, 1022. [Google Scholar] [CrossRef]
- United States Department of Agriculture (USDA). FoodData Central: Lettuce, Iceberg, Raw; USDA: Washington, DC, USA, 2022. Available online: https://fdc.nal.usda.gov/food-details/2346388/nutrients (accessed on 24 June 2025).
- Wai, T.S.; Chaichana, C.; Maruyama, N. Energy Cost Analysis of Growing Strawberries in a Controlled Environment Chamber. Energy Rep. 2023, 9, 677–687. [Google Scholar] [CrossRef]
- Regmi, A.; Sapkota, S.; Adhikari, S.; Aryal, B.; Paudel, R. Comparing resource use efficiencies in hydroponic and aeroponic production systems. Technol. Hortic. 2024, 4, 0002. [Google Scholar] [CrossRef]
- Roy, U.R.B.P.; Sattar, K.N.A.; Elngar, A.A. A smart irrigation system using IoT and advanced machine learning model. J. Smart Internet Things 2024, 2, 13–25. [Google Scholar] [CrossRef]
- Nawaz, M.; Khan, B.B. IoT and AI for smart agriculture in resource-constrained environments: Challenges, opportunities and solutions. Smart Agric. J. 2025, 5, 24. [Google Scholar] [CrossRef]
Disclaimer/Publisher’s Note: The statements, opinions and data contained in all publications are solely those of the individual author(s) and contributor(s) and not of MDPI and/or the editor(s). MDPI and/or the editor(s) disclaim responsibility for any injury to people or property resulting from any ideas, methods, instructions or products referred to in the content. |
© 2025 by the authors. Published by MDPI on behalf of the International Institute of Knowledge Innovation and Invention. Licensee MDPI, Basel, Switzerland. This article is an open access article distributed under the terms and conditions of the Creative Commons Attribution (CC BY) license (https://creativecommons.org/licenses/by/4.0/).