1. Introduction
IT solutions that address specific opportunities or problems in the search for process optimization or product improvements, specifically in the industrial and/or business context, represent strategies from which substantial benefits could be obtained in the short term. However, when this approach operates in isolation, they could fall into obsolescence in the long term, due to the absence of interaction or articulation with the software systems of any organization they already have, which they should be completely aligned with. Information as an asset that allows companies to base their decision making on data analysis that could affect not only a problem area, but also the entire organizational system.
To avoid systems isolation, Software Engineering has proposed the construction of architectures that clearly define and identify all its components, and most importantly the deterministic relationship, or cause and effect that emerges among them. Through a Software Architecture, functional and non-functional requirements are fulfilled, resulting in much more global solutions that can be analyzed from different perspectives and action flanks, in order to understand the interaction of each component. Hence, designing and developing an application that supports any business process must result from a global analysis that includes the implementation of the solution, and the communication between the developed solution and the entire system that supports the framework that contains the decision-making process at the organizational level. Given that, in a human talent training process at the corporate level the focus is on the individuals to be trained, and on the dynamics of their collaborative work teams as well; if the process is successful, the training will confer the organization a valuable and novel asset. On the contrary, if the process presents shortcomings, it is pertinent to analyze its causes and learn from the environment in which it was developed to determine the appropriate improvements to the training processes in the company.
Theoretical–practical training is important for many disciplines and professions, such as medical workers, mechanics, technicians, electricians, engineers, sailors, pilots, and firefighters, among others [
1,
2]. Training with AR/VR (Augmented Reality/Virtual Reality) technologies, in contrast to traditional training, can potentially save thousands of dollars per employee, improve employee experience and build a competitive employer brand [
3]. From the synergistic perspective between academia and business, the interaction with the user can not only become one of the most relevant challenges of AR, but it would also bring closer and connect the advances and results of academic research with the industrial/business sector; a combination that would give robustness to the technological applicability in these scenarios. Given the relevance of AR [
3,
4,
5,
6] it is important to know how industry, articulated with academia, could implement this technology in an adequate way. According to Masood and Egger [
7], a key element for companies to adopt AR is to identify which characteristics influence the proper use of this technology and how efficiency in processes as a means can improve the user experience (UX) [
8] as an end to positively impact the context in question through usability [
9].
The success of technology adoption in a sector depends not only on technological factors but also on human factors [
10]. Successful implementation requires clarity on the most important variables for using this technology [
11]. The authors Cardoso and Zorzal [
12] conducted a literature review of papers published between January 2012 and April 2018 looking for applications of AR in industry. Within the 65 applications found, three target areas were identified: (A) activity instructions (71%), (B) data visualization (20%) and (C) assembly simulations (9%). As the instructional area represents the most significant amount of workflow, it proves the importance of training in the industrial sector.
Thus, since the development of AR and VR technologies, industry has tried to integrate them into training programs, because their nature (semi-immersive and immersive, respectively) can improve the engagement and performance level of participants. However, the effectiveness of these isolated systems has not been regularly evaluated with accuracy, which motivates the objectives of this research. This leads to the necessity of implementing a comprehensive model that allows for the elaboration of a thorough post-training analysis, to identify the strengths and shortcomings that should be contemplated by systems that seek to ensure success in training processes in industrial training contexts [
13]. Thus, it is relevant not only to analyze the design of an integral solution that includes all the components and relationships inherent to a personnel training process at industrial level, but also to detect and correct “adjustments of gradual adaptation” [
14], in the variables required to achieve the “ideal adjustment between system and context” [
14].
In line with industrial training processes, four areas were identified where conceptual and instrumental contributions could be made were identified. These gaps were:
Body of knowledge of UX quality metrics. AR research focus has been oriented towards the definition and measurement of user experience quality indicators [
15]. However, there is no consensus on which elements should be analyzed when comprehensively evaluating an AR solution.
Evaluation tools for AR applications. There are evaluation works on the use of AR applications, using instruments such as surveys, interviews, experts evaluation, and biometric measurements. In any case, these are external mechanisms to the application that have a high degree of subjectivity.
Industrial evaluation prototypes. No tools were identified that evaluate Augmented Reality applications in industrial contexts, with quantitative techniques or methods integrated to the industrial prototype were identified.
AR applications for industrial training. Another identified aspect is the interest of the industrial sector in training through AR applications. In the works of Randeniya et al., Westerfield et al. and Webel et al. [
13,
16,
17], training with AR applications has resulted in improvements in time (task completion time), and a decrease in the number of errors (error counts).
Current training models are widely used in education. However, their application in the industrial sector is not usual. The investment made by companies in training should be evaluated from a methodological and operational view. It is important to analyze the retention of what the worker has learned, in order to then apply it in the workplace. Through a supervised training process, it is possible to improve performance in the assigned task. Therefore, it is important to measure the impact of training on the worker formation.
Therefore, it is important to define a classification of UX metrics, as well as their description by means of quantitative and qualitative indicators. A classification of this type, in conjunction with AR technology, could provide elements of judgment to carry out training processes supported by quality, which allow improving the competencies and skills required by an employee in an industrial context.
The present research can contribute from two perspectives, which are mentioned below:
Training models: Existing training models do not include training processes for augmented reality applications. This research seeks to propose a training process for workers with AR applications adapted to the industrial environment.
Technological development: At the level of implementation of AR applications in industry, there is no evidence of functional prototypes that integrate UX measurements in the application. This study will deliver a functional prototype for operation in the industrial context.
Through this research, an architectural solution is proposed that allows for the integration of the conceptual components of the metrics and the instrumental mechanisms of prototypes and applications that cohesively support industrial training processes and that allow evaluating the architecture application results.
2. Literature Review
The four research areas presented in the Introduction represent an opportunity to develop solutions that add value to the identified gaps. Regarding the areas (1) Body of knowledge of UX quality metrics and (2) Evaluation tools for AR applications, some works address the issue of measuring the characteristics of AR applications. These studies can be divided into two approaches: the performance and capability of the technologies employed, and the capability of people to adapt to the technology and use it appropriately. The studies that describe how user experience can be measured in augmented reality applications do not present unification in the characteristics to be measured, nor in how they do it, implying that multiple metrics are found according to the area of study [
15].
For example, in the work of Wang and Lv [
18], they identify the key areas for AR application development using the DELPHI-AHP method through five first-level indicators and 20 s-level indicators are identified. This method is tested and verified with six model visualization applications, which helped to identify that the most important first-level indicators affecting user experience are the functionality of a system and its visualization. However, in this work the area of AR application is limited, and its indicators are rare compared to what recent literature on the subject presents.
The work of Satti et al. [
19] proposes the User Experience Measurement Index (UXMI). This indicator is calculated using different evaluation methods when testing the MAR Madness application. This work is significant in the use of combined methods of UX evaluation, but it is limited only to augmented reality mobile applications. Therefore, although these studies are important in the knowledge area of this article, they do not present an organization of UX quality attributes in augmented reality applications that would serve as an input for developers or researchers who want to focus their research on a specific functionality or context of use.
In Norshahila Ibrahim et al. [
20], an evaluation of an Augmented Reality Dictionary to Improve English Vocabulary was presented. The authors identified a problem in primary and secondary schools in Malaysia when students must work in English, especially for students coming from Kelantan, where they have their own dialect to communicate with each other. To minimize the problems in working in English, the authors developed an AR mobile application that can look up the meaning of Kelantan’s dialect in English, improving the English vocabulary and evaluating the mobile application’s usability.
Wanting Mao et al. [
21] proposed an Augmented Reality-Based Ergonomic Evaluation Solution for Smart Manufacturing named ARE-Platform. This platform uses AR technology to superpose virtual planning objects into a physical production environment and uses a motion capture system to collect data.
Chun-Ching Chen et al. [
22] described a design and evaluation for improving the lantern culture Learning Experience with AR. The authors work with a cohort of college students to evaluate what they learned about intangible cultural heritage (ICH) by applying different experiments and questionnaires. This research showed that students understood ICH better using digital technology, especially AR.
Pascher Max et al. [
23] proposed AdaptiX, a Transitional XR Framework for Development and Evaluation of Shared Control Applications in Assistive Robotics. AdaptiX is an open-source framework that helps evaluate applications developed in high-resolution simulation environments. The framework is oriented to a simulated robotic arm and can be easily extended to another research.
For the research area (3), Industrial evaluation prototypes, related works evidence the evaluation of UX as an external mechanism to the augmented reality application. The evaluation is performed by questionnaires such as QUIS [
19,
24,
25], UEQ—User Experience Questionnaire [
26,
27] and SUS [
28,
29]. No evidence of UX evaluation integrated to the AR application was found. The research by Xiangyu Zhang et al. [
30], focusing on the context of industrial assembly tasks, in which experts remotely guide local operators with VR and AR instructions, contrasted a “typical MR remote collaboration interface […] (RECI)” (p. 1) with another of “adaptive generation of instructions via context awareness (AGICA)” (p. 1). The use of AGICA, proposed by the researchers, evidenced an increase in the efficiency rates in collaborative work, thanks to the improvements introduced in the experiences experienced by users. For these validations, they used surveys, interviews, video recordings of the processes, and questionnaires. The latter “quantitatively evaluates the task workload” (p. 15) using the NASA Task Load Index (NASA-TLX) tool and also offers an evaluation of the usability and the perception of the users of the total system who used the “System Usability Scale (SUS)” (p. 17). Eswaran, M. et al. [
31], focused on investigating the impact that AR could have had “in terms of upgraded workplace understanding, training, and assisting semi-skilled/new workers in an industrial production environment” (p. 1). The research “involves booster pump assembly of reverse osmosis (RO) system” (p. 9) in a sample of 24 engineering students of different levels of education, who were randomly grouped into three groups. These groups were exposed to three modes of displaying the instructions: instructional documents, Virtual/Desktop Mode, and AR Mapping. The research showed that “the AR-based object mapping approach provides better outcomes than other visualization instruction modes in the assembly environment” (p. 15). The instruments to evaluate the task load implemented surveys and questionnaires from NASA TLX (Eswaran, M. et al. [
31]); the tool was also used in the research of Xiangyu Zhang et al. [
30].
In area (4), AR applications for industrial training, studies show that the use of AR applications can diminish the number of errors in task performance [
13,
16,
17]. AR can maximize worker efficiency and mobility [
32]. These statements are obtained from the reviews of the works of Xiangyu Zhang et al. [
30] and Eswaran, M. et al. [
31], considering that AR evidenced improvements in usability and reduction of errors in the execution its tasks. However, to demonstrate these benefits, it is necessary to carry out workers training processes. The training of workers with AR technology could: (a) reduce costs and execution times of tasks, (b) increase safety levels in the company, reducing risks and preventing damage to equipment and workers [
33,
34] and (c) allow adapting to different learning rates and experiences [
32]. Faccio, M. et al. [
35] focus on the importance of learning in industrial work contexts, where AR plays a key role, unlike traditional training. In tests based on the design of a “motion capture architecture” (p. 36), benefits were evidenced in the implementation of AR in training. These benefits were associated with lower cognitive or mental loads, decreased effort and time in the learning processes, and “a lower tendency to perform errors, resulting in an increment in both productivity and efficiency” ([
35], p. 39).
The works discussed in this section are a representative sample that shows the research interest in studying the metrics that affect training processes at an industrial level to improve production processes, assembly, monitoring, and other lines of work that are feasible in these environments. These applied cases demonstrate that AR is not an isolated technology but works complementary with other technologies such as IoT, artificial intelligence (AI), and smart tutors, among others. However, immersive and semi-immersive experiences in industrial environments could improve performance, the worker’s experience, and the ability to learn the assigned task more quickly and accurately. For this reason, continuing to explore how to improve this type of training is part of a line of work still in force. The literature reviewed does not show an immersive/semi-immersive training process that contemplates the entire structure from the business conception to the implementation of the specific task, overwhelming companies with isolated applications that only focus on a specific activity.
3. Methodology
The research begins with a systematic literature analysis and a review of reports on technological trends described in
Section 1 and
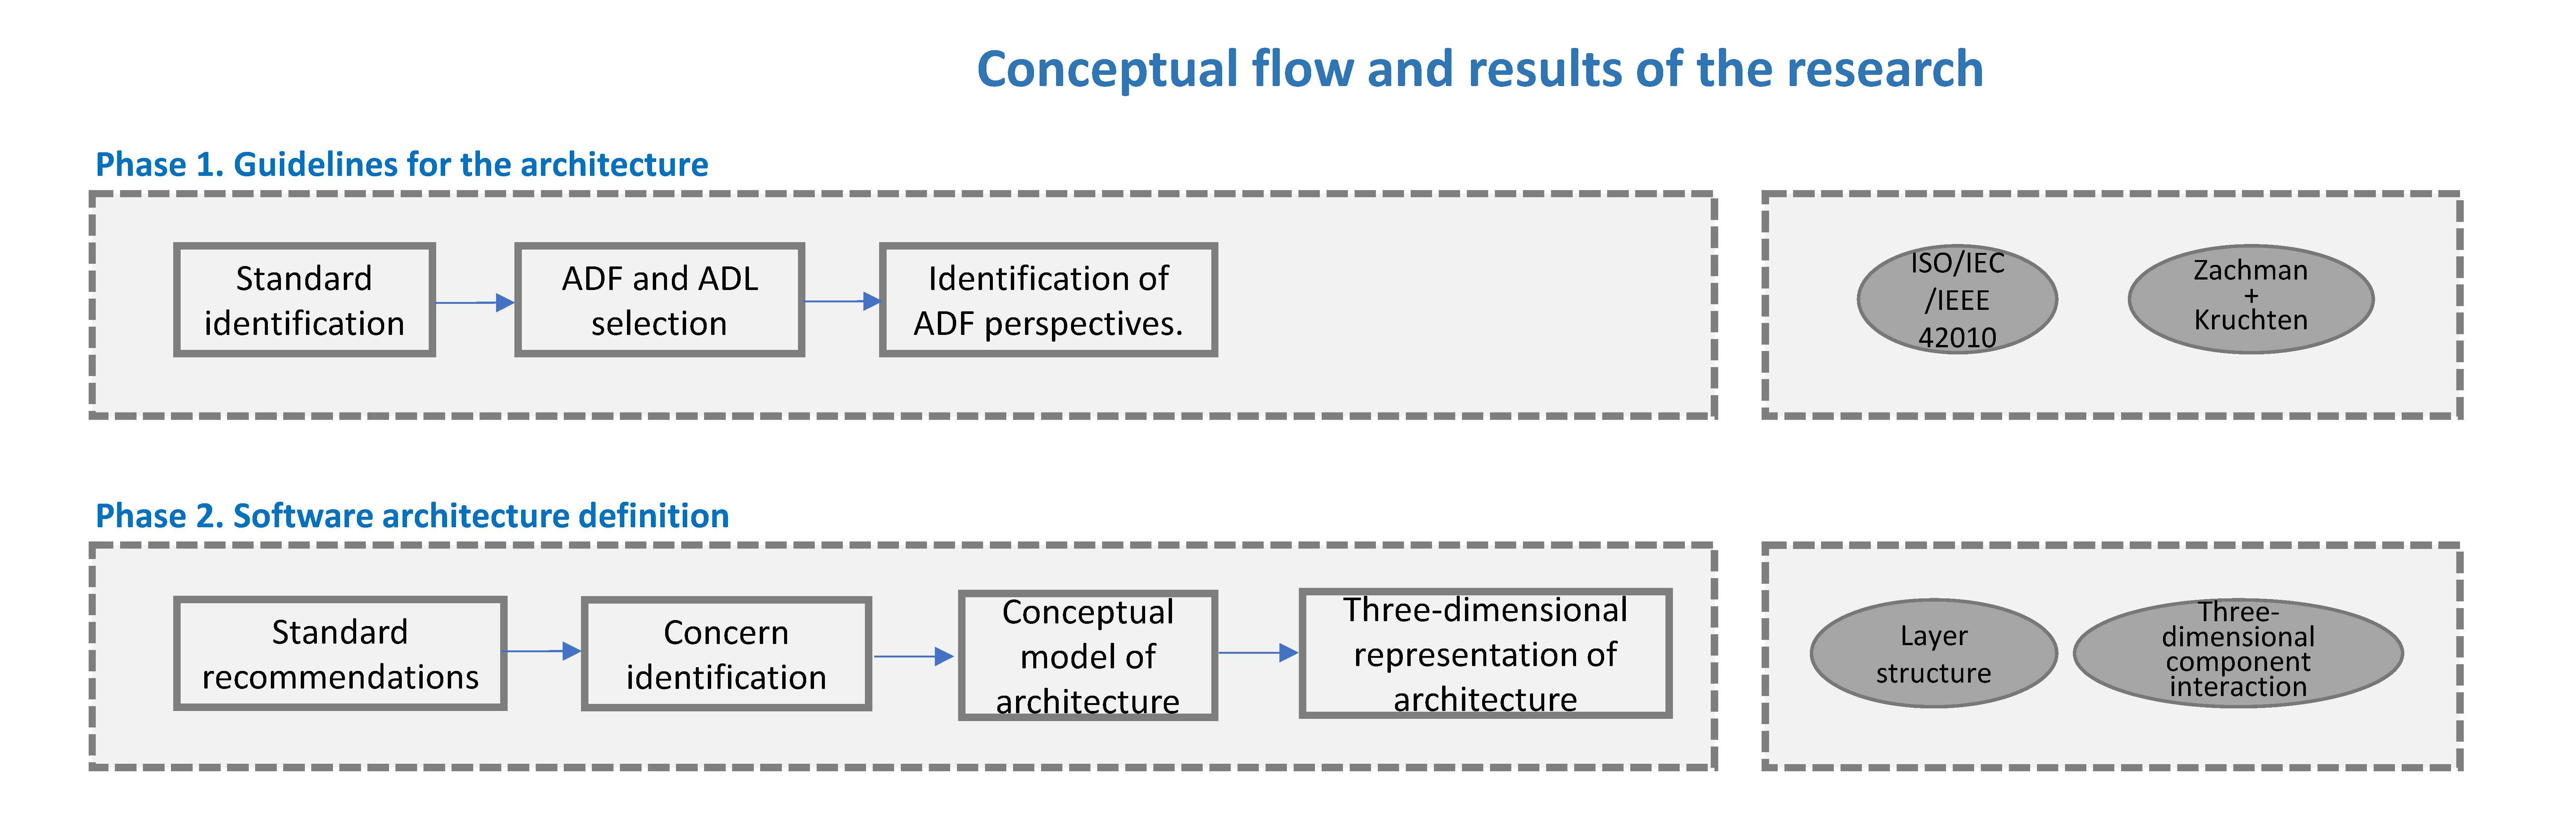
Section 2. Based on these references, research opportunities were identified in constructing a computer architecture to support industrial training processes. The methodology consists of four phases, of which the first phase (
Figure 1) seeks to identify the standard, the framework, and the architectural description language for the construction of the architecture.
In the second phase (
Figure 1), the objective is to define the software architecture from a conceptual point of view and the relationships between the views.
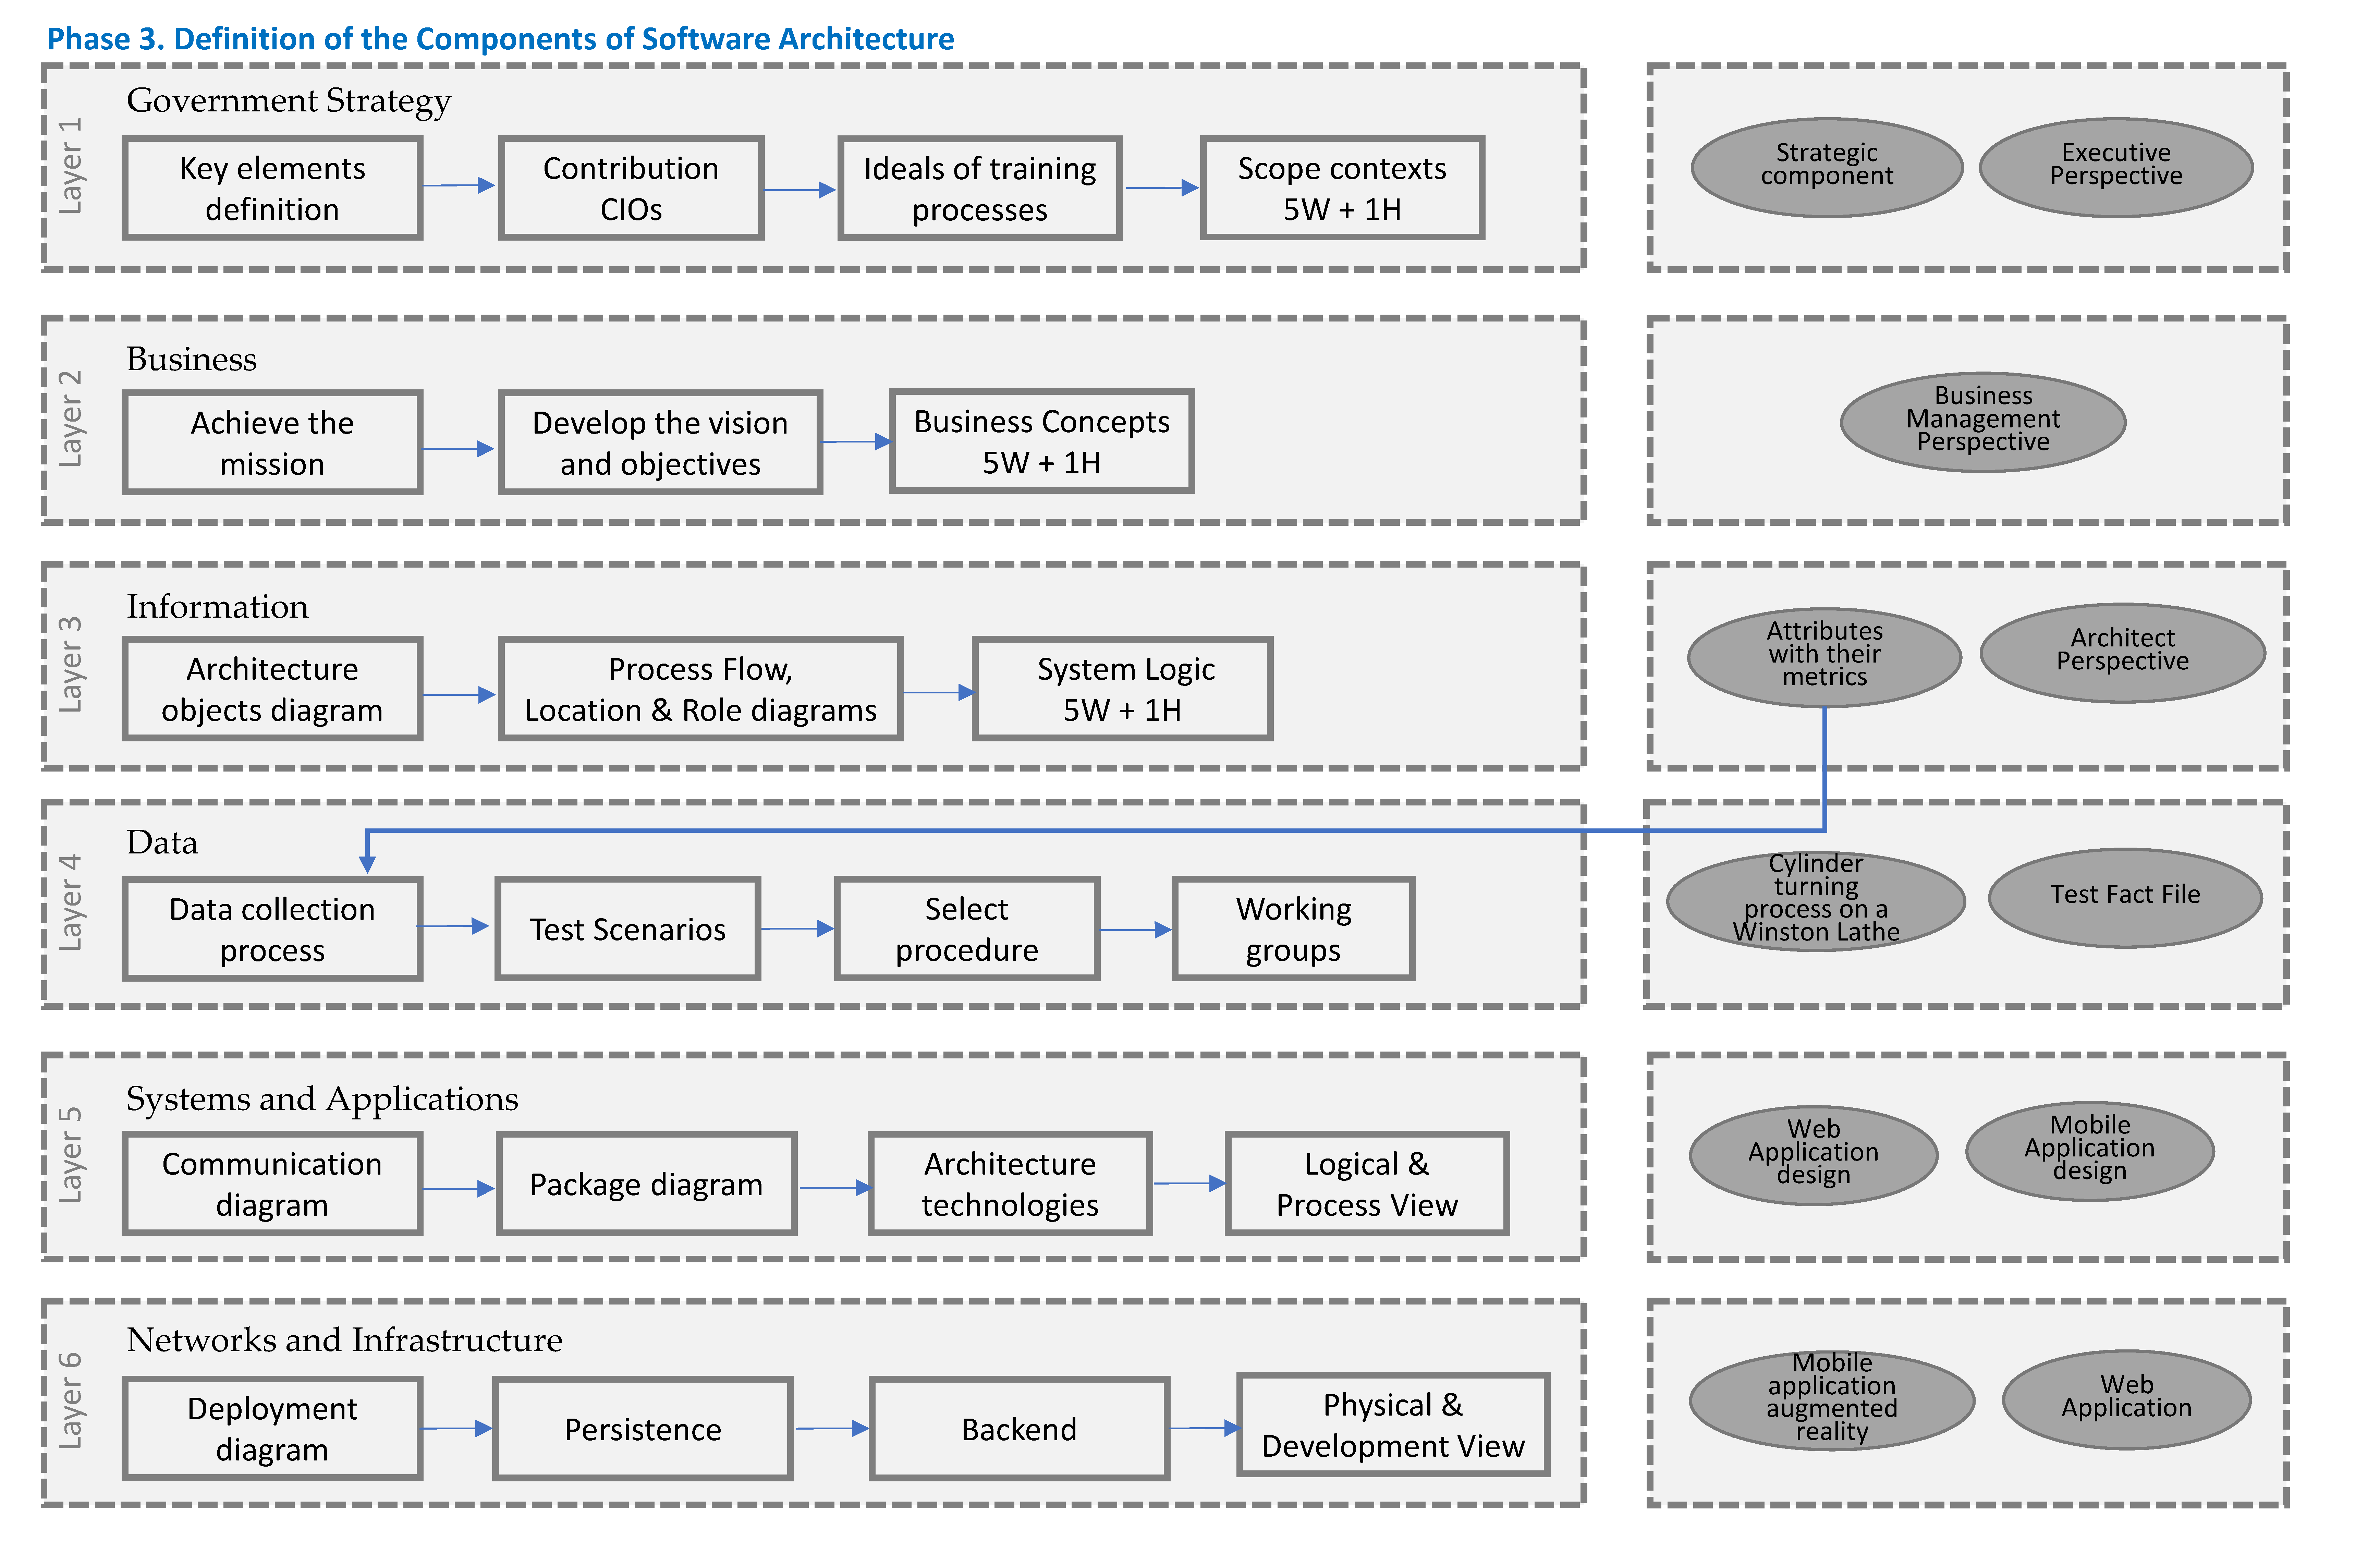
The third phase (
Figure 2) of defining the components of the architecture is the most complex part of the research because, in this phase, each of the layers of the architecture, along with its processes and final products, is built.
The fourth and final phase (
Figure 3) aims to validate the proposed architecture using a software prototype in an industrial environment. The results of the test groups were contrasted using parametric and non-parametric methods.
The following sections describe the steps of the methodological proposal.
3.1. Phase 1. Guidelines for the Architecture
3.1.1. Standard Identification
To conceive, define, express, document and communicate software, system, and business architecture, the use of a standard is required to direct the correct implementation, maintenance, and improvement of the architecture. In this research, the conceptual baseline for the construction of the architecture is the ISO/IEC/IEEE 42010 standard [
36].
The ISO/IEC/IEEE 42010 standard was considered the most appropriate one to build the architecture of this project for reasons such as:
Standardization and consistency: It provides a standardized framework for describing architectures, which ensures consistency in documenting and communicating system and software architectures.
Clear conceptual model: It defines a conceptual model that helps to clarify and structure the fundamental elements of an architecture, including points of view and the architecture views.
Stakeholder focus: It identifies and addresses the stakeholders’ concerns in the system, ensuring that the needs and expectations of everyone involved in it are considered and satisfied.
Flexibility and adaptability: It allows for the use of different languages and frameworks to describe architectures, facilitating their adaptation to different contexts and specific needs.
Improved communication: Standardizing the terminology and concepts improves communication between development teams, stakeholders, and other interested parties, reducing misunderstandings and errors.
Support throughout the lifecycle: It provides guidelines for describing the architecture throughout the entire system lifecycle, from conception to maintenance and evolution.
Although the ISO/IEC/IEEE 42010 standard offers many advantages, it also presents some problems and disadvantages that are important to consider, such as (1) Complexity and cost of implementing and maintaining conformance with the standard. (2) It requires a thorough understanding of the standard concepts and terminology, which can involve a significant learning curve for development teams. (3) Although the standard allows for some flexibility, some organizations may find its guidelines too rigid or unsuitable for their specific needs. (4) The need for detailed and comprehensive documentation can be seen as an administrative burden, especially in agile projects where minimal documentation is preferred. These disadvantages do not necessarily disqualify the use of the standard. However, it is important to keep them in mind and plan how to address them to maximize the benefits of its implementation. For the case of this research these disadvantages did not represent a significant drawback because it had a mature team of researchers in the areas of enterprise software development, augmented reality applications, UX design, and experience in CMMi quality processes.
3.1.2. Correlation Between ADFs and ISO/IEC/IEEE 42010 Standard
This standard specifies the requirements for the structure and expression of an architectural description (hereinafter AD) for several entities, including software, systems, enterprises, systems of systems, families of systems, products (goods or services), product lines, service lines, technologies, and business domains [
36].
The ISO/IEC/IEEE 42010 standard describes the requirements for the use of architectural concepts and their relationships as expressed in an AD. It also specifies the requirements for an architecture description framework (ADF), an architecture description language (ADL), architectural viewpoints, and model types to support the development and use of an AD.
According to ISO/IEC/IEEE 42010, for the proper implementation of an architecture, an ADF must be selected to respond to the Stakeholders’ concerns.
The list of ADFs presented in this research is from Annex F of the ISO/IEC/IEEE 42010 standard [
36].
Table 1 shows the details of the ADFs and their compliance with each one of the requirements that according to the standard they should have.
Table 1 qualitatively describes the fulfillment of the requirements, that is, if the requirement is not met, meaning partially described or fully met. In order to identify which are the most complete ADFs, a quantitative assessment scale is proposed to transform the matrix in
Table 1:
- ▪
Value 0, if the requirement is not met.
- ▪
Value 0.5, if the requirement is partially met.
- ▪
Value 1, if the requirement is fully met.
The implementation of the scale in
Table 1 can be described as follows. For example, for the Zachman ADF, the first requirement, “Information identifying the ADF” in the standard indicates “Yes” meaning that requirement is fully met and is replaced by the value of 1. The same happens with the requirements “Stakeholder identification” and “Stakeholder perspectives” that will be replaced in the quantitative matrix by 1. In the case of the requirements “Concern identification”, “Architecture Viewpoint”, “Model kinds”, “Legends and correspondence methods” and “Framework methods”, as the requirement is partially fulfilled, the criterion of using half the scale value 0.5 is applied. In the case of the specifications that are “No”, it is understood that this characteristic is not addressed in the ADF, and 0 is placed. All those specifications different from these parameters are assumed as clarifications and that the requirement is present, as is the case of “Aspects” that appear in the matrix as Called “interrogatives”; for this typology, a value of 1 is placed. This assessment is performed for each ADF, and the values presented in
Table 2 are obtained.
The ADFs with the highest scores are GERA and ArchiMate. However, no ADF meets all the requirements.
3.1.3. ADF and ADL Selected for the New Architecture
According to the matrix in
Table 1, no ADF meets 100% of the requirements described by the ISO/IEC/IEEE 42010 standard. Therefore, a comparison between the ADFs in
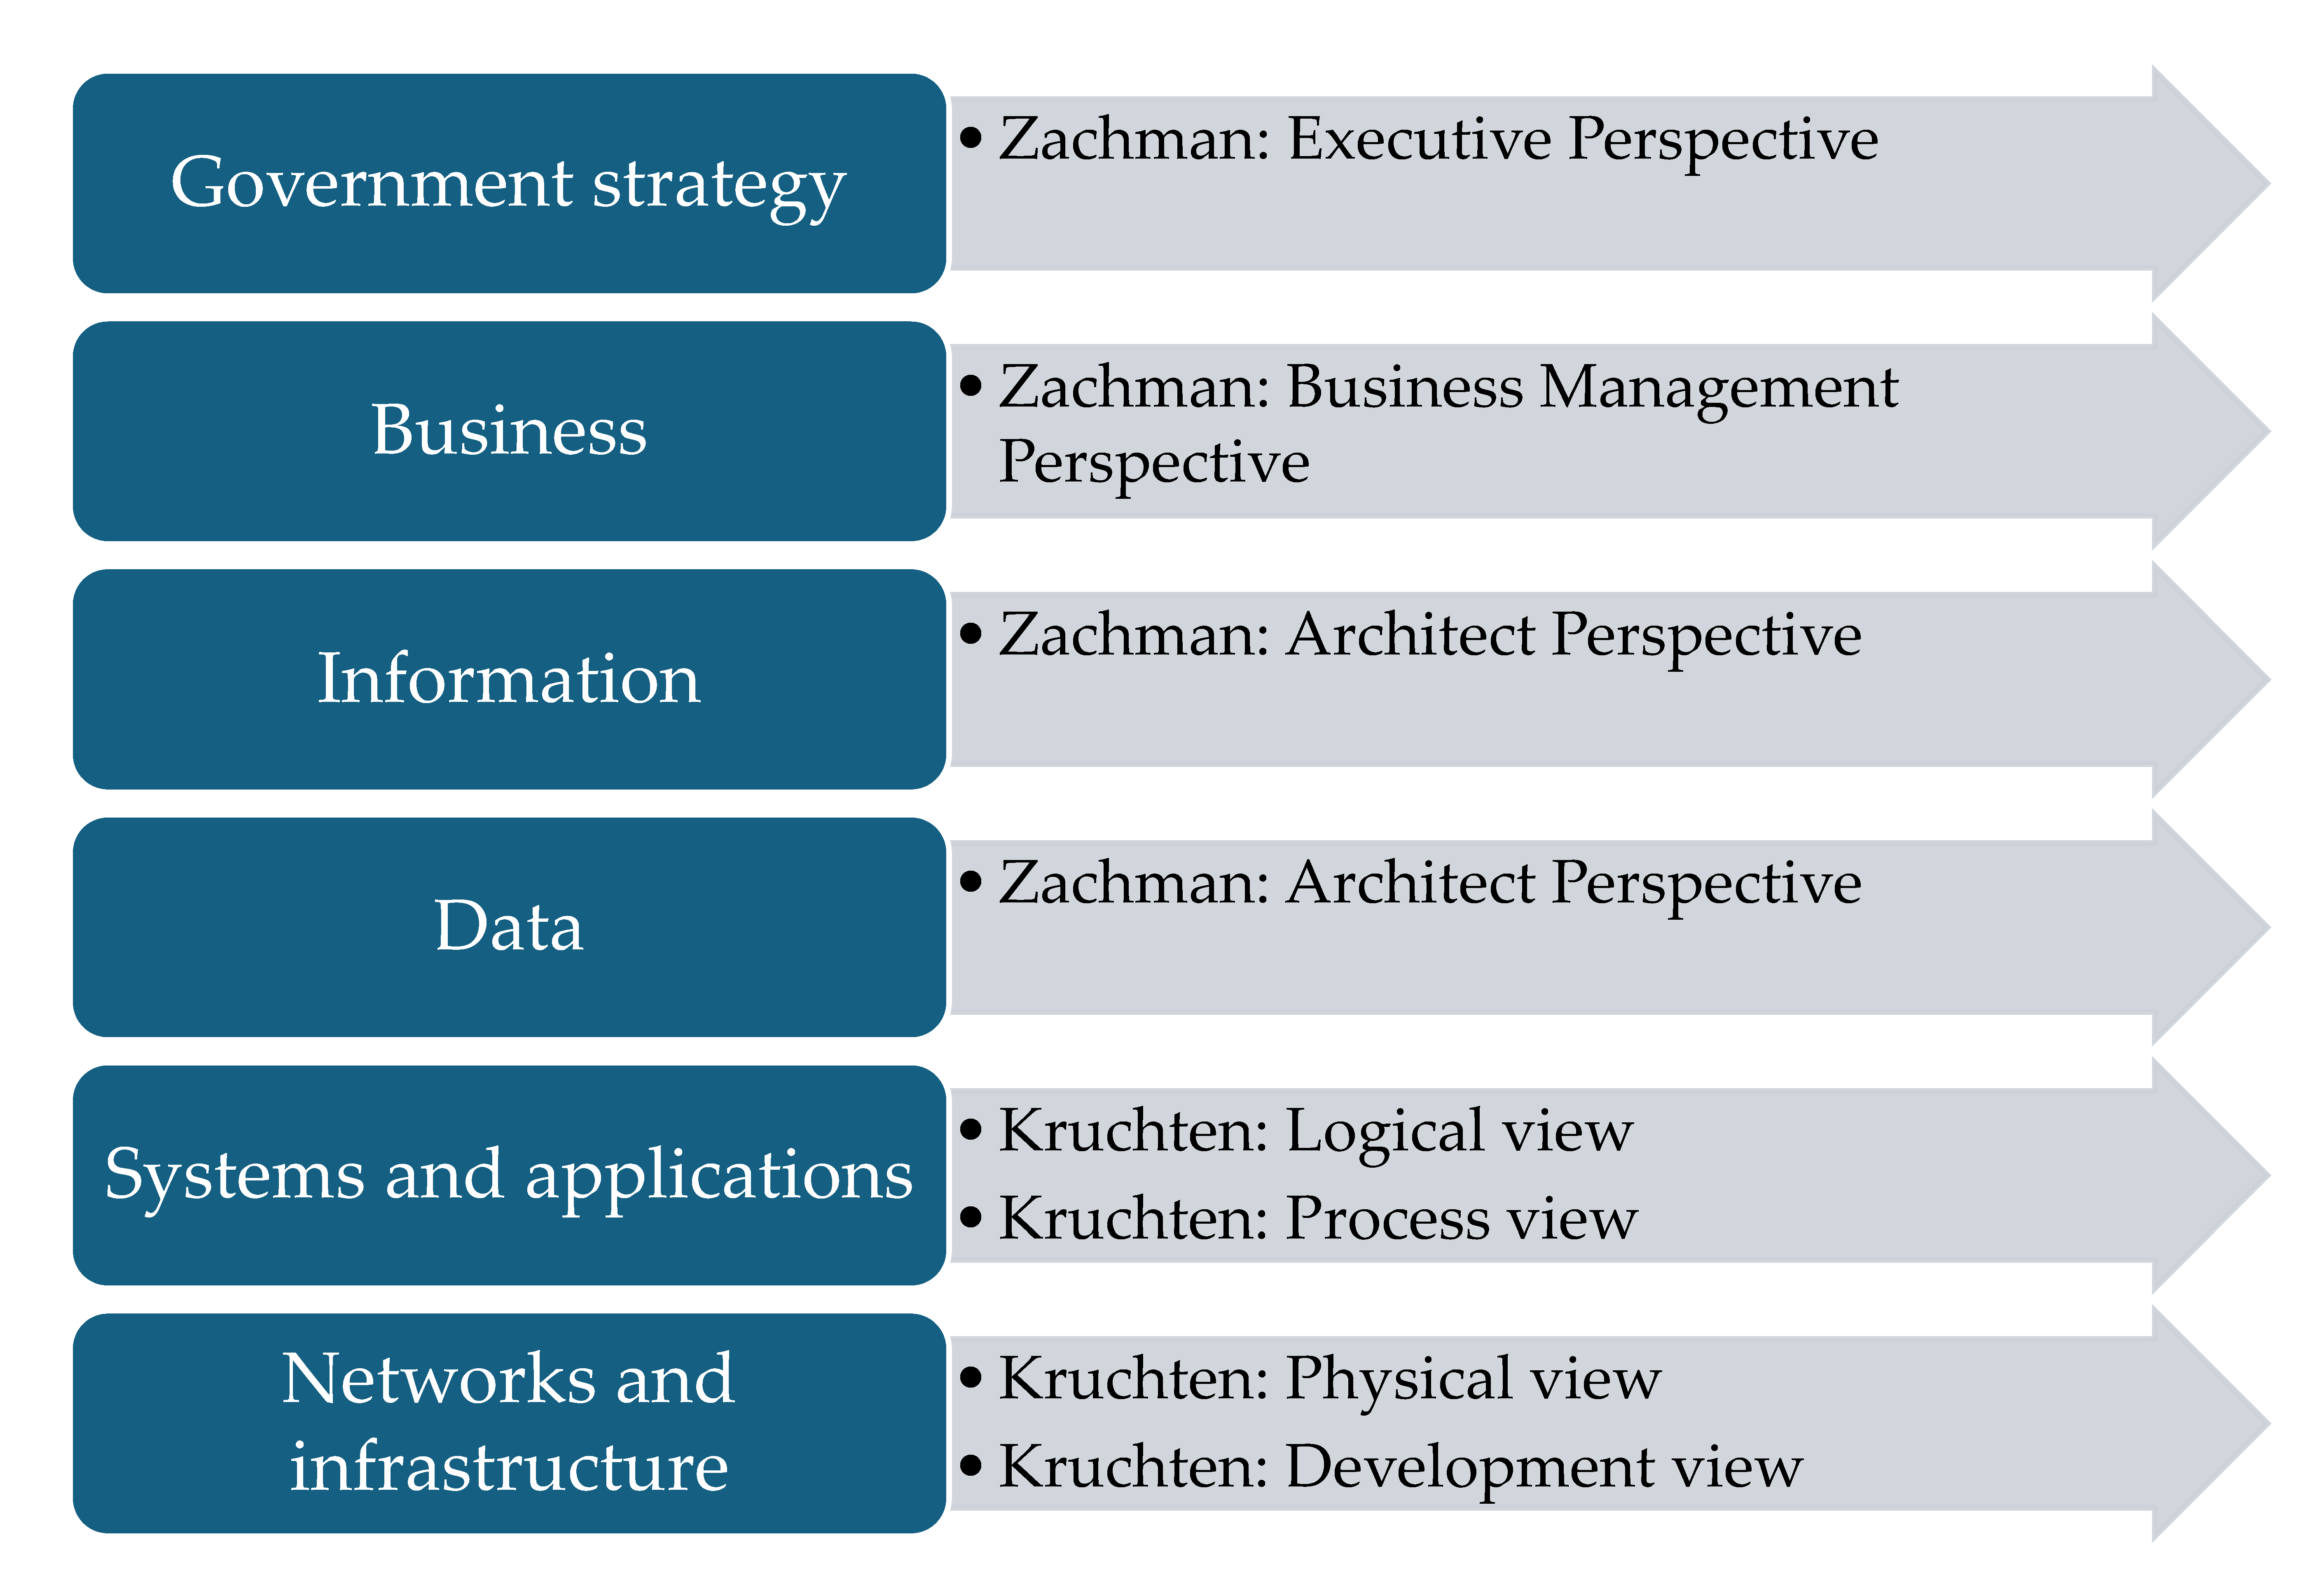
Table 1 was made to identify which combination of ADF would be the best in order to cover all the requirements described in the standard. After this analysis, it was concluded that the best combination of ADFs is Zachman [
37] plus Kruchten [
38], because both meet all the ISO/IEC/IEEE 42010 standard requirements.
Given that the selected ADF for the new architecture is the combination between Zachman Framework and the proposal of views by Kruchten, the opportunity to use UML (Unified Modeling Language) within the construction of the new architecture is evidenced, being UML the facto standard mainly used by software developers.
3.1.4. Identification of ADF Perspectives
The ISO/IEC/IEEE 42010 standard does not require the use of a specific ADF or ADL, allowing the architect to select the tools to propose its architecture based on the particular characteristics of the problem and experience. A hybrid model between the Zachman Framework and the views by Kruchten was proposed for the architecture design.
Figure 4 describes the proposed solution for this architecture.
3.2. Phase 2. Software Architecture Definition
For the construction of the architecture of this research, the recommendations of the ISO/IEC/IEEE 42010 standard were followed, which consists of (1) Identifying all interested parties that have an interest in the system. This includes end users, developers, and administrators, among others; (2) Establishing the system’s functional and non-functional objectives and requirements; (3) Selecting the architecture viewpoints to be used to describe the system. They are conventions for the construction, interpretation, and use of architecture views, such as Logical View, Physical View, Development View, Process View, and Implementation View; (4) Developing the architecture views based on the selected viewpoints. Each view should provide a specific perspective of the system relevant to the stakeholders; (5) Using specific languages to describe the architectures formally and accurately. These languages help to standardize the description and facilitate communication between stakeholders; (6) Documenting all views and ensuring that they are understandable to all stakeholders. Effective communication is crucial to ensure that all stakeholders understand the system architecture; and (7) Reviewing and validating the architecture with stakeholders to evidence compliance with established requirements and objectives.
For the design proposal, the works Validation of a Developed Enterprise Architecture Framework for Digitalisation of Smart Cities: a Mixed-Mode Approach [
39], An augmented reality system for operator training in the footwear sector [
40], A reference architecture for satellite control systems [
41], Architecture and Design Patterns for Distributed, Scalable Augmented Reality and Wearable Technology Systems [
42] and the FDIC Enterprise Architecture Framework [
43] were used as a baseline. From the analysis of these works, information was extracted about the layers they used and their importance in each developed architecture.
In
Section 4 the new proposed architecture will describe the design and implementation of the architecture generated in this research.
3.3. Phase 3. Definition of the Components of Software Architecture
In this phase, the key elements were established to build the layers of the architecture to respond to the concerns of the stakeholders. It also defined how these layers could communicate with each other to achieve a flow of information between them. Likewise, the inputs, processes, and outputs of each layer were proposed, considering the selected ADF and ADL. The following sections present the conceptual details of each layer of the proposed architecture.
3.3.1. Layer 1—Government Strategy
This layer is oriented towards value generation, defining strategies and guidelines for the implementation and deployment of the technological architecture.
The consolidation of an information technology architecture must have the support not only at the organizational levels, but also from the contribution of the “CIOs—Chief Information Officers” that is essential for the success of its integration into the organization. The results of the instrument applied to a group of 10 people who were in charge of directing the training and/or formation processes in the test companies of this research are presented below. The purpose of the designed instrument was to collect relevant information for the architecture construction, which would indicate what fundamental elements would be expected by the actors directly involved in industrial training processes.
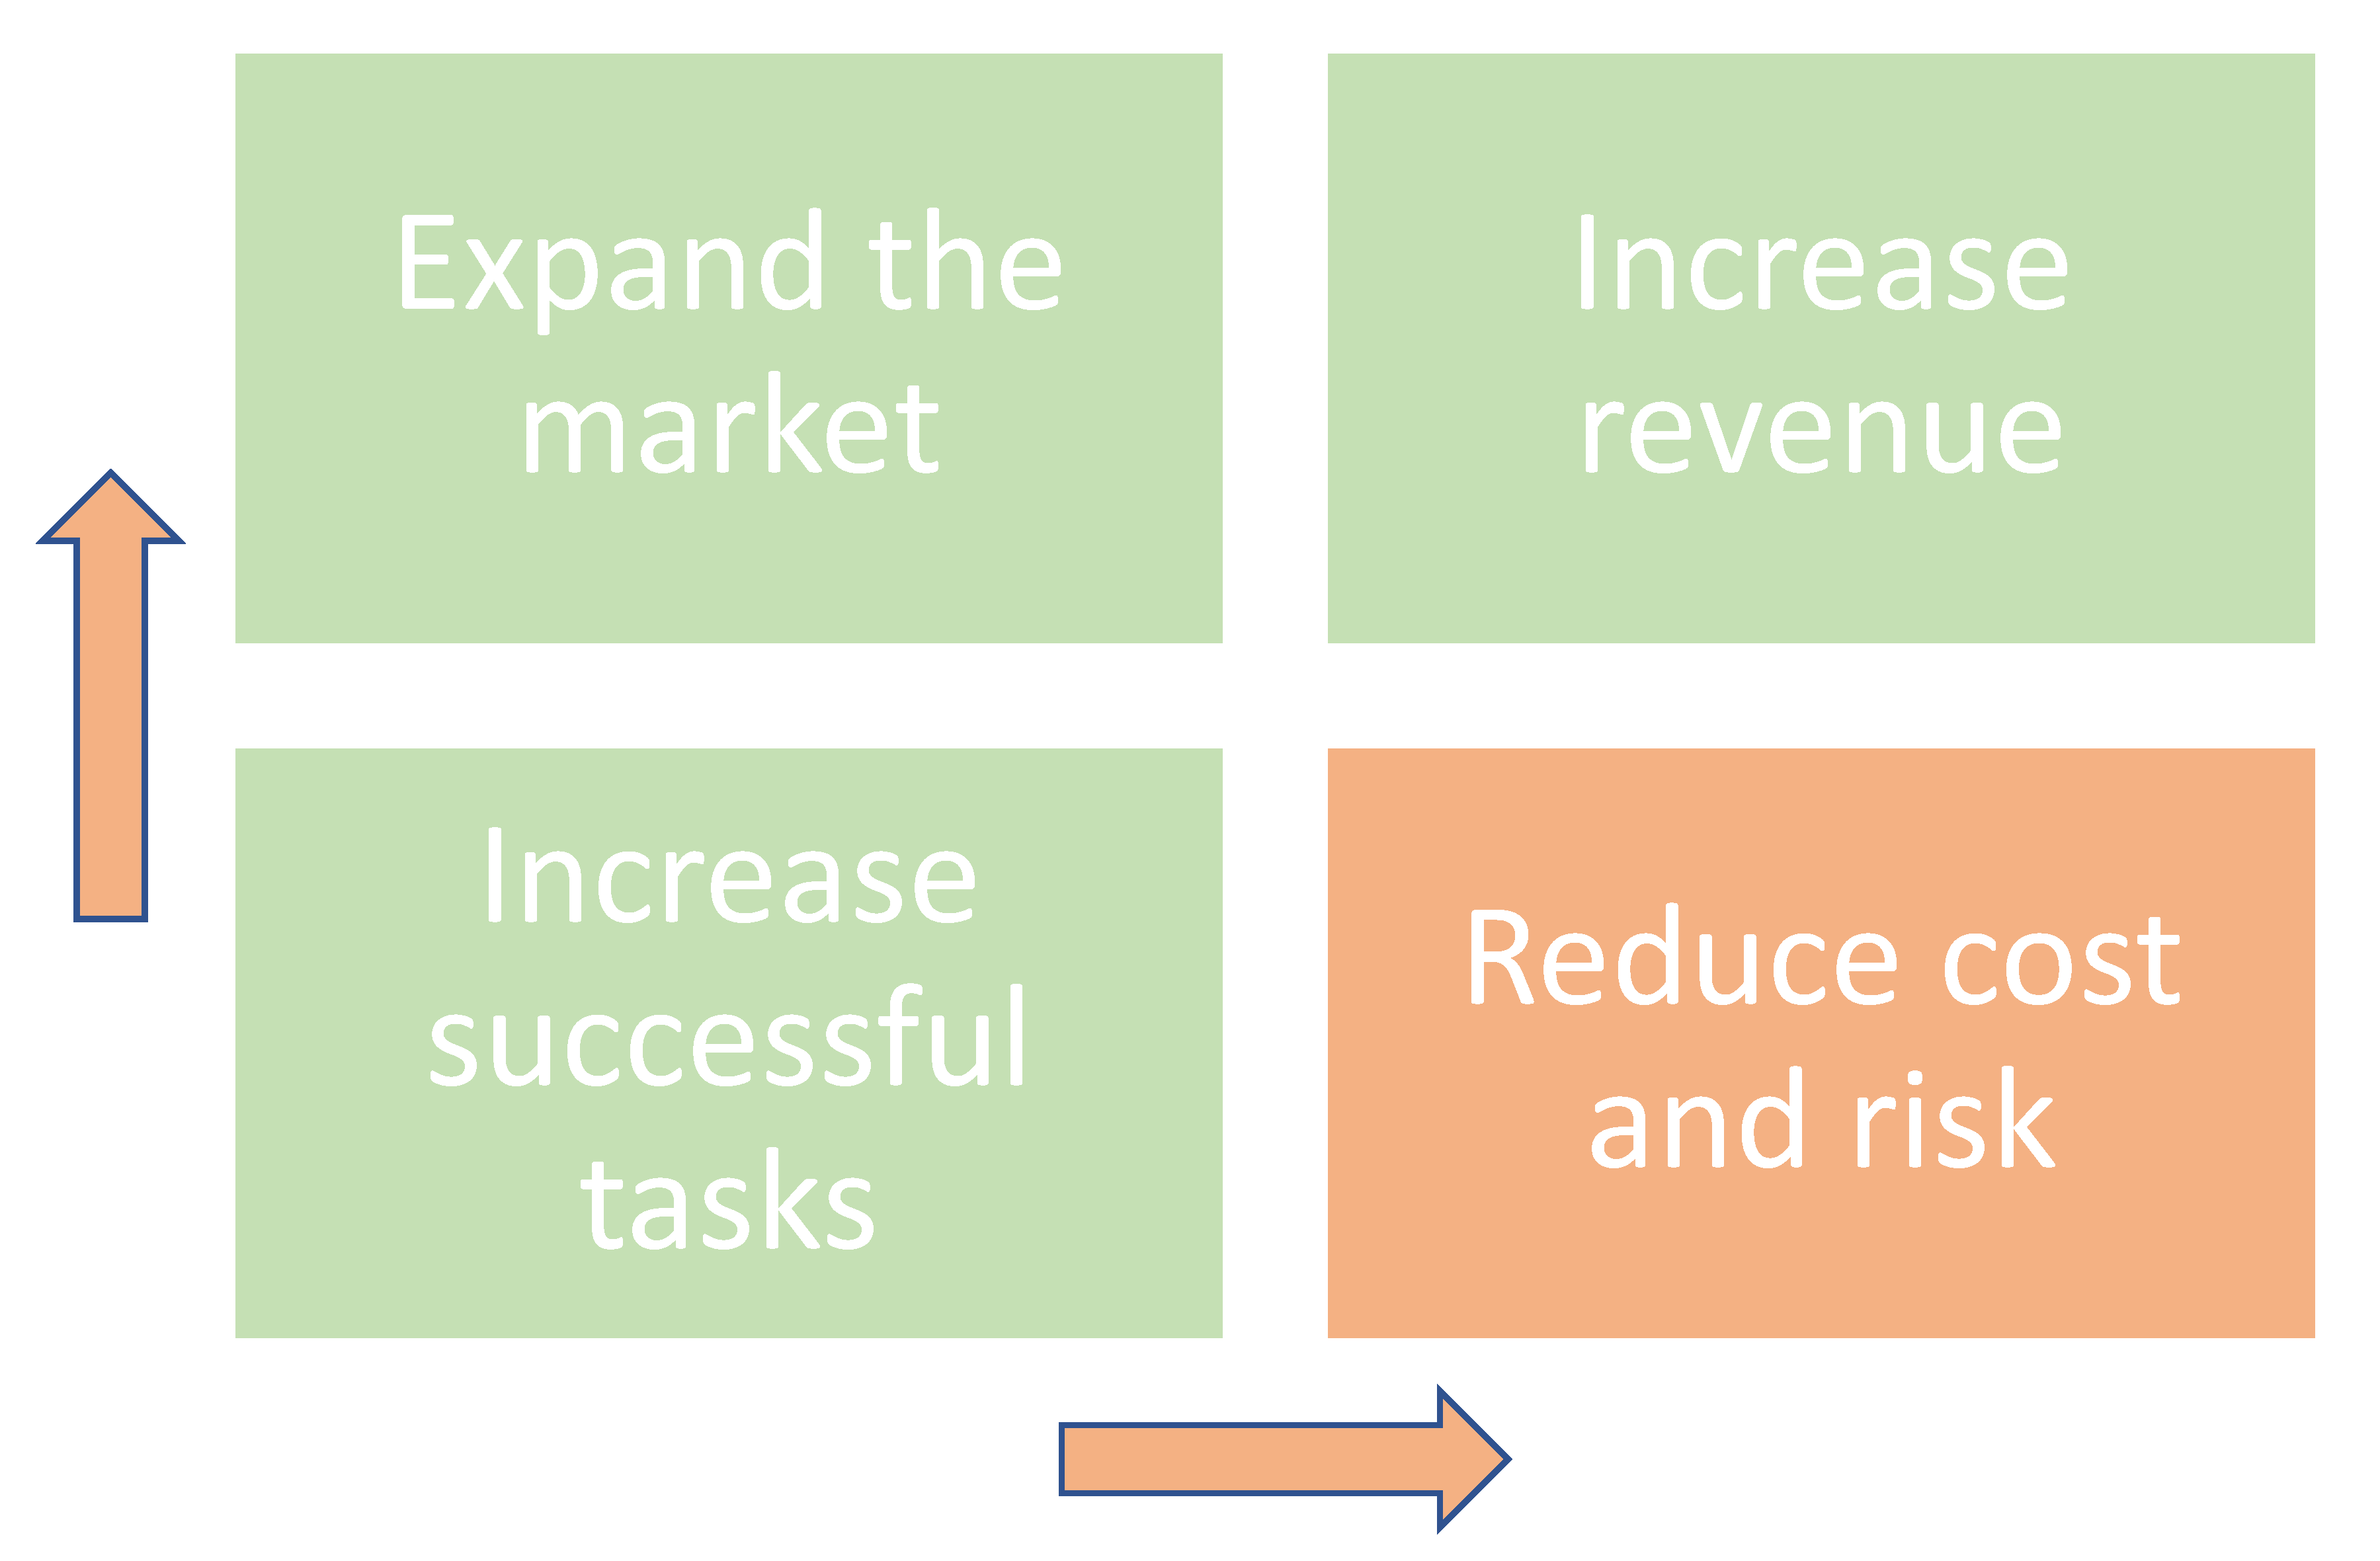
After analyzing the results, the best ranked benefits were improving task completion times, reducing the number of errors, maximizing worker efficiency, and preventing equipment damage.
Figure 5 presents the ideals pursued by CIOs of companies that participate in training processes.
Based on the goals described in
Figure 5, the strategic component of the architecture is proposed.
Strategic Component
Mission: This architecture focuses on evaluating workers’ training processes to identify the characteristics that require adjustments and thus improve the training of human talent that operates machines. It is aimed at companies that carry out processes with expensive and/or specialized machinery.
Vision: This new architecture will have a common use in companies of the industrial sector and will remain in force for the following five years because it will be an agnostic computer architecture.
Goals:
- ▪
Prevent errors by 10%.
- ▪
Retention of the task to be implemented at a higher percentage than when performing it with traditional training.
- ▪
Prevent accidents by 5%.
- ▪
Efficient use of materials and supplies.
- ▪
Reduction in machinery maintenance.
3.3.2. Layer 2—Business
Activities and processes are carried out to achieve the mission and to develop the vision and objectives. Zachman’s Business Management Perspective was used to implement this layer. In this perspective, the conceptual model of the business is proposed, and the models are built from the vision of the owners or direct participants of the company. Zachman’s six questions—What, How, Where, Who, When, and Why—were worked on. In
Section 4.2 describe each of the questions from this perspective.
3.3.3. Layer 3—Information
Activities carried out to generate information from the business areas. Zachman Architect Perspective was used to implement this layer. This perspective presents how the system will meet the information requirements. Technical aspects of the solution or restrictions that must be considered in the software development layer are not included. Zachman’s six questions—What, How, Where, Who, When, and Why—are also answered in this layer.
3.3.4. Layer 4—Data
The raw material is stored, processed, and refined to generate information. The proposed architecture divides the data layer of an enterprise architecture into two: information and data layers. This division allows the proposed architecture to be reused in other development contexts by changing the business logic in the information layer and the way in which data is obtained in the data layer.
Figure 6 presents the process defined in the Information layer to carry out training and specifies the exact point where the data will be extracted with the assistance of the Systems and Application layer through technological platforms.
Test Scenarios
The data extraction process begins with the definition of the environment. In this research, the study scenario is constituted by industrial training processes. Therefore, it is necessary to define the test scenarios, including the type of machine, task, related processes, and involved actors.
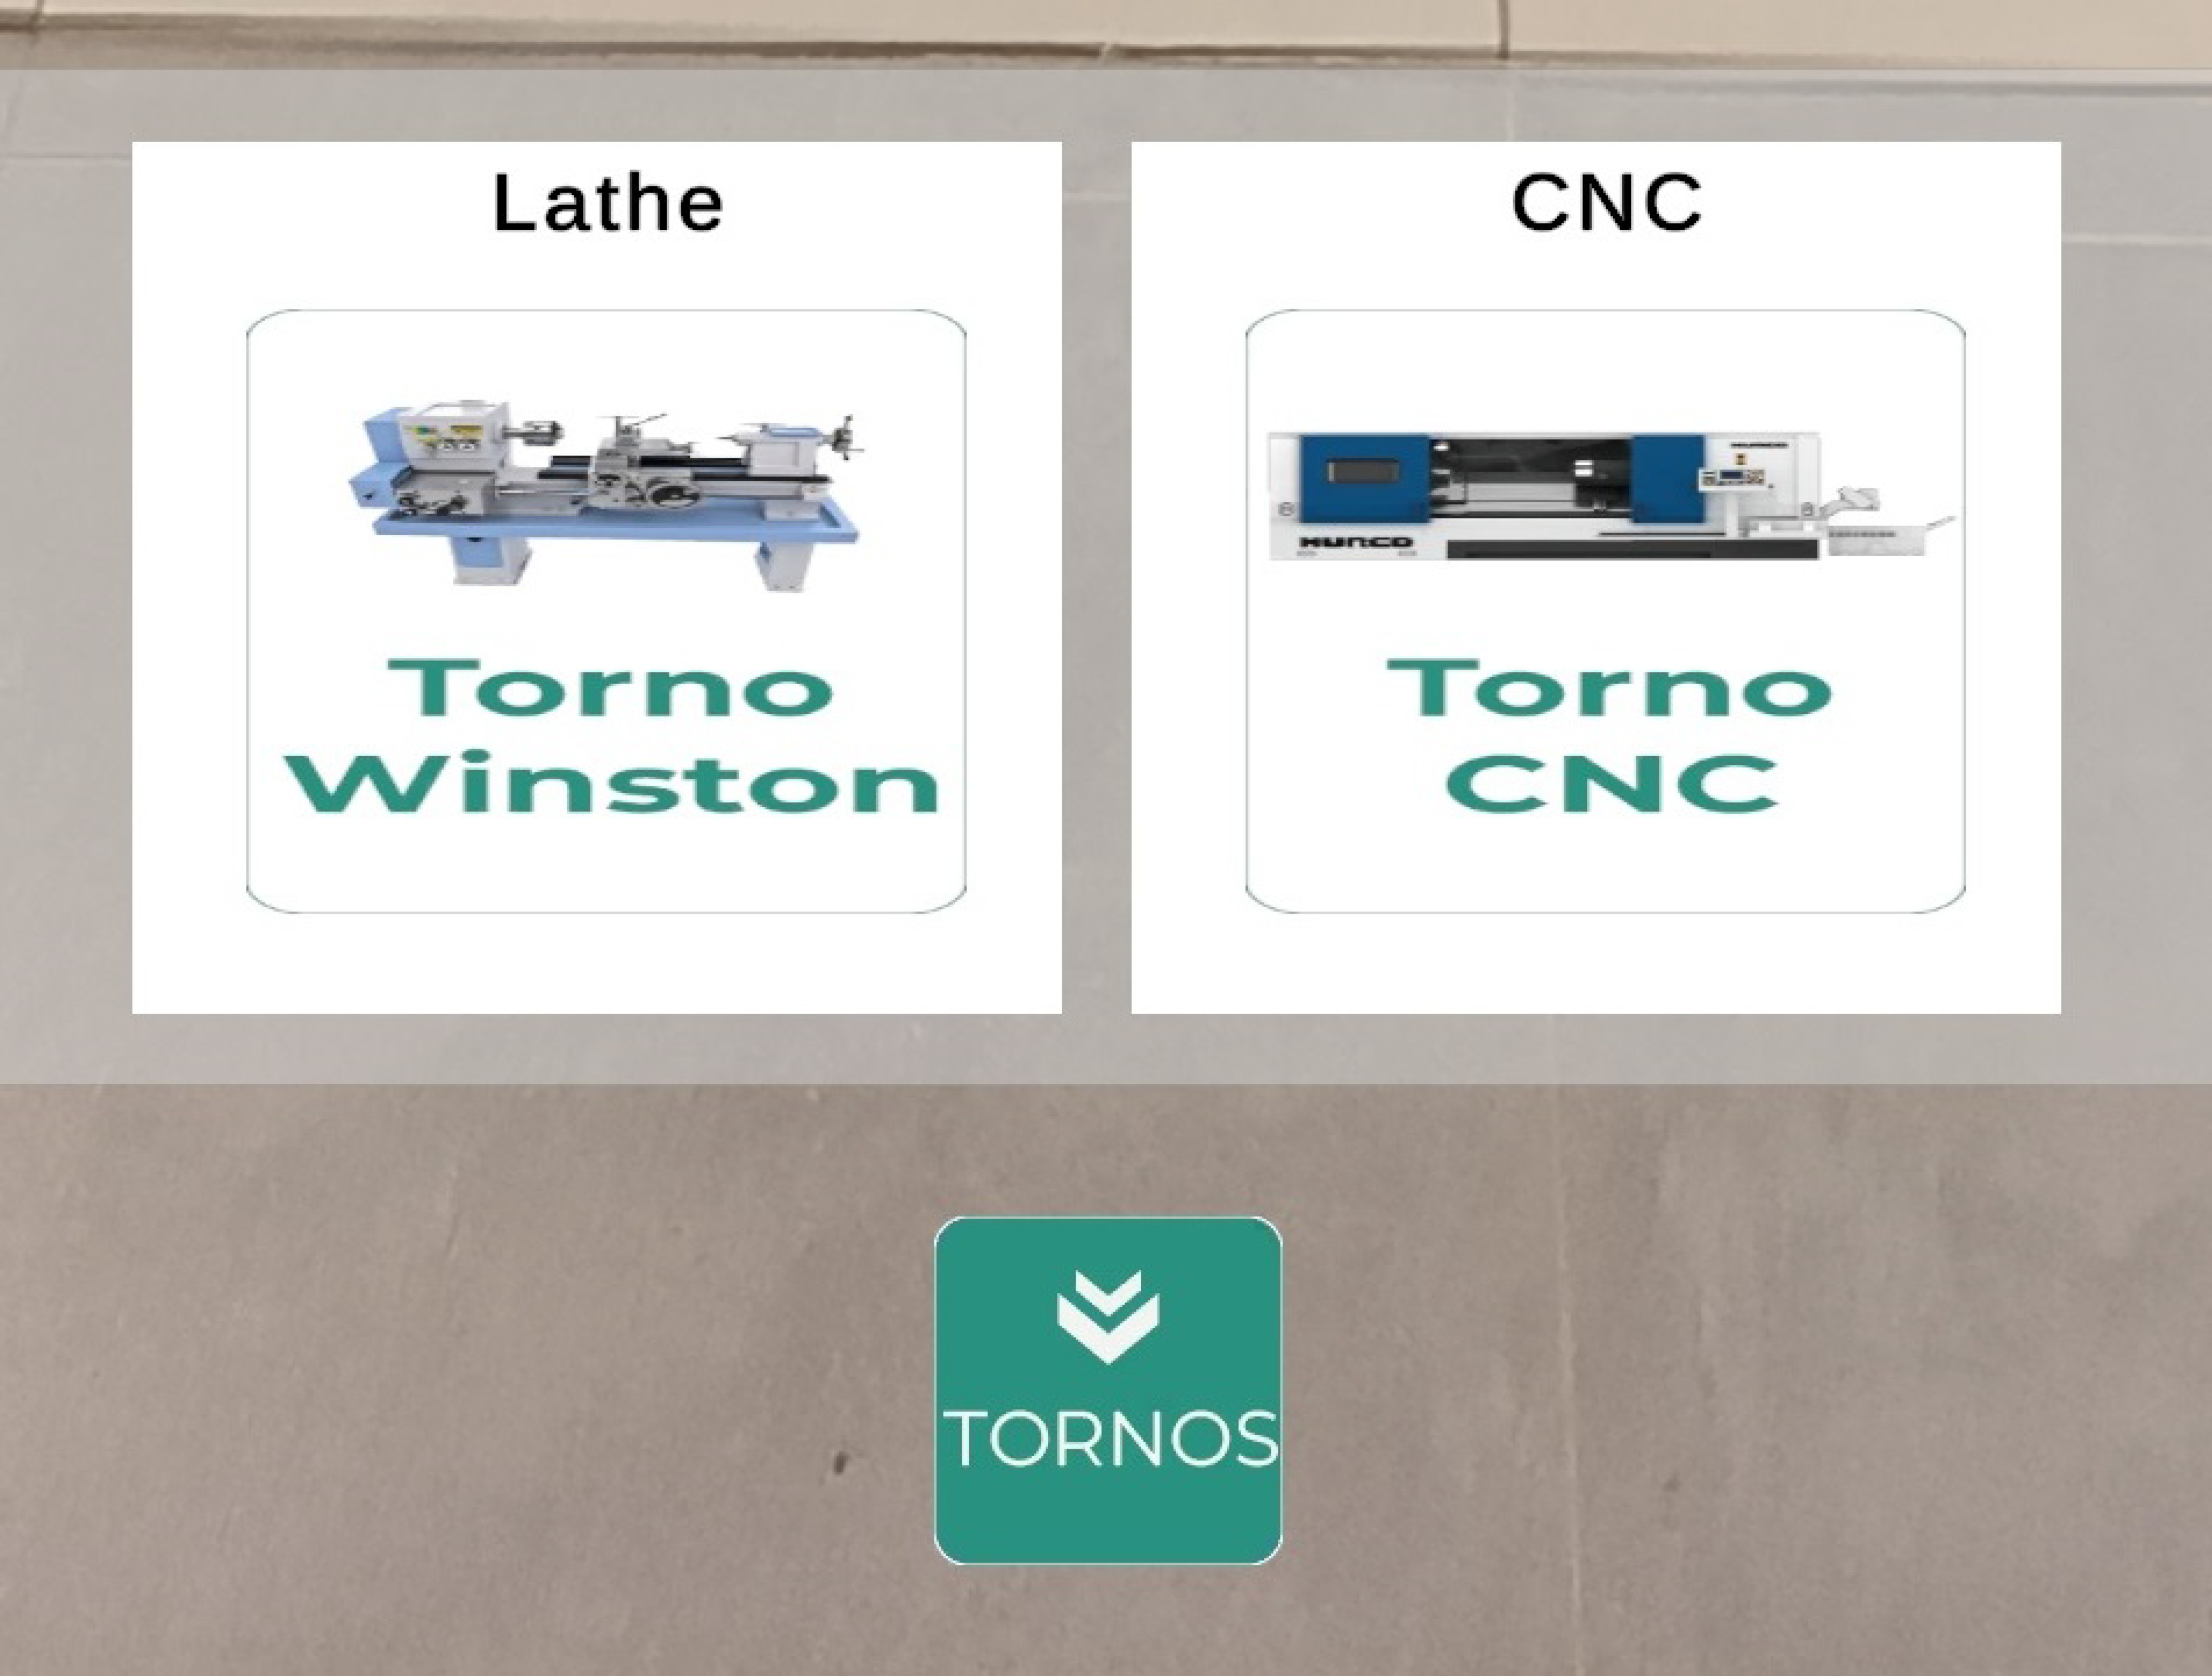
The types of machines analyzed in this research are:
- ▪
The Winston Parallel Lathe is a high-precision mechanical lathe, whose name is due to its design, which has a bed parallel to the rotation axis. In addition to its capability to perform the turning process, this lathe can perform other processes such as threading, taper turning, and drilling.
- ▪
CNC lathes are Computer Numerical Control (CNC) machines. These can automate processing and quickly adapt to production changes. In this context, CNC lathes have become an essential tool for the mass production of high-precision parts.
Table 3 describes the specific uses and parts that can be manufactured with the lathes according to the scenario type.
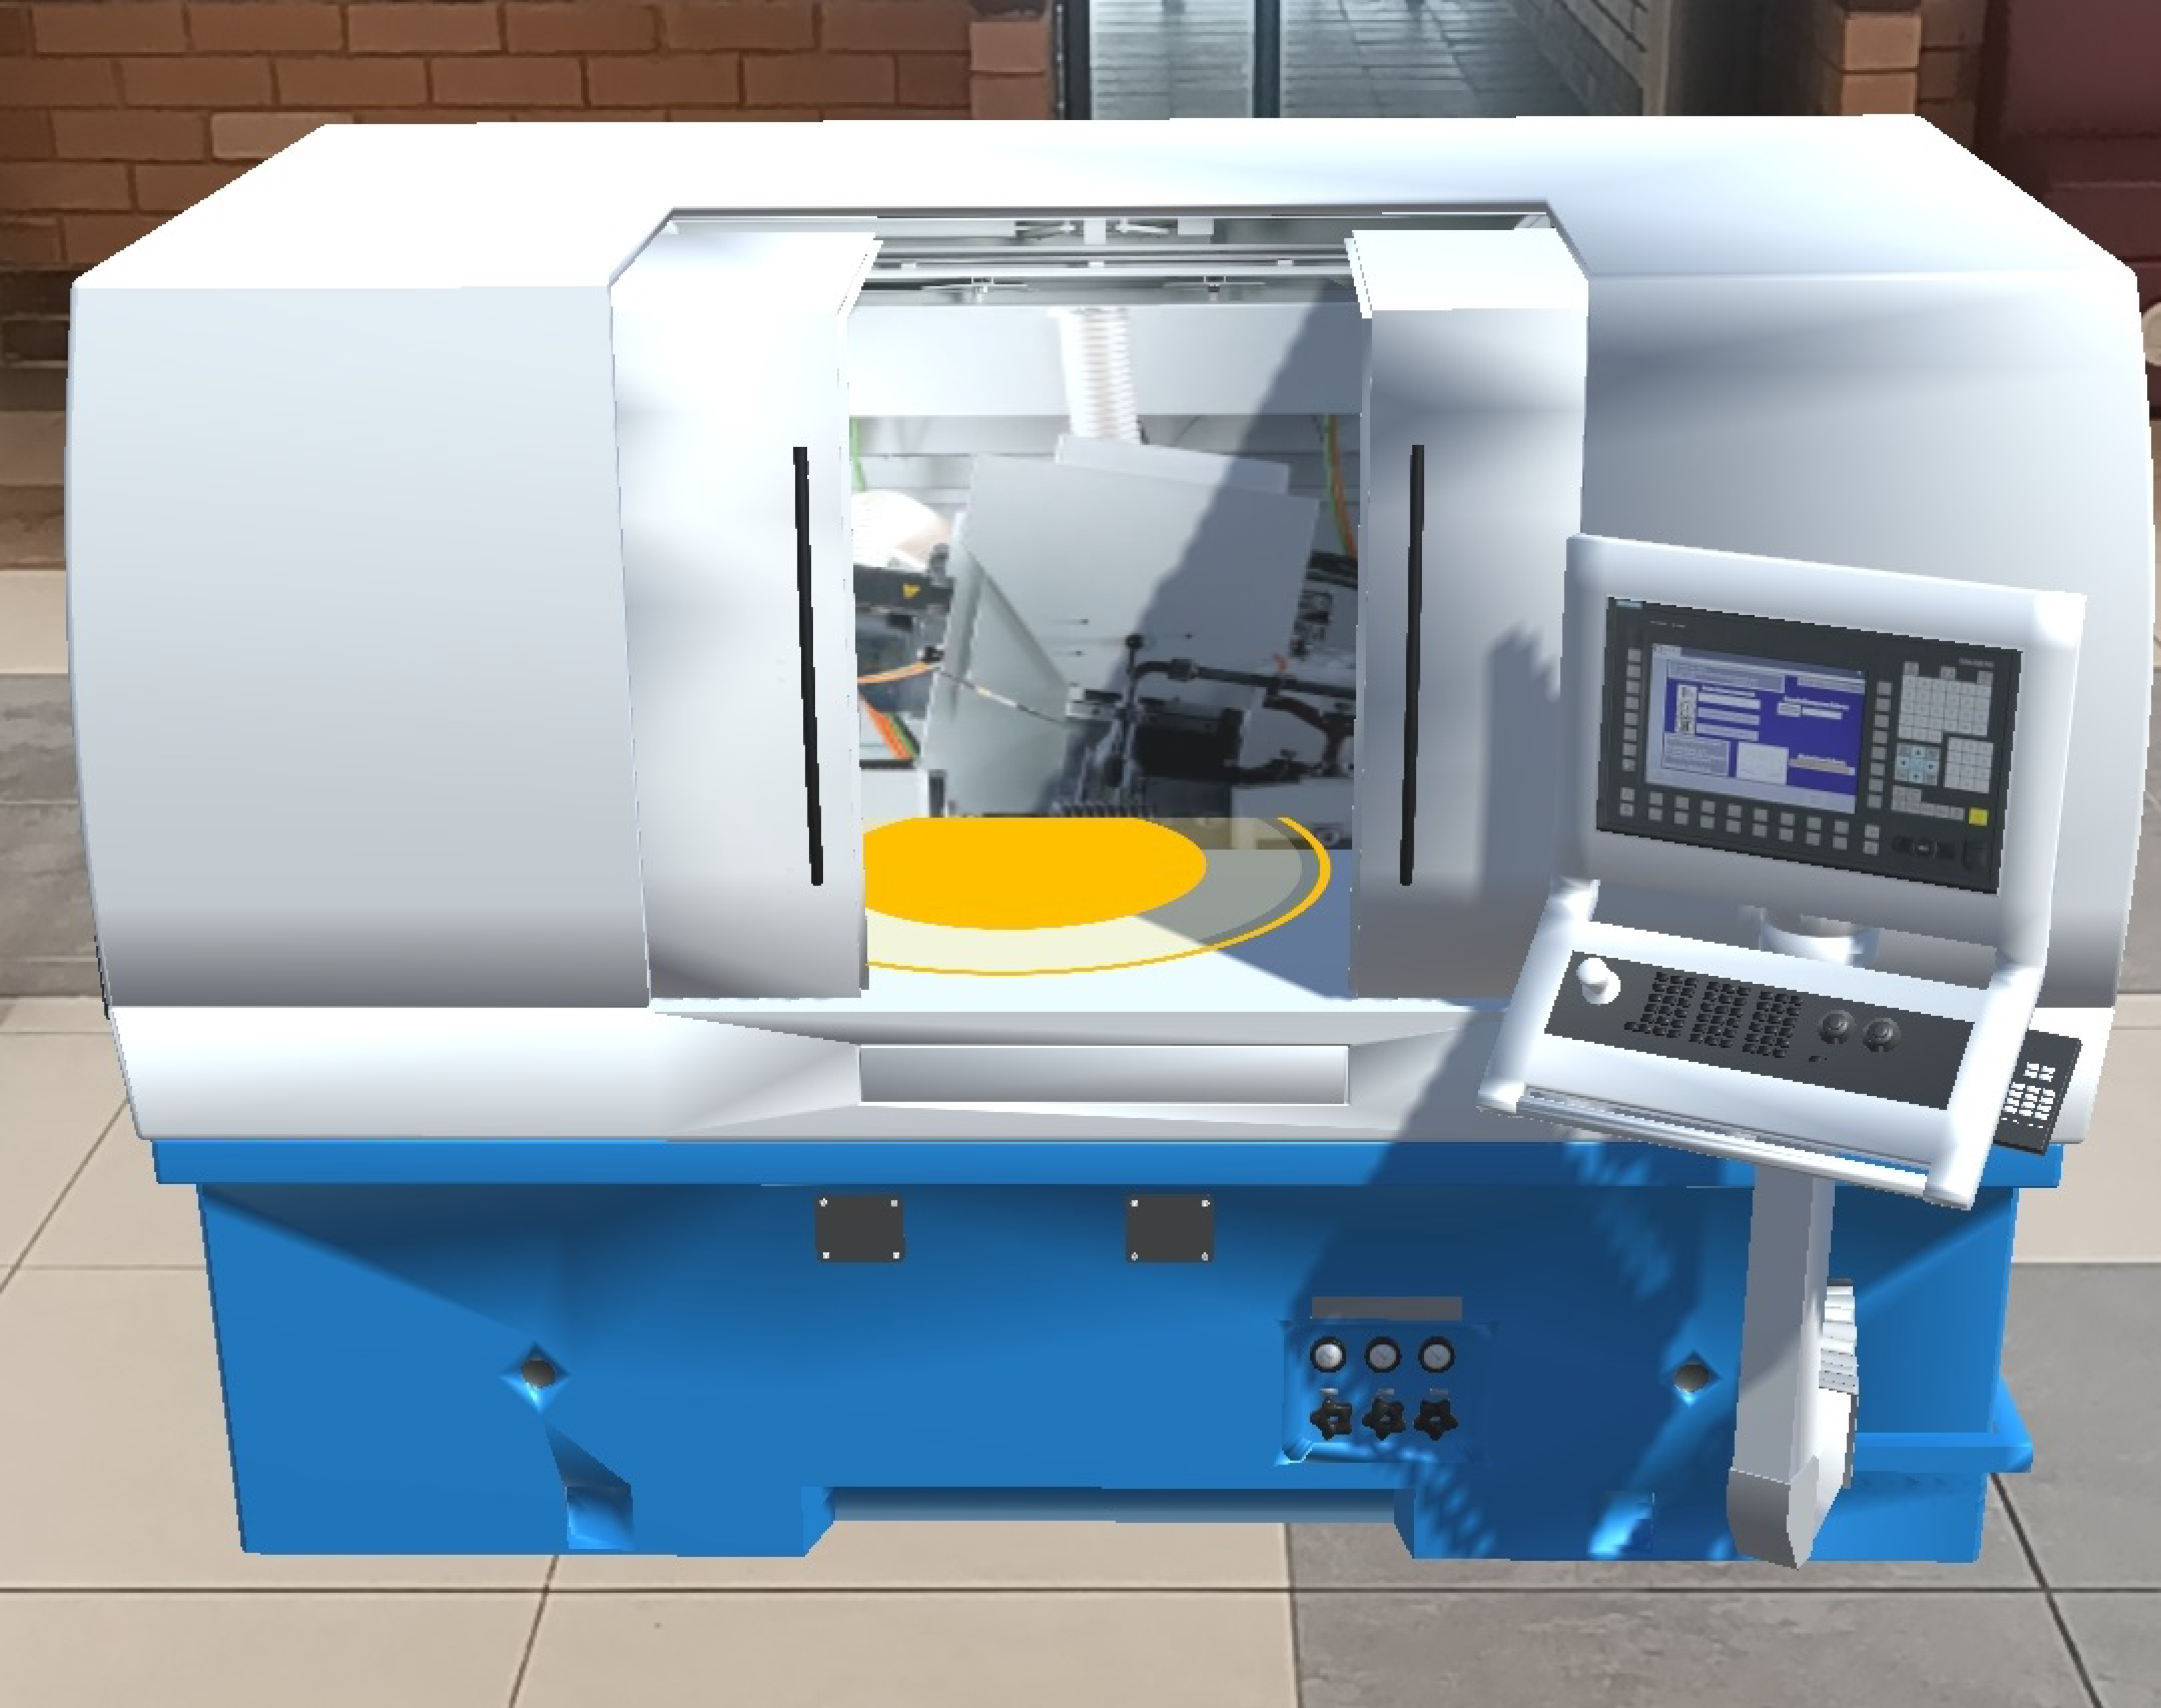
Figure 7 presents a model of the Winston lathe. Manual handling of the parallel lathe carriages requires highly qualified professionals to avoid errors in the geometry of the turned parts.
For the testing phase with those interested in the training processes, two groups of people were selected for work. The first group (control group) corresponded to workers who learned to operate the machines with traditional training, that is, by transferring information from one person to another or reading a manual. The second group (experimental group) were students in the area of mechanics who, according to their study plan, had to learn to manipulate lathe-type machines and received training with the application.
Table 4 presents the technical sheet of the tests carried out.
3.3.5. Layer 5—Systems and Applications
This layer involves software systems offered as services that deliver information to the business areas. For the implementation of this layer, the Deployment and Process views of the Kruchten 4 + 1 model were used.
According to Kruchten’s model, the Systems and Applications layer comprises two distinct categories of interested parties: developers and integrators. This implies that the views used to support the construction of this architecture layer are the development or deployment view and process view. In order to give greater clarity to the layer definition it is possible to include the type of communication diagram that belongs to the logical view proposed by Kruchten.
The objective when using this ADF is not to exhaustively define the types of diagrams and views to be built, on the contrary, it is to articulate the work done with Zachman up to this point with the support of the views proposed by Kruchten.
3.3.6. Layer 6—Networks and Infrastructure
This layer comprises technology for processing platforms, applications, data and information. It has a direct correlation with the physical view proposed by Kruchten. Its representation is through deployment diagrams.
The new proposed architecture manages three containers at the server level [
44]. The first container corresponds to persistence, for which the PostgreSQL database manager was used. The second container corresponds to the application’s backend, which directly interacts with the persistence container. The third container refers to the web platform that allows the data collected by the mobile application to be presented. Two applications are used to access the three containers: a mobile application that supports training with augmented reality and a web browser that allows users to access the information registered on the platform.
Figure 8 presents the deployment diagram of the proposed architecture.
As mentioned in
Section 3.1., according to the ISO/IEC 42010 standard, a computer architecture must meet 10 requirements. The proposed architecture complies with these guidelines by using two ADFs and one ADL.
3.4. Phase 4. Architecture Validation
As presented in
Section 1, computer architecture is widely used in industry and academia. The validation process of the architecture proposed in this article was carried out through the built software prototype, using statistical inference techniques. Due to the nature of the data and the fact that it was used with two independent populations or groups, tests were carried out with: a parametric method by contrast of hypotheses; the type of hypothesis test was difference in means for independent samples with two populations and data were analyzed with non-parametric methods.
In the hypothesis test by difference in means for independent samples with two populations there are three assumptions that must be met.
- ▪
Assumption of independence: Each of the individuals who participated in the tests are independent; they are not related to the tests, and they have participated in them only once.
- ▪
Assumption of normality: The obtained samples must have a significance level > 0.05; therefore, data normality is assumed with that value.
- ▪
Assumption of homoscedasticity: It is reviewed using the Levene Test [
45].
Ho: The two samples mean do not differ significantly.
H1: The two samples mean differ significantly.
4. New Architecture Proposed
The new IT architecture proposal for industrial training using Augmented Reality (AR) integrated concepts and practices of reference architectures and it was oriented according to the identified needs. The architecture components were developed based on best practices and standards. Security measures were integrated in all layers of architecture. Finally, the architecture was reviewed and validated to ensure that it met the objectives and requirements of the stakeholders.
Thus, in compliance with the standard, the proposed architecture included issues related to governance strategies, strategic guidelines, aspects related to information management, data, technologies to be used and the entire environment related to training processes in industrial environments.
The solution architecture developed in this research is made up of six layers: (1) Government strategy, (2) Business, (3) Information, (4) Data, (5) Systems and Application, and (6) Networks and Infrastructure.
Figure 9 presents a vision of the architecture with a cohesive layer structure where each layer can communicate with its adjacent layer. This way, it is possible to navigate from the core of the architecture to the strategic layer or communicate the business objectives from a strategic layer to the core, traversing each architecture layer.
A three-dimensional view of the architecture is shown in
Figure 10. This representation shows internal elements and details of the technical layers.
In the proposed architecture (
Figure 9 and
Figure 10), each component has a specific responsibility, and they communicate adjacently to fulfill their responsibilities. The DAO (Data Access Object) component oversees the managing persistence, establishing connections and SQL queries to interact with the database. This component works independently of the programming language and uses ORM (Object Relational Mapper) technology to map objects to database tables. The controller and entity components interact with DAO to manipulate the data that the user wants to process. Specifically, the controllers manage HTTP requests and coordinate their responses, receiving the requests through a routing component located in the middleware. This middleware component is where the Backend endpoints are defined. Here, the URLs are mapped to the corresponding controllers, and the HTTP requests are passed to receive the responses and send them to the client.
Web and mobile applications act as the user interface. They are organized at the module and subcomponent level and allow users to request HTTP to the Backend using RESTFUL APIs. Finally, the component that defines the business strategy provides guidelines and business rules for all the services and components of the architecture. Each component communicates in a structured and defined way, ensuring that each one fulfills its specific role without overlapping with the responsibilities of the others.
The following sections will describe each of the layers of the proposed new architecture.
4.1. Government Strategy Layer—Executive Perspective
4.2. Business Layer—Business Management Perspective
In this perspective, the conceptual model of the business is proposed. The models are built from the perspective of the owners or direct participants from the company.
Figure 17,
Figure 18,
Figure 19,
Figure 20,
Figure 21 and
Figure 22 describe each of the questions from this perspective.
4.3. Information Layer—Architect Perspective
As defined in
Section 3.3.3, this perspective presents how the system will meet the information requirements. Technical aspects of the solution or constraints that must be considered in the software development layer are not included.
- −
System Logic—What
The main process that the information layer will support is training. Inherent in training is a set of subprocesses that allow for the articulation of the collection of all the required information in this layer: management of companies, equipment and users, identification of quality attributes and metrics, and generation of reports.
Figure 23 presents the object model and its dependency relationships. In this model, 11 entities that represent all the relevant data that must be stored were defined.
- ▪
Users: Refers to the operators and interested parties who will be part of the entire training process.
- ▪
Companies: Allows to register the companies that will participate in the training processes, considering the assigned equipment by each company.
- ▪
Equipment: High-cost machinery that will be used as a primary source to carry out training, both in the traditional way and with Augmented Reality.
- ▪
Training: Corresponds to the planned events so that those interested in the process participate as trainers and operators.
- ▪
Attempts: Refers to the attempts that a user assigned to a company may have in a training session.
- ▪
Reports: These are generated from each training. It includes reports of the attributes assigned to each training session. As scope in this architecture, the attributes Efficiency, Effectiveness, and Satisfaction are defined.
- ▪
Attributes: These are the elements that will be measured in the training. Each attribute has metrics, and it is what the architecture will provide as data to feed the reports of each training.
- ▪
Subcategories: Refers to the classification of the attributes that will be measured in the training.
- ▪
Units: The units of measurement for each metric.
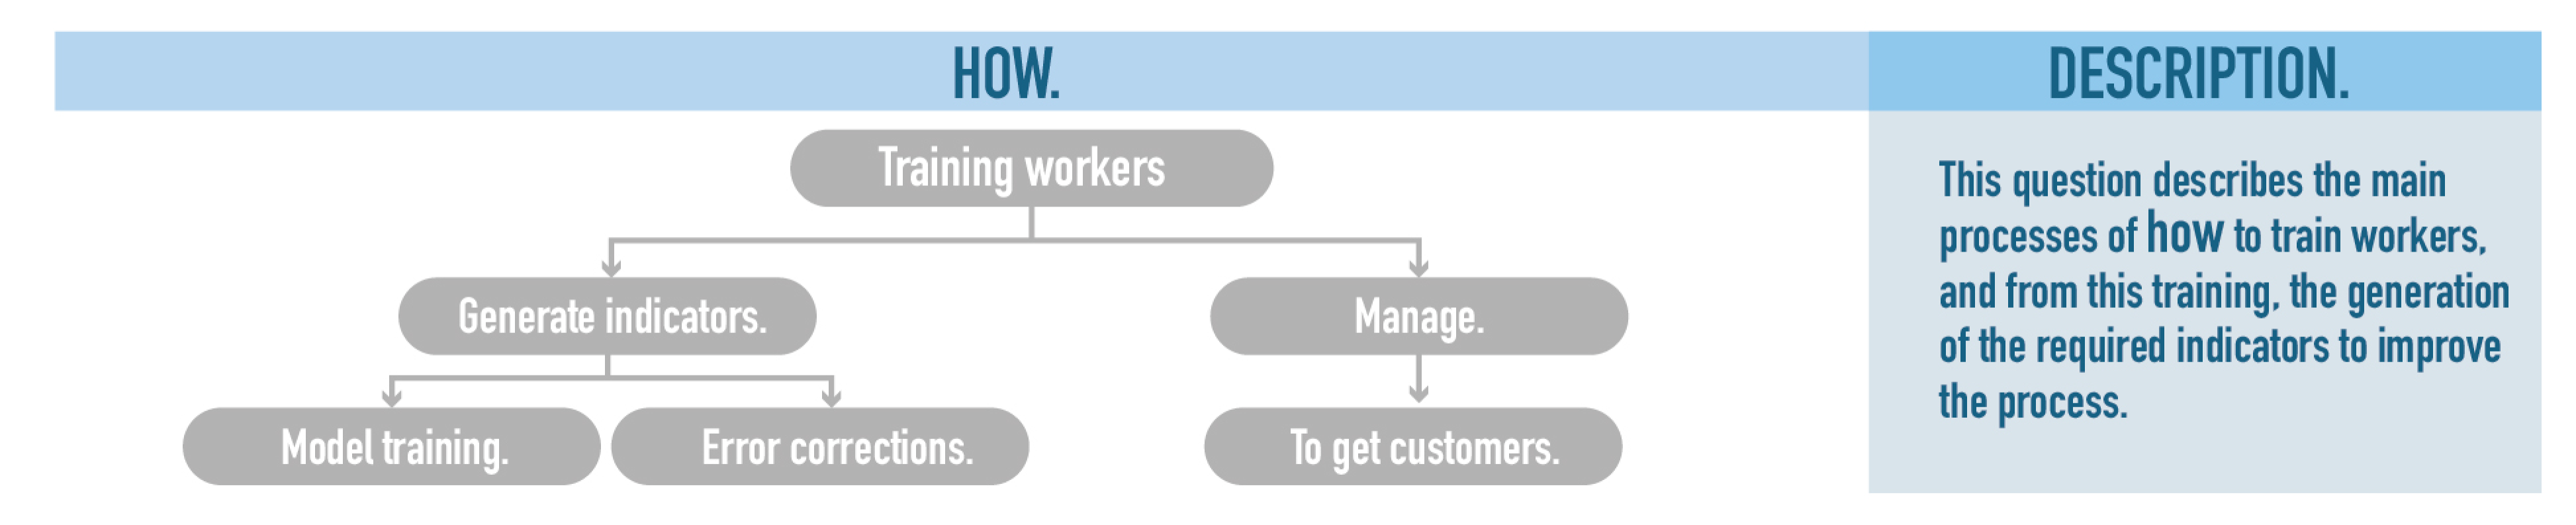
- −
System Logic—How
Since the architecture works for a multi-company environment, the first step is to select the company in which the training is expected to be carried out. Subsequently, the training must be created by selecting the necessary equipment to perform the training. Once the training is created, the interested parties must be assigned; they can be trainers or operators, among others. When the information management is completed, training supported by augmented reality is applied. These training stages are variable and depend on the type of machine to be used. At the end of the training, each user will be able to complete a satisfaction survey that will feed the Satisfaction attribute. The entire process ends with the generation of training reports (see
Figure 24).
- −
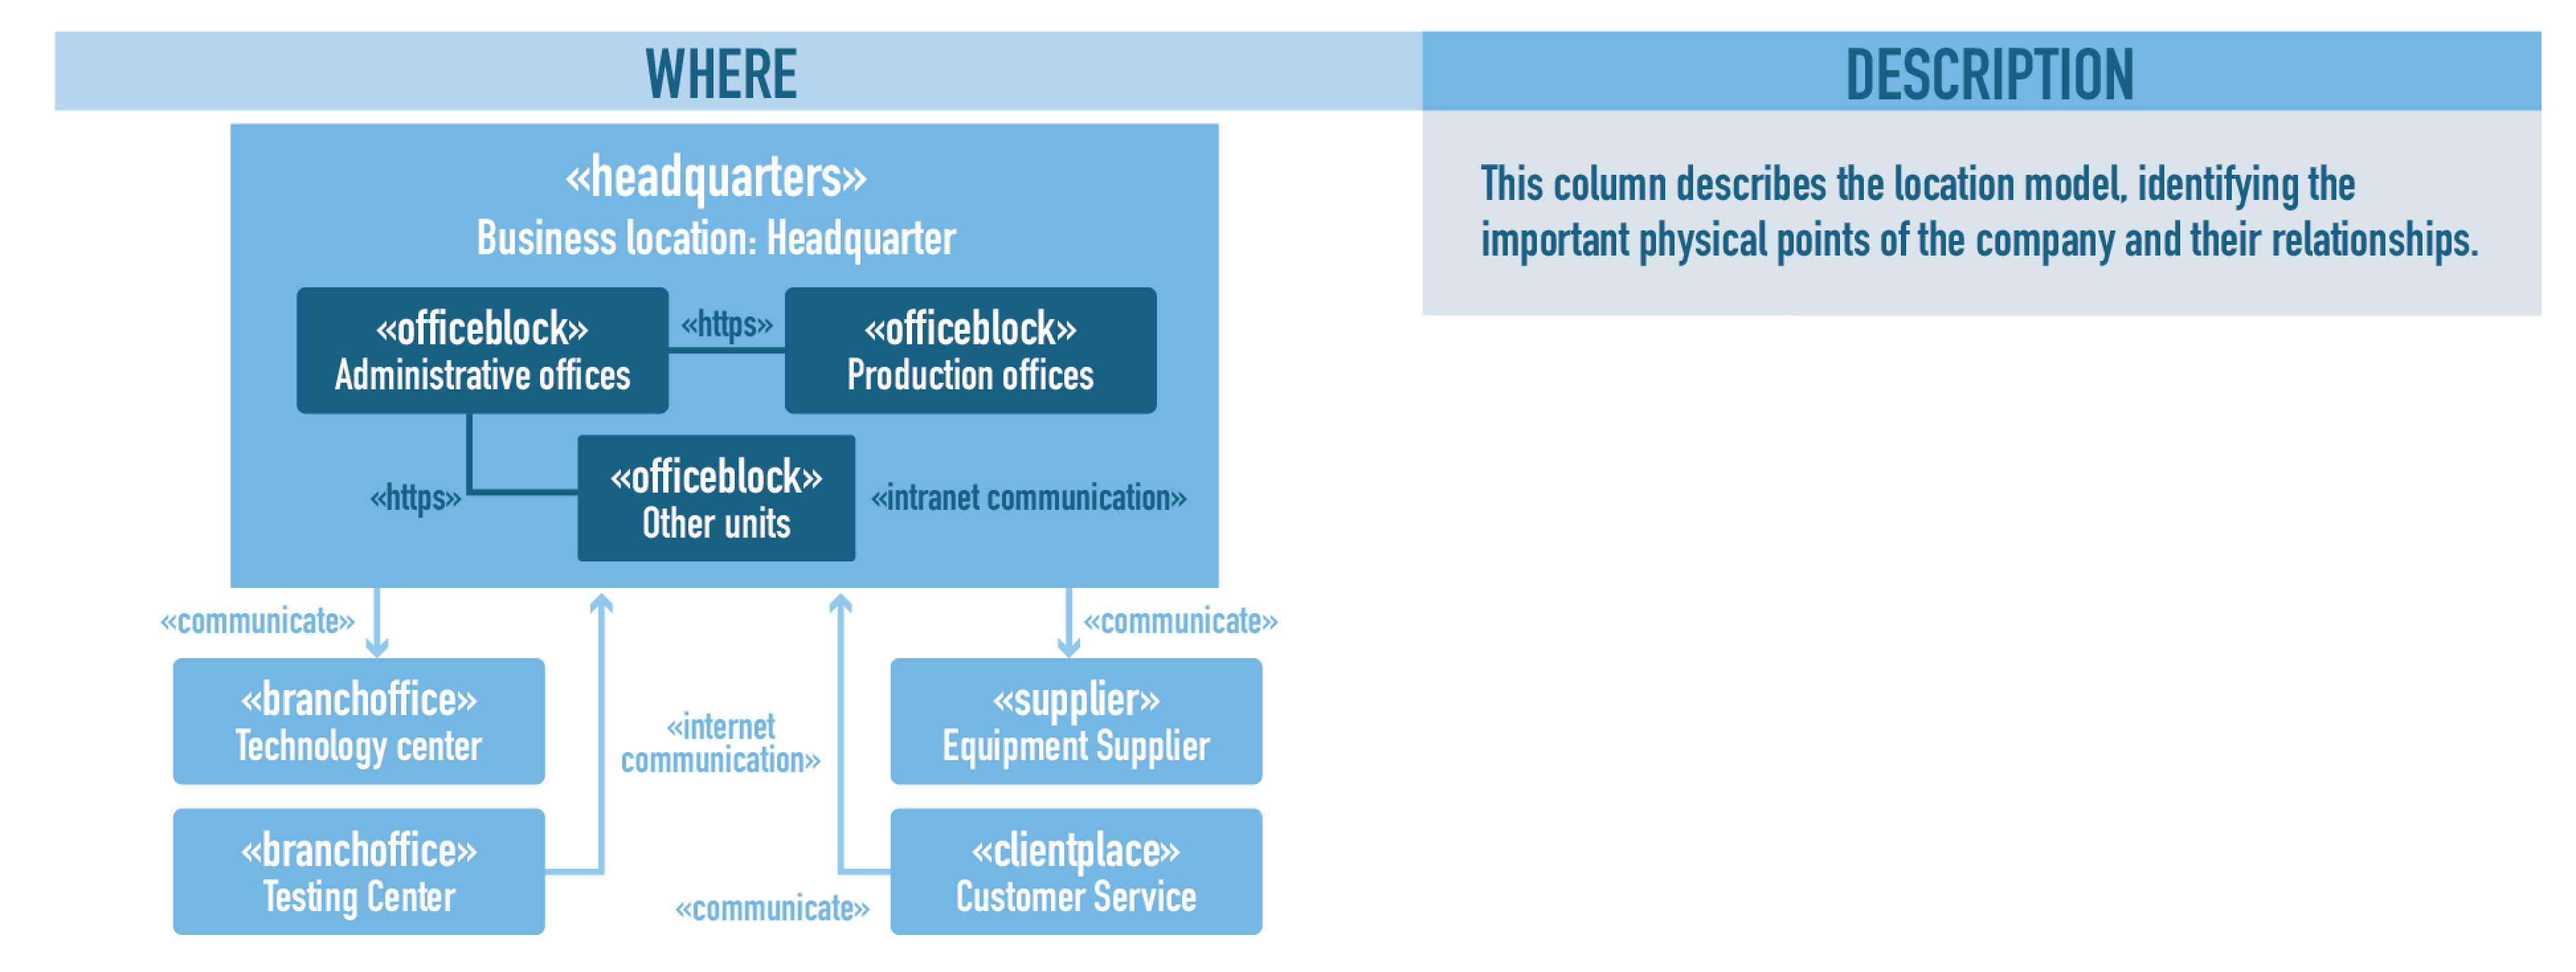
System Logic—Where
The training will be conducted in each company that wants to participate in the process. The devices can be used by operators in companies to have the process supervised. Connectivity will be restricted so that information does not leave the company without prior authorization. The spaces intended for the machines will not be used; on the contrary, a classroom or training room may be used for all staff.
Figure 25 describes the operating scenarios of the architecture.
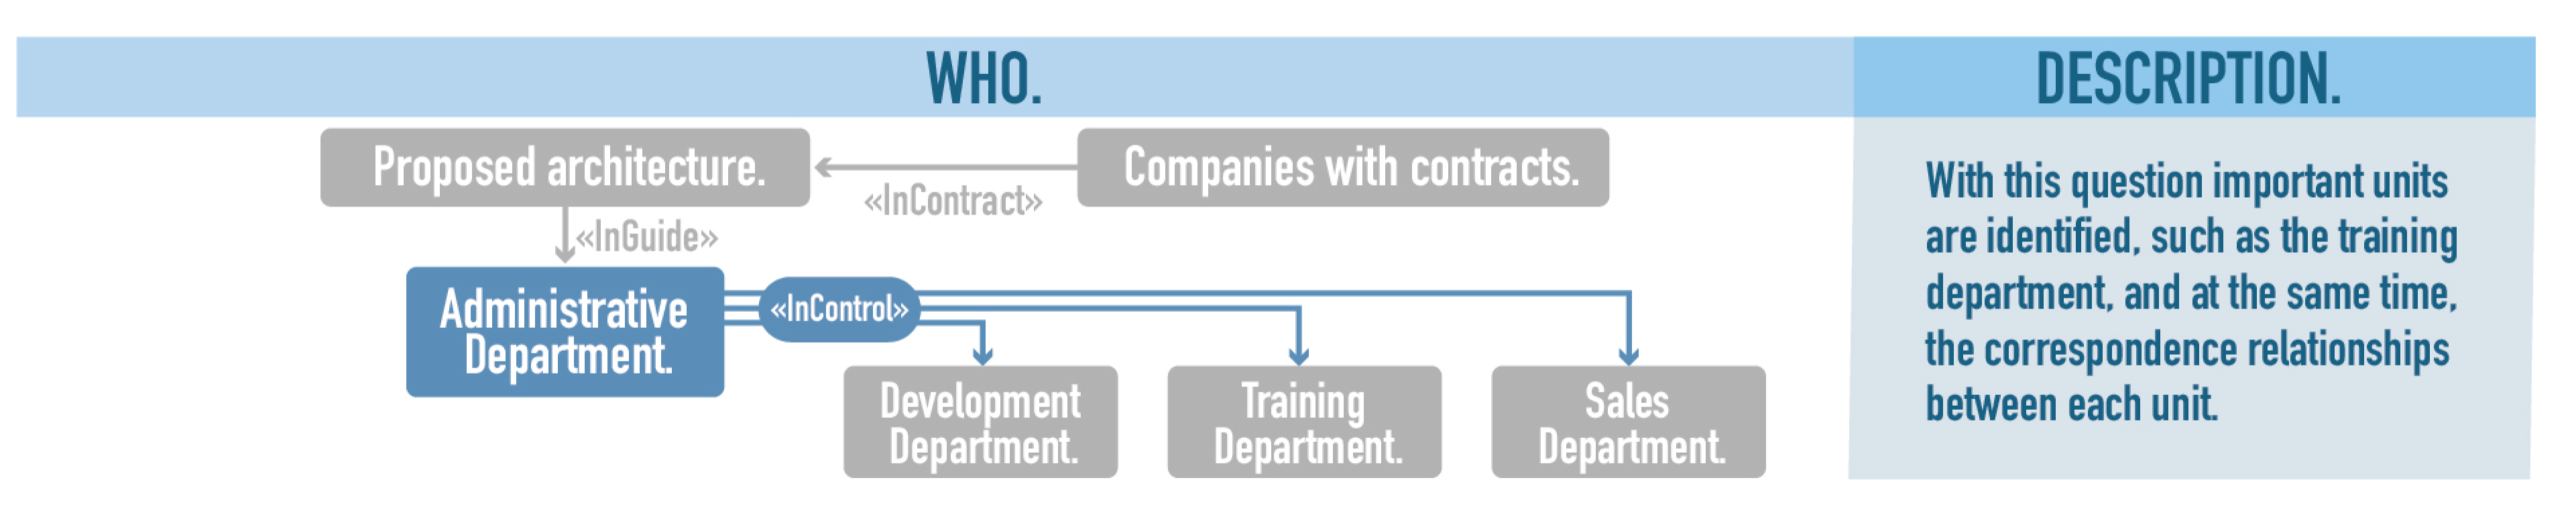
- −
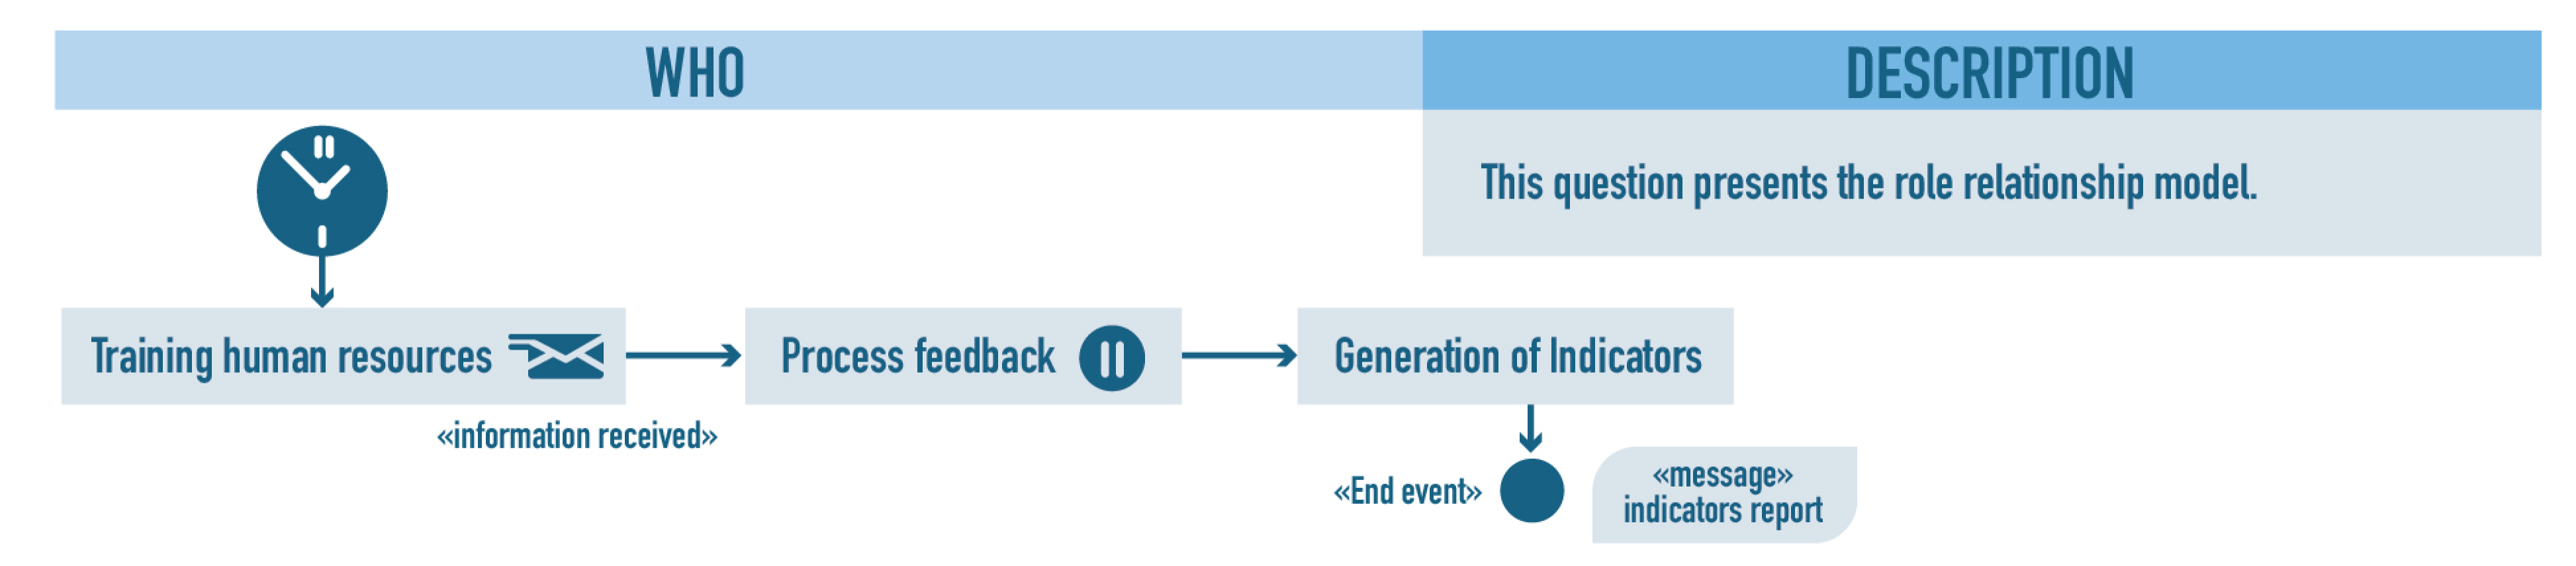
System Logic—Who
The organizational structure for the training processes proposed and supported by the architecture is not rigid. The business context analysis can infer the roles of laboratory director, who is responsible for the resources and machines that are part of the training; quality coordinator, who ensures that the processes are carried out based on standards to avoid equipment damage and non-expected issues for those interested in the process; operators, who are in charge of using the machines, that is, those who participate in the training process with Augmented Reality; trainers, who can be experienced operators or trainers assigned by the company; and finally analysts, who use the Systems and Applications layer to generate reports that are delivered to other layers of the architecture. The roles can be visualized in
Figure 26.
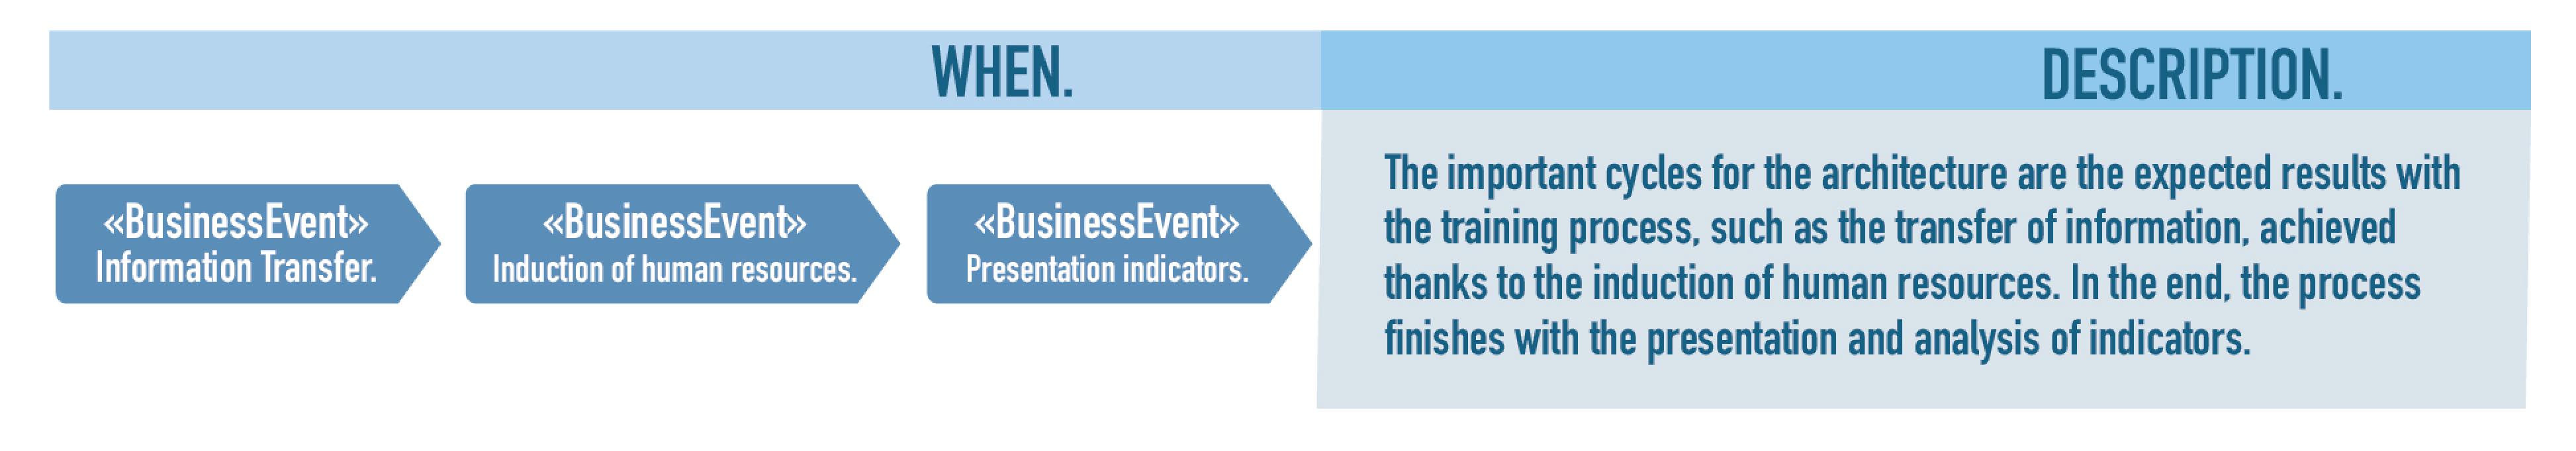
- −
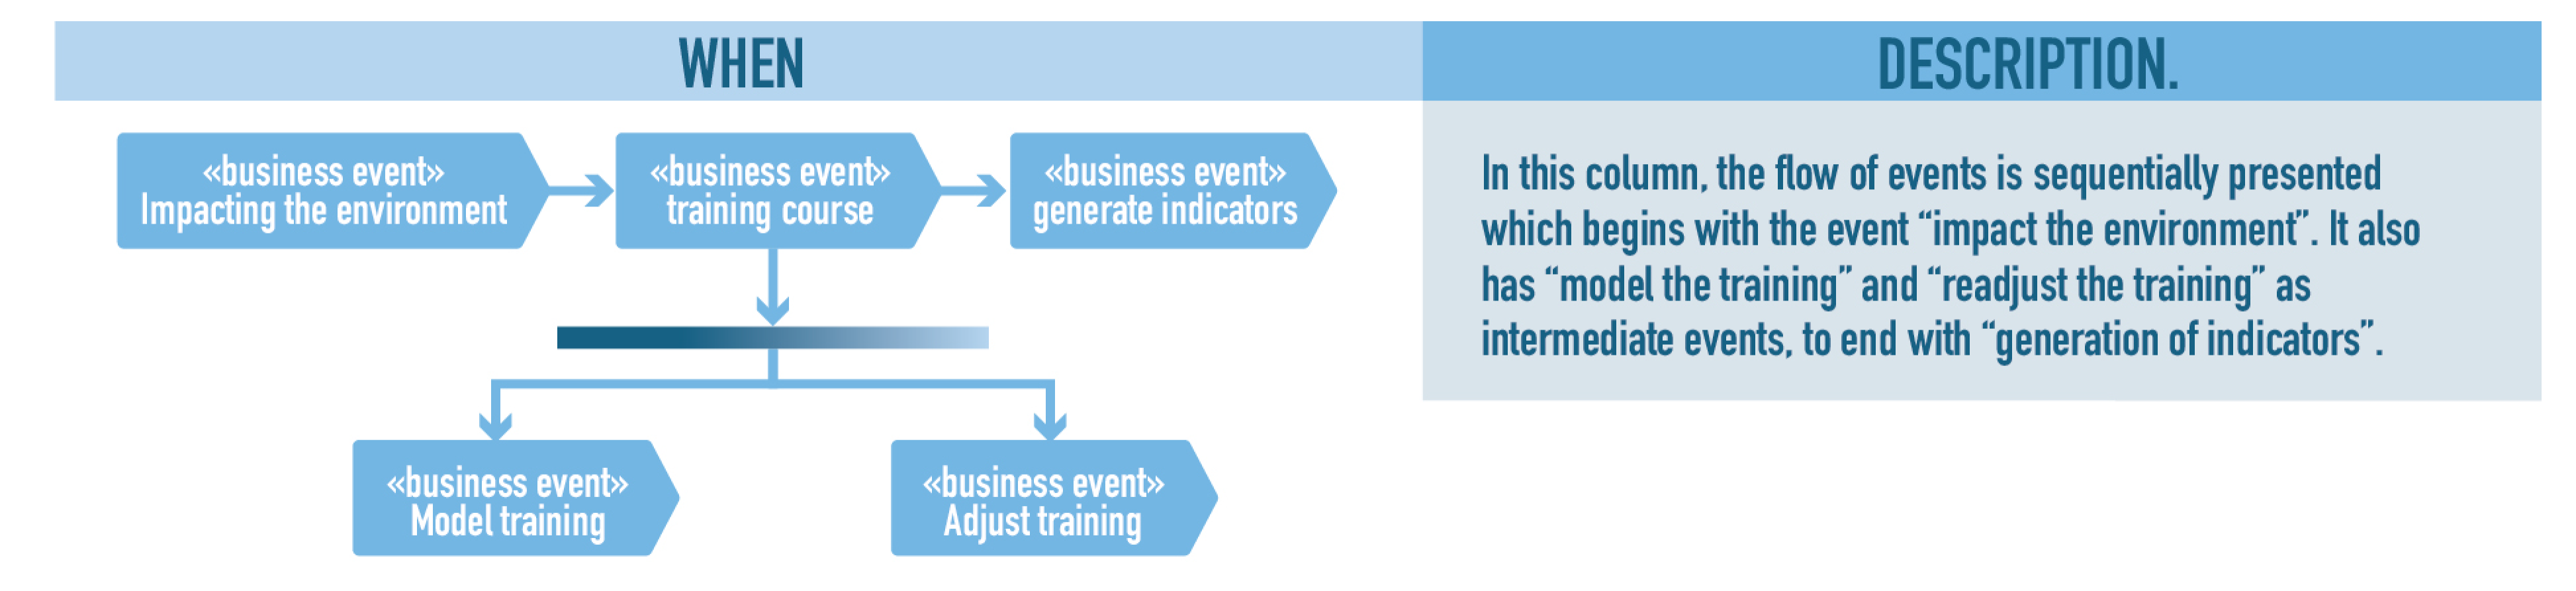
System Logic—When
Training events must be planned, therefore, the architecture and software to be used must have tools available to the information layer for planning each training session. It is not within the architecture scope to define dates and times for each process, that is part of the company training plan.
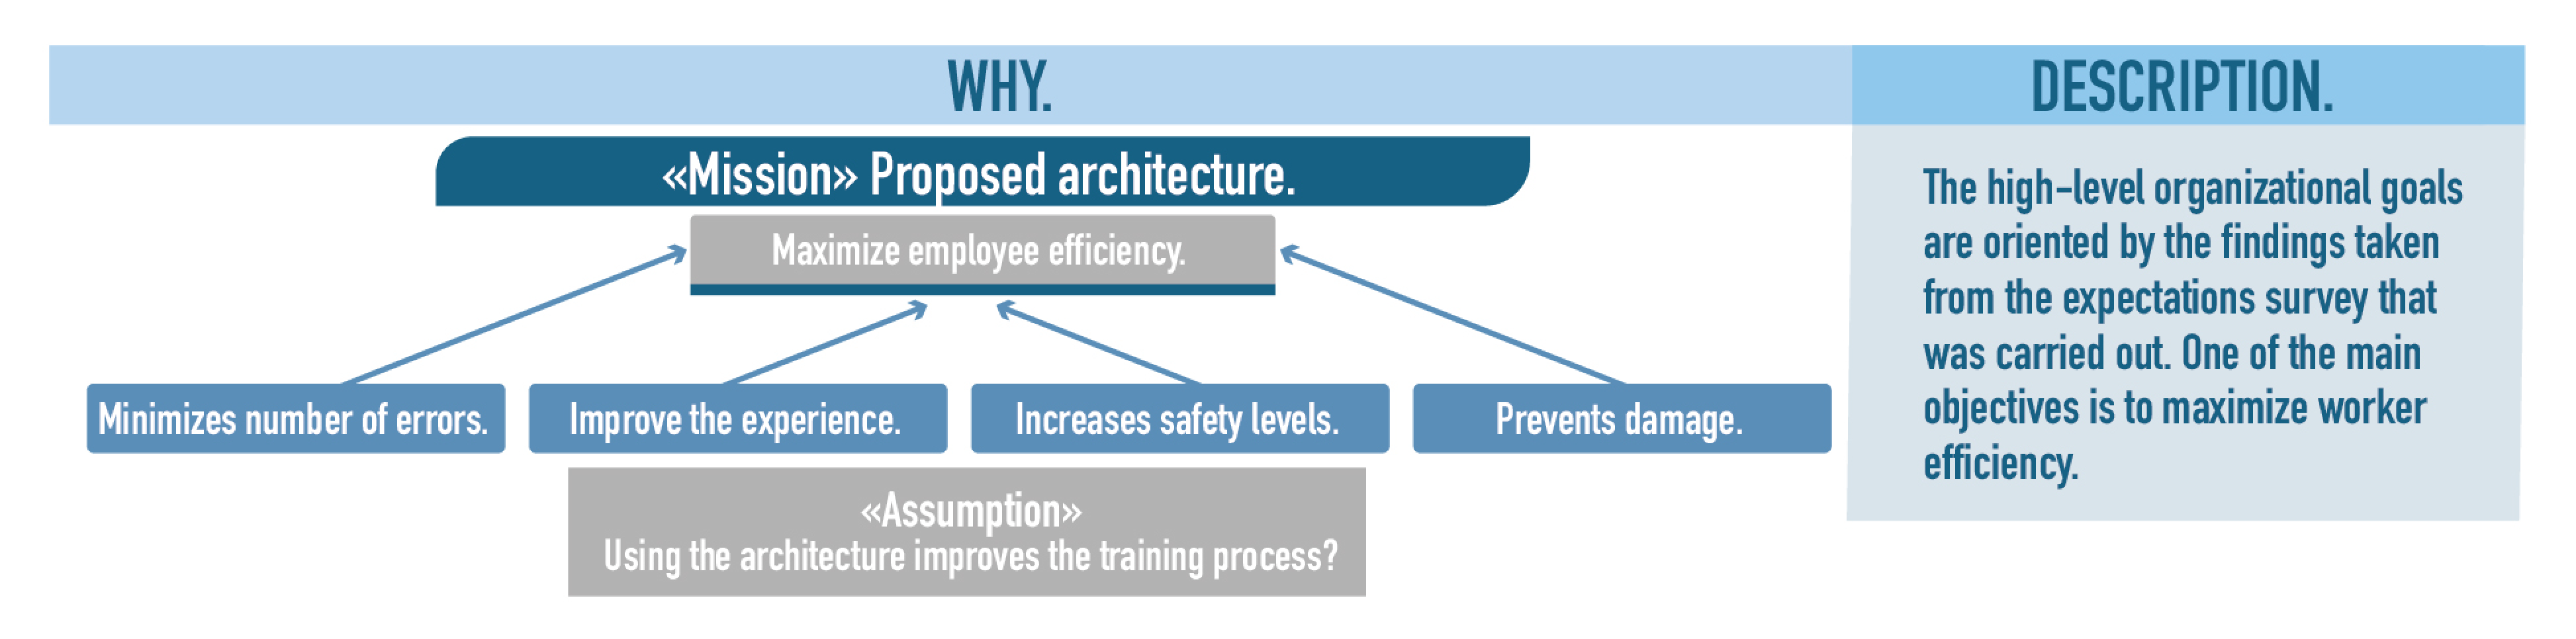
- −
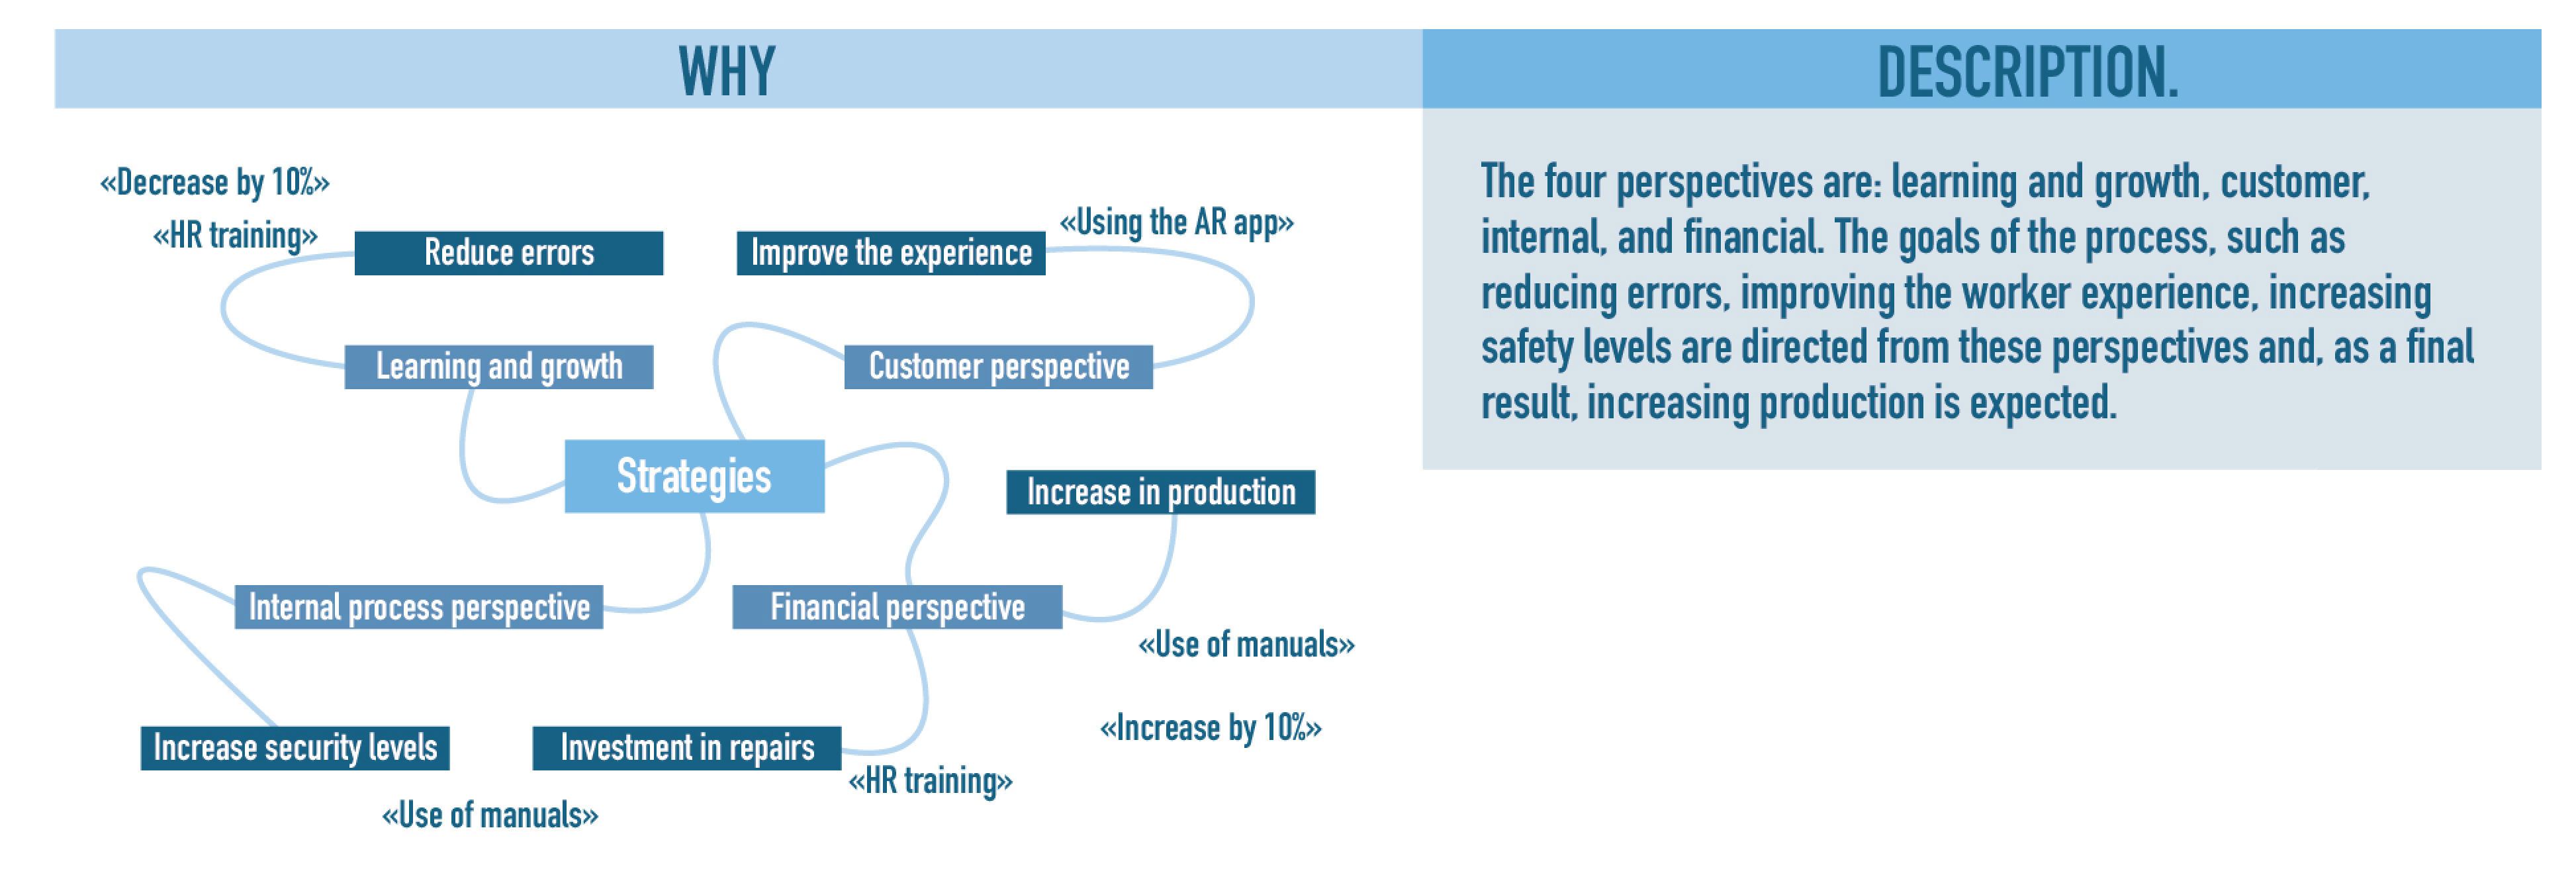
System Logic—Why
The training is not unrelated to the proposed architecture. In fact, the training is aligned with the objectives proposed in the Government layer, and must be oriented towards the fulfillment of these, such as prevention of errors and accidents, retention of tasks, efficient use of resources. and reduced maintenance of machinery.
In the Information layer the elements that will be collected in the Data layer are defined, this means that it is necessary to define what elements are going to be measured, the process, and the stages to be carried out in each training. Training processes depend on each particular machine. However, the measurements are part of a macroprocess that is directly related to the use of Augmented Reality in training processes.
The information layer must define what will be collected from the devices used by operators in the training sessions. Therefore, it is necessary to carry out a process of collecting information, characterization, and categorization of the variables to be measured. The attributes that will abstract the training information and that will be the core of this layer and the entry to the Data layer are Efficiency, Effectiveness, and Satisfaction. These attributes are taken from the work by Gutiérrez et al. [
3].
Considering the ISO/IEC 25022 standard [
46] “Systems and software engineering—Systems and software quality requirements and evaluation (SQuaRE)—Measurement of quality in use”, Usability is the degree to which a product or system can be used by specific users to achieve particular objectives with effectiveness, efficiency and satisfaction in a specific context of use [
46].
Based on this concept, and since Usability is the attribute located in the first position in the ranking of the work by Gutiérrez et al. [
3], the three attributes that define Usability (which are Effectiveness, Efficiency, and Satisfaction) will be measured.
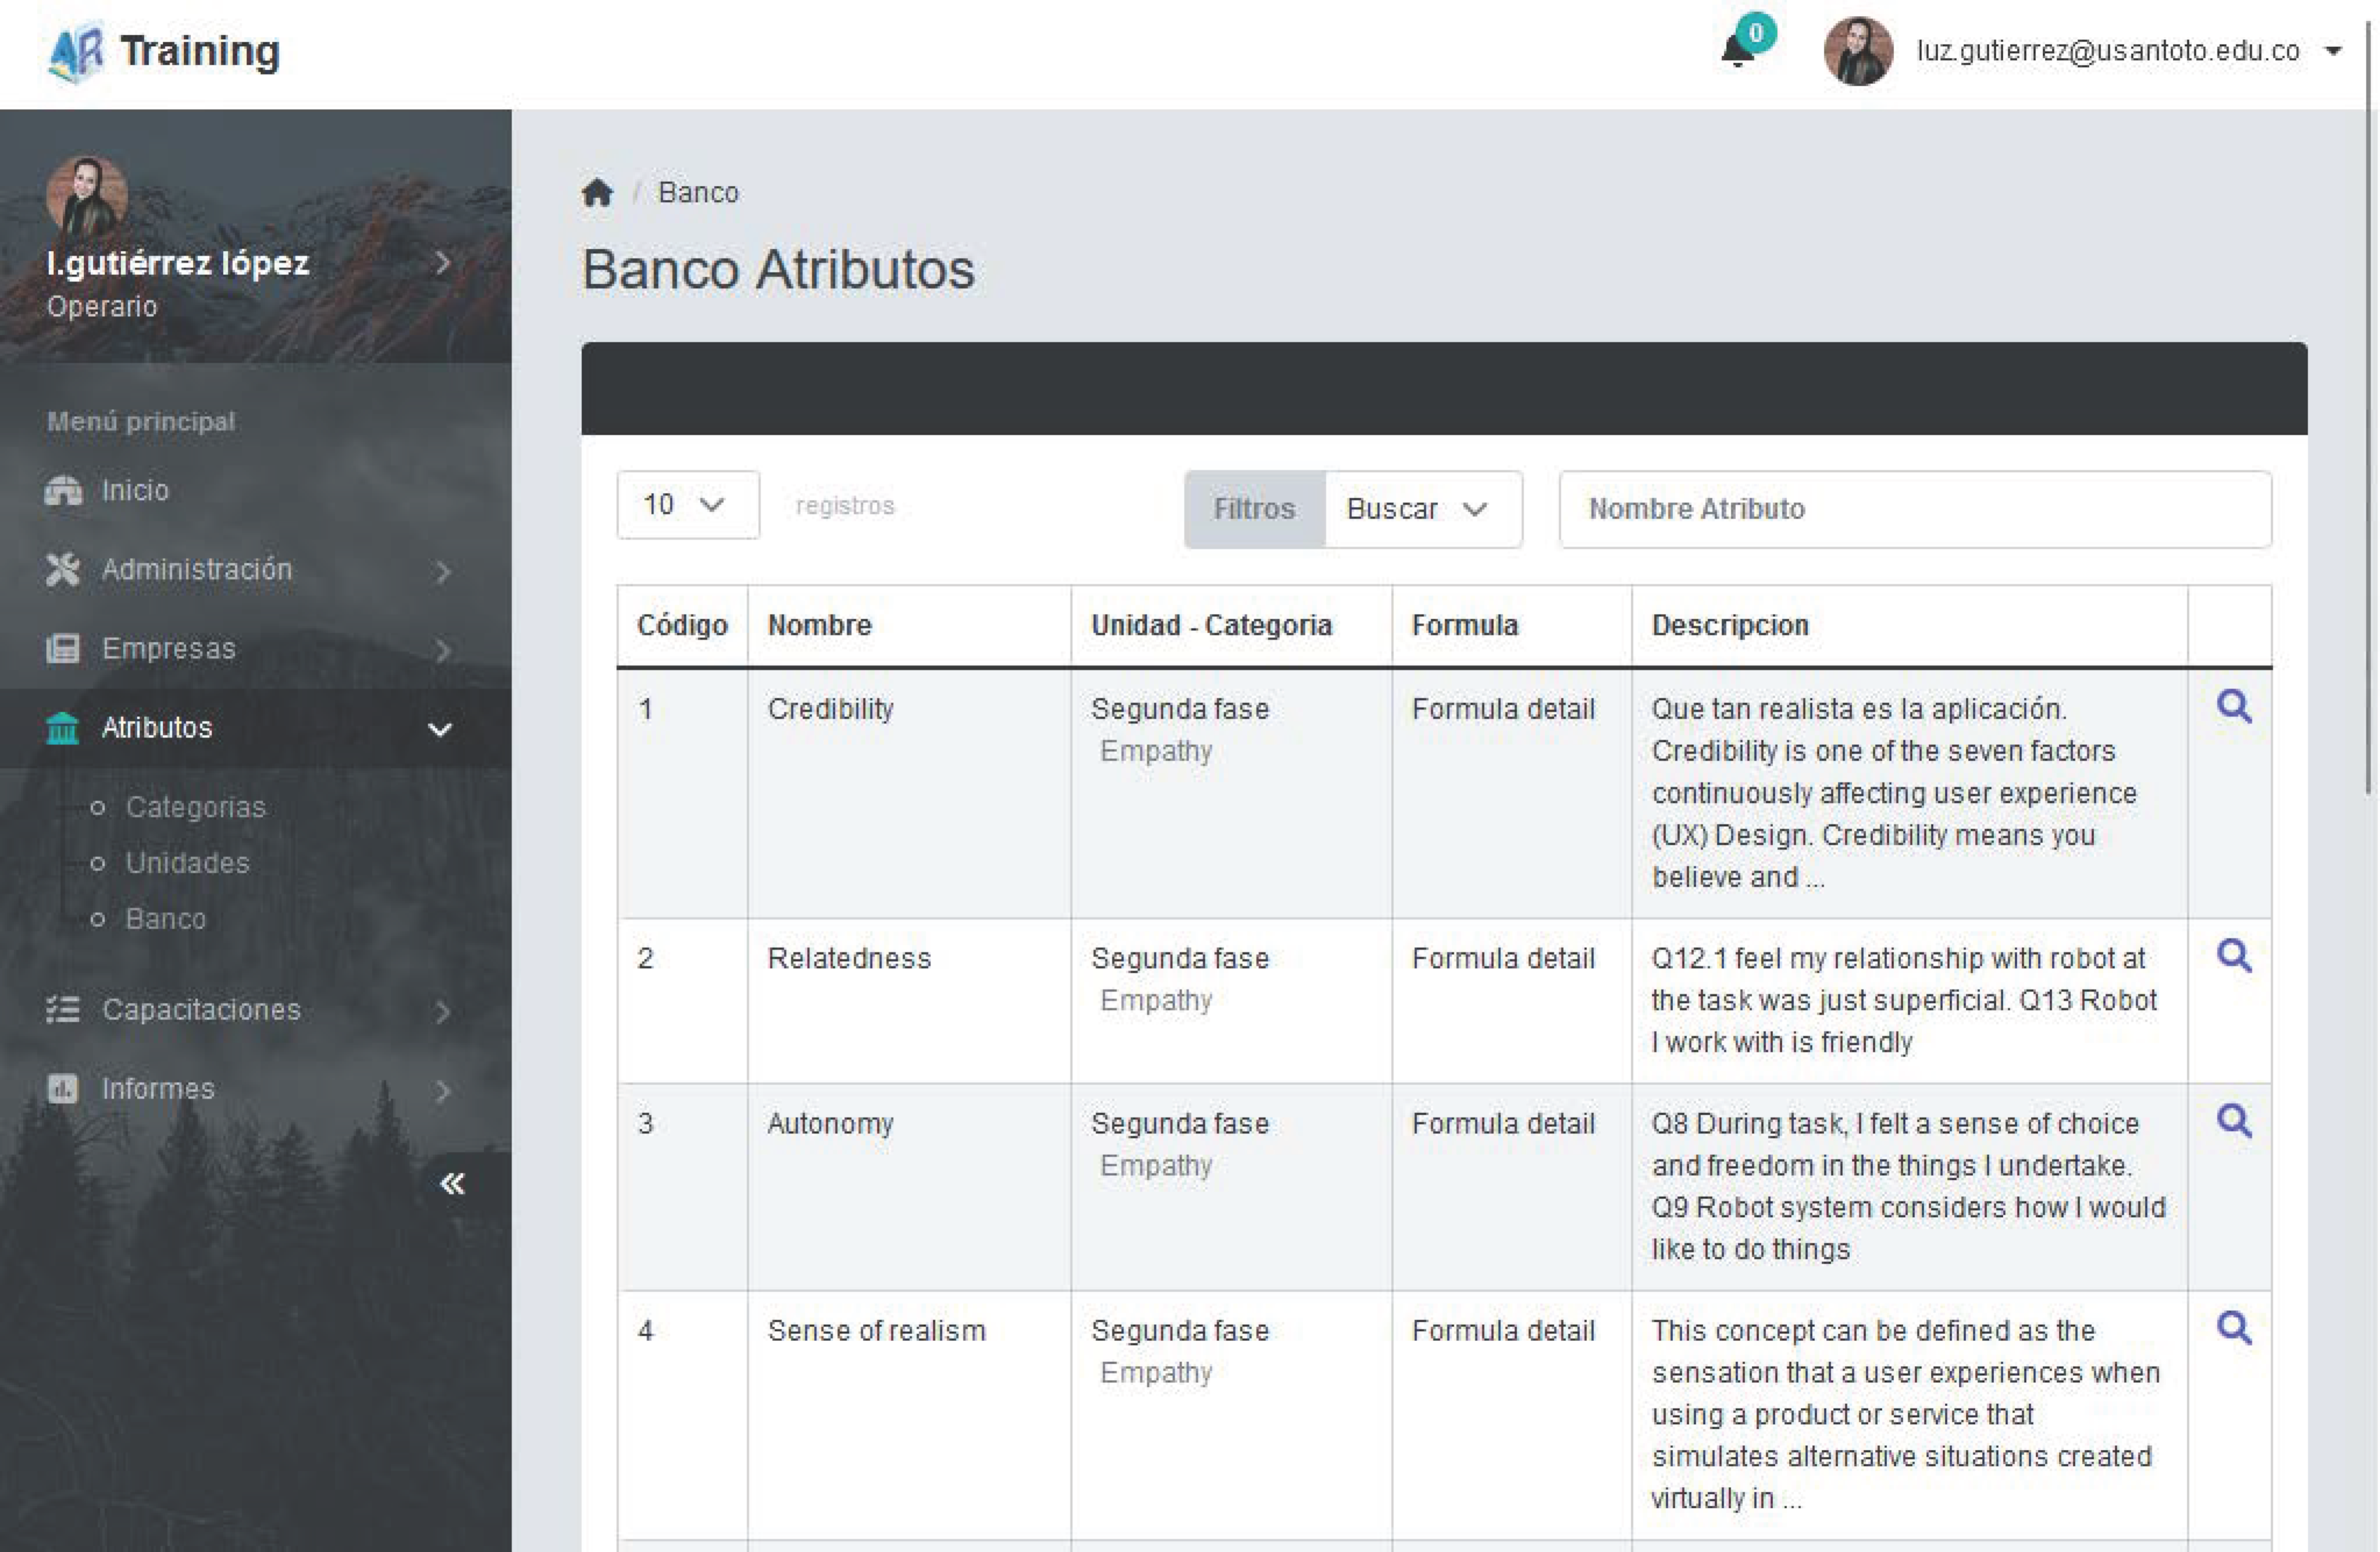
Table 5 presents the attributes to be measured and the respective associated metrics.
Satisfaction was measured through questionnaires (see
Table 6).
The scale used in both questionnaires was from 1 to 5, where 1 is the lowest value and 5 is the highest level of satisfaction. The three metrics described in
Table 5 are the indicators that must be fed into the Data layer.
4.4. Data Layer
As explained in
Section 3.3.4, among the main processes that can be performed with a Winston lathe are cylinder turning, facing, and boring. In this study, the focus was on the cylinder turning process.
Cylinder turning refers to the process of external or internal turning in the longitudinal direction of the axis of a part on the lathe. This process is performed to obtain a cylindrical surface with high precision, and is commonly used in the manufacture of shafts, stems, tubes and other parts that require a uniform cylindrical shape. Lathes can have different types of tools to perform the cylinder turning process, such as turning tool holder, threading tool holder, and boring tool holder.
The procedure to carry out the cylinder turning process is described below.
Procedure to Perform Cylinder Turning with a Winston Lathe
Among the different processes carried out on a lathe, one of the most important is cylinder turning. This is a turning operation that allows for obtaining cylindrical geometries of revolution. It applies to both interiors and exteriors [
48]. This shaping process involves the use of cutting tools to remove excess material and achieve the desired shape in the final piece.
The steps to execute this procedure are described below (
Figure 27):
Step 1. Safety protocol verification: Check that the worker has the appropriate clothing (overalls, steel-toed boots; no gloves because it is precision work) and validate that none of the keys used to adjust the material or cutting tool have been left behind.
Step 2. Lathe powering: Some lathes have a three-prong plug, where one of the prongs is ground. It is important to verify that the polarity of the plug is correct before connecting the lathe to the power. The ground pin should be connected to the ground terminal of the plug or the larger prong.
Step 3. Setting the cutting parameters: The appropriate cutting parameters must be set for the selected material and cutting tool. These parameters include cutting speed, feed rate and cutting depth. These parameters must be carefully adjusted to obtain the desired result.
Step 4. Piece fixation: The piece to be cylinder turned must be correctly fixed in the lathe chuck. It must be ensured that the part is centered and firmly held to avoid vibrations and displacements during the turning process.
Step 5. Cutting tool selection: The appropriate cutting tools must be selected for the diameter of the part to be turned and the type of material to be machined. Cutting tools must be sharp and in good condition to ensure a smooth and precise cut.
Step 6. Zero-point adjustment: The zero point of the cutting tool must be adjusted so that the tool starts cutting at the correct place. This can be done using the tool height adjustment device.
Step 7. Turn the switch on: Give way to the current to be able to manipulate the entire lathe.
Step 8. Workspace checking: Check that there are no elements in the lathe cup, nor in the tool carriage to avoid possible accidents.
Step 9. Turn the machine on: The lever that turns on the motors that accelerate the rotating head or Chuck is activated.
Step 10. Starting the cylinder turning process: Once the adjustments have been made and the appropriate tools have been selected, the turning process can begin. The cutting tool approaches the piece which begins to rotate slowly to allow cutting.
4.5. Systems and Applications Layer
As described in
Section 3.3.5, the communication diagram allows for a more precise view of the system’s functionalities. A communication diagram for the systems’ authentication and authorization is presented in
Figure 28.
Figure 29 presents the communication diagram of the proposed development for the mobile application that, being supported by principles of User Interface (UI) Design [
49,
50], User Experience Design (UX) [
51] and Usability [
8], allowed for the support of the training through the Augmented Reality application.
Figure 30 presents the communication diagram of the web platform that allows supporting and presenting the data delivered by the mobile application.
Continuing with the construction of the Systems and Application layer, the package diagram that articulates the basic components of the system and their interaction is presented below in
Figure 31. This diagram allows to conceptually evidence the Backend (server-side logic) of the platform and the Frontend (user-facing part of a website) of both the mobile application and the web application.
Having defined the views of this layer, the technologies that support the web and mobile platforms of the architecture are presented in
Table 7.
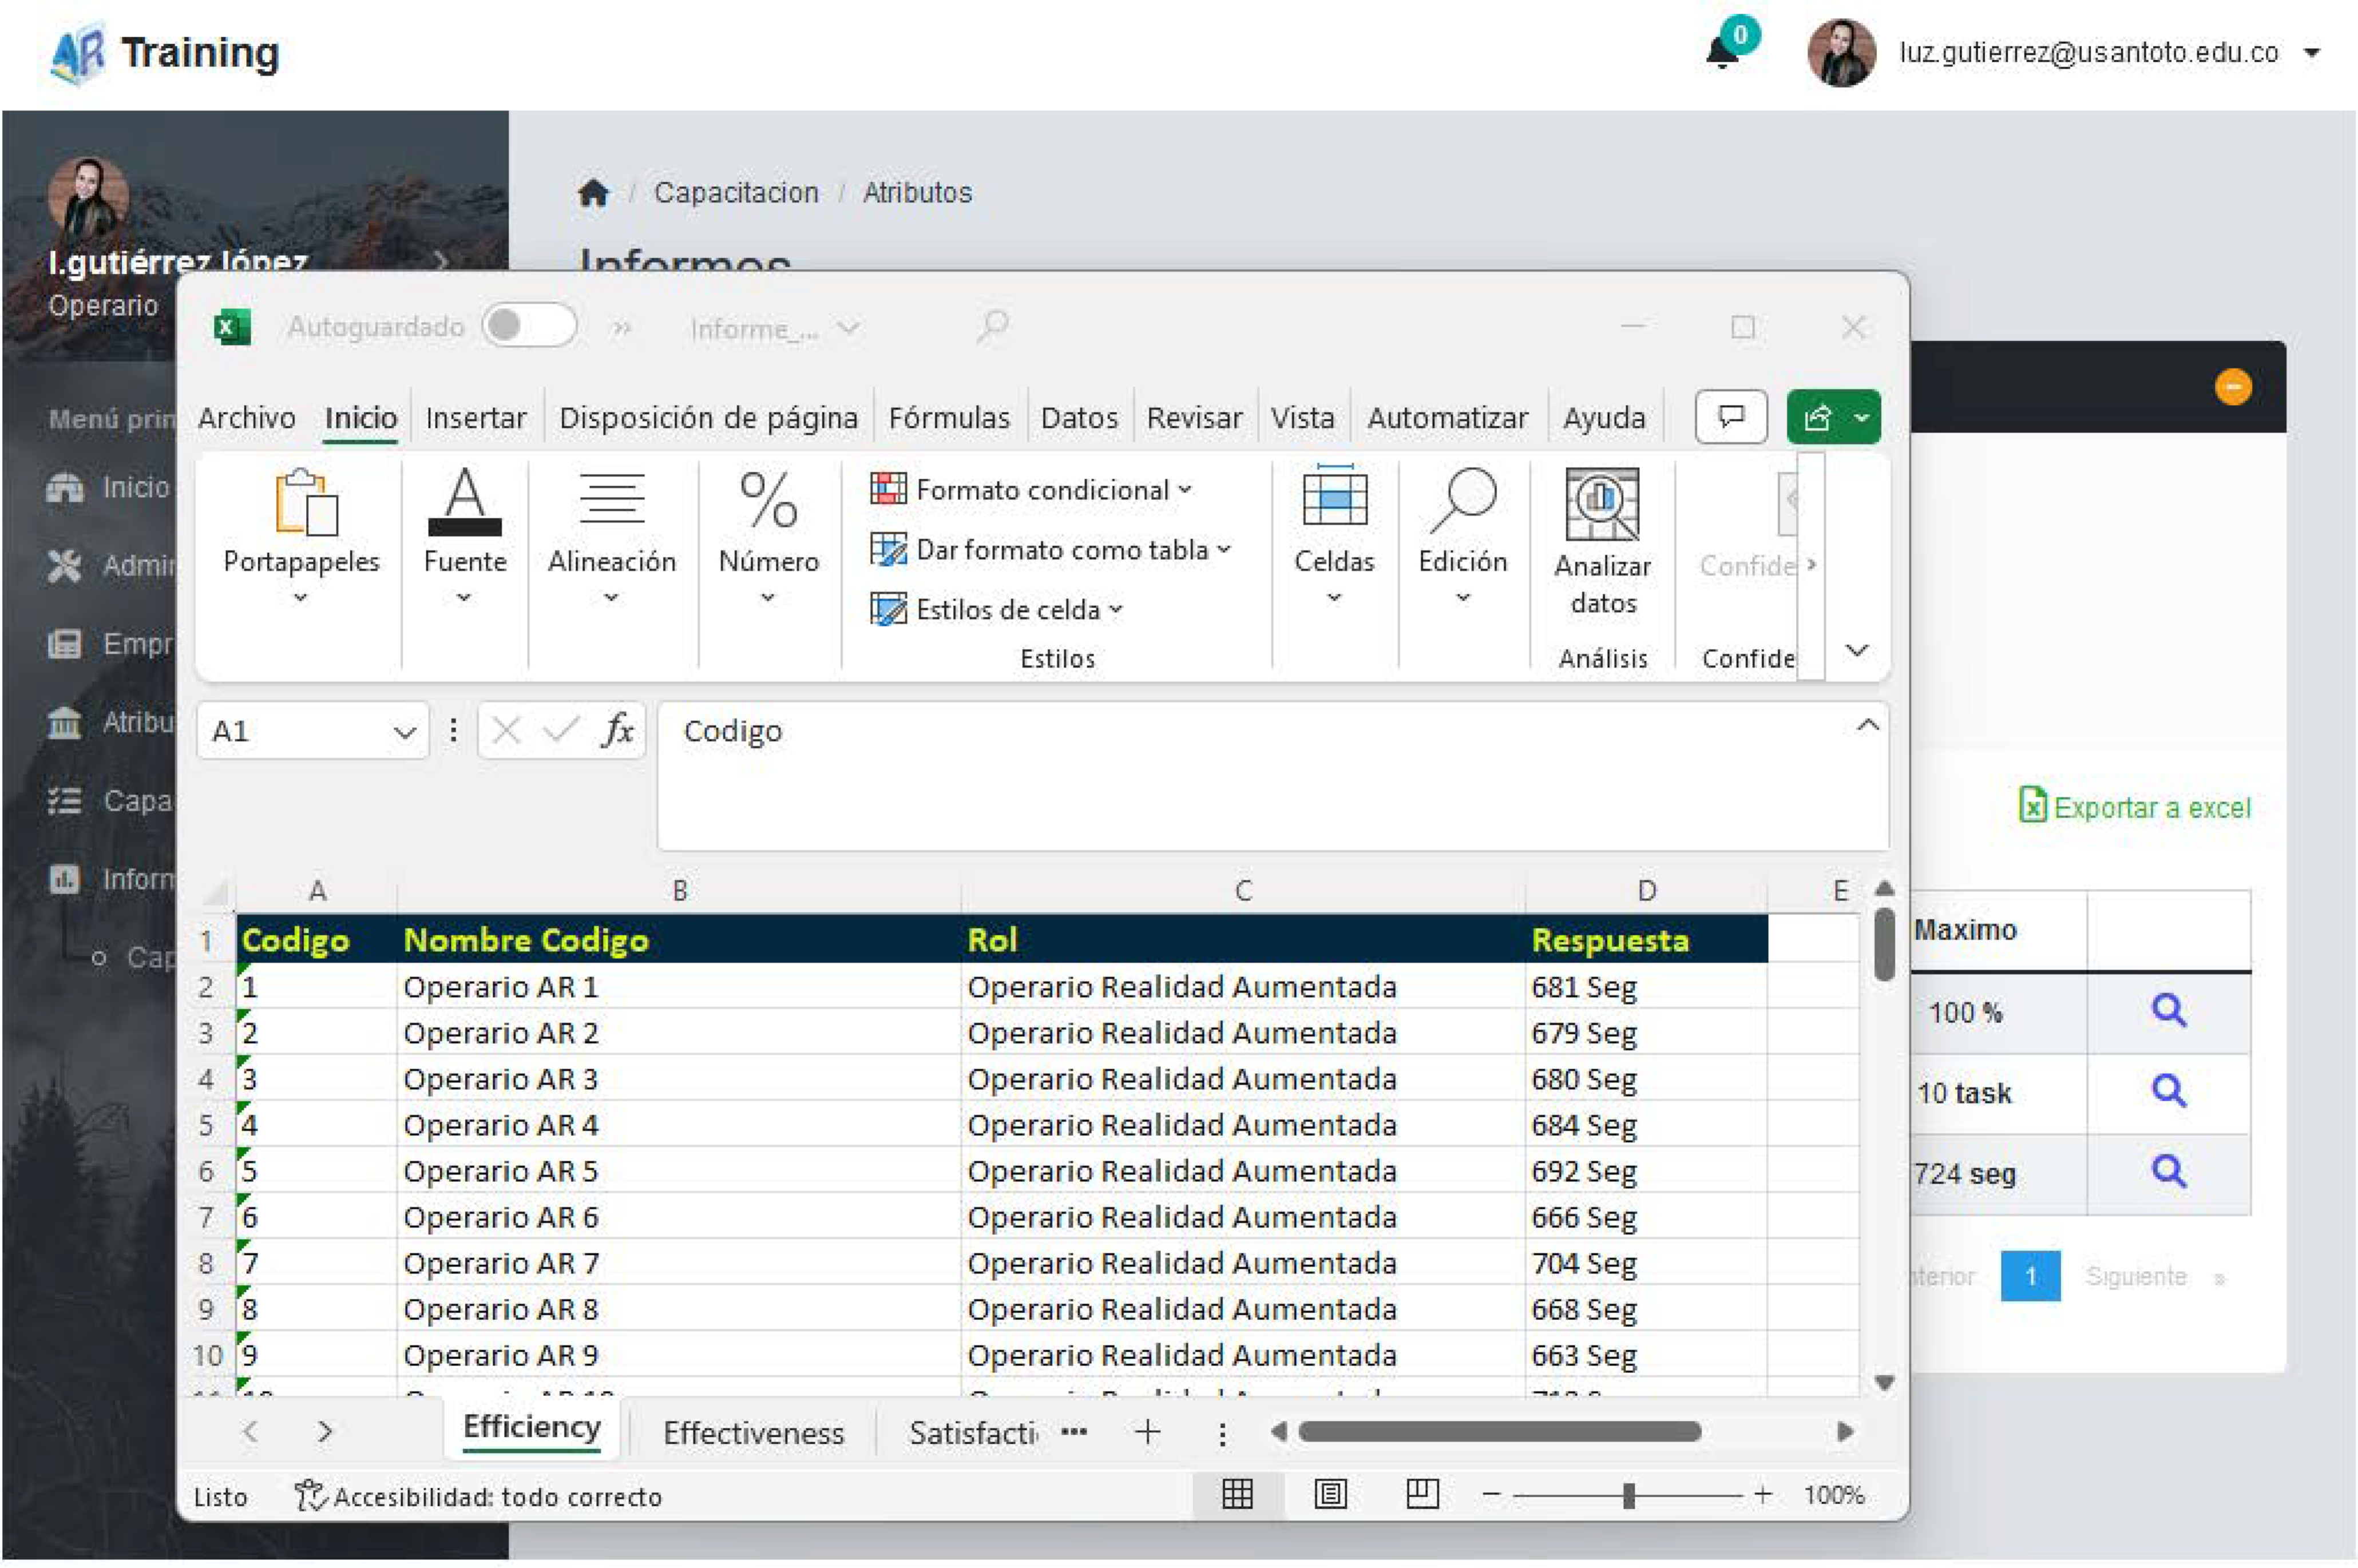
4.6. Networks and Infrastructure Layer
As presented in the methodology in Phase 3 Layer 6, two applications were developed: a mobile app with AR (
Figure 32) and a web app (
Figure 33 and
Figure 34). The purpose of the mobile app was to train workers in the selected process and therefore collect the data that would be entered into the web client. The processing and analysis of the information was carried out on the web platform. User information, training, metric measurement history, and other functionalities were also managed.
6. Discussion
Considering the reference studies of information technology architectures, it is important to highlight their contributions, such as the work by Bokolo and Petersen [
39] where they used four layers: (1) Business Layer: focused on the needs and business processes of smart cities; (2) Information Layer: management and governance of the data needed for urban digitization; (3) Applications Layer: applications that support business processes and information management; and (4) Technology Layer: technological infrastructure that supports applications and data management. Rossi et al. [
40] present their architecture with three layers: (1) Presentation Layer: user interface and augmented reality devices; (2) Applications Layer: training software and interactive guides for operators; and (3) Data Layer: storage and management of operator training and performance data. The study by Rohling et al. [
41] describes a four-layer architecture: (1) Control Layer: Satellite control systems and ground operations; (2) Communication Layer: Communication infrastructure between satellites and ground stations; (3) Data Layer: Satellite data management and processing; (4) Security Layer: Security measures to protect data and communications. Guest et al. [
42] present an architecture composed of (1) Sensor Layer: Wearable devices and sensors that collect motion data and physiological signals; (2) Data Layer: Data management and storage in the cloud; (3) Applications Layer: Augmented reality applications for training and monitoring; and (4) Communication Layer: Communication between wearable devices and data infrastructure. The FDIC—EA framework reference architecture [
43] is composed of five layers: (1) Business Architecture that describes the activities and processes performed by the corporation to fulfill its mission and achieve its objectives; (2) Data Architecture that focuses on the management and organization of the data necessary to support the corporation in-formation needs; (3) Applications Architecture that defines the applications and systems that support business processes and data management; (4) Technical Infrastructure Architecture that includes the technological infrastructure that supports applications and data, such as hardware, software, and networks; and (5) Security Architecture that emphasizes the security aspects which must be integrated into all other architectures to protect the organization’s information and systems.
Now, although these works propose architectures with several layers that support the different business logic processes and the requirements of stakeholders; in this new proposal of integrated computer architecture, six layers are defined. These allow combining the best practices and technologies of each of the mentioned studies, providing a robust and scalable solution for the training of operators in specific sectors. This research used a statistical validation process that allows evidencing the effectiveness of the use of the architecture.
To strengthen this area of knowledge, the validation of this architecture in other training scenarios can be proposed to calibrate and give feedback of the architecture model and generate a more scalable next version.
The objective of this research is not to compare the Efficiency, Effectiveness, and Satisfaction indicators with the results obtained in other studies. The principal contribution of this work is not the construction of an application with AR that improves training processes (the application is a secondary result). In this sense, the primary objective was to develop an architecture conceived from a business perspective, taking into account the strategic components of the organization and then integrating them with technical and technological aspects that corroborate the hypotheses raised in
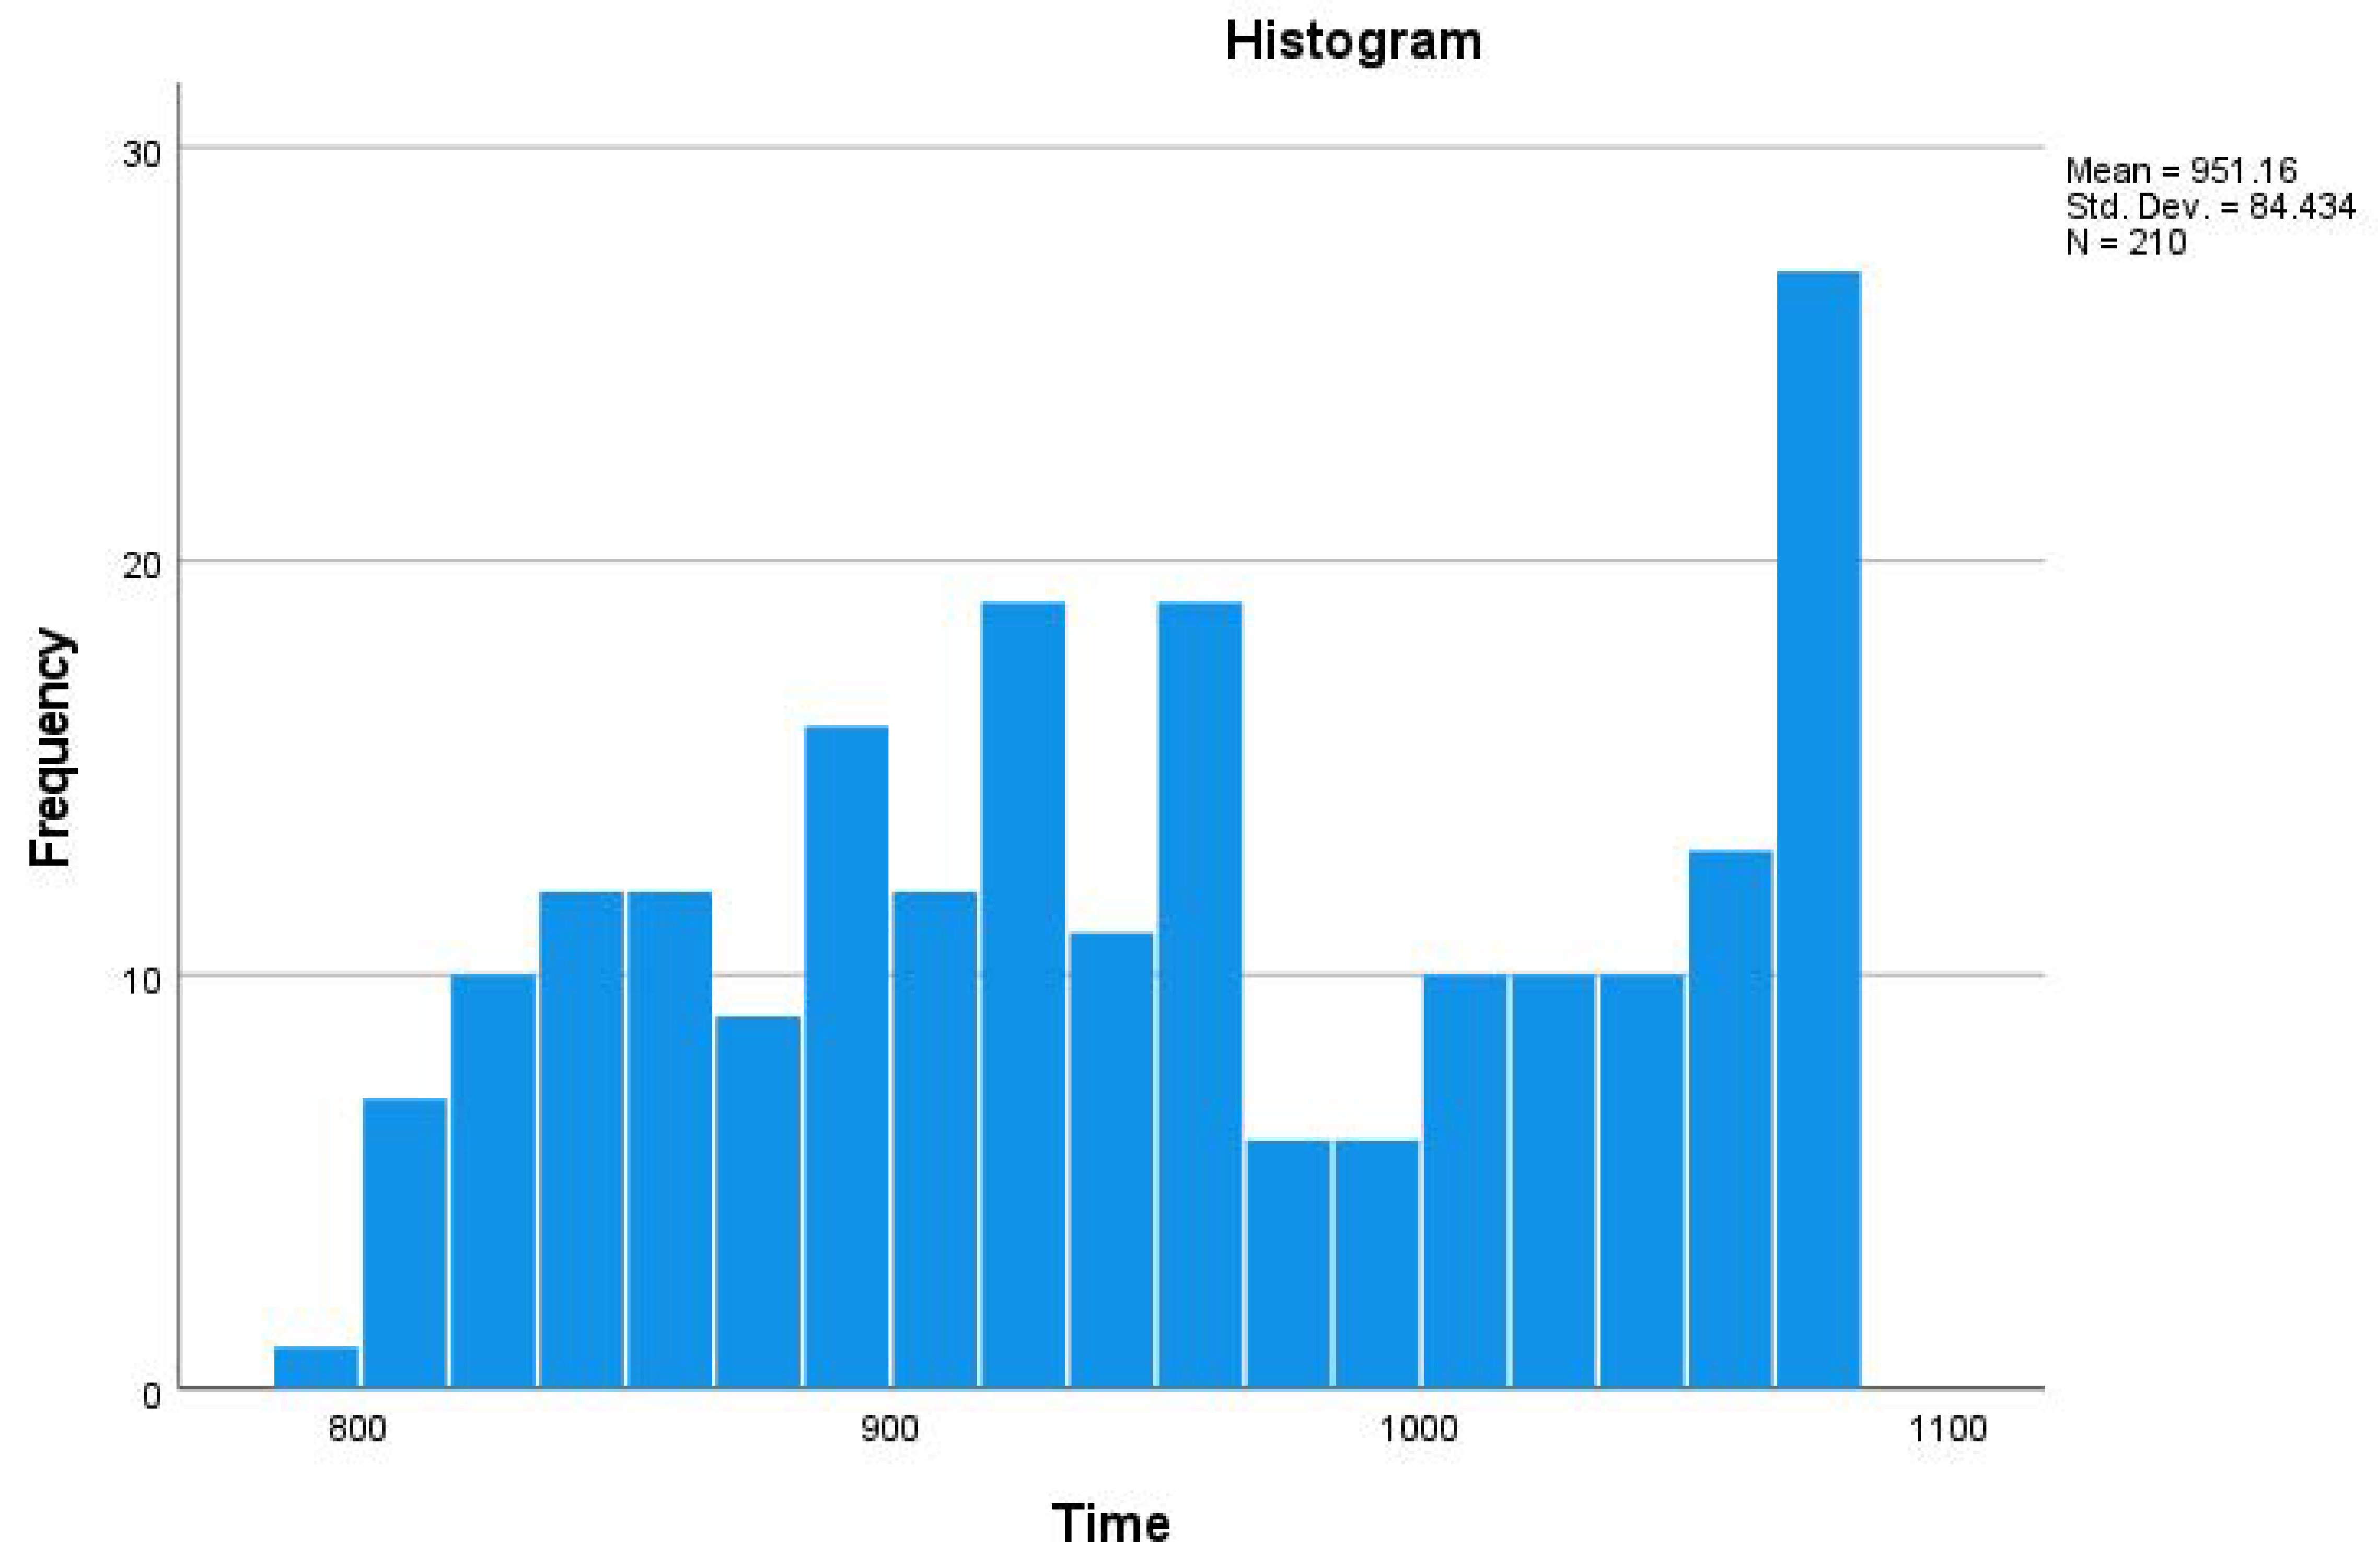
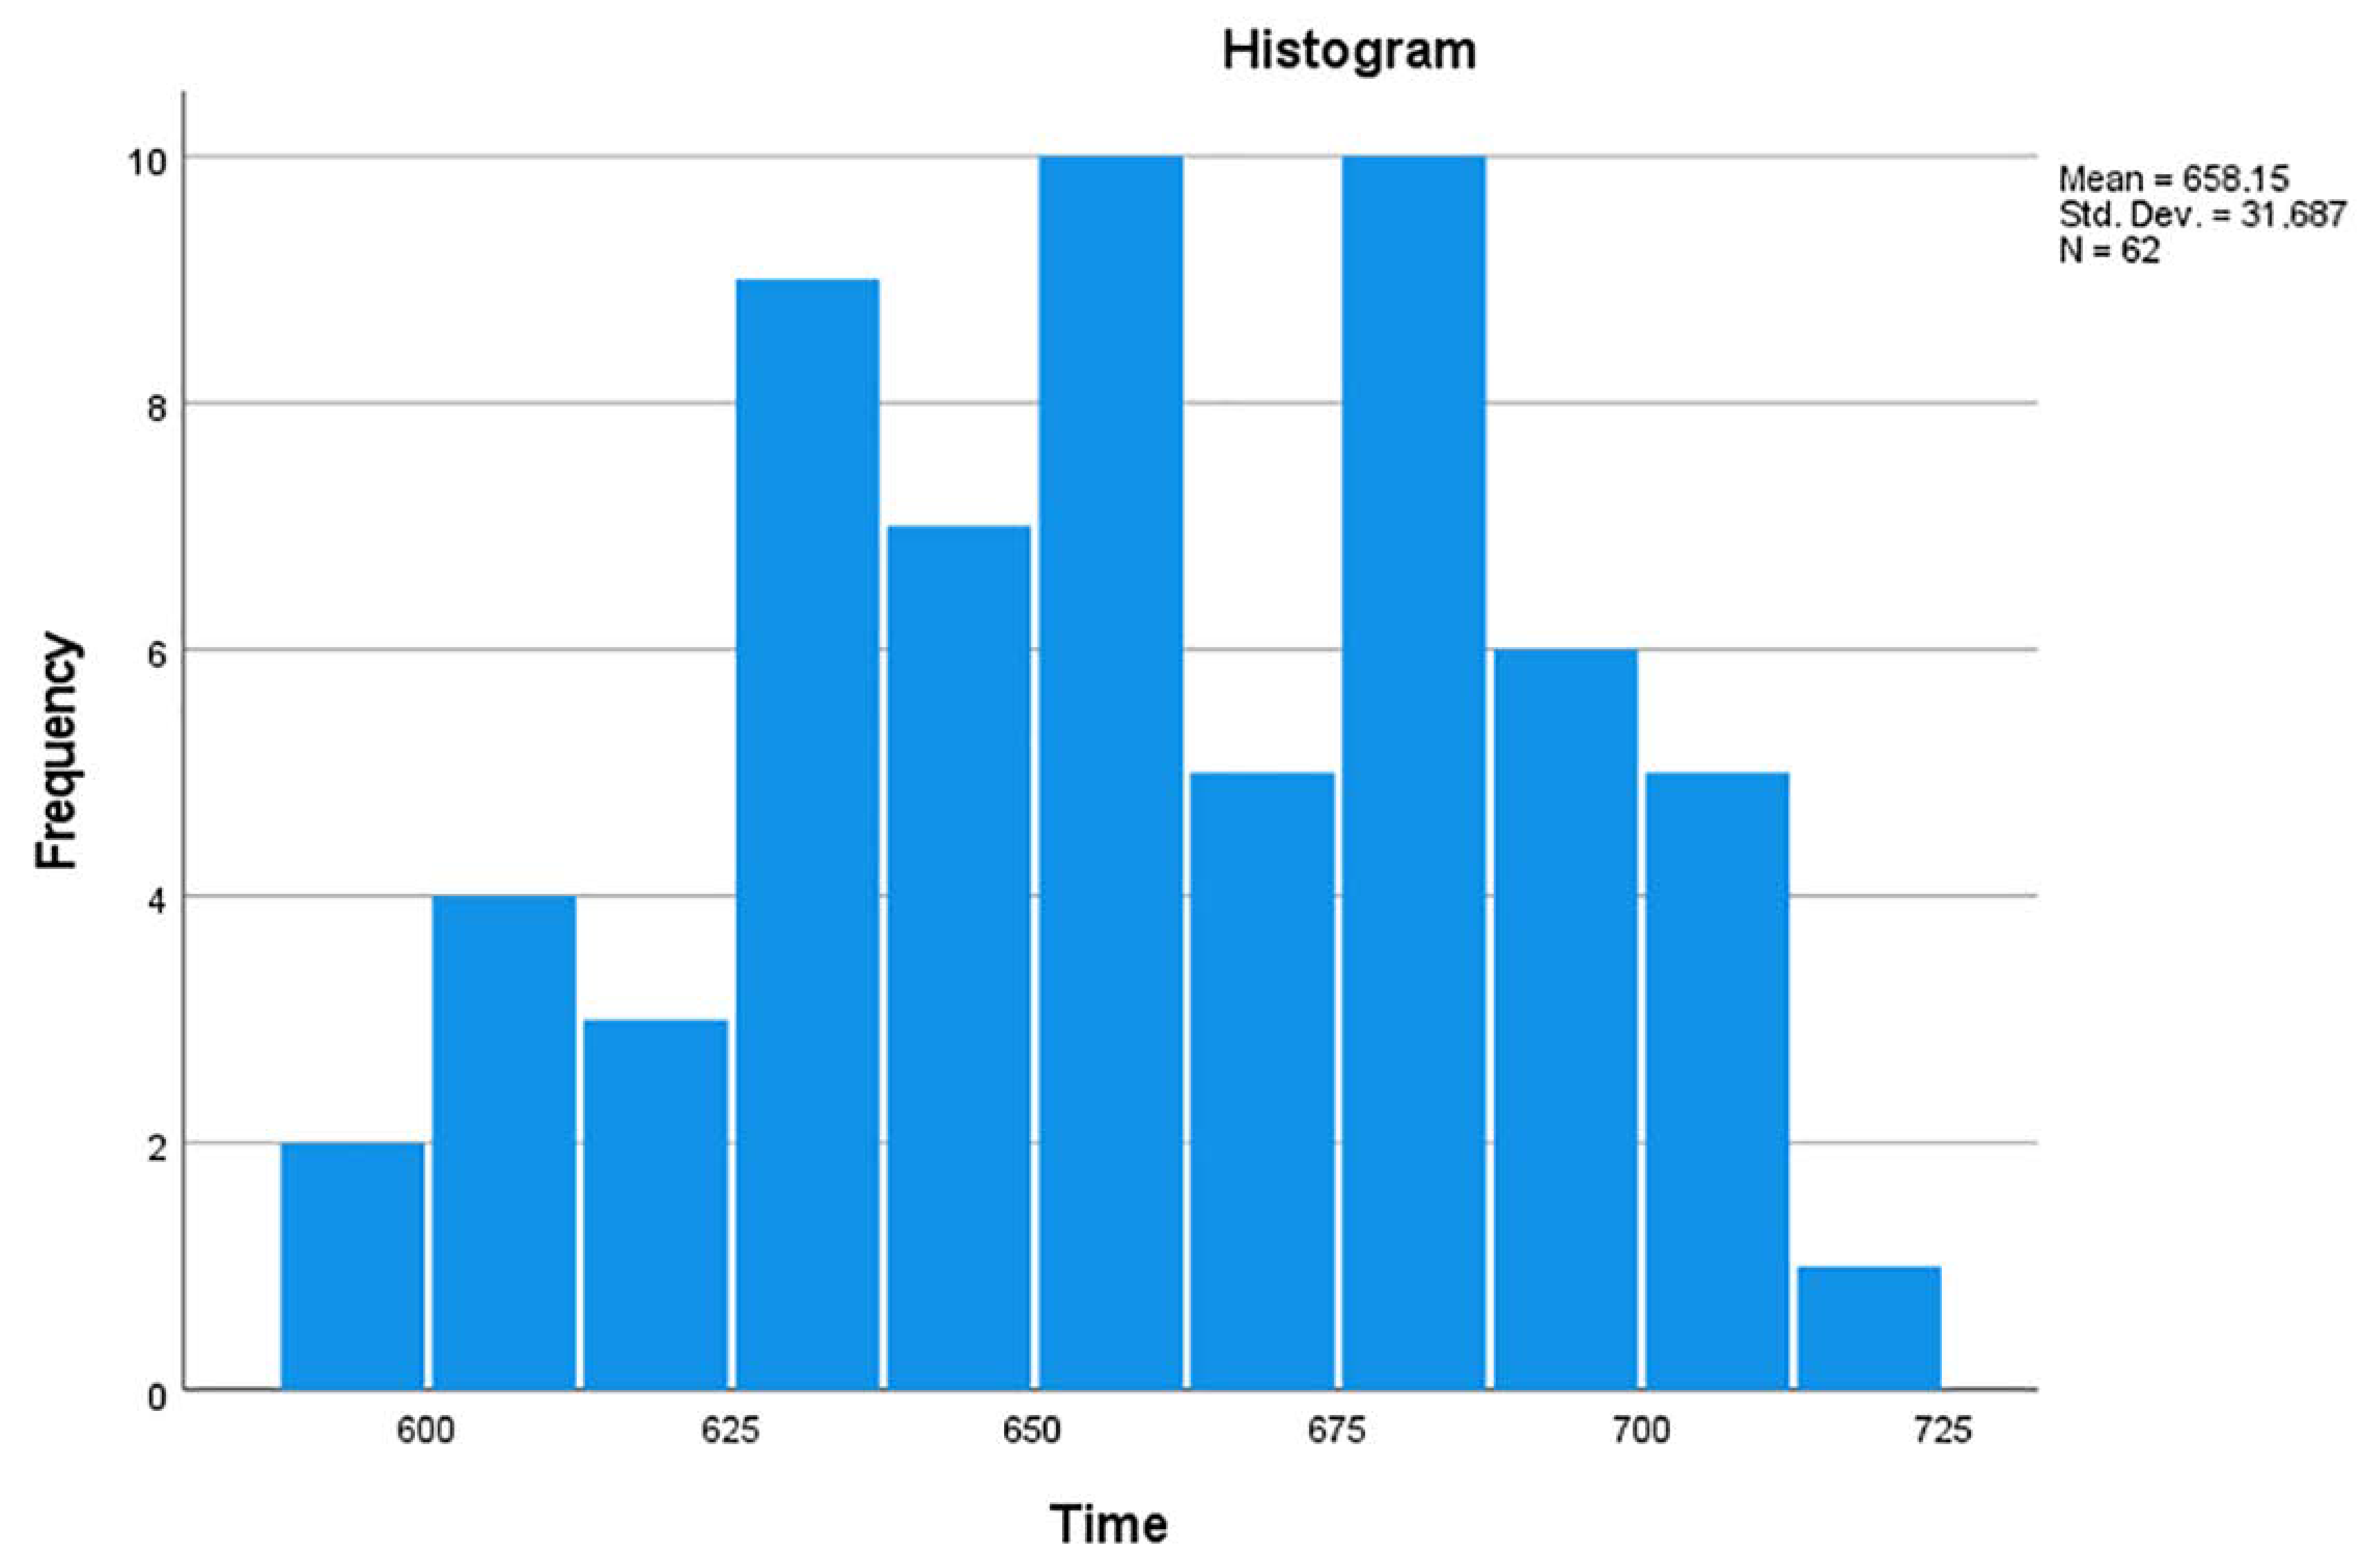
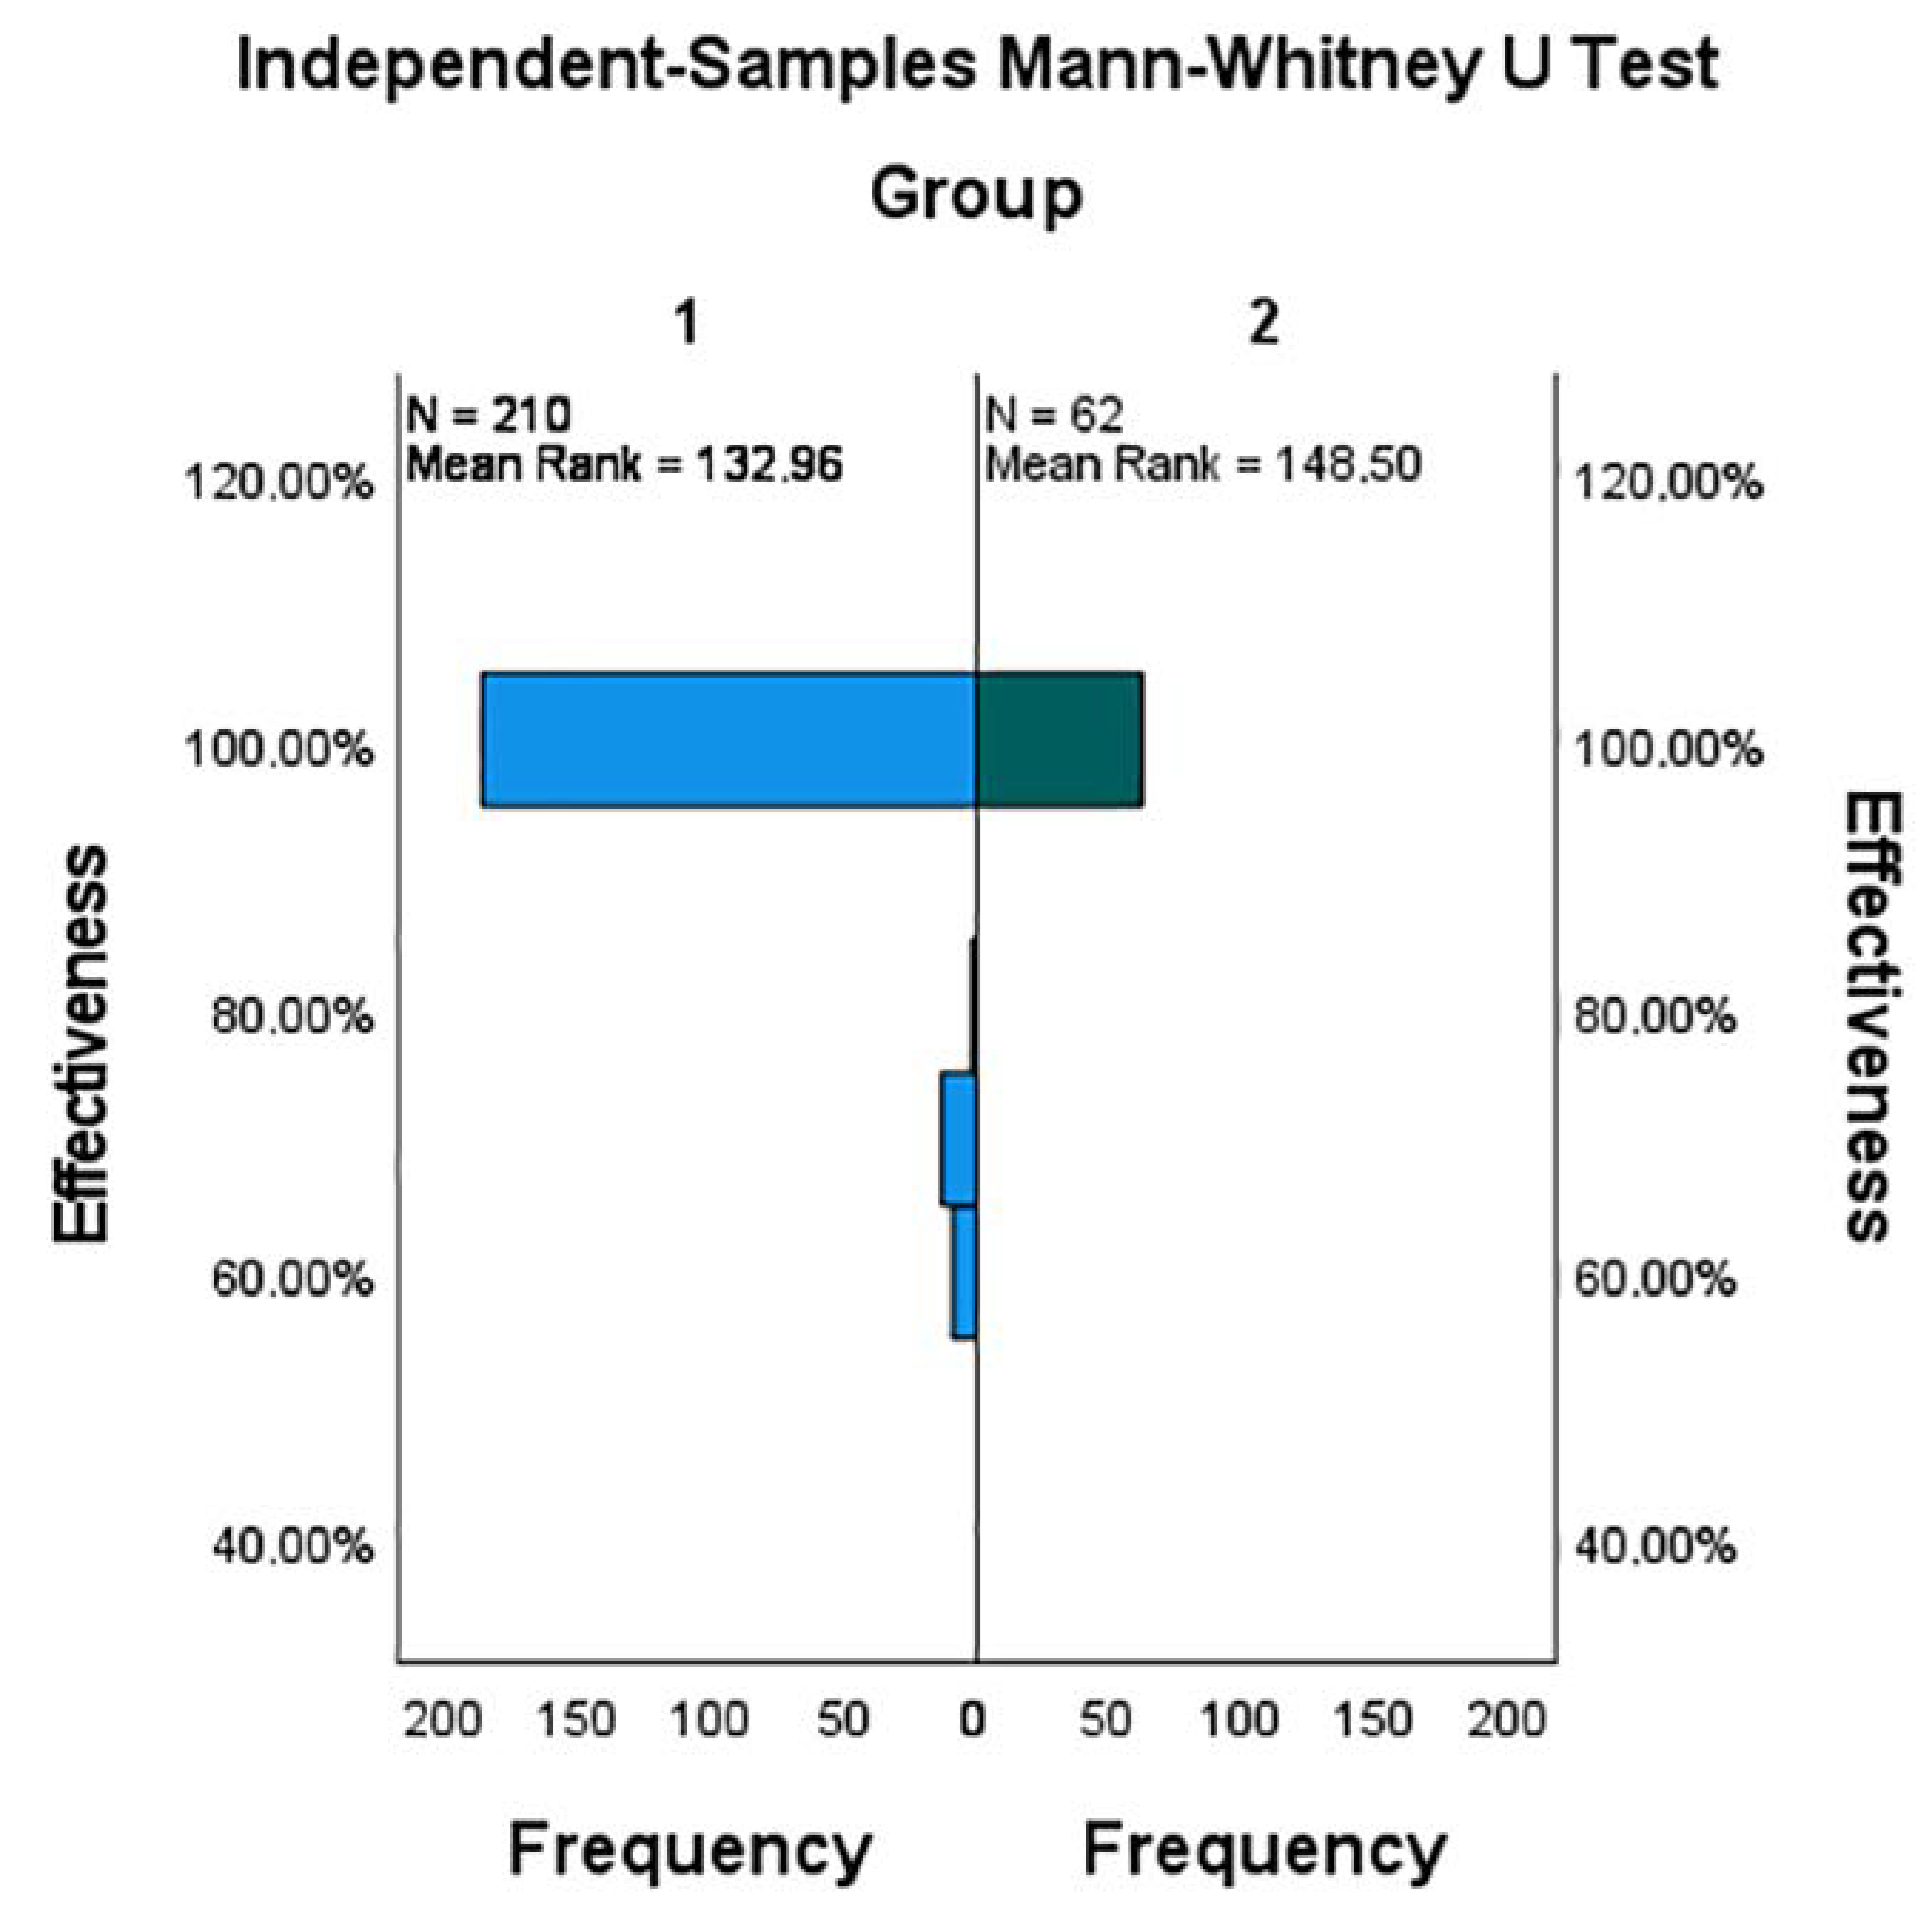
Section 3.4. Therefore, comparing the three indicators is carried out to accept or reject these hypotheses. Regarding the descriptive analysis of Group 1 (control group), the Efficiency of 64% was the most common with 27 people, while the percentage of 100% was only obtained by one individual. For Group 2 (experimental group), the highest occurrence was Efficiency at 84%, with seven people, and only one person obtained 100% efficiency. The Effectiveness indicator was calculated based on the number of tasks performed on the planned tasks. A total of 186 people from Group 1 completed the process, while 24 people, equivalent to 11.4%, did not complete the test. The results of the Effectiveness indicator for Group 2 were 100%, which means that all individuals completed the test using the mobile application. The questionnaire was used to measure Satisfaction (
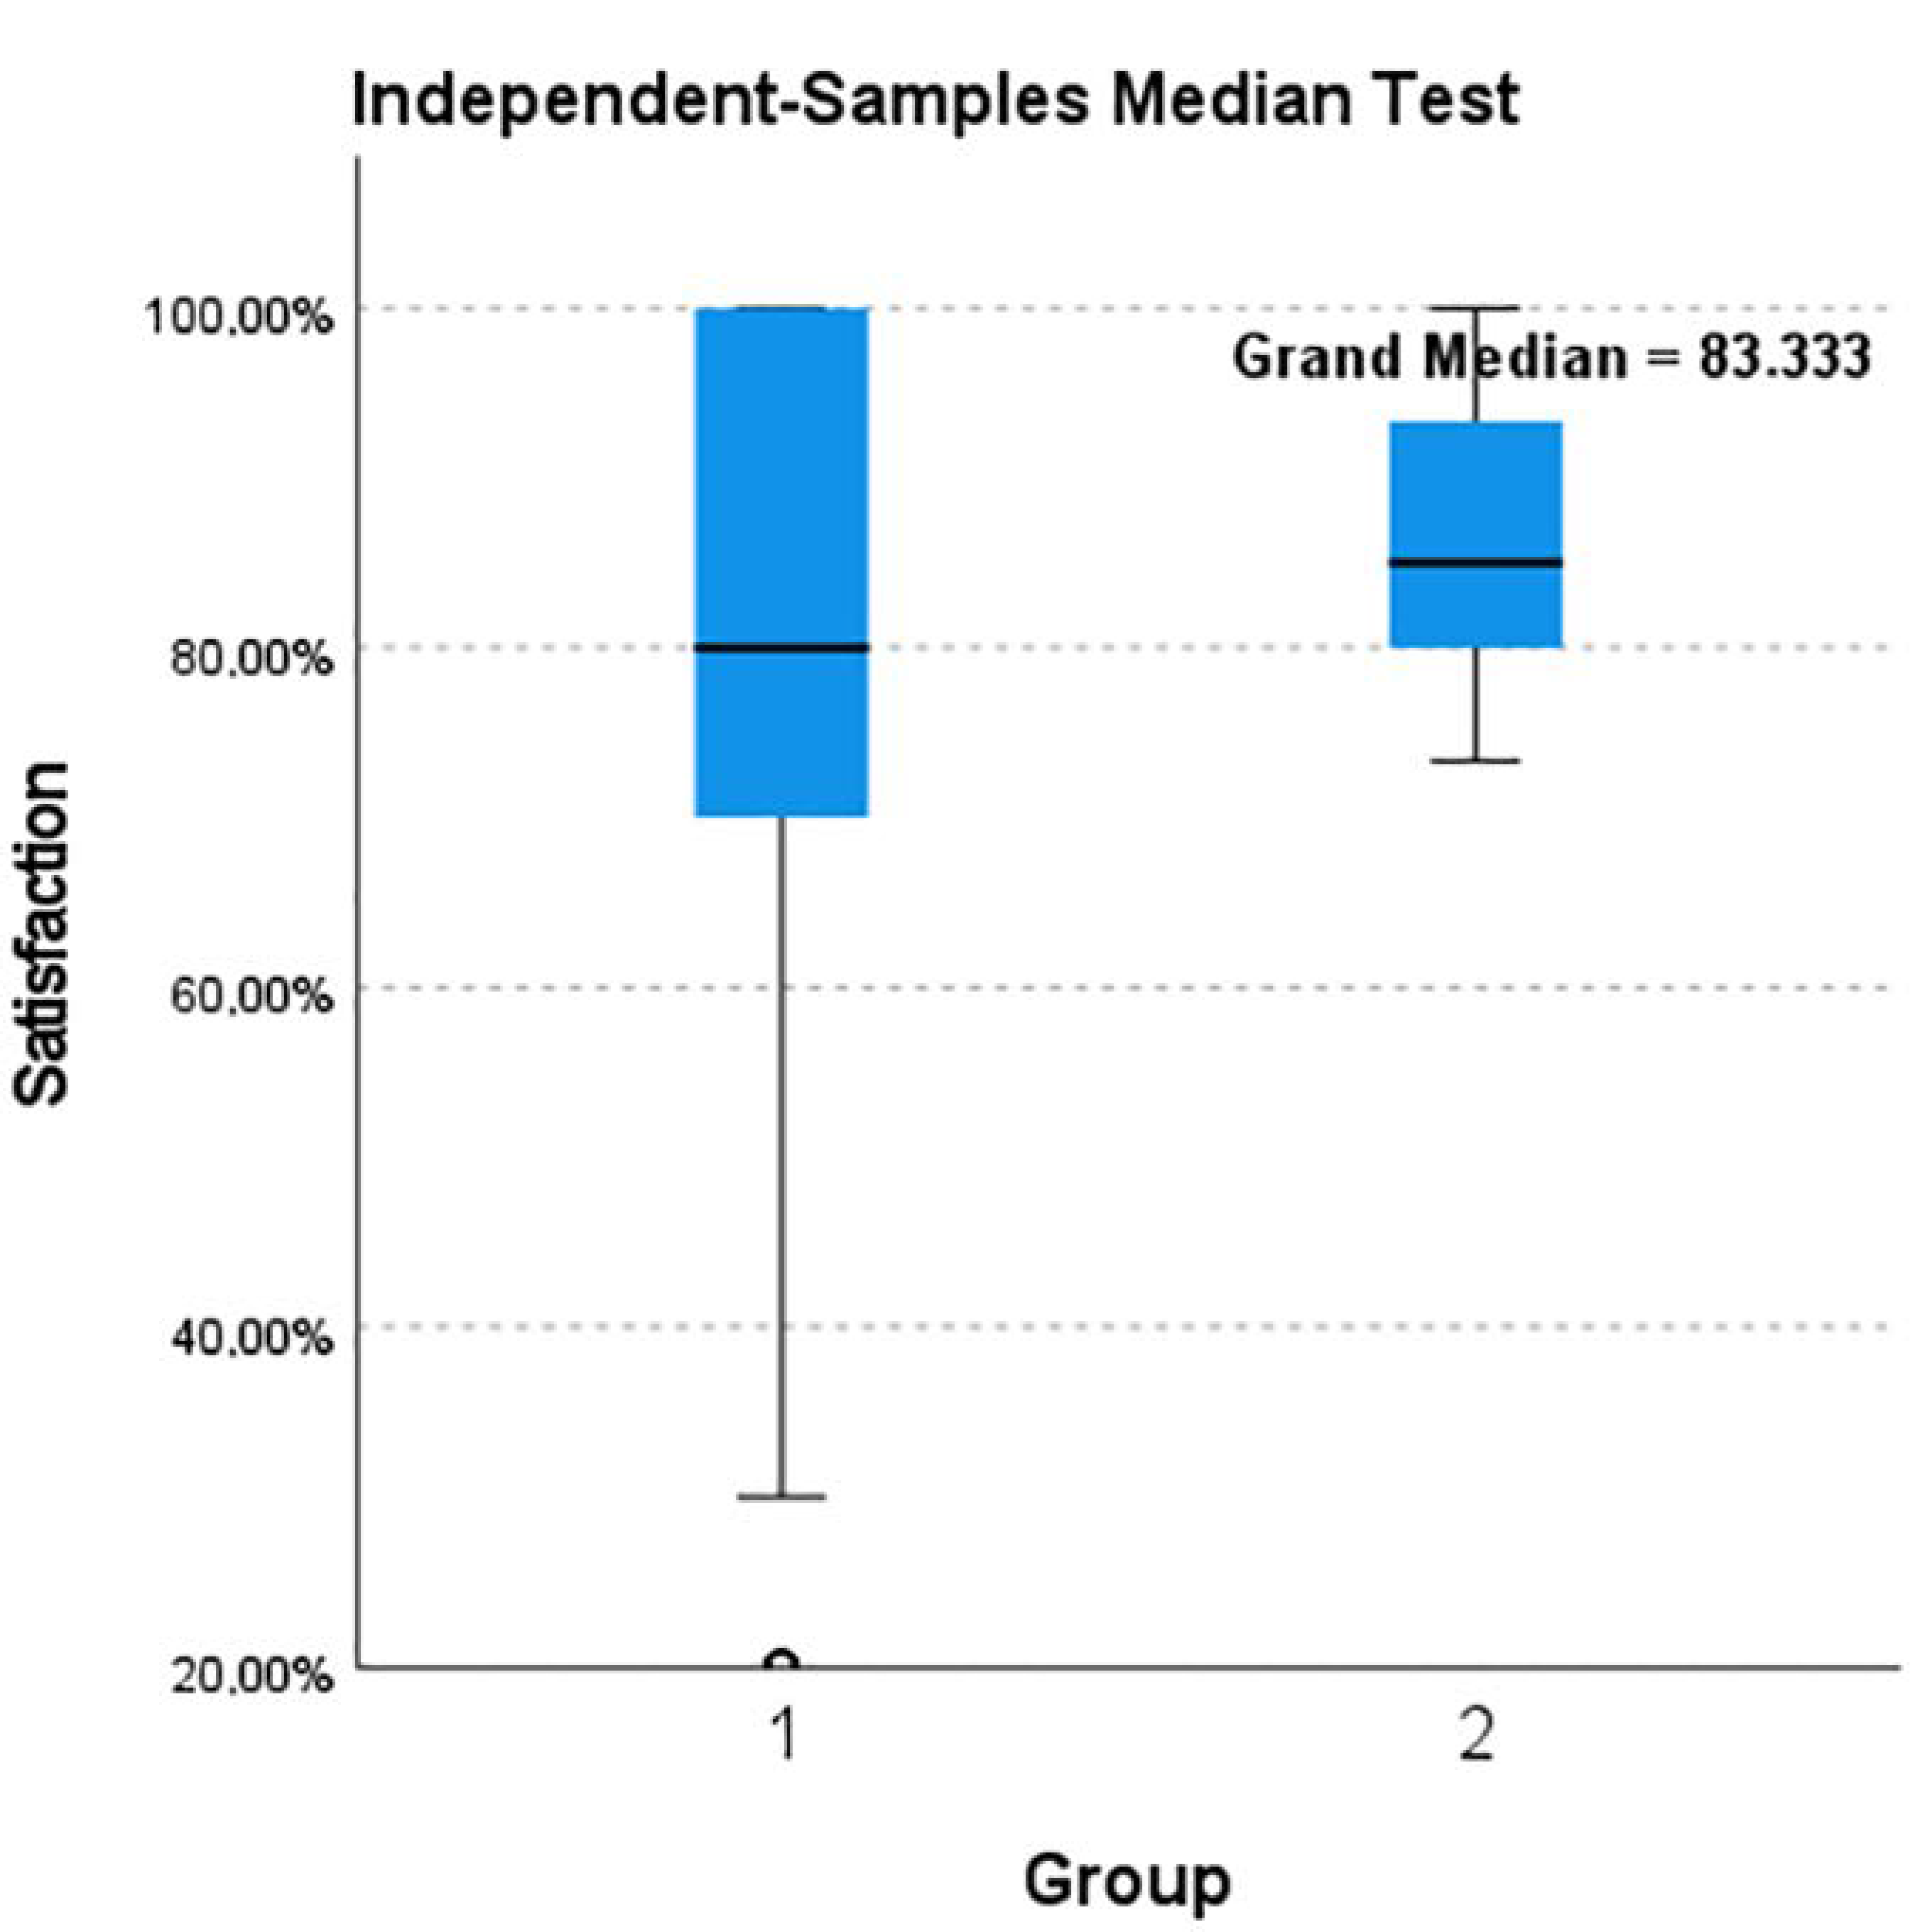
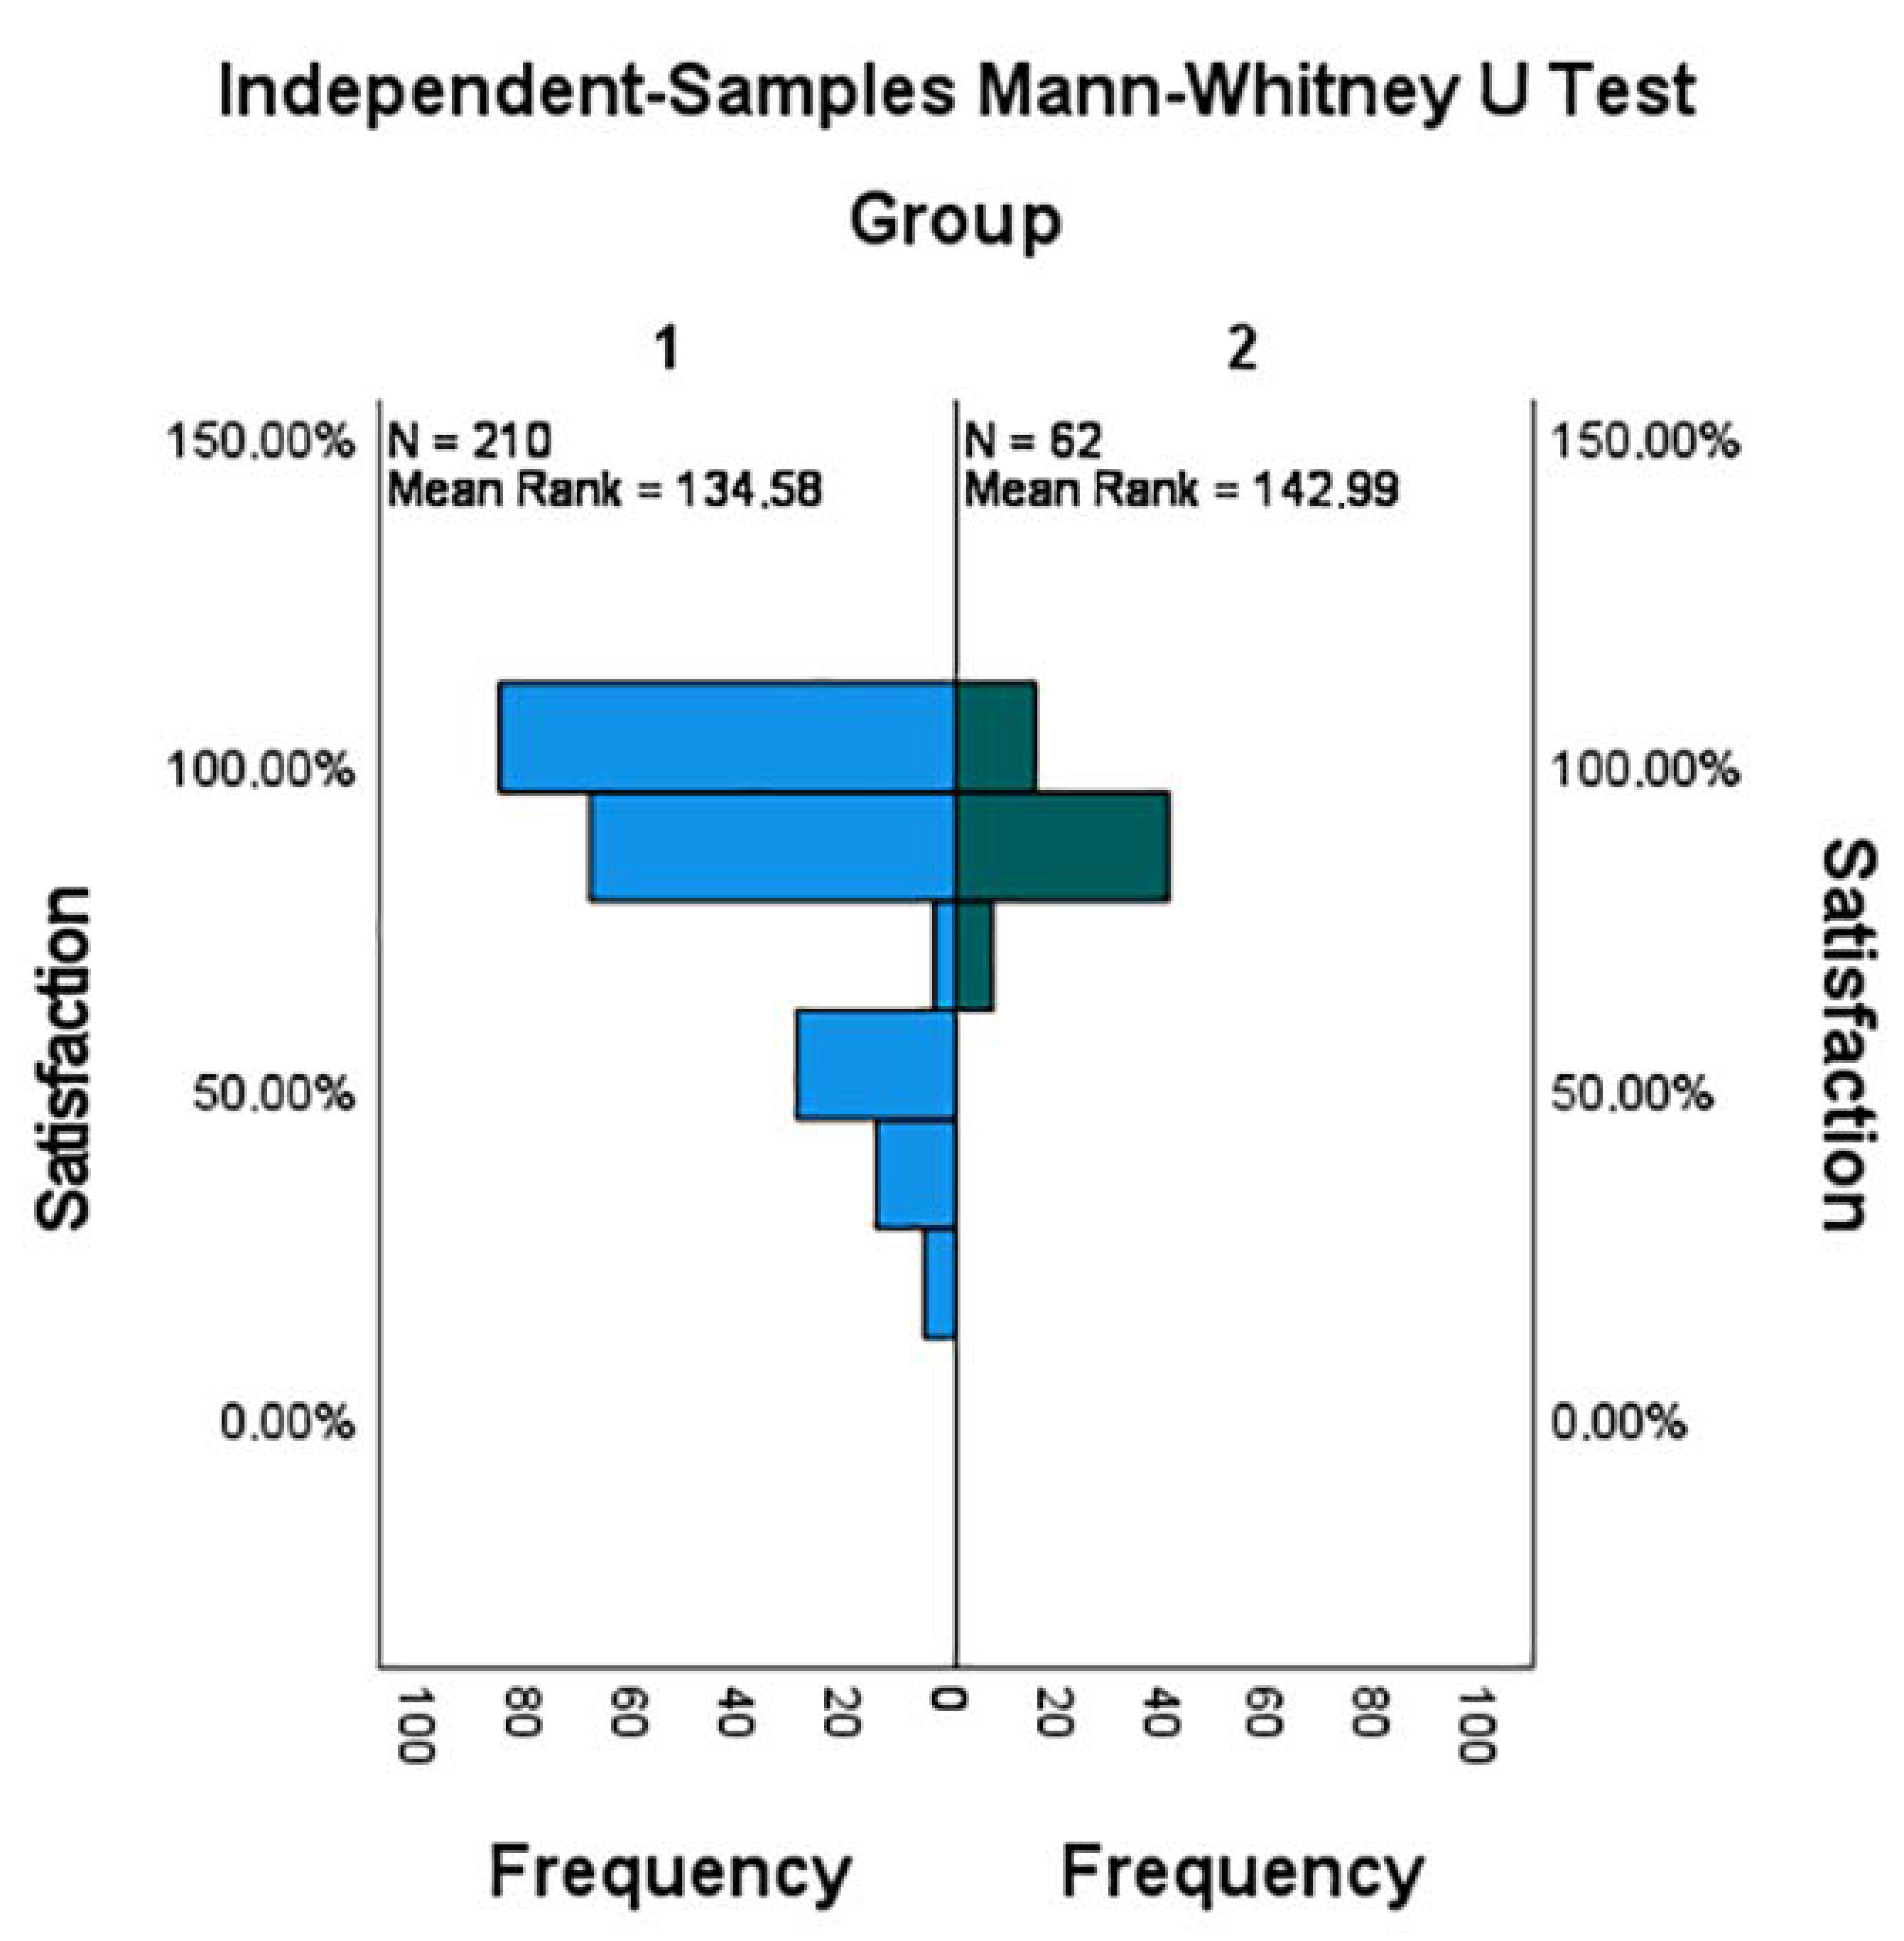
Table 6). For Group 1, the survey contained two questions. Question 1 obtained an average of 4.1 on a scale of 0 to 5; for question 2, the average was 4.0. In the case of Group 2, of the six questions in the questionnaire, two questions obtained an average of less than 4.0; this indicates that for future versions of the application, the design of the buttons and help labels must be improved.
7. Conclusions, Limitations, and Future Work
7.1. Conclusions
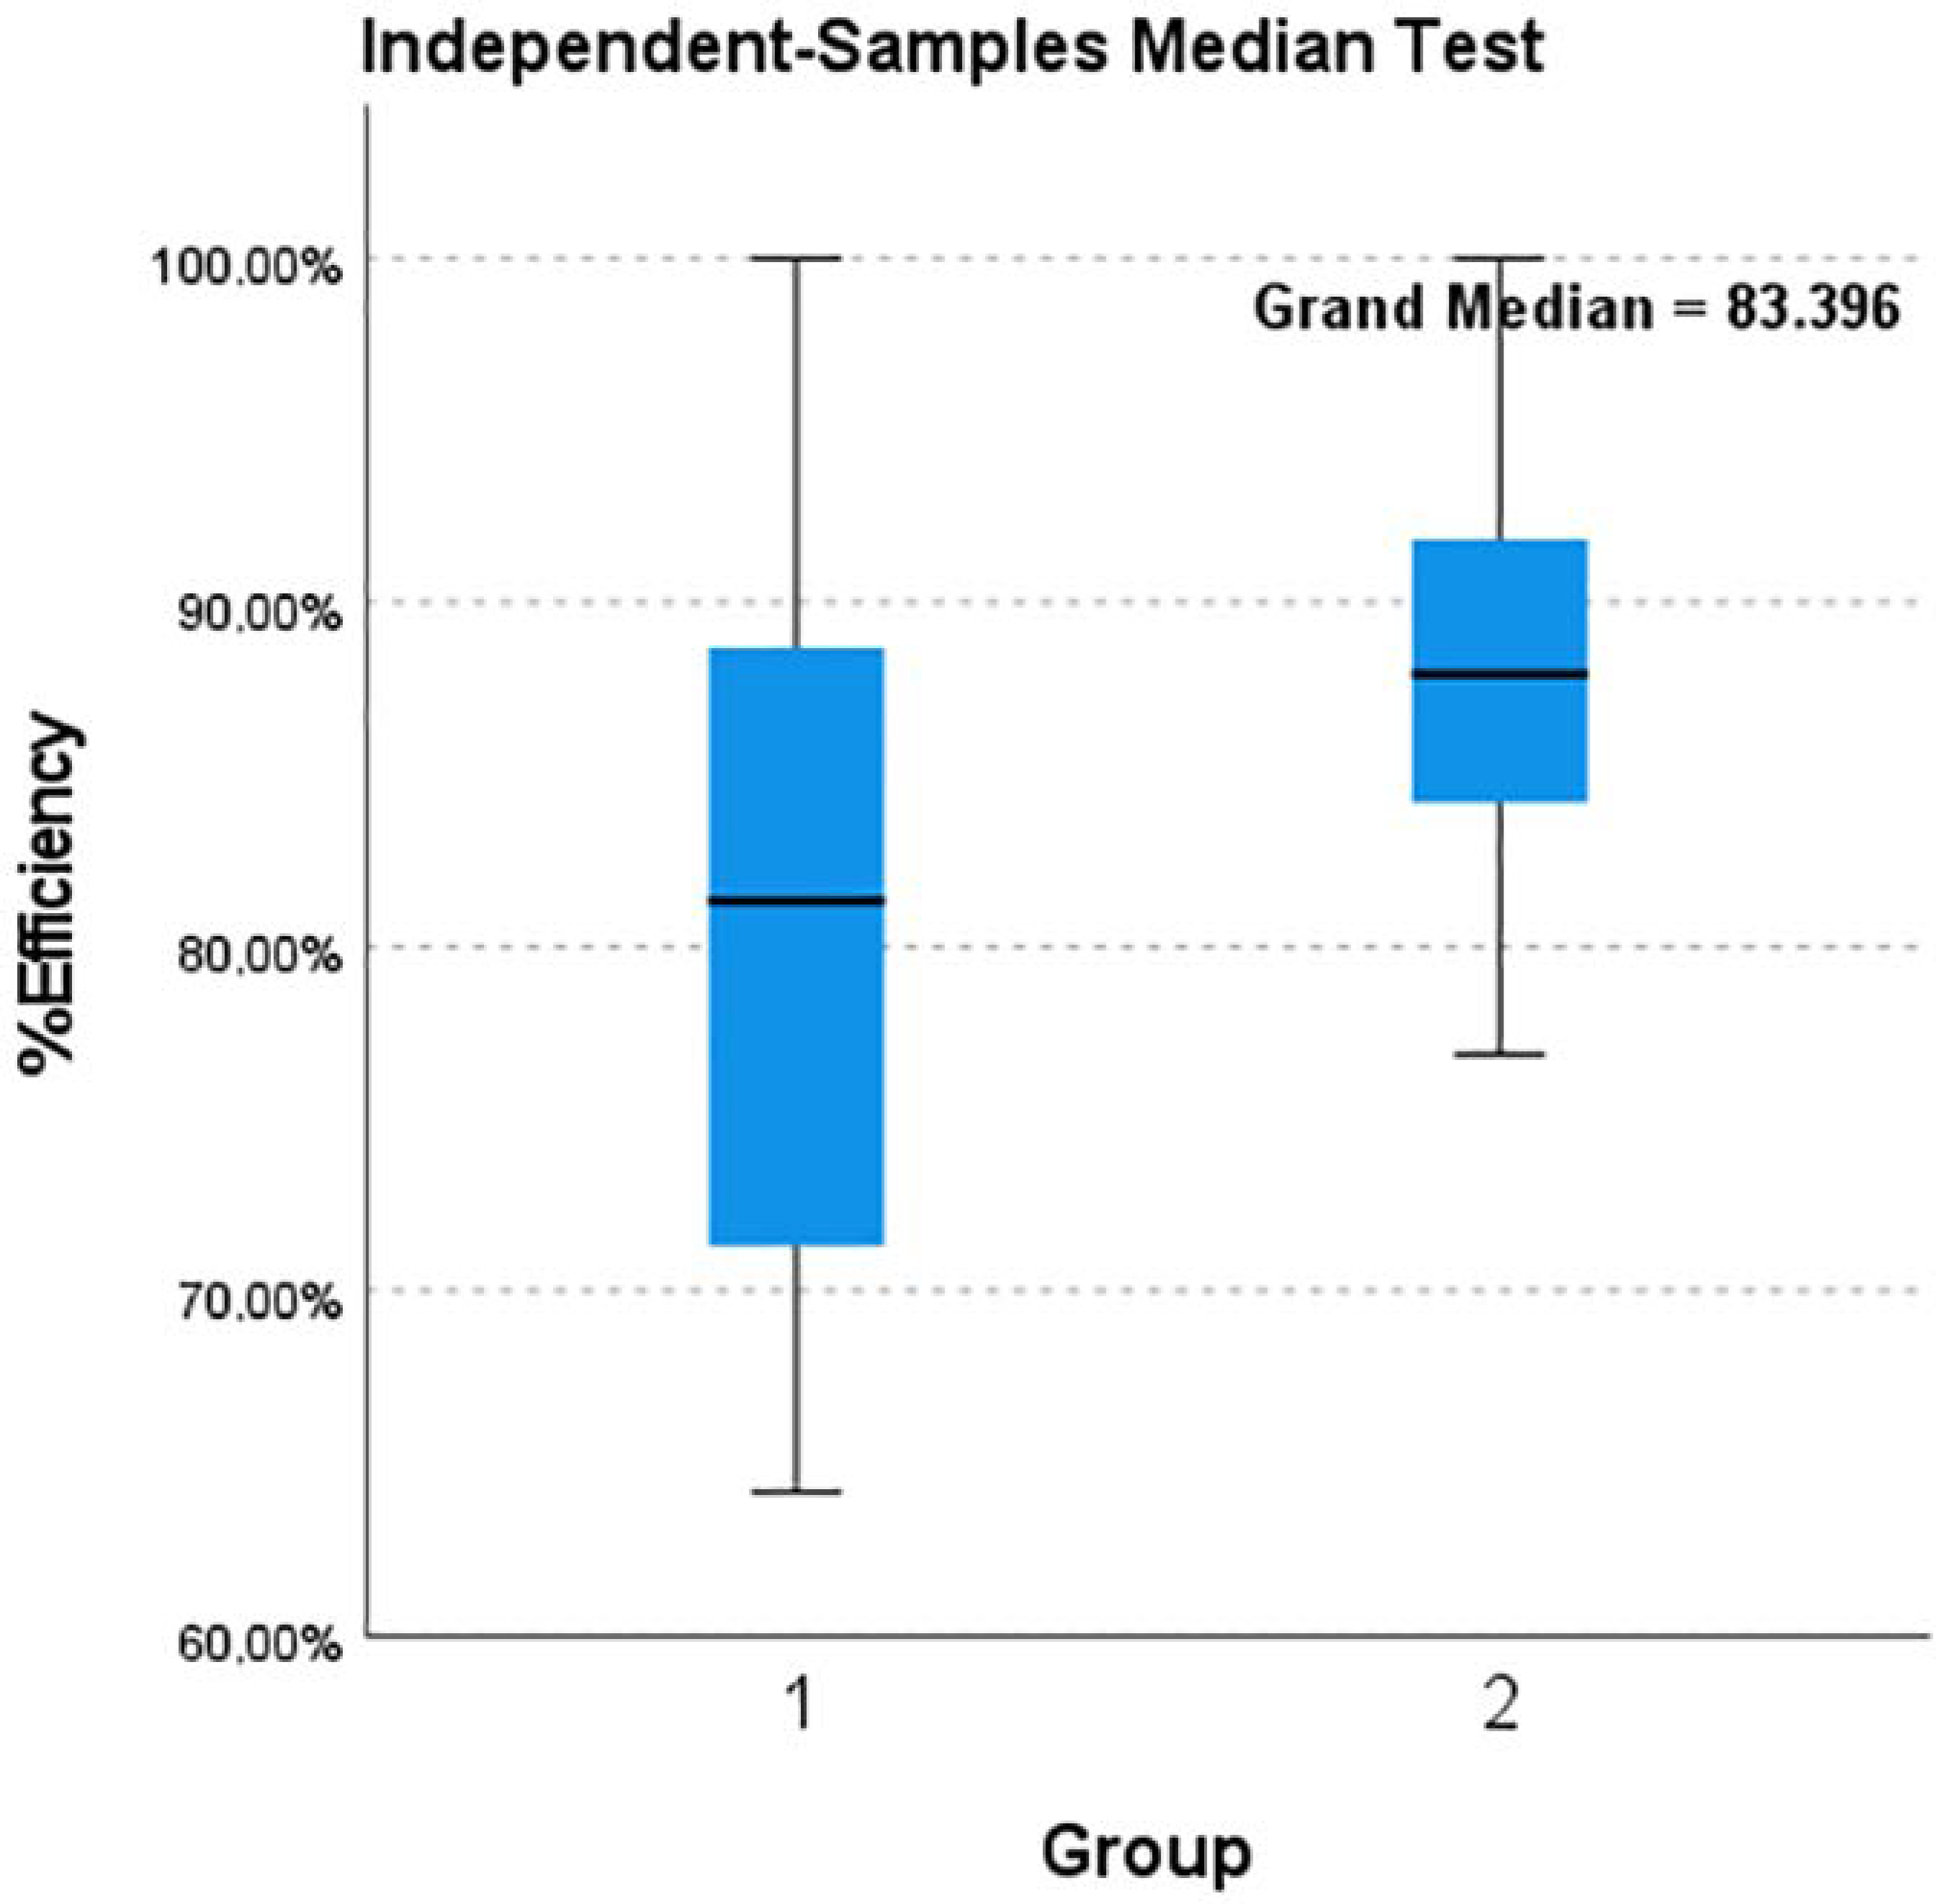
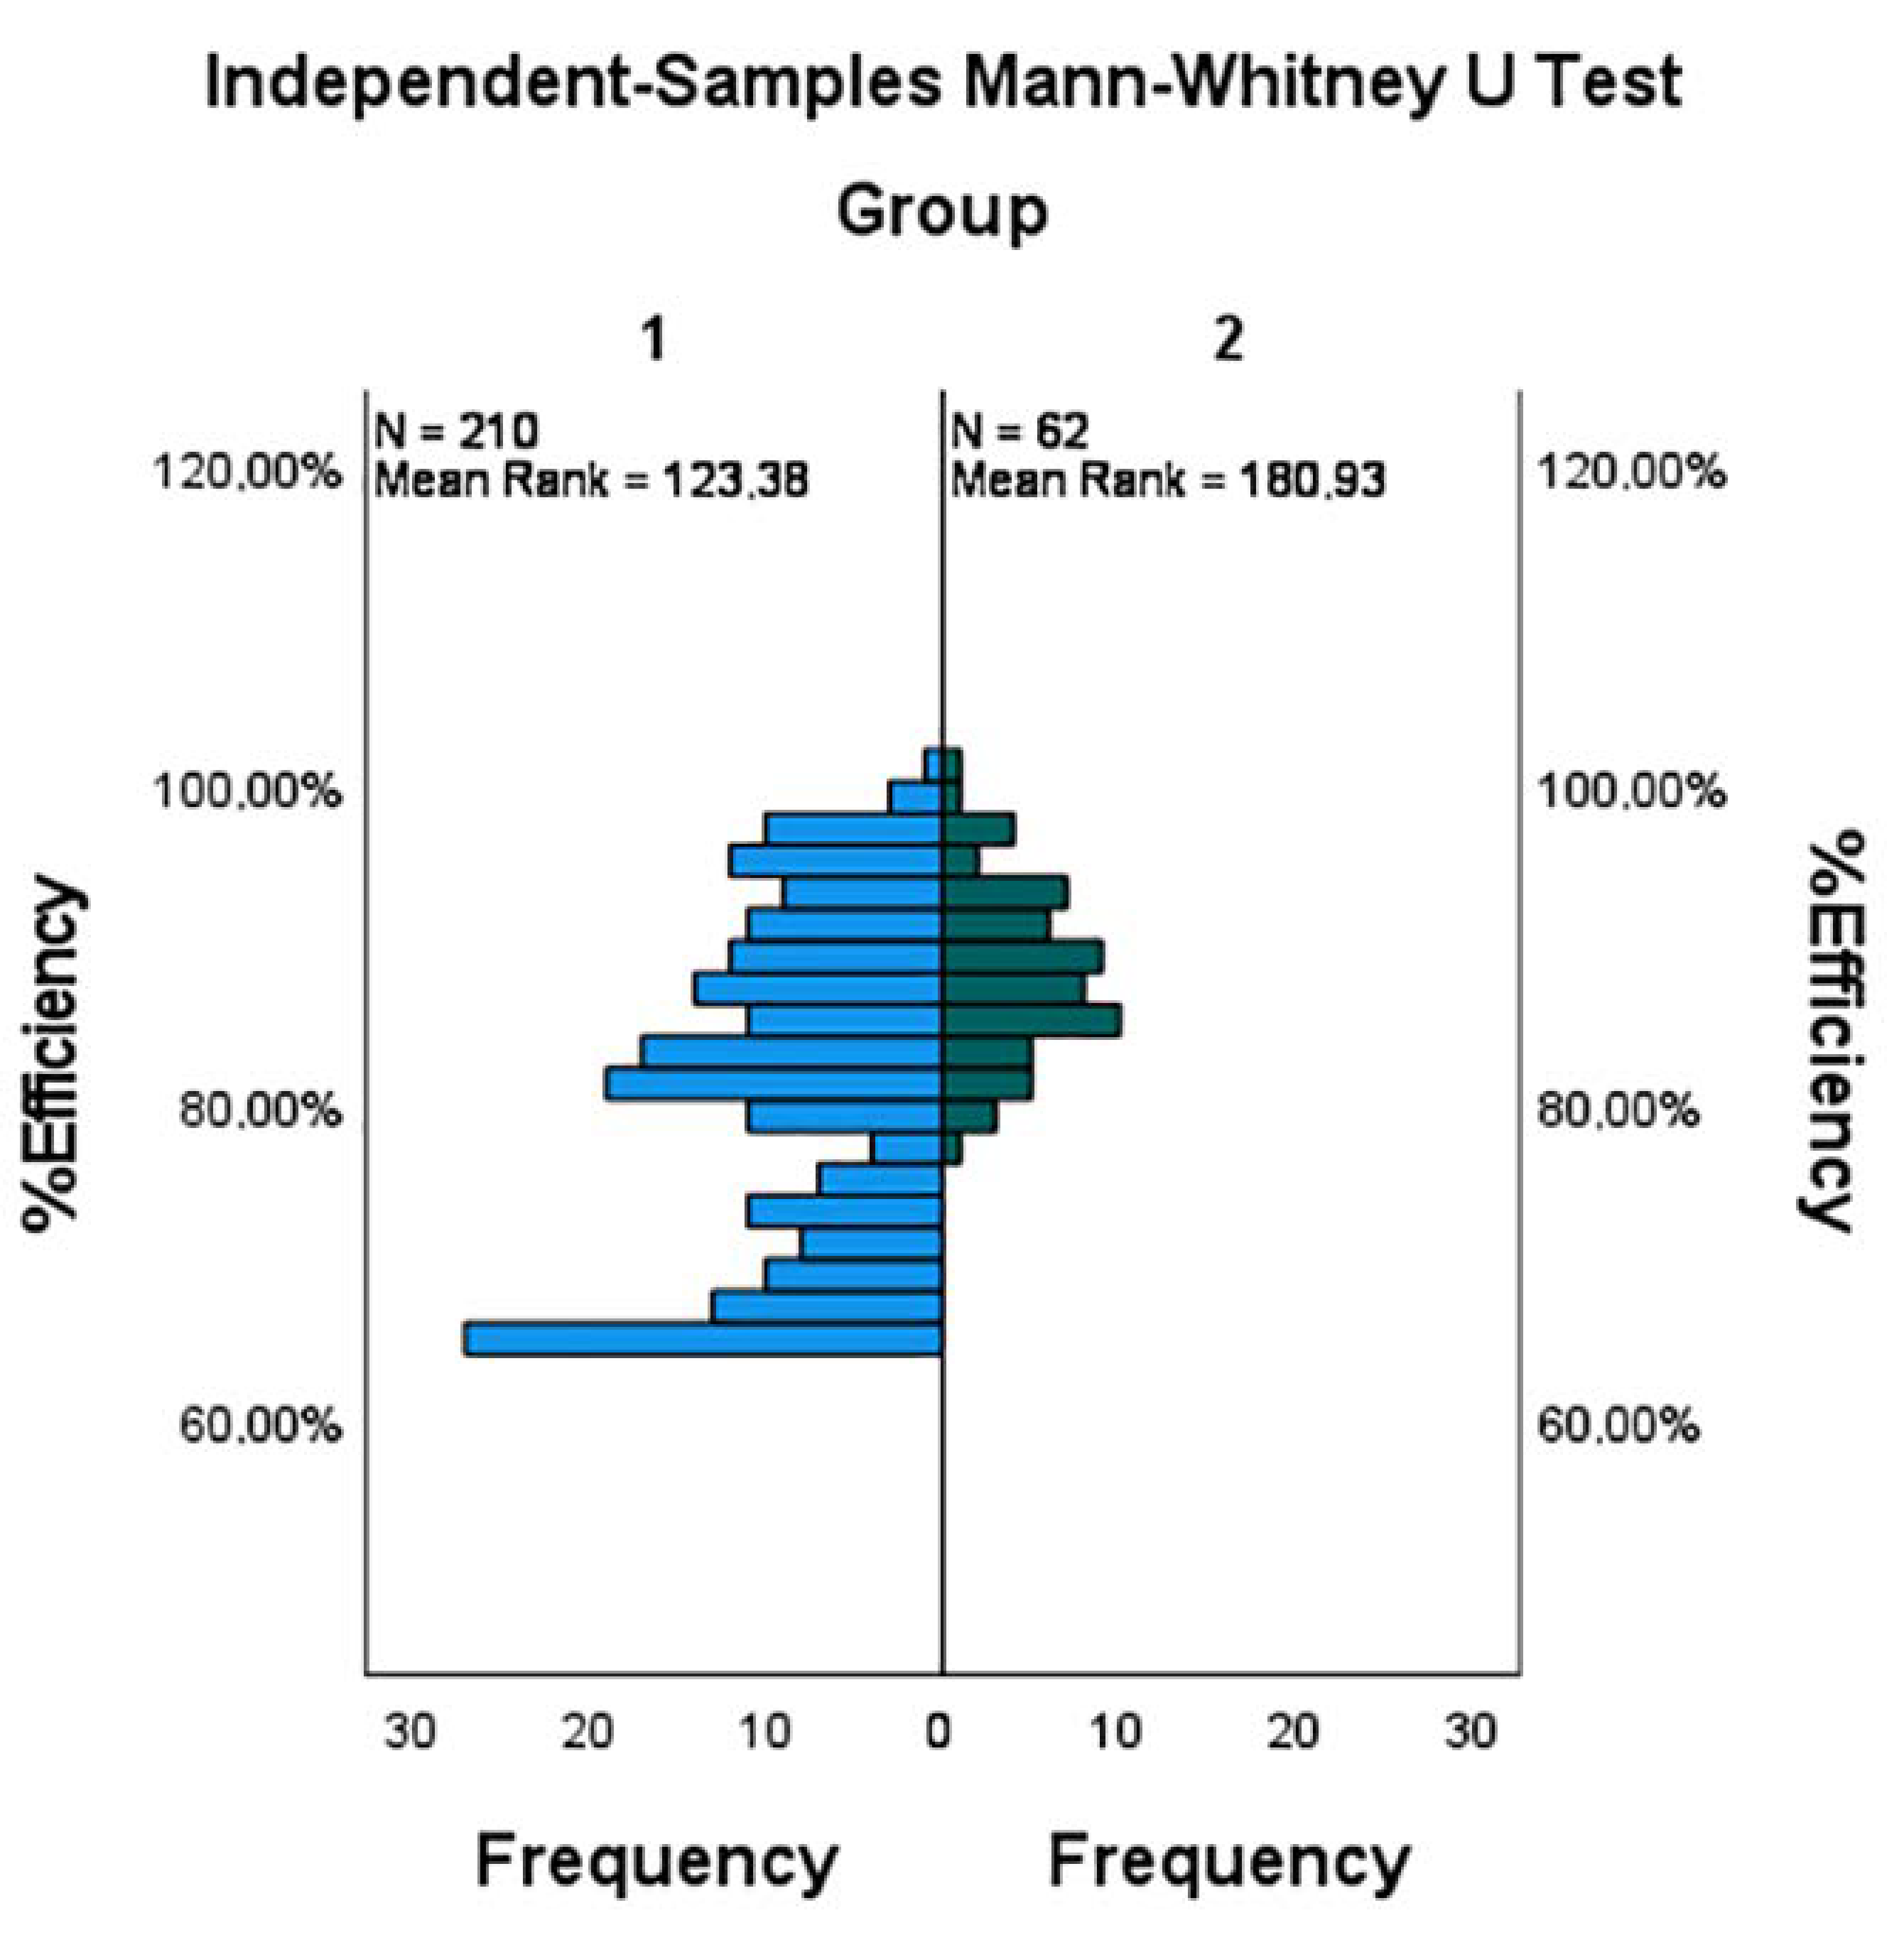
In this study, Levene’s test showed a significance value of less than 0.001 in the three indicators of Efficiency, Effectiveness, and Satisfaction, which indicated that the criterion of non-equal variances should be reviewed. When analyzing the significance column of the t-test for equality of means, the values of the three indicators were also less than 0.001. With these two findings, it was necessary to validate with another type of test that was not parametric to corroborate whether the difference in means identified was a reliable result. Therefore, a test of equality of means was carried out with the Mann–Whitney U. The data found corroborate that the Efficiency, Effectiveness, and Satisfaction indicators presented significantly different values in the two experimental groups of this study. The Efficiency indicator in the Student’s t-test presented a value less than 0.001, indicating that the null hypothesis must be rejected; this finding suggests that there is a difference in means between the control and experimental groups. Thus, Group 2, which used the mobile application for training, was more efficient in carrying out the process. In the Effectiveness attribute the significance value was also less than 0.001, indicating that Group 2 performs better with the mean statistic. Finally, Satisfaction also had a significance level of less than 0.001; consequently, for this indicator the null hypothesis is also rejected. This variable is not a decisive statistic because the satisfaction survey was parameterized according to the training context; therefore, the results are not comparable in a standard manner. For all of the above, using the two types of parametric tests with t-student and non-parametric tests with Mann–Whitney U allowed us to demonstrate the robustness of the results, greater validity of the conclusions, and greater confidence in the findings obtained.
To highlight, the information technology architecture proposed in this research can be applied in industrial scenarios with high-precision, high-cost machinery in their inventory that requires specialized personnel for its management. Considering that the adaptation and use of architecture depend largely on the human factor, it is important to indicate that when the experiment was carried out, a significant number of participants showed resistance to trying a different way of carrying out the cylinder process. These types of variable become important when adapting the architecture.
7.2. Limitations and Future Work
As future lines of this research the following are planned:
To have a comparative analysis of more combinations of ADFs and ADLs that allow for the identification of other relationships that can be complemented to comply with the ISO/IEC/IEEE 42010 standard.
To establish the input and output connections of a generic business architecture with the new proposed architecture, that the articulation between various architectures can be transparently carried out.
To continue the training process in companies to collect more relevant information from training scenarios. With this type of work, it will be feasible to apply statistical inference techniques to continue the improving process of the new architecture.


 ,
, 


