Article

Multi-Criteria Comparison of Energy and Environmental Assessment Approaches for the Example of Cooling Towers

Institute of Energy Economics and Rational Energy Use (IER), University of Stuttgart, 70565 Stuttgart, Germany
*
Author to whom correspondence should be addressed.
Appl. Syst. Innov. 2022, 5(5), 89; https://doi.org/10.3390/asi5050089
Submission received: 27 July 2022 / Revised: 29 August 2022 / Accepted: 1 September 2022 / Published: 5 September 2022
(This article belongs to the Section Industrial and Manufacturing Engineering)

Abstract

:
Cooling towers remove economically or technically unusable heat using considerable amounts of electricity and, in many cases, water. Several approaches, which vary in methodology, scope, and level of detail, are used for environmental evaluations of these cooling systems. Although the chosen approach has a significant impact on decisions made at the plant level, no methodology has yet been standardized for selecting the approach that best serves the objectives of the evaluation. Thus, this paper provides comparison criteria for the systematic selection of suitable evaluation methods for cooling towers and classifies how the methods score in this respect. These criteria, such as ‘life cycle thinking’, ‘inventoried physical quantities’, ‘temporal resolution’, ‘formalization’, and ‘data availability’, are grouped by overall evaluation objectives such as ‘thoroughness’, ‘scientific soundness’, and ‘usability’. Subsequently, these criteria were used to compare material flow analysis, energy analysis, environmental network analysis, life cycle inventory, life cycle assessment, environmental footprint methods, emergy analysis, exergy analysis, and the physical optimum method. In conclusion, material flow analysis is best suited for the analysis of cooling towers when impact assessment is not required; otherwise, life cycle assessment meets most of the defined criteria. Moreover, only exergy-based methods allow for the inclusion of volatile ambient conditions.

1. Introduction

Section 1.1 summarizes the importance and challenges of efficiency assessments for cooling towers. Moreover, Section 1.2 provides an overview of the criteria defined in previous studies for method comparison. Subsequently, we set the objective of this paper in Section 1.3.

1.1. Background of Evaluating Cooling Towers

Heat removal is technically unavoidable, and increasing temperatures due to climate change and more data centers make cooling systems even more essential. Information technology even converts most of the electricity input into waste heat. To mention other examples, in thermodynamic cycles, the initial state of the working fluid is reached by removing waste heat. Moreover, irreversibility due to friction, electrical resistance, and other reasons leads to waste heat.
Waste heat utilization is technically or economically unfeasible in many cases due to low temperatures. In such cases, cooling systems must protect the equipment from overheating. Most cooling systems are associated with considerable energy consumption and thus environmental impacts. For example, a hybrid cooling tower’s specific direct energy consumption amounts to approximately 23 kWel/MWth [1] (p. 69). The water consumption of hybrid cooling towers is about 0.5 m3/h/MWth, whereas that of an open once-through system amounts to 86 m3/h/MWth [1] (p. vi). Thus, cooling towers cause significant environmental impacts that require systematic evaluation using energy and environmental assessment methods to identify improvement potential.
However, some characteristics of cooling systems make it difficult to analyze their energy efficiency and environmental impact. Firstly, the uniform quantification of the physical benefits of cooling units across plants is challenging. In life cycle assessment (LCA), the ‘quantified performance of a product system for use as a reference unit’ is called the functional unit (ISO 14040, [2]). Previous studies defined the functional unit of a cooling tower as ‘1 kWh of electricity produced by the [upstream] plant […] referred to […] 1 year’ [3] (p. 1079), the ‘1 MW heat rejection capacity for a period of 1 year’ [4] (p. 50), or the ‘cooling of 1 kg water from 35 °C to 28 °C in Germany for the overall usage time’ [5] (p. 140). These different functional units make comparing the performance of different units nearly impossible.
Furthermore, cooling tower operation highly depends on ambient temperature and humidity. Dynamic analysis reveals this correlation, unlike a static analysis integrated over time. In addition, cooling systems often consist of several coolers and chillers, the interaction of which differs depending on the ambient conditions. In many cases, free cooling is sufficient at low outside temperatures, and yet, chilling technology must be installed for periods of high ambient temperatures. Therefore, it is difficult to evaluate the efficiency of individual cooling units. The electricity consumption of cooling towers is lower at high temperatures because the refrigeration unit covers the cooling demands and not because of higher efficiency.
Several methods and indicators exist to evaluate the thermal performance of cooling towers. These indicators assess the evaporated water and heat transfer rate and include the tower characteristic ratio ‘KaV/L’ [6], the number of transfer units (NTU), effectiveness-NTU [7], and the Merkel number, as per Merkel [8], Poppe [9], and others. Moreover, the cooling tower effectiveness ε is the ratio of actual and maximum heat transfer [10]. Hence, these indicators evaluate the extent to which the required temperature (∆t) [11] or the required heat transfer is achieved. However, more heat transfer is useless if the required heat transfer or temperature has already been achieved. Furthermore, electricity consumption is omitted; water consumption is only considered by the amount of evaporated water. These approaches calculate the water outlet temperature to design cooling towers but do not evaluate their energy efficiency and environmental impact.
The following sections show that these challenges are handled differently across the different energy and environmental assessment methods. Based on these challenges and further aspects, we defined comparison criteria to allow for the selection of the most suitable method in each specific case.

1.2. Previous Research on Criteria-Based Method Comparison

To define the comparison criteria, we extensively evaluated previous studies that include criteria for method comparison. These studies provide approaches for classifying and comparing some of the existing methods to analyze their feasibility. Some method comparisons rest upon specific criteria, such as the usability, maturity, and theoretical soundness of the methods [12,13,14,15].
Table 1 outlines the methods and criteria covered by previous studies. The investigated methods are physical input–output table (PIOT), substance flow analysis (SFA), material flow analysis (MFA), energy analysis, ecological network analysis (ENA), life cycle inventory (LCI), LCA, carbon footprint, water footprint, ecological footprint, material-input per service unit (MIPS), emergy analysis, and exergy analysis. The table only includes the studies that, on the one hand, focus on environmental assessment methods and, on the other hand, that also use comparison criteria. Besides these studies, some investigations compare methods without this kind of criteria, and some other studies use criteria but compare other methods not concerning environmental assessment.
Based on specific criteria, some studies classify methods for decision-making, either on a business or political level. This usually requires all three dimensions of sustainability: environmental, economic, and social, to be considered. Ness et al. [14] categorize 32 sustainability assessment tools, which partly overlap, and illustrate them in different categories. They distinguish between indicators, product-related assessment, and integrated assessment. Sala et al. [20] introduce seven criteria for comparing 18 assessment tools and distinguish between integrated and sustainability assessments. The latter is described as being more comprehensive. Singh et al. [21] provide an overview of 41 sustainability indices regarding the number of sub-indicators, scaling, weighting, and aggregation. Sustainability assessment methods extend beyond a purely physical and scientific assessment due to their rather qualitative evaluation. Moreover, Aktsoglou and Gaidajis [16] as well as Angelakoglou and Gaidajis [22] apply five criteria represented by three questions to assess 13 methods.
This research focuses on environmental aspects. Smeets and Weterings [23] categorize environmental indicators distinguishing between drivers, pressures, state, impact, and response called the DPSIR framework. For the comparison of environmental impact assessments, previous studies also provide some criteria. The International Association for Impact Assessment defines 24 principles to follow. Assessments should be purposive, rigorous, practical, relevant, efficient, adaptive, participative, interdisciplinary, credible, integrated, transparent, systematic, etc. [24]. However, these criteria are vague and partly opposite to one another. Baumann and Cowell [17], Loiseau et al. [13], Rodríguez et al. [12], and others (cf. Table 1) propose more precise criteria that can be rated more clearly. For example, the criterion ‘life cycle thinking’ can be fulfilled clearly for different standard methods.
Most studies refer to a particular application area. For example, several authors address agriculture, farming regions, or territories [12,13,25]. In this area, spatial differentiation is crucial. Aktsoglou and Gaidajis [16] refer to ‘spatial entities with anthropogenic activities’ in general. Furthermore, Finnveden et al. [19] examine four environmental assessment methods referring to the energy sector. Klemm and Wiese [26] analyze the suitability of sustainability indicators for urban energy systems. The assessment of petrochemical processes is examined by Abbazadeh and Hassim [27]. Blanc and Friot [15] consider a whole group of studied objects: traded goods and services.
In summary, no criteria-based analysis of the energy and environmental assessment methods for cooling technologies has been conducted as of yet. Thus, no standardized method provides all-embracing criteria for that purpose. Furthermore, previous studies defined criteria and presented them as parallel and mostly independent.

1.3. Objectives of this Work
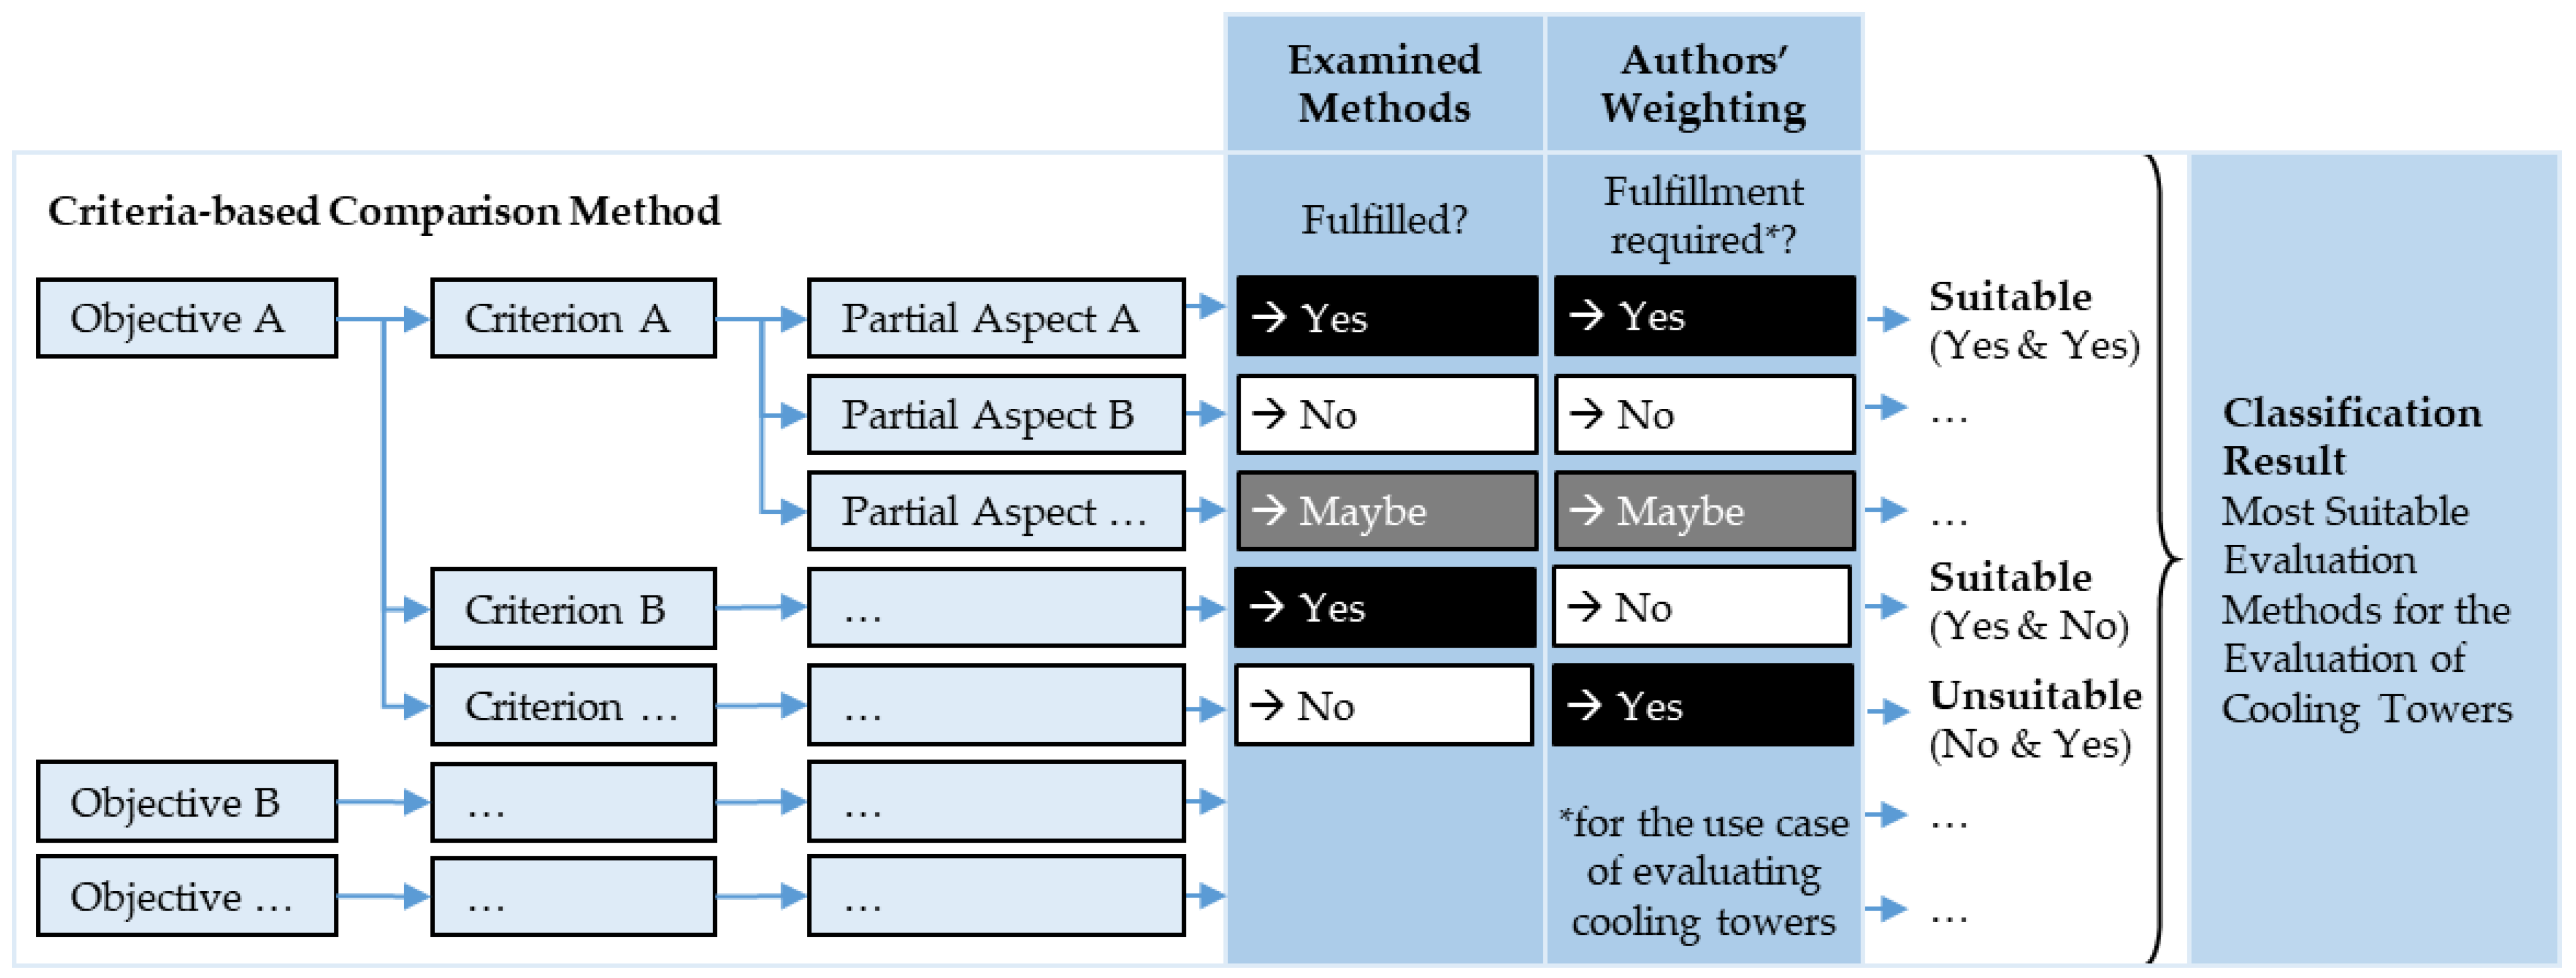
We argue that energy and environmental assessment methods differ significantly in their suitability for a specific cooling system assessment. A systematic selection process to identify the most suitable method and, if necessary, to extend and combine methods is therefore essential. The long-term goal is to standardize a criteria-based comparison method for systematically selecting an assessment method for each use case.
Hence, this paper aims to provide comparison criteria that address the difficulties and requirements for evaluating cooling towers. The definition of the overall objectives of the assessment methods clarifies the relationship between the criteria. For instance, specific criteria such as ‘usability’ and the degree of formalization are not independent; instead, formalization affects usability. Therefore, we defined usability as an objective in this paper and formalization as a next-level criterion. This paper’s novelty is that, firstly, the criteria are related to each other through overall objectives and partial aspects. Secondly, the comparison criteria are extended for assessment methods for evaluating cooling towers. Due to the methodological challenges in assessing cooling towers, we estimate the relevance of the method comparison for this use case to be high.
We look at wet, dry, and hybrid cooling systems within this framework but exclude chilling technologies. In this study, the term ‘cooling’ includes sensible and latent heat removal using free cooling, whereas chilling technology also uses vapor-compression, adsorption, or absorption.
In Section 2.1, we describe the criteria-based comparison method. Section 2.2 provides an overview of the investigated energy and environmental assessment methods. As a result, the comparison criteria and method overview lead to the most suitable methods for analyzing cooling towers, which are presented in Section 3.

2. Methodology

This section introduces the comparison method for energy and environmental assessment approaches for cooling towers. Moreover, Section 2.2 outlines these energy and environmental assessment methods.

2.1. Comparison Criteria

The systematic selection methodology of this paper consists of the comparison criteria. We identified the most frequent criteria based on the criteria defined in previous studies (see Section 1.2). Figure 1 illustrates them as a word cloud. Table A1 in the Appendix lists the underlying criteria.
To find the most suitable methods for analyzing and assessing cooling towers, we introduce a set of criteria by combining the ones from previous studies. To additionally clarify the dependencies, we assign the criteria to specific objectives. In addition, we define partial aspects for each criterion if appropriate. This way, each aspect can be categorized using three-valued logic; ‘yes’, ‘no’, or ‘maybe’. Figure 2 illustrates the structure of the comparison method.
Table 2 summarizes the criteria-based comparison method with the objectives, criteria, partial aspects, and short descriptions of each aspect.
At first, the exclusion criterion is whether the studied object corresponds to the application area of the method. The application areas are divided into ‘process’, ‘product’, ‘service’, and ‘region or sector’. The category ‘process’ includes technical processes and systems such as cooling systems.
In the next step, the methods can be assessed based on the secondary criteria, not all of which necessarily must be met. In the context of this paper, energy and environmental assessment aims to quantify the energy and environmental aspects of the investigated object as thoroughly as possible and on a robust scientific basis. Moreover, the method should be user-friendly, and the results should be easy to communicate.
The objective ‘thoroughness’ comprises completeness and temporal and spatial resolution, referring to the level of detail. The completeness is represented by the criteria ‘life cycle thinking’, the inventoried physical quantities, the impact categories, and by considering the efficiency concept by referring to useful output.
Life cycle thinking involves upstream and downstream chains [13,15]. Accounting from cradle-to-grave avoids burden shifting. Regarding cooling towers, a life cycle perspective reveals whether more construction material for a natural draft design or more energy consumption for fans is environmentally preferable.
The criterion of inventoried physical quantities refers first to the energy and material flows considered within the system boundary [12,13,27]. Not all methods consider both energy and all materials. Some methods disregard the mass of construction and disposal material or the emissions. Moreover, this criterion addresses whether the method considers the temperature and pressure of the energy, material flows, and environment. For cooling systems, the ambient temperature and humidity and the temperatures of the heat flows are key factors. Moreover, we classify the level of completeness regarding which operating materials are included, for example, which cooling water cycles the system boundary includes.
Furthermore, the impact categories cover some environmental and technical aspects [12,13,14,15,25,27,28,29], which the next criterion addresses. Midpoint indicators are located between emission and endpoint impact. In contrast, endpoint indicators concern the damage or severity to the natural environment, human health, and resources. The impact categories considered within this paper are exergy, climate change, water use, land use, ‘others’, and noise. ‘Others’ include the impact categories according to the product environmental footprint guideline [30] (p. 47). Depending on the studied object, several impacts must be considered to be parallel to avoid problem-shifting between different impacts [31] (p. 17).
Another aspect of completeness is whether the efficiency concept is embedded [12,17,18,25,29]. This implies whether the useful input or the damaging effects are related to useful output. Some methods require a definition of this useful output to enable the comparison of similar studied objects. However, the benefits of cooling towers are not clearly defined. Cooling towers cool a specific amount of coolant from a particular input temperature to a specific output temperature. Still, the ambient conditions also have a decisive role. So far, the comparison unit has not been standardized and has been defined very differently (cf. Section 1.2).
Regarding the intended thoroughness, the term resolution refers to the requested temporal and spatial resolution. In this context, we first differentiate between whether a dynamic analysis is intended or possible and if it can be implemented within the methodological framework. The ambient conditions fluctuate significantly in temporal and spatial terms. Moreover, top-down or bottom-up approaches can be differentiated. Top-down approaches analyze the overall system first and then the lower levels, whereas bottom-up approaches are the opposite. For economy-wide analyses, this correlates to accuracy since top-down approaches often lead to data aggregation [12] (p. 1466).
The objective of scientific soundness comprises whether it is a ‘pure analysis based on physical quantities’, for example, without impact weighting. We consider how the literature discusses and evaluates the methods in this respect.
Moreover, the objective of the usability of the method includes the standardization and formalization level [12,13]. International or national standards or guidelines describe some of these methods. This methodological rigor avoids arbitrariness, for example, by making assumptions. Secondly, the feasibility due to data availability is essential to practicability [15]. This criterion refers to existing databases, such as the Ecoinvent database for the LCA. Another criterion is whether existing studies have already applied the method to assess cooling systems. If it has been applied, it indicates that the method appears suitable for assessing cooling systems and that there are comparatively few barriers to its application. Thus, how often the methods are used depends on their feasibility in terms of the usefulness of the results, ease of use, complexity, data availability, and other criteria.

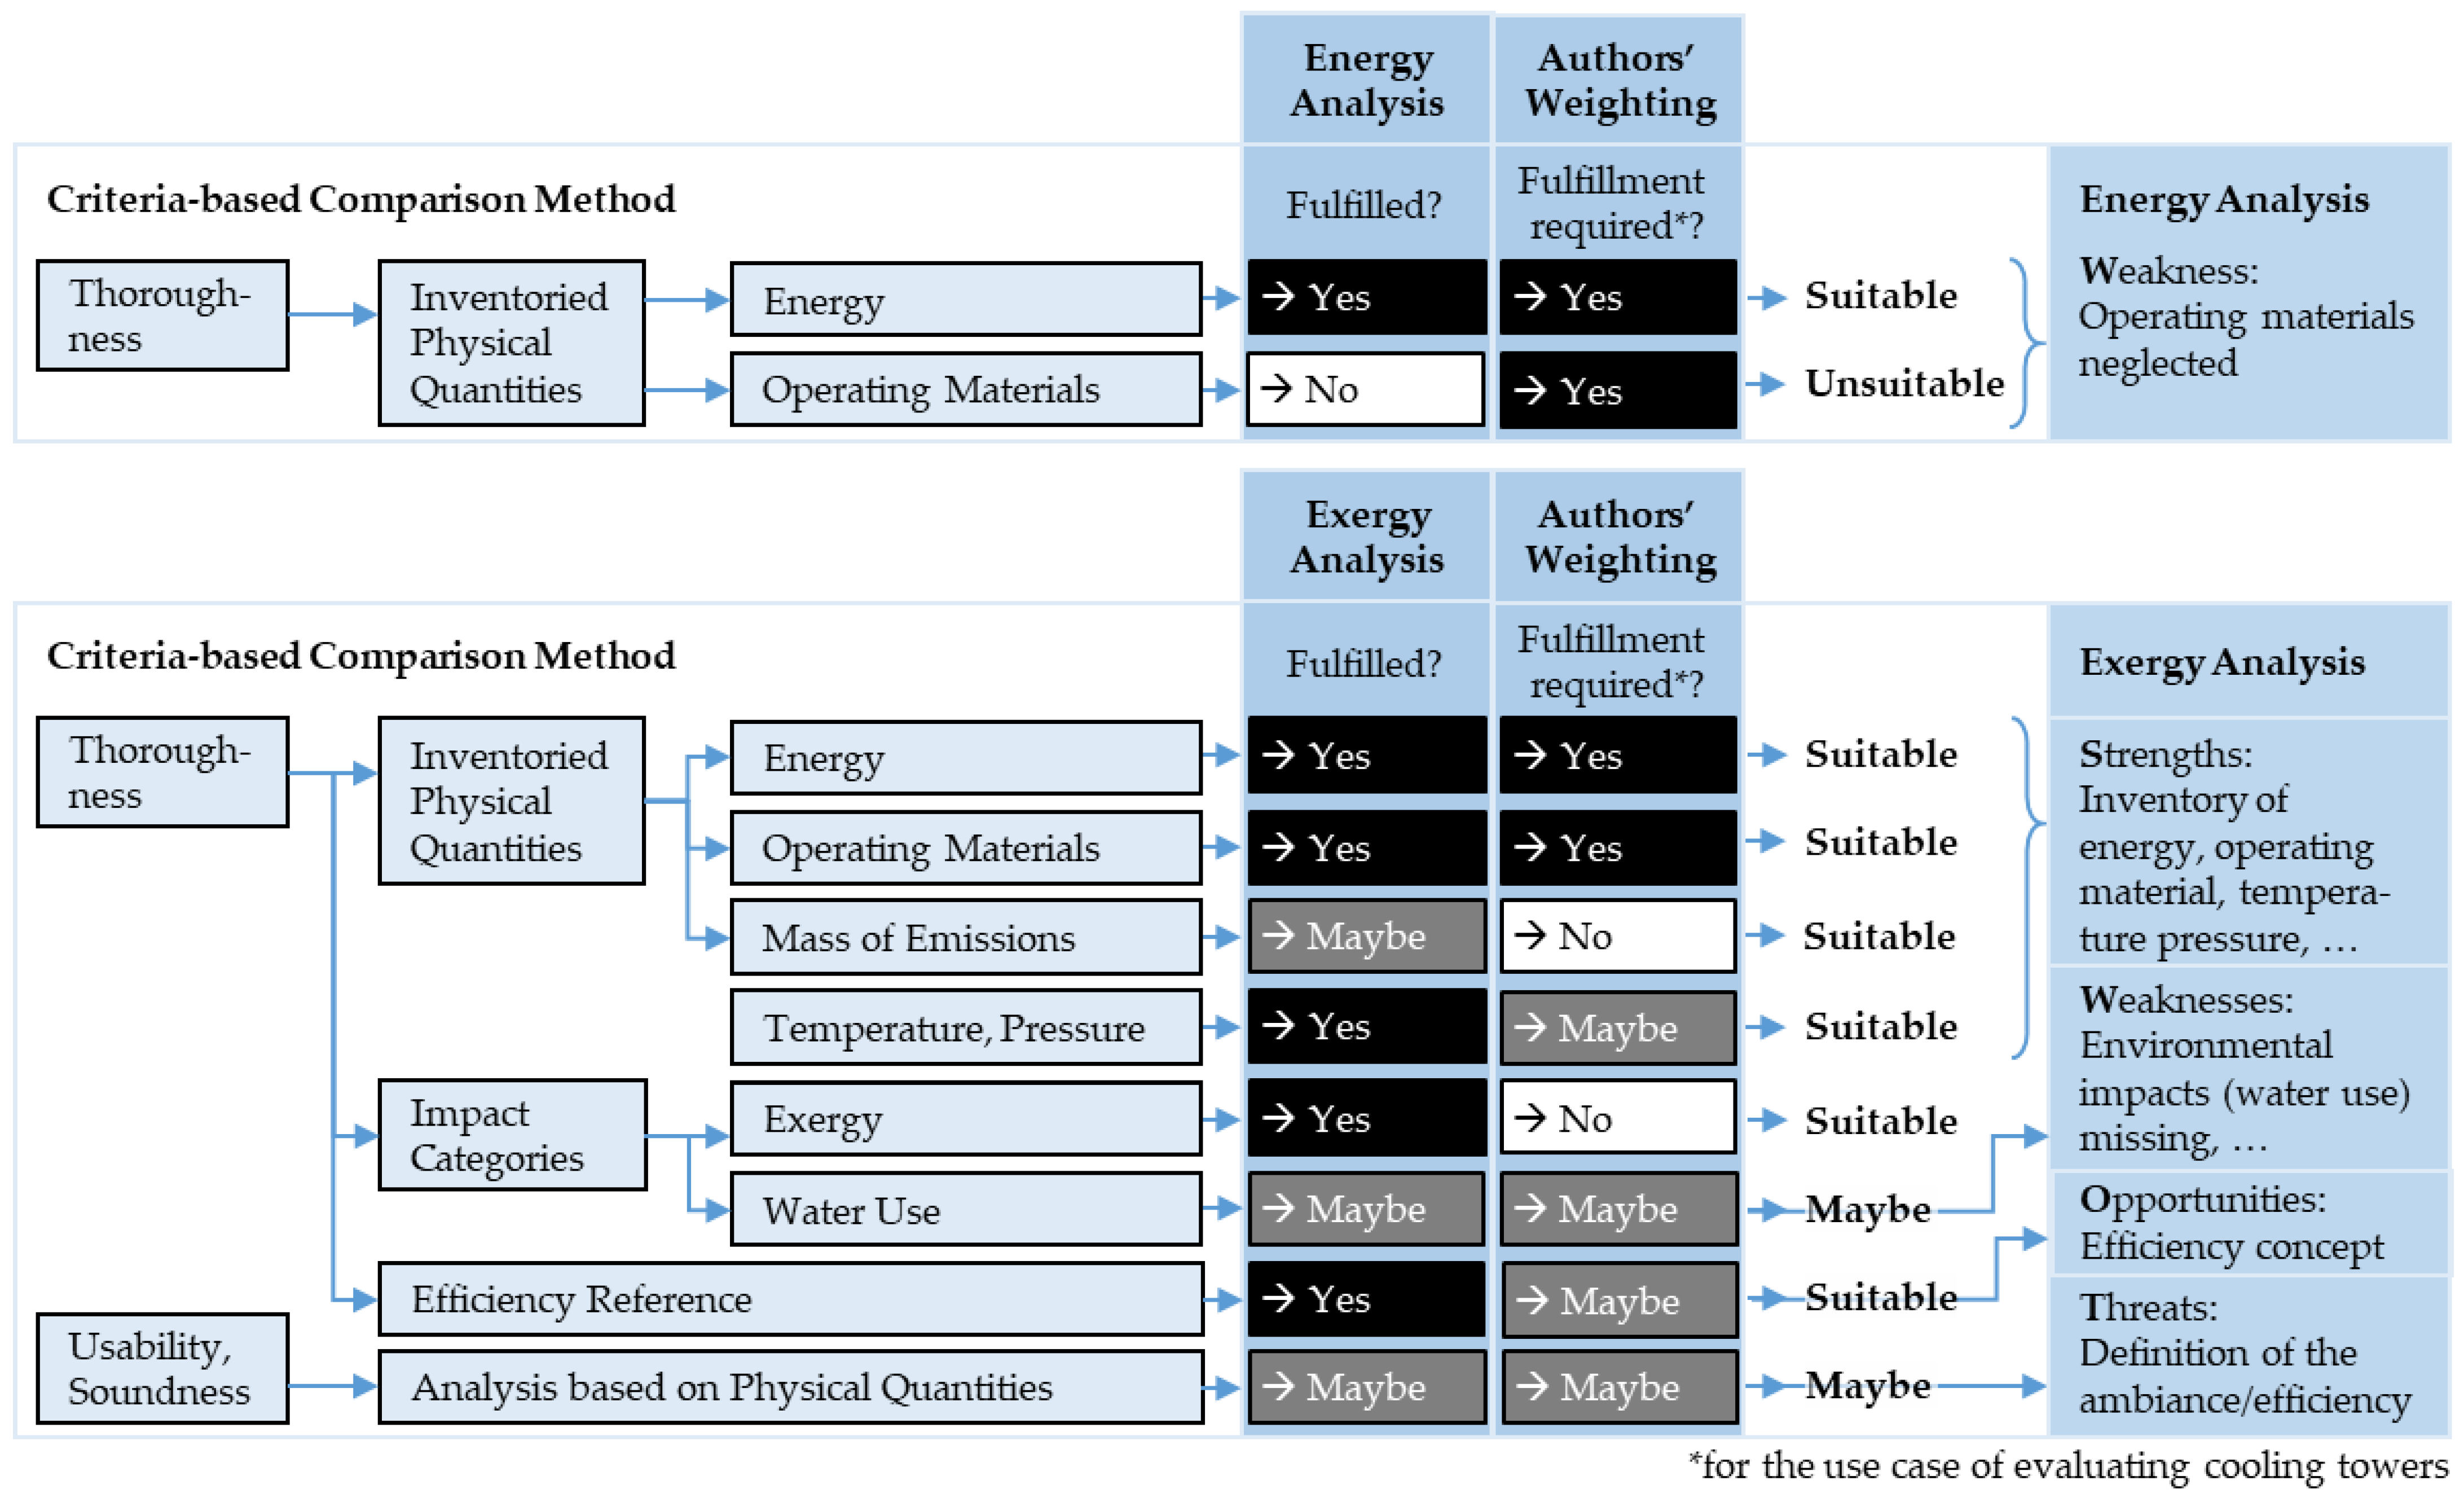
2.2. Methods for Energy and Environmental Assessment

In this work, the following methods are the object of investigation. This section outlines existing energy and environmental assessment methods, highlighting their general similarities, intersections, and differences. Since an almost infinite number of methods and variations exist, we only consider those that are the most common and that are delineated by standards if available. Table 3 summarizes the methods, including the references from which they are taken. The examined methods are divided according to the distinction between analysis and assessment. Analysis and assessment can be consecutive and thus complementary [32] (p. 47).

2.2.1. First-Law Analysis Methods

The most objective methods are material and energy balances that follow the first law of thermodynamics. These are pure analysis approaches that do not require further qualitative assessment.
A whole range of these methods can be grouped under the term material and energy flow analysis (MEFA) [33,52] (p. 963) or the term physical flow accounts [53] (p. 114). According to mass conservation, an MFA evaluates all of the input and output material flows and stocks within a system [34] (p. 73). The MFA can also include energy flows [54]. An SFA is similar. However, an SFA does not necessarily include all material flows but only a limited group of undesirable substances, for example, to reduce toxic substances rather than increasing the material efficiency. Some ambiguity persists about these definitions; MFA and SFA are sometimes regarded as being identical [35] (p. 50). This paper refers to the differentiation and definitions of MFA and SFA according to the European Commission [34] (pp. 73–74). The energy analysis includes the energy balance within a system boundary with regard to the first law of thermodynamics [36]. The energy analysis is also called input–output energy analysis in case of a national or regional scale [14] (p. 501). Furthermore, the technical equivalent of the conventional monetary input–output analysis (or table) regarding a sectoral perspective is a PIOT [33] (p. 196), [55] (p. 383). Bao et al. [54] describe MEFA methods and indicators in further detail. ENA, also called environ analysis, is related to input–output analysis. The ENA analyzes and quantifies energy and material flows within an ecosystem [37] (p. 167). Moreover, the LCI of LCA can be considered as part of the MEFA family since it includes the material and energy inputs and outputs of a product system. LCI includes the entire life cycle.
In some studies, the analysis methods are called environmental accounting methods [15] (pp. 15, 34), environmental assessment methods [12,13], or sustainability assessment methods [14].

2.2.2. Energy and Environmental Assessment Methods

Smeets and Weterings [23] describe the causalities between society and the environment using the terms driver, pressure, state, impact, and response. This concept is called the DPSIR framework. Accordingly, some methods or indicators evaluate the environmental impact resulting from environmental pressure. These analysis methods can provide a starting point by focusing on the pressure factor.
Based on an energy analysis according to the first law of thermodynamics, exergy analysis also includes the second law. For this purpose, the exergy of the energy and material flows is calculated. The chemical exergy of many substances is tabulated for standard conditions [56]. Subsequently, the overall exergy input and the exergy associated with the product are determined. Exergy loss indicates exergy output that is not part of the product and that remains unused. The difference between the exergy of the output flows and the input flows corresponds to exergy destruction. In some cases, transiting exergy should be considered [57]. This analysis reveals irreversibility due to exergy destruction and the potential for coupling processes based on exergy loss.
The physical optimum (PhO) method refers to the theoretical ideal reference process, which requires a minimum amount of energy (and other resources) [58]. The ratio of real resource input to this ideal reference value is called the PhO factor, which is the indicator.
LCA can be a useful method for analyzing the environmental impacts of products [59]. According to ISO 14040 [2] and 14044 [38], LCA has four phases. Firstly, the goal and scope are defined. The environmental impact refers to a functional unit. Thus, LCA measures the ‘eco efficiency’ [60]. Secondly, the life cycle inventory is carried out. The third phase is the life cycle impact assessment, which leads to the last phase: life cycle interpretation. Because of the life cycle impact assessment, LCA is not only an analysis, but goes further towards evaluating the environmental impacts using at least midpoint impact-based aggregation. Different impact categories, category indicators, and characterization models exist for the life cycle impact assessment. For example, it can include the global warming potential, the depletion of natural resources, and other impacts.
Inspired by LCA methods, footprint methods serve to represent specific environmental impacts, but usually only in one category. They usually address the carbon footprint or water footprint analysis [61]. Water footprint refers to volumetric accounting [41] or impacts such as pollution (ISO 14046, [40]) depending on the methodological standard. Similarly, the ecological footprint concept converts environmental impact into land use [42]. Moreover, the cumulative energy demand (VDI [43]) and the MIPS are part of the footprint family depending on the methodological framework [62] (p. 196). Čuček et al. [63] provide an overview of the existing footprint indicators.
Various methods combine LCA and exergy analysis to depict the consistent depletion of natural resources. Within an exergetic LCA, the impact category is the life cycle irreversibility representing the exergy loss during the life cycle [64]. Exergetic LCA is an extension of LCA and uses an additional category indicator [49] (p. ii). Similarly, life cycle exergy analysis includes natural resource consumption evaluated by exergy analysis [50]. Likewise, according to Szargut [46], cumulative exergy consumption is a life cycle approach since resource consumption is quantified by its exergy from the cradle to at least the gate. The indicator is the sum of exergy resulting from raw material extraction and from manufacturing a product, including upstream in chains. The concept of cumulative exergy consumption can be extended to ecological cumulative exergy consumption [47], similar to emergy analysis. Emergy is the work completed by nature or man to realize a product or service [48]. An alternative definition is the ‘availability of energy (exergy) of one kind that is used up in transformations directly and indirectly to make a product or service’ [65] (p. 205). The following section examines emergy analysis in more detail while also representing the other methods that combine LCA and exergy analysis.

3. Results

We qualitatively categorized the energy and environmental assessment methods using the comparison criteria. Ratings are either based on the references given or on the results of the authors’ analysis after extensive discussion with experts and cooling tower manufacturers.

3.1. Application Area

The application areas of the methods differ, meaning that the studied objects that are intended for or at least possible to be used for the application.
Almost all of the methods can analyze processes, even if that is not their primary intention, such as within MFA and the footprint methods. In some cases, processes are analyzed by their products. The LCA or footprint methods require the definition of the functional unit. In these cases, the reference to the process is made by the functional unit. Emergy analysis originally serves to analyze products or services. These methods serve to analyze and assess cooling systems exclusively if a reasonable definition of the functional unit, service, or product can be derived.
Conversely, this applies to methods that are originally intended for processes. The PhO method and ENA are not directly applicable to products, but instead analyze the process or network from which the product results.
To evaluate services as studied objects, the PIOT, MFA, ENA, energy analysis, and the PhO method are of limited use. Sometimes, this can be solved by analyzing the process or region while referring to the service.
Most of the regarded methods can evaluate economies or regions. The PhO method has not been used for this purpose yet, although it is methodologically possible.
Since different functional units have already been identified in previous studies (cf. Section 1.1), all of the considered methods can analyze a cooling system as a process. Thus, this knock-out criterion excludes none of the methods.

3.2. Life Cycle Thinking

Life cycle thinking is the fundamental concept of LCA and footprint methods. Furthermore, PIOT and ENA pursue the idea of life cycle thinking [13] (p. 220). For the other methods, an extension to the lifecycle perspective is possible; sometimes, it is carried out regardless, even if not intended. For example, exergetic LCA is the methodological extension of exergy analysis and LCA, resulting in exergy loss as an indicator referring to the entire life cycle [49] (p. ii). This also applies to emergy analysis and other LCA and exergy analysis combinations.
Considering the whole life cycle from cradle to grave for cooling systems is not always necessary in all cases because the use phase is the main driver for environmental impacts in most cases [5] (p. 142). Thus, approaches without the life cycle concept must not be omitted.
However, only life cycle approaches can reveal the correlation between more construction materials for an increased natural draft effect, leading to less electricity demands for fans. Furthermore, the use phase becomes less dominant as the share of renewables in the electricity mix increases. These cases require the life cycle perspective.

3.3. Inventoried Physical Quantities

The life cycle criterion also affects the completeness of the masses considered as inventoried physical quantities. Life cycle approaches consider operating, construction, and disposal materials as well as emissions. Therefore, LCA, the footprint methods, and emergy analysis comprise most masses. In contrast, most analysis methods only consider the energy, the masses of the operating materials, or both in parallel. An SFA even only regards specific substance flows.
Furthermore, within an exergy analysis, energy and material flows are considered according to their exergy. The PhO method intends to analyze several levels, such as ‘energy’ or ‘material’ [66] (p. 56). Likewise, ENA refers to one dimension, such as energy flows or carbon emissions. All of the considered approaches that are related to environmental impacts consider both energy and material. Moreover, all exergy-based methods consider the temperature and pressure of the energy and material flows as well as the environment.
The majority of the energy flows in cooling systems are in the form of heat. Thus, not only the amount of energy but also the temperature is essential to calculate the exergy. The ambient temperature determines which kind of cooling technology is applicable, whether free cooling is possible, and whether chillers must operate. The operating material must be considered due to there being significant quantities of coolant in many cases. Thus, to avoid problem-shifting, coolant and electricity consumption must be evaluated in parallel.

3.4. Impact Categories

The criterion of considered impact categories only addresses environmental assessment methods since this goes beyond pure physical description within an analysis. LCA provides the most comprehensive view since a multidimensional result that consists of different categories can be derived.
According to Rosenbaum et al. [62] (p. 197), some footprint methods are of limited suitability for accounting for quantities, such as the environmental footprint, cumulative energy demand, and water footprint. Nevertheless, Blanc and Friot [15] (p. 36) assigned these methods to different impact categories. Fang et al. [67] (p. 508) even considered the environmental footprint, carbon footprint, water footprint, and energy footprint as complementary and applied them in combination. However, the risk of double counting impacts remains. Rosenbaum et al. [62] (p. 198) advise against such a combination.
Biodiversity and noise are difficult to assess for all of the regarded methods [68] (p. 69). Some extensions of LCA or life cycle impact assessment provide approaches that include these aspects [69,70]. Noise can be a crucial factor for cooling systems due to ventilation.

3.5. Efficiency Analysis

The term efficiency refers to the ratio between useful input and useful output. In a broader sense, it is the ratio between environmental impacts and useful output. In either case, a definition of the useful output is required. In LCA, this is called the functional unit.
The evaluation of usefulness exceeds a physical analysis. Thus, methods such as PIOT, SFA, and MFA can identify the flows without referring to useful output. Methods that are originally intended for analyzing processes or networks, such as energy analysis, ENA, and exergy analysis, do not necessarily comprise a definition of useful output either. Exergy analysis is conceivable without this definition but usually refers to the exergy of the product to determine the exergetic efficiency.
Some processes or networks do not produce a clear, useful output, as is the case for the analysis of cooling systems. In these cases, methods that are primarily intended for products are more difficult to apply. For example, Schulze et al. [5] (p. 140) define the cooling of 1 kg of water from 35 to 28 °C as the functional unit. This specific functional unit is hardly comparable to other studies using another functional unit definition. Moreover, the ambient temperature and humidity are significant factors to consider. Therefore, previous studies have described different functional units of cooling systems. So far, no universal comparability has been able to be achieved.

3.6. Temporal and Spatial Resolution

LCA examines the environmental impact integrated over time and space [71]. In some cases, however, a high temporal or spatial resolution is needed to identify specific improvement potentials. Dynamic analyses can be performed by extending MFA, SFA, and LCA (including LCI) towards dynamic MFA [72,73], dynamic SFA [74], and dynamic LCA [75], respectively. The framework of the PhO method is explicitly intended for dynamic analysis [58] (p. 13). Other methods can also be extended, although the additional understanding might be minor in some cases compared to the increased complexity. Dynamic analyses are essential for interpreting the correlation of varying ambient conditions, especially temperature and humidity.
The spatial resolution depends on whether the inventory is top-down, often leading to a spatial black box. Methods that are mainly intended for analyzing economies and regions are performed from the top down, such as MFA. Emergy analysis is also performed from the top down [13] (pp. 219–220).
Methods for technical processes such as exergy analysis, the PhO method, and process-based LCI are conducted from the bottom up. SFA, ENA, LCA [13] (p. 220), and most footprints [12] pursue a bottom-up approach. Thus, a process-based bottom-up approach is preferable for analyzing cooling systems.

3.7. Scientific Soundness

Scientific soundness is examined according to the degree of aggregation, such as impact aggregation, methodological rigor, and estimations from the literature.
LCA and footprint methods aggregate different elementary flows to at least midpoint impact categories, such as different greenhouse gases to CO2 equivalents. According to Hau and Bakshi [47] (p. 3768), analysis methods such as PIOT, SFA, and MFA objectively value the inventoried flows, whereas LCA is considered to be unable to do so.
On the contrary, all energy and material flows are quantified according to the physical laws within exergy-based methods. However, these approaches somehow aggregate energy and material flows by accounting for their exergy. The exergy concept is, among other things, based on an assumption of the earth’s composition.
Assessment methods always go beyond purely objective physical analysis. Thus, some scientific soundness is given up in favor of the possibility of assessing impacts. Regarding ENA, it depends on which flows are considered. The scientific soundness of the PhO method varies due to its methodological flexibility.

3.8. Formalization

The methods also differ in their level of maturity and formalization. Some methods are extensively established and standardized, such as MFA by the European Commission [34], the LCA by ISO 14040 [2] and 14044 [38], and by the European Commission [30]. ISO 14067 [39] addresses carbon footprint. Furthermore, the Association of German Engineers, describes the PhO method (VDI 4663-1 [51]) and the cumulative energy demand (VDI 4600 [43,44]).
Although no such formal standards exist for the environmental footprint, Wackernagel and Rees [42] provide a methodological framework. The same applies to the water footprint described by Hoekstra et al. [41], and emergy analysis as described by Odum [48]. For the exergy analysis, the assumptions made for the composition and physical state are taken, for example, from the literature by Szargut et al. [56].
Regarding PIOT and ENA, their lack of formalization is criticized [12,13] (p. 217). Formalization affects user-friendliness and methodological consistency.

3.9. Data Availability

Furthermore, usability due to data availability differs. Several databases exist for LCA (and LCI) [76] (p. 146). MFA and SFA have large databases on the national or global scale [12] (p. 1468). However, data availability is a drawback for most methods. Only for the footprint methods, such as carbon footprint, water footprint, cumulative energy demand, and MIPS, is the data availability rated as being relatively advanced [62] (p. 198).

3.10. Existing Studies on Cooling Systems

As a final criterion, we checked whether the methods are already commonly used for cooling tower evaluation. For example, some approaches use MFA [4] or an energy analysis [77]. Volta and Weber [58] describe using the PhO for cooling towers with regard to evaporated water. Theoretically, when using the PhO, no draw-off, blow-down, or sludge removal would be necessary, meaning that the water demand would equal the amount of evaporated water. Moreover, Eggers et al. [78] provide an approach to evaluate heat exchangers by calculating the ‘physically optimal temperature difference’ (p. 11).
Although some LCA studies exist, there is lack of LCA studies on cooling towers from a life cycle perspective [3,79].
Furthermore, the German Engineering Association (VDMA [80]) provides guidelines on the partial carbon footprint of evaporative coolers based on ISO 14067 [39] including only the operating phase. However, a definition or description of the functional unit or a ‘declared unit’ is not given. Furthermore, CO2 emissions are only accounted for through emission factors for electricity, fresh water demand, and wastewater treatment. The water footprint of cooling towers has been investigated in several studies [81,82], as has exergy analysis [77,83,84].

3.11. Summary and Exemplary Weighting

Table 4 summarizes the criteria-based categorization. Black means ‘yes’, grey means ’maybe’, and white means ‘no’. The right column illustrates the authors’ assessment of the importance of the different criteria for evaluating cooling towers based on technical discussions with cooling manufacturers. However, this assessment is exemplary and can vary for different purposes. Criteria that should be fulfilled are marked in black or grey. This weighting assumes that an existing cooling system is to be investigated with regard to its energy efficiency and environmental performance. The primary criterion must be fulfilled, which means that the method must apply to the process analysis.
Figure 3 highlights how Table 4 derives the strengths and weaknesses of each method using the example of energy analysis and exergy analysis.
Energy analysis omits material flows, as shown in Table 4 and Figure 3. Thus, energy analysis is inappropriate for cooling towers since the criterion of considering operating material flows, such as water consumption, must be met, as marked in the last column. ENA seems to be unsuitable due to its low formalization. In comparison, an MFA that includes energy flows is more feasible.
LCI is usually part of LCA or footprint analysis. The upstream and downstream life cycle stages of cooling towers are far less important than the operational phase. CO2 emissions from evaporative cooler manufacturing amount to approximately 1% of the emissions caused by operation (VDMA [80] (p. 16)). Therefore, life cycle thinking is less important when evaluating cooling towers. LCA, footprint methods, and emergy analysis are more relevant for cooling tower construction than for existing plants. The importance of the life cycle criterion may differ for studies with other objectives and thus depend on the individual weighting.
The exergy analysis and the PhO method fulfill most criteria, although the application of the PhO method for cooling tower evaluation has not been standardized yet. The question remains as to how the minimum electricity and water demand can be quantified for different framework conditions and how the ideal reference value can be determined.

4. Discussion and Conclusions

Identifying energetic and environmental optimization potentials requires the systematic evaluation of processes and products using appropriate methods. Assessment methods vary in terms of their suitability for a specific application area—such as cooling towers. Therefore, the methods need to be classified, systematically compared, and, if necessary, extended or combined. The long-term goal is to standardize such a comparison method, something to which this study contributes, on the basis of previous approaches.
This paper provides comparison criteria for a systematic selection of methods for analyzing and assessing cooling towers. By knowing the strengths and weaknesses of each of the methodologies before starting the evaluation, extensions and combinations of methods can be considered early on.
The criteria were chosen to cover an exhaustive range of aspects in environmental evaluation. Consequently, some criteria within the objectives ‘scientific soundness’ and ‘usability’ could only be qualitatively estimated. None of the methods met all of the secondary criteria that we defined for cooling towers. Nevertheless, all of the methods can be applied to cooling towers since all of them fulfill the exclusion criterion.
The multi-criteria comparison led to the conclusion that MFA comprising energy flows is more suitable for most cooling tower analysis than pure energy analysis, ENA, or LCI. LCI is included in LCA when the entire life cycle is analyzed. Furthermore, the comparison shows that only LCA comprises the multidimensional environmental impacts. To ensure comparability between plants under different outside conditions, a uniform functional unit must consider the outside temperature, humidity, and operational requirements. In this regard, however, further research and standardization are needed. In general, the criteria’s weighting depends on each study’s goal and scope. The method must fulfill different criteria for other goals and scopes to be successfully applied.
Similar to other studies in the field of criteria-based method comparison, we found that the methods have different strengths and weaknesses. However, our results differ in terms of the application area. For example, Rodríguez et al. [12] showed that for the energy efficiency assessment of agricultural systems, emergy analysis is the most suitable; LCA and MFA are moderately suitable; and ENA and exergy analysis are the least suitable. In general, we agree with the conclusions of previous studies that the methods should be combined or extended depending on the application objectives.
Future methodological developments should address the general challenges of assessing cooling systems: the dependence on dynamic outside conditions, the difficulties in defining one utility as an efficiency reference or the functional unit, and the multidimensional environmental impacts. To examine heat flows, a second-law perspective can be included, and exergy should also be considered to help define the physical benefits of a cooling system. Although this paper focuses on cooling systems, applying the evaluation method to other application areas is possible. Future studies should strengthen the standardization of the comparison method proposed in this paper and in previous studies for the long-term goals of systematic selection, combination, and the development of evaluation methods for all use cases. Experts should further review, adjust, and sharpen the criteria-based classification of the methods.
This paper enables the systematic selection of assessment methods for cooling towers by comparing and analyzing different evaluation methods and their limitations based on different criteria. Quantifying the benefits of cooling for the efficiency assessment and, generally, developing an evaluation approach that ideally meets all necessary criteria is the main challenge in evaluating cooling towers.

Author Contributions

P.M.W.: conceptualization, formal analysis, investigation, methodology, and writing—original draft preparation. P.R.: conceptualization, supervision, and writing—review and editing. All authors have read and agreed to the published version of the manuscript.

Funding

This work was supported by the Graduate and Research School for Energy Efficiency Stuttgart, GREES Ph.D. scholarship, and the Open Access Publication Fund of the University of Stuttgart. The authors are solely responsible for the content of the research work.

Institutional Review Board Statement

Not applicable.

Informed Consent Statement

Not applicable.

Data Availability Statement

Not applicable.

Acknowledgments

We acknowledge the technical discussions with the experts and cooling manufacturers. We would also like to thank the anonymous reviewers for carefully reading our manuscript and for the comments and suggestions.

Conflicts of Interest

The authors declare no conflict of interest.

Abbreviations

LCALife cycle assessment
PIOTPhysical input–output table
SFASubstance flow analysis
MFAMaterial flow analysis
ENAEcological network analysis
LCILife cycle inventory
LCALife cycle assessment
MIPSMaterial-input per service unit
DPSIRDrivers, pressures, state, impact, and response
NTUNumber of transfer units
MEFAMaterial and energy flow analysis
PhOPhysical optimum

Appendix A

Table A1 summarizes the criteria defined in previous literature (cf. Section 1.2). Figure 1 illustrates them as a word cloud.
Table A1. Overview of criteria found from previous studies.
Criteria
Abbaszadeh et al. [27]Considered aspects and considered environmental media
Aktsoglou and Gaidajis [16]Cross-sector (‘Do methods assess more than one sector?’), environmental issues (‘Do methods assess an adequate number of environmental issues?’), efficiency concept (‘Do methods promote energy and resource efficiency?’), possibility to communicate (‘Can methods communicate their results to public?’, ‘Can methods answer to the potential addition of a new activity?’), spatial focus (‘Can methods identify specific environmental ‘hot spots’ of the spatial entity?’), result aggregation (‘Can methods aggregate the results into single scores?’), and sustainability concepts (‘Do methods include specific thresholds/targets of sustainable performance?’, ‘Can methods be applied/Updated to compare overall sustainability?’) (p. 7)
Baumann et al. [17]Approach character, approach type, comparison basis, data subject, data type, framework, interpretation, investigated dimensions, object analyzed, overall purpose, perspective, spatial modelling, system boundaries, and time modelling
Blanc et al. [15]Acceptance, adaptability to global challenges, analytical potential, auditability, causality, comparability, compatibility, completeness, consistency, data availability, ease of use, environmental issues, inherent quantities, integration, intelligible, life cycle thinking, maturity, reliability, soundness, structure, transparency, univocity, and usability
Finnveden et al. [19]Adaptive, cost-effective, credible, efficient, focused, integrated, interdisciplinary, participative, practicability, relevance, rigorous, systematic, and transparent
Finnveden et al. [28]Impacts, object analyzed, scale, spatial characteristics, temporal characteristics, and timing of impacts
IAIA [24]Adaptive, credible, efficient, focused, integrated, interdisciplinary, participative, practicability, purposive, relevance, rigorous, systematic, and transparent
Loiseau et al. [13]Aggregation, data availability, exhaustiveness, feasibility, formalization, general public’s understanding, indicator type, indicators, inventoried flows, life cycle thinking, framework, multi-criteria assessment, site-dependent level, spatial differentiation, system modelling, top-down/bottom-up, and usability
Moberg [18]Considered effects, considered environmental burdens, efficiency concept, frequency being used, integration, object analyzed, overall purpose, reference object, standardization, system boundaries, unit, and usability
Ness et al. [14]Product-related assessment, integration, spatial focus, and temporal characteristics
Payraudeau et al. [12]Indicators, scale of impacts, spatial scale, spatial variability, sustainability dimensions, temporal scale, and temporal variation
Rodríguez et al. [12]Aggregation, data availability, efficiency concept, feasibility, formalization, indicators, intelligible, inventoried flows, multi-criteria indicators, spatial scale, system modelling, top-down/bottom-up, and usability
Sala et al. [20]Comprehensive, integration, scalable, strategic, system boundaries, and transparency

References

  1. European Commission. Reference Document on the Application of Best Available Techniques to Industrial Cooling Systems: Integrated Pollution Prevention and Control (IPPC). 2001. Available online: https://eippcb.jrc.ec.europa.eu/sites/default/files/2019-11/cvs_bref_1201.pdf (accessed on 14 July 2022).
  2. DIN EN ISO 14040; Environmental Management—Life Cycle Assessment—Principles and Framework. Beuth Verlag GmbH: Berlin, Germany, 2021.
  3. Asdrubali, F.; Baldinelli, G.; Scrucca, F. Comparative life cycle assessment of an innovative CSP air-cooled system and conventional condensers. Int. J. Life Cycle Assess. 2015, 20, 1076–1088. [Google Scholar] [CrossRef]
  4. Schlei-Peters, I.; Wichmann, M.G.; Matthes, I.-G.; Gundlach, F.-W.; Spengler, T.S. Integrated material flow analysis and process modeling to increase energy and water efficiency of industrial cooling water systems. J. Ind. Ecol. 2017, 22, 41–54. [Google Scholar] [CrossRef]
  5. Schulze, C.; Thiede, S.; Herrmann, C. Life cycle assessment of industrial cooling towers. In Progress in Life Cycle Assessment; Schebek, L., Herrmann, C., Cerdas, F., Eds.; Springer International Publishing: Cham, Switzerland, 2019; pp. 135–146. ISBN 978-3-319-92237-9. [Google Scholar]
  6. DIN EN 13741; Thermal Performance Acceptance Testing of Mechanical Draught Series Wet Cooling Towers. Beuth Verlag GmbH: Berlin, Germany, 2004.
  7. Jaber, H.; Webb, R.L. Design of Cooling Towers by the Effectiveness-NTU Method. J. Heat Transf. 1989, 111, 837–843. [Google Scholar] [CrossRef]
  8. Merkel, F. Verdunstungskühlung. Ph.D. Thesis, VDI-Verl., Berlin, Germany, 1925. [Google Scholar]
  9. Poppe, M. Wärme- und Stoffübertragung bei der Verdunstungskühlung im Gegen- und Kreuzstrom: Mitteilung aus dem Institut für Thermodynamik der Technischen Universität Hannover; VDI-Verl.: Düsseldorf, Germany, 1973; ISBN 3-18-85-0560-1. [Google Scholar]
  10. Khan, J.-R.; Zubair, S.M. An Improved Design and Rating Analyses of Counter Flow Wet Cooling Towers. J. Heat Transf. 2001, 123, 770–778. [Google Scholar] [CrossRef]
  11. DIN EN 14705; Heat Exchangers—Method of Measurement and Evaluation of Thermal Performances of Wet Cooling Towers. Beuth Verlag GmbH: Berlin, Germany, 2005.
  12. Rodríguez, C.M.; Rengifo Rodas, C.F.; Corrales Muñoz, J.C.; Casas, A.F. A multi-criteria approach for comparison of environmental assessment methods in the analysis of the energy efficiency in agricultural production systems. J. Clean. Prod. 2019, 228, 1464–1471. [Google Scholar] [CrossRef]
  13. Loiseau, E.; Junqua, G.; Roux, P.; Bellon-Maurel, V. Environmental assessment of a territory: An overview of existing tools and methods. J. Environ. Manag. 2012, 112, 213–225. [Google Scholar] [CrossRef]
  14. Ness, B.; Urbel-Piirsalu, E.; Anderberg, S.; Olsson, L. Categorising tools for sustainability assessment. Ecol. Econ. 2007, 60, 498–508. [Google Scholar] [CrossRef]
  15. Blanc, I.; Friot, D. Evaluation of Environmental Accounting Methodologies for the Assessment of Global Environmental Impacts of Traded Goods and Services. Research report hal-00740712. Ph.D. Thesis, Mines ParisTech, Paris, France, 2010. [Google Scholar]
  16. Aktsoglou, D.; Gaidajis, G. Environmental Sustainability Assessment of Spatial Entities with Anthropogenic Activities-Evaluation of Existing Methods. Sustainability 2020, 12, 2680. [Google Scholar] [CrossRef]
  17. Baumann, H.; Cowell, S.J. An evaluative framework for conceptual and analytical approaches used in environmental management. Greener Manag. Int. 1999, 26, 109–122. [Google Scholar]
  18. Moberg, Å. Environmental Systems Analysis Tools: Differences and Similarities including a Brief Case Study on Heat Production using Ecological Footprint, MIPS, LCA and Exergy Analysis. Master’s Thesis, Stockholm University, Stockholm, Sweden, 1999. [Google Scholar]
  19. Finnveden, G.; Nilsson, M.; Johansson, J.; Persson, Å.; Moberg, Å.; Carlsson, T. Strategic environmental assessment methodologies—Applications within the energy sector. Environ. Impact Assess. Rev. 2003, 23, 91–123. [Google Scholar] [CrossRef]
  20. Sala, S.; Ciuffo, B.; Nijkamp, P. A systemic framework for sustainability assessment. Ecol. Econ. 2015, 119, 314–325. [Google Scholar] [CrossRef]
  21. Singh, R.K.; Murty, H.R.; Gupta, S.K.; Dikshit, A.K. An overview of sustainability assessment methodologies. Ecol. Indic. 2009, 9, 189–212. [Google Scholar] [CrossRef]
  22. Angelakoglou, K.; Gaidajis, G. A review of methods contributing to the assessment of the environmental sustainability of industrial systems. J. Clean. Prod. 2015, 108, 725–747. [Google Scholar] [CrossRef]
  23. Smeets, E.; Weterings, R. Environmental Indicators: Typology and Overview: European Environment. Technical Report No 25. 1999. Available online: http://www.geogr.uni-jena.de/fileadmin/Geoinformatik/projekte/brahmatwinn/Workshops/FEEM/Indicators/EEA_tech_rep_25_Env_Ind.pdf (accessed on 14 July 2022).
  24. IAIA. Principles of Environmental Impact Assessment—Best Practice: Fargo, ND: International Association for Impact Assessment. 1999. Available online: https://www.iaia.org/uploads/pdf/principlesEA_1.pdf (accessed on 14 July 2022).
  25. Payraudeau, S.; van der Werf, H.M. Environmental impact assessment for a farming region: A review of methods. Agric. Ecosyst. Environ. 2005, 107, 1–19. [Google Scholar] [CrossRef]
  26. Klemm, C.; Wiese, F. Indicators for the optimization of sustainable urban energy systems based on energy system modeling. Energy Sustain. Soc. 2022, 12, 3. [Google Scholar] [CrossRef]
  27. Abbaszadeh, S.; Hassim, M.H. Comparison of methods assessing environmental friendliness of petrochemical process design. J. Clean. Prod. 2014, 71, 110–117. [Google Scholar] [CrossRef]
  28. Finnveden, G.; Moberg, Å. Environmental systems analysis tools—An overview. J. Clean. Prod. 2005, 13, 1165–1173. [Google Scholar] [CrossRef]
  29. Bilitewski, B.; Bringezu, S.; Bro-Rasmussen, F.; Clift, R.; Frischknecht, R.; Speck, S.; Sørup, P.; Ude de Haes, H.A. CHAINET Definition Document: Final version. 1998. Available online: http://www.leidenuniv.nl/cml/ssp/publications/defin_doc.pdf (accessed on 14 July 2022).
  30. European Commission. PEFCR Guidance Document: Guidance for the 13 Development of Product Environmental Footprint Category Rules (PEFCRs); Version 6.3; European Commission: Brüssel, Belgium, 2018.
  31. Finnveden, G.; Hauschild, M.Z.; Ekvall, T.; Guinée, J.; Heijungs, R.; Hellweg, S.; Koehler, A.; Pennington, D.; Suh, S. Recent developments in Life Cycle Assessment. J. Environ. Manag. 2009, 91, 1–21. [Google Scholar] [CrossRef]
  32. Nordmann, A. Analyse und Bewertung. In Umweltbewertung für Ingenieure; Kaltschmitt, M., Schebek, L., Eds.; Springer: Berlin/Heidelberg, Germany, 2015; pp. 47–56. [Google Scholar]
  33. Radermacher, W.; Stahmer, C. Material and energy flow analysis in Germany—Accounting framework, information system, applications. In Environmental Accounting in Theory and Practice; Uno, K., Bartelmus, P., Eds.; Springer: Dordrecht, The Netherlands, 1998; pp. 187–211. ISBN 9789401714334. [Google Scholar]
  34. European Commission. Economy- Wide Material Flow Accounts and Derived Indicators: A Methodological Guide; Office for Official Publ. of the Europ. Communities: Luxembourg, 2001; ISBN 9289404590.
  35. Brunner, P.H.; Rechberger, H. Practical Handbook of Material Flow Analysis, 1st ed.; Lewis: Boca Raton, FL, USA, 2004; ISBN 1566706041. [Google Scholar]
  36. IFIAS. IFIAS Workshop Report, energy analysis and economics. International Federation of Institutes for Advanced. Resour. Energy 1978, 1, 151–204. [Google Scholar] [CrossRef]
  37. Fath, B.D.; Patten, B.C. Review of the Foundations of Network Environ Analysis. Ecosystems 1999, 2, 167–179. [Google Scholar] [CrossRef]
  38. DIN EN ISO 14044; Environmental Management—Life Cycle Assessment—Requirements and Guidelines. Beuth Verlag GmbH: Berlin, Germany, 2021.
  39. DIN EN ISO 14067; Greenhouse Gases—Carbon Footprint of Products—Requirements and Guidelines for Quantification. Beuth Verlag GmbH: Berlin, Germany, 2019.
  40. DIN EN ISO 14046; Environmental Management—Water Footprint—Principles, Requirements and Guidelines. Beuth Verlag GmbH: Berlin, Germany, 2016.
  41. Hoekstra, A.Y.; Chapagain, A.K.; Aldaya, M.M.; Mekonnen, M.M. The Water Footprint Assessment Manual: Setting the Global Standard, 1st ed.; Earthscan: London, UK, 2011; ISBN 978-1-84971-279-8. [Google Scholar]
  42. Wackernagel, M.; Rees, W.E. Our Ecological Footprint: Reducing Human Impact on the Earth, [Nachdr.]; New Society Publishing: Gabriola Island, BC, Canada, 2007; ISBN 9781550922516. [Google Scholar]
  43. VDI 4600; Cumulative Energy Demand (KEA): Terms, Definitions, METHODS of Calculation. Association of German Engineers. Beuth Verlag GmbH: Berlin, Germany, 2012.
  44. VDI 4600-1; Cumulative Energy Demand: Examples. Association of German Engineers. Beuth Verlag GmbH: Berlin, Germany, 2015.
  45. Schmidt-Bleek, F. Das MIPS-Konzept: Weniger Naturverbrauch—Mehr Lebensqualität durch Faktor 10; Droemer Knaur: München, Germany, 1998; ISBN 3426269821. [Google Scholar]
  46. Szargut, J. Minimization of the consumption of natural resources. Bull. Polish Acad. Sci. Tech. Sci. 1978, 26, 41–46. [Google Scholar]
  47. Hau, J.L.; Bakshi, B.R. Expanding Exergy Analysis to Account for Ecosystem Products and Services. Environ. Sci. Technol. 2004, 38, 3768–3777. [Google Scholar] [CrossRef] [PubMed]
  48. Odum, H.T. Environmental Accounting: Emergy and Environmental Decision Making; Wiley: New York, NY, USA, 1996; ISBN 0471114421. [Google Scholar]
  49. Cornelissen, R.L. Thermodynamics and Sustainable Development: The Use of Exergy Analysis and the Reduction of Irreversibility. Ph.D. Thesis, Universiteit Twente, Enschede, The Netherlands, 1997. [Google Scholar]
  50. Gong, M.; Wall, G. On exergetics, economics and optimization of technical prozesses to meet environmental conditions: Exergy Studies. In Thermodynamic Analysis and Improvement of Energy Systems, Proceedings of the International Conference, Obninsk, Russia, 10–13 June 1997; Cai, R., Moran, M.J., Eds.; World Publishing Corporation: Beijing, China, 1997; pp. 453–460. ISBN 7-5062-3264-Z. [Google Scholar]
  51. VDI 4663-1; Evaluation of Energy and Material Efficiency—Methodical Application of the Physical Optimum. Association of German Engineers: Draft. Beuth Verlag GmbH: Berlin, Germany, 2019.
  52. Torres, T.M.; Barros, C.M.; Bello, P.M.; Casares, J.J.; Rodriguez-Blas, J.M. Energy and material flow analysis: Application to the storage stage of clay in the roof-tile manufacture. Energy 2008, 33, 963–973. [Google Scholar] [CrossRef]
  53. United Nations; European Commission; International Monetary Fund; Organisation for Economic Co-operation and Development; World Bank. Handbook of National Accounting: Integrated Environmental and Economic Accounting; Final draft circulated for information prior to official editing Series F, No.61, Rev.1 (ST/ESA/STAT/SER.F/61/Rev.1); 2003. Available online: https://unstats.un.org/unsd/environment/seea2003.pdf (accessed on 14 July 2022).
  54. Bao, Z.; Zhang, S.; Chen, Y.; Liu, S.; Zhang, Y.; Wang, H. A Review of Material Flow Analysis. In Proceedings of the 2010 International Conference on Management and Service Science, Wuhan, China, 24–26 August 2010; pp. 1–8. [Google Scholar] [CrossRef]
  55. Guinée, J.B.; van der Voet, E. Risks of metal flows and accumulation. In A Handbook of Industrial Ecology; Ayres, L., Ayres, R.U., Eds.; Edward Elgar Pub: Cheltenham, UK; Northampton, MA, USA, 2002; pp. 382–390. ISBN 1-84064-506-7. [Google Scholar]
  56. Szargut, J.; Morris, D.R.; Steward, F.R. Exergy Analysis of Thermal, Chemical and Metallurgical Processes; Hemisphere Publ. Corp: New York, NY, USA, 1988; ISBN 9780891165743. [Google Scholar]
  57. Riedl, K. Exergetische und Exergoökonomische Bewertung von Verfahren der Energie- und Stoffwandlung. Ph.D. Thesis, Martin Luther University Halle-Wittenberg, Merseburg, Germany, 2007. [Google Scholar]
  58. Volta, D.; Weber, S.A. The Physical Optimum as an Ideal Reference Value for Balancing Thermodynamic Processes Integrating the Exergetic Evaluation by the Example of Heat Supply. Energies 2021, 14, 4426. [Google Scholar] [CrossRef]
  59. Guinee, J.B. (Ed.) Handbook on Life Cycle Assessment: Operational Guide to the ISO Standards; Springer: Dordrecht, The Netherlands, 2002. [Google Scholar]
  60. Heijungs, R. Towards eco-efficiency with LCA’s prevention principle: An epistemological foundation of LCA using axioms. In Product Innovation and Eco-Efficiency: Twenty-Three Industry Efforts to Reach the Factor 4; Klostermann, J.E.M., Tukker, A., Eds.; Springer: Dordrecht, The Netherlands, 1998; pp. 175–185. ISBN 9789401589451. [Google Scholar]
  61. Hoekstra, A.Y. Human appropriation of natural capital: A comparison of ecological footprint and water footprint analysis. Ecol. Econ. 2009, 68, 1963–1974. [Google Scholar] [CrossRef]
  62. Rosenbaum, R.K.; Hauschild, M.Z.; Boulay, A.-M.; Fantke, P.; Laurent, A.; Nunez, M.; Vieira, M. Life Cycle Impact Assessment. In Life Cycle Assessment; Hauschild, M.Z., Rosenbaum, R.K., Olsen, S.I., Eds.; Springer International Publishing: Cham, Swierland, 2018; pp. 167–270. [Google Scholar]
  63. Čuček, L.; Klemeš, J.J.; Kravanja, Z. A Review of Footprint analysis tools for monitoring impacts on sustainability. J. Clean. Prod. 2012, 34, 9–20. [Google Scholar] [CrossRef]
  64. Cornelissen, R.L.; Hirs, G.G. The value of the exergetic life cycle assessment besides the LCA. Energy Convers. Manag. 2002, 43, 1417–1424. [Google Scholar] [CrossRef]
  65. Brown, M.T.; Ulgiati, S. Energy quality, emergy, and transformity: H.T. Odum’s contributions to quantifying and understanding systems. Ecol. Modell. 2004, 178, 201–213. [Google Scholar] [CrossRef]
  66. Keichel, C. Methode der Grenzwertorientierten Bewertung. Ph.D. Thesis, Technische Universität Clausthal, Clausthal, Germany, 2017. [Google Scholar]
  67. Fang, K.; Heijungs, R.; de Snoo, G.R. Theoretical exploration for the combination of the ecological, energy, carbon, and water footprints: Overview of a footprint family. Ecol. Indic. 2014, 36, 508–518. [Google Scholar] [CrossRef]
  68. Stahl, B. Methodenvergleich und Methodenentwicklung zur Lösung der Bewertungsproblematik in Produktbezogenen Ökobilanzen. Ph.D. Thesis, Universität Bremen, Bremen, Germany, 1998. [Google Scholar]
  69. Meyer, R.; Benetto, E.; Mauny, F.; Lavandier, C. Characterization of damages from road traffic noise in life cycle impact assessment: A method based on emission and propagation models. J. Clean. Prod. 2019, 231, 121–131. [Google Scholar] [CrossRef]
  70. Myllyviita, T.; Sironen, S.; Saikku, L.; Holma, A.; Leskinen, P.; Palme, U. Assessing biodiversity impacts in life cycle assessment framework—Comparing approaches based on species richness and ecosystem indicators in the case of Finnish boreal forests. J. Clean. Prod. 2019, 236, 117641. [Google Scholar] [CrossRef]
  71. Mattila, T.J. Use of Input–Output Analysis in LCA. In Life Cycle Assessment; Hauschild, M.Z., Rosenbaum, R.K., Olsen, S.I., Eds.; Springer International Publishing: Cham, Switzerland, 2018; pp. 349–374. [Google Scholar]
  72. Bonnin, M.; Azzaro-Pantel, C.; Pibouleau, L.; Domenech, S.; Villeneuve, J. Development and validation of a dynamic material flow analysis model for French copper cycle. Chem. Eng. Res. Des. 2013, 91, 1390–1402. [Google Scholar] [CrossRef]
  73. Pivnenko, K.; Laner, D.; Astrup, T.F. Material Cycles and Chemicals: Dynamic Material Flow Analysis of Contaminants in Paper Recycling. Environ. Sci. Technol. 2016, 50, 12302–12311. [Google Scholar] [CrossRef]
  74. Kleijn, R.; Huele, R.; van der Voet, E. Dynamic substance flow analysis: The delaying mechanism of stocks, with the case of PVC in Sweden. Ecol. Econ. 2000, 32, 241–254. [Google Scholar] [CrossRef]
  75. Su, S.; Li, X.; Zhu, Y.; Lin, B. Dynamic LCA framework for environmental impact assessment of buildings. Energy Build. 2017, 149, 310–320. [Google Scholar] [CrossRef]
  76. Bjorn, A.; Moltesen, A.; Laurent, A.; Owsianiak, M.; Corona, A.; Birkved, M.; Hauschild, M.Z. Life Cycle Inventory Analysis. In Life Cycle Assessment; Hauschild, M.Z., Rosenbaum, R.K., Olsen, S.I., Eds.; Springer International Publishing: Cham, Switzerland, 2018; pp. 117–165. [Google Scholar]
  77. Alizadeh kheneslu, R.; Jahangiri, A.; Ameri, M. Interaction effects of natural draft dry cooling tower (NDDCT) performance and 4E (energy, exergy, economic and environmental) analysis of steam power plant under different climatic conditions. Sustain. Energy Technol. Assess. 2020, 37, 100599. [Google Scholar] [CrossRef]
  78. Eggers, N.; Böttger, J.N.J.; Kerpen, L.; Sankol, B.U.; Birth, T. Refining VDI guideline 4663 to evaluate the efficiency of a power-to-gas process by employing limit-oriented indicators. Energy Effic. 2021, 14, 73. [Google Scholar] [CrossRef]
  79. Schebek, L.; Herrmann, C.; Cerdas, F. (Eds.) Progress in Life Cycle Assessment; Springer International Publishing: Cham, Switerland, 2019; ISBN 978-3-319-92237-9. [Google Scholar]
  80. VDMA 24659; Economic Analysis and Partial Carbon Footprint of Evaporative Cooling Equipment: Guideline for Ealculation. Beuth Verlag GmbH: Berlin, Germany, 2016.
  81. Mertens, J.; Prieur-Vernat, A.; Corbisier, D.; Favrot, E.; Boon, G. Water footprinting of electricity generated by combined cycle gas turbines using different cooling technologies: A practitioner’s experience. J. Clean. Prod. 2015, 86, 201–208. [Google Scholar] [CrossRef]
  82. Guerras, L.S.; Martín, M. On the water footprint in power production: Sustainable design of wet cooling towers. Appl. Energy 2020, 263, 114620. [Google Scholar] [CrossRef]
  83. Muangnoi, T.; Asvapoositkul, W.; Wongwises, S. An exergy analysis on the performance of a counterflow wet cooling tower. Appl. Therm. Eng. 2007, 27, 910–917. [Google Scholar] [CrossRef]
  84. Ünver, Ü.; Mert, M.S.; Direk, M.; Yüksel, F.; Kılıç, M. Design of an Inlet Air-Cooling System for a Gas Turbine Power Plant. In Exergy for A Better Environment and Improved Sustainability; Aloui, F., Dincer, I., Eds.; Springer International Publishing: Cham, Switzerland, 2018; pp. 1089–1100. ISBN 978-3-319-62571-3. [Google Scholar]
  85. Jakrawatana, N.; Ngammuangtueng, P.; Gheewala, S.H. Linking substance flow analysis and soil and water assessment tool for nutrient management. J. Clean. Prod. 2017, 142, 1158–1168. [Google Scholar] [CrossRef]
  86. Meyer, L. Exergiebasierte Untersuchung der Entstehung von Umweltbelastungen in Energieumwandlungsprozessen auf Komponentenebene: Exergoökologische Analyse; Technische Universität Darmstadt: Darmstadt, Germany, 2006; ISBN 3932518748. [Google Scholar]
  87. Borrett, S.R.; Sheble, L.; Moody, J.; Anway, E.C. Bibliometric review of ecological network analysis: 2010–2016. Ecol. Modell. 2018, 382, 63–82. [Google Scholar] [CrossRef]
Figure 1. Word cloud of the criteria defined for method comparison in previous studies; in parentheses is the number of studies that use these criteria, based on [12,17,18,19,20,24,27,28,29]. The criteria are sorted by overall objectives: green = ‘application area’, blue = ‘thoroughness’, and black = ‘usability, soundness’. The number in parentheses represents the times the criteria were used in the studies.
Asi 05 00089 g001
Figure 2. Structure of the criteria-based comparison method and a classification example of whether a method fulfills the criteria and partial aspects (left column) and whether they should be fulfilled for the use case (right column). This results in suitability for each criterion and partial aspect, which, in the sum of all criteria, leads to the overall result.
Asi 05 00089 g002
Figure 3. Flowchart depicting an example of how the suitability of energy analysis and exergy analysis for the use case of evaluating cooling towers is derived based on the multi-criteria comparison (applicable = black, non-applicable = white, ‘maybe’ = grey). For simplification, only the most critical objectives, criteria, and discrepancies are listed in each case.
Asi 05 00089 g003
Table 1. Review of criteria-based comparison approaches for energy and environmental assessment methods.
Aktsoglou and Gaidajis
[16]
Baumann and Cowell
[17]
Moberg
[18]
Finnveden et al.
[19]
Ness et al.
[14]
Blanc and Friot
[15]
Loiseau et al.
[13]
Rodríguez et al.
[12]
Examined Methods
PIOTX X
SFAXX X XX
MFAX XXXX
Energy Analysis X X
ENA XX
LCAXXXXXXXX
Carbon Footprint
Water FootprintX X
Ecological FootprintX X XXXX
MIPS X X
Emergy AnalysisX X X XX
Exergy AnalysisX X X XX
Criteria
Life Cycle Thinking XX
Inventoried Flows X XX
Indicators ProvidedX XXXXX
Efficiency ConceptXXX X X
Temporal ResolutionXX X
Spatial ResolutionXX X XX
Scientific Soundness X X X
FormalizationX XXX
Data Availability X XXX
Table 2. Objectives and criteria for comparing energy and environmental assessment methods.
ObjectiveCriteriaPartial Aspect (If Needed)Underlying Question
Applicable for the Studied
Objects
ProcessApplicable to this type of studied object?
ProductApplicable to this type of studied object?
ServiceApplicable to this type of studied object?
Region/SectorApplicable to this type of studied object?
Thoroughness: Completeness and ResolutionLife Cycle ThinkingEntire life cycle considered, cradle-to-grave?
Inventoried
Physical Quantities
Energy (J)Is this physical quantity inventoried?
Mass of Operating Materials (kg)Is the mass of these materials inventoried?
Mass of Construction Materials (kg)Is the mass of these materials inventoried?
Mass of Emissions (kg)Is the mass of these materials inventoried?
Temperature (K), Pressure (Pa)Are the pressure and temperature inventoried?
Impact
Categories
Exergy (J)Is this impact category addressed?
Climate Change (kg CO2-eq)Is this impact category addressed?
Water/Land Use/… (m3, ha, …)Is this impact category addressed?
NoiseIs noise considered?
Efficiency AnalysisIs it referred to as a useful output?
Temporal Resolution (Dynamic Analysis)Is a dynamic analysis intended or possible?
Spatial or Sectoral ResolutionIs a bottom-up analysis intended?
Usability,
Soundness
Pure Analysis based on Physical QuantitiesIs the method scientifically sound?
Formalization (Methodological Framework, Rigor)Are there mature and strict standards?
Data AvailabilityAre the required data available, e.g., as databases?
Existing studies on Cooling SystemsAre there studies assessing cooling systems?
Table 3. Overview of examined methods and underlying standards.
Abbr.NameDescriptionReferences
First-Law Analysis Methods
PIOTPhysical Input–Output TablePhysical equivalent of the monetary input–output analysis (or table) regarding a sectoral perspectiveRadermacher and Stahmer [33]
SFASubstance Flow AnalysisInput–output analysis, mostly includes only one or a limited group of undesirable substancesEC [34]
MFAMaterial Flow AnalysisInput–output analysis, may also include energy flows, mostly referring to a national economyEC [34]; Brunner and Rechberger [35]
EAEnergy AnalysisQuantification of direct and indirect energy inputs of economic productionIFIAS [36]; first law of thermodynamics
ENAEcological Network AnalysisObjects studied as part of a connected system; the indirect effects can be identified and quantifiedFath and Patten [37]
LCILife Cycle Inventory‘Compilation and quantification of inputs and outputs for a product throughout its life cycle’, phase of LCA [2] (p. 7)ISO 14040 [2] and 14044 [38]
Energy and Environmental Assessment Methods
LCALife Cycle Assessment‘Compilation and evaluation of the inputs, outputs and the potential environmental impacts of a product system throughout its life cycle’ [2] (p. 7) ISO 14040 [2] and 14044 [38]
CFCarbon Footprint‘Sum of GHG [greenhouse gas] emissions […] and GHG removals […] based on an life cycle assessment […] using the single impact category […] of climate change’ [39] (p. 16) (kg CO2eq/functional unit)ISO 14067 [39]
WFWater FootprintVolumetric accounting of water referred to a functional unit (m3/functional unit) or ‘metric(s) that quantifies the potential environmental impacts related to water’ [40] (p. 13)ISO 14046 [40]; Hoekstra et al. [41]
EFEcological FootprintConverts the environmental impact to theoretical area used to produce the bio resources and assimilate waste (ha/functional unit)Wackernagel and Rees [42]
CEDCumulative Energy Demand‘entire demand, valued as primary energy, which arises in connection with the production, use and disposal of an economic good (product or service) or which may be attributed respectively to it in a causal relation’ [43] (p. 6) (kJ/functional unit)VDI 4600 [43]; VDI 4600-1 [44]
MIPSMaterial Input per ServiceConverts the environmental impact to material theoretically used per functional unit, life cycle (t/service)Schmidt-Bleek [45]
CExCCumulative Exergy ConsumptionUpstream resource consumption of a product is considered by its exergy (only materials, energy carriers, and products)Szargut [46]
ECECEcological Cumulative Exergy ConsumptionUpstream resource consumption of a product is considered by its exergy (exergy of natural resources/ecosystem)Hau and Bakshi [47]
EmAEmergy AnalysisUpstream resource consumption considered by emergy, which is work completed by nature or man for the realization of a product or serviceOdum [48]
ELCAExergetic Life Cycle AssessmentLife cycle irreversibility as the exergy loss during the life cycle is the impact category (LCA extension) (kJloss/functional unit)Cornelissen [49]
LCEALife Cycle Exergy AnalysisConverts the environmental impact to natural resource consumption measured by exergy (kJ/functional unit)Gong and Wall [50]
ExAExergy AnalysisSecond-law analysis, definition of useful outputSecond law of thermodynamics
PhOPhysical Optimum MethodPhO as ideal reference value, PhO factor = real/limit value (PhO)VDI 4663-1 [51]
Table 4. Multi-criteria comparison of energy and environmental assessment methods focusing on cooling systems (applicable = black, non-applicable = white, ‘maybe’ = grey); references for the assessment in each cell, whether it is applicable or not, can be found in the superscript number in the footnote. The last column includes the authors’ assessment of how important each criterion is for evaluating cooling towers.
ObjectivesCriteriaPartial AspectMFAEnergy AnalysisENALCILCAFootprintsEmergy AnalysisExergy AnalysisPhOExemplary Weighting
Applicable for the Studied
Objects
Process 1 2 3 4
Product 55 56557
Service 268
Region/Sector 2655
Thoroughness:
Completeness and Resolution
Life Cycle Thinking 9 9 2, 9699
Inventoried
Physical
Quantities
Energy (J)2, 10 11, 12 4
Mass of Operating Materials (kg)2 12 4
Mass of Construction Materials (kg)
Mass of Emissions (kg) 7
Temperature (K) and Pressure (Pa) 4
Impact
Categories
Exergy (J) 2, 8
Climate change (kg CO2-eq)
Water/Water Use/Others (m3, ha…)
Noise 132, 8
Efficiency Reference 14 7
Temporal Resolution (Dynamic Analysis)15 16 7
Spatial or Sectoral Resolution9 9991499
Usability,
Soundness
Pure Analysis based on Physical Quantities3 3173
Formalization (Methodological Framework and Rigor)14181414141414
Data Availability14 141414141414
Existing Studies on Cooling Systems1920 2122 234, 24
1 [85] (p. 1159), 2 [68] (pp 5–16,35), 3 [47] (p. 3768), 4 [58], 5 [14], 6 [62] (pp. 197–201), 7 [66] (pp 39,50), 8 [86] (p. 26), 9 [13] (p. 220), 10 [34] (p. 11), 11 [87] (p. 63), 12 [37] (p. 167), 13 [69], 14 [12] (p. 1467), 15 [72,73], 16 [75], 17 [67] (p. 512), 18 [36], 19 [4], 20 [77], 21 [3,5], 22 [80,81,82], 23 [77,83,84], and 24 [78].
Publisher’s Note: MDPI stays neutral with regard to jurisdictional claims in published maps and institutional affiliations.

