1. Introduction
According to research by the World Health Organization, the consumption of foods with all their diversity is accompanied by a large deficiency of important nutrients such as antioxidants, organic acids, and minerals, etc., which leads to a decrease in body resistance, weakened immunity, and the development of chronic diseases. According to the US Department of Health, the daily intake of antioxidants necessary for the human body should be from 3000 to 5000 units of ORAC (Oxygen Radical Absorption Capacity)—a unit for measuring the number of antioxidants, expressed in micromoles of Trolox-C per unit mass (μTE/100 g). An insufficient number of antioxidants in the body increases the risk of the onset and progression of cardiovascular and oncological diseases. To improve health, it is advisable to use food products enriched with biologically active substances, which include antioxidants. The experience of introducing a healthy eating program in Japan has shown its effectiveness and helped to increase life expectancy in the country by 8 years. Long-term studies of the antioxidant activity of vitamins, bioflavonoids, and enzymes, conducted by Dr. Harman of the University of Nebraska, led to the creation of the “Free Radical Theory of Aging” in 1956 [
1]. In the same year, Soviet academician N. N. Semenov received the Nobel Prize for the discovery of free radicals. The theory of D. Harman boils down to the fact that in the human body, under the influence of adverse environmental factors (solar radiation, stress, etc.), free radicals are formed that negatively affect the cell organoids (mitochondria), and can also cause DNA mutations and oncological diseases. The natural obstacle to the formation of free radicals is the antioxidant system of the human body. The antioxidant substances included in them interact with free radicals and exhibit the properties of electron donors, thereby preventing the oxidation process [
2,
3].
Recently, numerous studies have been conducted that confirm the high biological value and antioxidant activity of grape wines and other functional food products based on a more complete use of all of the components of grapes and bunches [
4,
5,
6,
7,
8] and methods for determining their antioxidant activity have been developed. However, among the many developed methods, it is difficult to choose the most informative and accessible to use [
9,
10,
11].
It is possible to distinguish groups of methods for determining AOA: titrimetric (in particular, coulometric, voltammetric, potentiometric, polarography); chromatographic (thin-layer chromatography, high-performance liquid chromatography); and spectral (spectrophotometry, TAC, TAEC, TBARP, DPPH, FRAP, CUPRAC, ABTS).
The method of amperometric determination of antioxidant properties is the closest to the method of electrochemical oxidation, which allowed D. Harman to formulate the “Free Radical Theory of Aging”. The amperometric method for evaluating AOA consists of measuring the strength of the electric current that occurs during the oxidation of the test substance (or mixture of substances) on the surface of the working electrode at a certain potential and then comparing the received signal with the signal from the standard (quercetin) under the same measurement conditions.
The chemiluminescence method is the most standardized method for determining antioxidant properties in Europe and imitates the ability of living cells to participate in photosensitizing processes. Chemiluminescent methods for determining antioxidant activity are based on the phenomenon of chemiluminescence—the ability of radicals (superoxide of anion radicals, hydroxyl, and lipid radicals) to glow during the recombination reaction as a result of the optical excitation of particles of a photosensitizing substance added to a certain amount of the analyzed sample.
To measure the antioxidant activity (AOA) in world practice, various chemical and physicochemical methods are currently used, most of which are based on determining the effect of antioxidants on the degree of oxidation, while the determination of the AOA indicator itself is carried out in relation to free radicals [
9].
Currently, the most widely used methods for determining AOA include: photocolorimetric and fluorimetric methods; methods based on electron paramagnetic resonance spectroscopy; chemiluminescent and amperometric methods [
10,
11,
12,
13,
14,
15,
16]. The phenolic substances that form the phenolic profile of wines exhibit a high antioxidant capacity due to the high reactivity of the hydroxyl groups that are a part of them [
11,
17].
We also note that in wines, the AOA value can be affected by phenolic compounds as well as organic and amino acids.
The aim of the study is, in particular, to identify the most informative and accessible methods for determining the antioxidant activity of table wine materials and compare the results of regression analysis of factors affecting AOA in the standard Excel program and in the Neural Network Regression Model (NNRM).
2. Materials and Methods
The materials for this study were young single-grade white and red table wine materials produced under conditions of the Black Sea region: “Aligote”, “Cabernet Sauvignon”, “Merlot”, “Riesling of the Rhine”, “Rkatsiteli”, “Bastardo Magarachsky”, and varietal sherry wine material.
We used gallic acid, quercetin (Fluka Chemie AG, Switzerland), and Trolox-C (Sigma-Aldrich, Switzerland) as reagents.
The antioxidant activity was determined using the amperometric method in the analyzer of the antioxidant activity of substances Tsvet YAUZA-01-AA. For this, the method No. 00334830-055-2008, approved by the Institute of viticulture and winemaking “Magarach”, was used. To determine AOA by the chemiluminescent method, a Photochem (Analytik Jena AG) [
12,
18] instrument was used. Method No. 00334830-075-2010, approved by the Institute of viticulture and winemaking “Magarach”, was used. These guidelines describe all of the necessary conditions and standards (basic preparations, reagents used, concentration of reagents, time and development of the analysis, etc.). In our subsequent publications, we intend to describe these techniques in detail.
The range of determination of antioxidant activity by the chemiluminescent method is from 5 µmol/dm
3 to 2 mol/dm
3 in terms of the Trolox-C standard. The content of water-soluble antioxidants was determined by the amperometric method in the range from 0.2 to 4.0 mg/dm
3 inclusive (
Table 1).
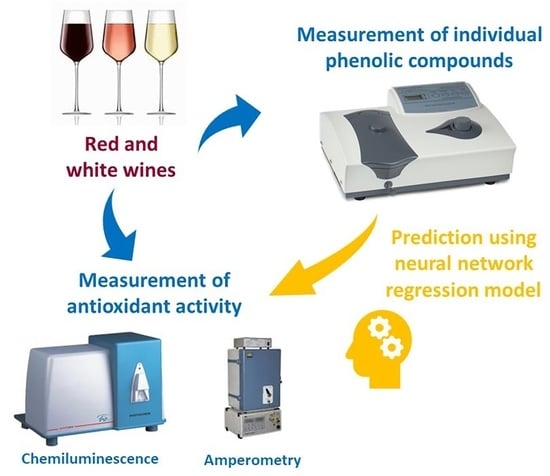
The amperometric method for determining antioxidant activity is most widely used in the CIS countries, while the chemiluminescent method, which is a fast and highly accurate method for determining antioxidant activity, is widely used in Europe. The mass concentration of phenolic substances was determined by the photocolorimetric method on a Unico 1200 spectrophotometer manufactured by United products and instruments (USA) [
13,
14]. A schematic description of the research process of comparative analysis of methods for determining antioxidant activity and determining the phenolic profile of wines is presented in
Figure 1.
To assess the potential ability of wines to exhibit AOA, it is important to determine the mass concentration of the sum of phenolic substances. The generally accepted method to determine the mass concentration of phenolic substances is based on measuring the number of phenolic substances by changing their color during oxidation with the Folin–Ciocalteu reagent, consisting of a mixture of phosphoric-tungsten H
3PW
120
40 and phosphoric-molybdenum H
3PMo
12O
40 acids, which are reduced by the oxidation of phenols into a mixture of tungsten oxides (W
8O
23) and molybdenum (Mo
8O
23) of the blue color [
13,
19]. The determination is carried out in an alkaline medium, at a wavelength of 765 nm.
Qualitative and quantitative analysis of the phenolic composition of the analyzed wines was determined by HPLC using an Agilent Technologies chromatographic system (model 1100) with a diode array detector.
To separate substances, a Zorbax SB-C18 chromatographic column with a size of 2.1–150 mm was used, filled with silica gel with a grafted octadecylsilyl phase with a sorbent particle size of 3.5 μm. Chromatography was carried out in a gradient mode. Eluent composition: solution A—methanol, solution B—0.6% aqueous solution of trifluoroacetic acid. The composition of the eluent during chromatography changed according to the content of component B, according to the following scheme: 0 min 8%; 0–8 min 8–38%; 8–24 min 38–100%; and 24–30 min 100%. Eluent flow rate 0.25 cm3/min. The volume of the injected sample is 2 µL.
Chromatograms were recorded at the following wavelengths:
- -
280 nm—gallic acid, (+)-D-catechin, (−)-epicatechin and procyanidins;
- -
313 nm—derivatives of hydroxycinnamic acids;
- -
371 nm—quercetin.
Gallic acid, caffeic acid, (+)-D-catechin, quercetin, isoquercitrin (Buchs, Fluka Chemie AG, Switzerland) and (−)-epicatechin, and syringic acid (Buchs, Sigma-Aldrich, Switzerland) were used as standards.
Individual compounds were identified by comparing their spectral characteristics with the spectra described in the literature and by the coincidence of the retention time of the determined peak and the peak of the standard sample [
20,
21].
Electrochemical methods to determine AOA are based on the principle of the donor–acceptor interaction of antioxidants and free radicals. These methods are characterized by high sensitivity and speed of analysis. The determination of the integral value of antioxidant activity by electrochemical methods is based on the registration of the electron transfer process caused by the interaction of reactive oxygen species in a liquid medium [
4,
12].
The amperometric method for evaluating AOA consists in measuring the strength of the electric current that occurs during the oxidation of the test substance (or mixture of substances) on the surface of the working electrode at a certain potential and then comparing the received signal with the signal from the standard (quercetin) under the same measurement conditions. This method includes sample preparation of the analyzed and standard substances, their electro-oxidation in the cell of an amperometric detector, amplification of electrical signals, and their registration and calculation of AOA according to the proposed mathematical dependence which is then used for the analysis of multicomponent systems without their preliminary separation [
22,
23,
24,
25,
26,
27,
28]. The amperometric method allows us to estimate the total AOA with high accuracy and reproducibility using the equipment of domestic production and the amperometric flow analyzer “Tsvet-Yauza-01-AA”. Determination of the content of water-soluble antioxidants by the amperometric method in vegetables, fruits, their processed products, and alcoholic and non-alcoholic beverages. Five consecutive measurements of the analyzer output signal are carried out for each prepared parallel sample of the analyzed sample using a calibration characteristic; the value of the total content of water-soluble antioxidants (in terms of quercetin) is calculated for each input. The arithmetic means of the values obtained and the relative standard deviation are calculated. The arithmetic mean value is taken as the result of the measurements of the total content of water-soluble antioxidants (in terms of quercetin) in the prepared parallel sample of the relative standard deviation [
29,
30].
The total content of water-soluble antioxidants in the analyzed sample CA, mg/dm
3, is calculated using the equation:
where CA
K is the total content of antioxidants (in terms of quercetin), mg/dm
3.
For the final result of measurements of the total content of the determined antioxidant in the sample, with the rounding of the third digit, the arithmetic mean value (Xsr, mg/dm
3, or Xsr, mg/g) is taken from the results of two parallel determinations, the discrepancy between which does not exceed the repeatability limit equal to gotn = 5% (according to the standard of operational control, % (at
p = 0.95)). The measurement results of the total content of the analyzed antioxidants in the product are presented in the form:
where Δ is the limit of the absolute measurement error, mg/g.
The value is calculated by the following equation:
where δ
x is the limit of the relative measurement error of the total content of the analyzed antioxidant (δ
x ± 7%).
Chemiluminescent methods for determining antioxidant activity are based on the phenomenon of chemiluminescence—the ability of radicals (superoxide of anion radicals, hydroxyl, and lipid radicals) to glow during the recombination reaction, as a result of the optical excitation of particles of a photosensitizing substance added in a certain amount to the analyzed sample. Thus, a part of the free radicals is inactivated while the remaining part causes luminescence of the sensitive substance, which is most often luminol. Currently, known chemiluminescent methods differ in the method and type of free radical generated, as well as the chemiluminescence activator used [
12,
22].
The samples for error control were samples of the standard substance—Trolox-C (6-hydroxy-2,5,7,8-tetramethylchroman-2-carboxy acid) approved according to the established procedure, the value of the antioxidant ability of which was established as an arithmetic mean when measuring the results five times. B is the signal curve of the blank sample; A is the signal curve of the analyzed sample.
Calculating the difference (S) between the integral of the average value of the blank signals (B) and the signal of the sample curve (A) is calculated by the equation:
where S is the area under the blank sample signal curve and the area above the sample signal curve; B is the average value of the blank signals; A is the signal of the sample curve.
The inhibition coefficient I is determined by the equation:
where I is the inhibition coefficient.
All calculations are performed automatically by the PCLsoft software and are used to build the calibration curve and calculations. The measurement result is an integer value, taking into account the corresponding dilution coefficient. The relative error of the method with a confidence probability of p = 0.95 is δ ± 10%. The chemiluminescent method for determining AOA is used to determine the antioxidant activity of water- and alcohol-soluble antioxidants.
The AOAch was estimated with the use of the “Photochem” device of Analytik Jena AG in a slightly alkaline medium and luminol was used as a chemiluminescence activator which can be easily oxidized by active oxygen forms (O2−, OH−, H2O2, OCl−, ONOO−) to the 3-aminophthalate anion. After that, the luminescence was measured in a separate cell using a photomultiplier. The addition of an antioxidant led to a decrease in chemiluminescence, which has a certain induction period, so the measured luminescence signal was recorded for 1–3 min.
3. Results
We have studied the methods for determining the mass concentration of phenolic substances by Folin–Ciocalteu using two standards: gallic acid and Trolox-C; AOA in wine samples by the following methods: chemiluminescent and amperometric. The results of our studies are presented in
Table 2.
3.1. Comparison of Methods for Determining AOA
For the first time, we conducted: a comparison of measurements of the mass concentration of phenolic substances simultaneously according to two standards: gallic acid and Trolox-C; a comparison of measurements of the antioxidant activity of white and red table wine materials by amperometric and chemiluminescent methods.
Comparison of amperometric and chemiluminescent methods for determining the AOA of white and red table wine materials.
Regression analysis was used to obtain a regression equation expressing the relationship between the indicators of antioxidant activity of white and red table wine materials determined by amperometric and chemiluminescent methods (
Figure 1).
where R
2 is the value of the reliability of the determination.
In addition, a regression equation was obtained that expresses the relationship between the indicators of the antioxidant activity of red table wine materials, determined by amperometric and chemiluminescent methods (
Figure 2).
where R
2 is the value of the reliability of the determination.
where R
2 is the value of the reliability of the determination.
The performed regression analysis showed the presence of a high degree of correlation between the AOA indicators of table wine materials, determined by amperometric and chemiluminescent methods. The determination value for white table wine materials was 0.7827, for red wine materials—0.9714. The joint determination of the coefficient of determination of the indicators of AOAam and AOAch of white and red table wine materials amounted to 0.9801.
Comparison of the mass concentration indicator of phenolic substances, determined by the photocolorimetric method using gallic acid and Trolox-C as standards, showed that there is a mathematical relationship between these indicators, which is expressed in the coefficient of recalculation of these values, which amounted to 3.75. Thus, knowing the mass concentration of phenolic substances in gallic acid, it is possible to calculate the value of this indicator for Trolox-C, multiplying it by 3.75 and vice versa.
Based on the data (
Table 2), a graph is built expressing the correlation between the AOA
am indicator and the mass concentration of phenolic substances, calculated according to the standard—gallic acid (
Figure 3).
where x is the mass concentration of phenolic substances, determined according to the gallic acid standard, g/dm
3; R
2—value of determination reliability.
Regression analysis of the data (
Table 2) made it possible to obtain the regression equation for the AOA
am indicator and the mass concentration of phenolic substances, calculated according to the standard—Trolox-C (
Figure 3).
where x is the mass concentration of phenolic substances, determined according to the Trolox-C standard, g/dm
3; R
2—determination confidence value.
The performed regression analysis showed close correlation values of the AOA
am indicator of white table wine materials and the mass concentration of phenolic substances, determined according to the standards—gallic acid and Trolox-C. The determination value for the white table wine materials when used as a standard, gallic acid was 0.8363, and in the case of Trolox-C—0.8375 (
Figure 3).
The performed regression analysis showed close correlation values of the AOA
am indicator of red table wine materials and the mass concentration of phenolic substances, determined according to the standards—gallic acid and Trolox-C (
Figure 4).
where x is the mass concentration of phenolic substances, determined according to the gallic acid standard, g/dm
3; R
2—determination confidence value.
where x is the mass concentration of phenolic substances, determined according to the Trolox-C standard, g/dm
3; R
2—determination confidence value.
where x is the mass concentration of phenolic substances, determined according to the gallic acid standard, g/dm
3; R
2—determination confidence value. The total content of phenolic substances and antioxidant activity (
Figure 5).
The analysis of amperometric and chemiluminescent methods of determining AOA was carried out and the main principles of these methods and the mechanisms of detecting antioxidants were revealed. Regression analysis of indicators of the mass concentration of phenolic substances (for gallic acid and Trolox-C), amperometric and chemiluminescent methods for determining AOA was carried out.
The conversion coefficient of the indicator of the mass concentration of phenolic substances according to Folin–Ciocalteu was determined when using gallic acid and Trolox-C as a standard, which was 3.75. By the amperometric method of determining the antioxidant activity, it was found that red table wine materials exhibit greater antioxidant activity, ranging from 1.082 to 2.200 g/dm3, than white ones, in which the value of this indicator varies from 0.236 to 0.663 g/dm3.
The use of the chemiluminescent method for determining antioxidant activity allowed us to identify the regularity of changes in AOA in white and red wine materials. At the same time, data were obtained on the antioxidant activity of certain types of white table wine materials that make up the AOA range from 0.563 g/dm3 to 1.173 g/dm3—in wine material from the Rkatsiteli grape variety growing in the Sevastopol zone, while in red—the AOA value varied from 8.134 g/dm3 to 11.022 g/dm3. Regression analysis allowed us to establish the correlation of AOAam and AOAch of white, red, and jointly white and red table wine materials, with high values of the determination value, which was 0.7827 for white wine materials, 0.9714 for red, and 0.9801 for joint analysis of white and red wine materials.
The correlation relationship between the values of AOAam of white and red table wine materials and the value of the mass concentration of phenolic substances determined by the colorimetric method (standard—gallic acid, Trolox-C) was established. When used as a standard: gallic acid, the coefficient of determination for white wine materials was—0.8363, red—0.8857; Trolox-C—the value of determination was—in the case of white wine materials—0.8375, red—0.8859. As a result of the regression analysis, a high degree of correlation between the AOAch index of red table wine materials and the mass concentration of phenolic substances in terms of the gallic acid standard was established and the coefficient of determination was 0.9958.
For 18 samples of dry white wines (
Table 3 and
Table 4), the relationship between the AOA value and the phenolic compounds included in their composition was revealed by the method of multiple linear regression of the MLR, the regression equation was derived:
3.2. Prediction of Antioxidant Activity Using Machine Learning
The problem at hand is a regression problem where we want to train a ma-chine-learning model which can accurately predict the antioxidant activity given the required features. A Neural Network Regression Model (NNRM) has been chosen due to its effectiveness in predicting the results in diverse applications [
15]. The implementation has been performed using a
fitrnet function present in the Statistics and Machine Learning Toolbox in MATLAB R2021b.
The function trains a feedforward and fully-connected neural network for regression. By default, NNRM consists of five layers: the first layer represents the input data for prediction; the second layer is a fully-connected layer of neurons having ten outputs; the third layer employs the ReLU activation function to the previous layer; the fourth layer is again a fully-connected layer of neurons having one output; and the last layer represents the predicted outcomes.
Figure 6 demonstrates the procedure followed for NNRM training and testing. The initial input dataset comprises 18 instances, nine predictors, and one target variable. The target, which needs to be predicted, is Antioxidant activity and the features are indicated in
Table 5.
The input data is divided into train (80%) and test data (20%). So, three instances are used for testing and 15 for training.
3.2.1. Training Phase
The NNRM is trained with the training dataset with optimized values of hyperparameters such as Activations, Lambda, LayerSizes, and Standardize. The method chosen for optimization is Bayesian Search. While training, the model takes different values of these parameters and calculates the value of the objective function 20 times to obtain the best hyperparameters values where the objective function has the least value. The objective function considered is ‘’log (1 + cross-validation loss)’’.
Figure 7 shows the plot of best observed objective function value and best estimated objective function value against the iteration number. The plot shown here is the last plot at the 20th iteration because the plot keeps on updating with each function evaluation.
The default values are considered for most of the hyperparameters. However, the significant values considered for training the NNRM are indicated in
Table 6.
3.2.2. Testing Phase
After model training, it is tested on the test data, including three instances in our case. The MSE evaluation metric is evaluated, and its best value (after trying multiple trainings) comes out as “0.0041”. A plot is constructed between the actual and the predicted values of the target variable (
Figure 8). Here, the purple dots and the blue line represent the actual target values of the test instances and the green cross (x) represents the predicted target values. The distance between the predicted points and the model fit line is actually the prediction error.
Mean Squared Error (MSE) was used as an evaluation metric. It is a measure that tells how close a regression line is to a set of predicted points. It calculates the average squared distance between the actual and the predicted values. It is squared to avoid the negative values obtained from subtraction. So, the lower the MSE, the better the prediction.
where
n is the total number of test instances;
Actual is actual value of the target; and
Predicted depicts the predicted value of the target by the trained model.
To compare the performance of the machine-learning model to standard statistical techniques, multiple linear regression (MLR) was also performed on the dataset. This was conducted in R 4.0.5. As with the NNRM method, the data was split into 80% and 20% training and validation sets (
Figure 9).


 ,
, 


