Abstract
Planning and defining places for the installation of police facilities are fundamental to improving the public security service in the urban space. Geographic Information Systems connecting the spatial distribution of police occurrences, budgetary restrictions, and the maximum distance covered are state-of-the-art innovations addressing the need for preventive and responsive police management. The present work proposes a management information system to support the analysis and suggestion of potential police facility locations. The management information system is modeled using k-means for cluster analysis and the definition of candidate locations, and the maximal covering location problem is used to optimize the predefined locations. The proposed system allows the analysis of alternative locations and their impacts on public security. The application in Brazil demonstrates that it is possible to obtain an additional 22% gain in the coverage area of occurrences and an additional reduction of 920 m in terms of the average distance covered when comparing the management information system’s suggested locations to the current configuration. Thus, our assessment provides an efficient tool for supporting decisions regarding the location of police facilities and helps improve the public security service.
1. Introduction
In recent years, the growth in crime rates in Brazil and other Latin American countries has become noticeable [1,2]. In 2017, Brazil experienced a homicide rate of 30.5 per 100,000 people, while the world average was 6.1 [2]. Such a discrepancy can be seen in other criminal indicators (robbery, the theft of cars, serious assault, etc.).
Despite Brazil’s high crime rates, there has been an increasing investment in the area of public security in recent years. Compared to 2017, there was an increase of 3.9% in expenses in this area. However, the expenditure on information and intelligence corresponds to only 0.6% of the total state expenditure. Two alternatives explain this fact: either governments do not effectively invest in information and intelligence—which is the heart of modern police—or the accounting systems of states have serious problems in defining their plans of accounts with regard to classifying expenses according to sub-functions. Given the criminal indicators, the first alternative appears to be more plausible and better explains the situation in Brazil [3].
Still, according to the Brazilian 13th Public Security Yearbook [3], between 1995 and 2018, the real domestic spending on public security (discounting inflation) increased by 116%, while the number of homicides grew by 76.4%. If those resources remained constant throughout these years, the increase in crime would probably be higher. On the other hand, it is reasonable to conjecture that the increase in public security expenditures did little to suppress or curb crime in Brazil due to its low effectiveness. In order to make more effective decisions and act preventively with regard to public security, it is necessary to obtain and analyze information about criminal occurrences and obtain intelligence from the data.
Aiming at minimizing these criminal indices and maximizing efficiency in the application of public security resources, interest in the use of Operational Research (OR) techniques has risen, predominantly through the use of mathematical and statistical models to support decision making in this field [4,5,6,7,8,9,10]. This interest introduced Problem-Oriented Policing (POP) as a new paradigm for tackling crime [11]. Many scholars and practitioners have found crime-reduction strategies in POP that advocate its importance and usability [12,13]. Additionally, the term Police Districting Problem (PDP) aims to define a territorial partition, under the jurisdiction of a police department, in an efficient and effective way with respect to the performance of temporal, cost, and topological attributes [8].
One of the areas of studies that has shown itself to be very promising over time with regard to the support of OR in the public security and preservation of order is the optimal location of police units [9,14,15,16]. According to Owen and Daskin [17], the construction or acquisition of new police facilities is typically an expensive and sensitive project over time. Before carrying out the project, it is necessary to analyze whether the locations of the police facilities are viable according to their operational and strategic objectives. Due to these facts, the difficulties faced by decision makers (the response time for the occurrence, the location of the installation, the coverage area, the number of installations) are notorious, given that they must take into account several factors to maximize the return of investments when allocating a police facility. Operational Research assists decision makers in this difficult task of choosing a location that will not only result in better performance considering the current structure but is also promising in the future under environmental changes [18].
In this context, it is also important to highlight the contribution of spatial analysis as presented by Pánek et al. [19]. As pointed out by Sypion-Dutkowska and Leitner [20], understanding the spatial aspects of crime is fundamental to maintaining and improving public security. According to these authors, most urban criminal events occur in areas that have specific characteristics of land use, facilities, or population. Thus, in their study, these authors sought to identify types of different land uses that influence the spatial distribution of a set of common crime types in urban areas using Geographic Information Systems (GIS). In fact, recent advances in Geographic Information Systems and computer technologies have contributed to more recent advances in the definition of police districts [21].
Thus, the contribution of the OR and information technologies in the context of public security can be observed in the literature. Additionally, while considering these contributions, this article proposes the development of a Management Information System (MIS) that combines an optimization method already established in the OR literature—the Maximal Covering Location Problem (MCLP)—with a clustering approach, using k-means, to define candidate locations. Thus, the MIS supports managerial and operational issues related to the location of police facilities. The police facilities are the units from which the police force leaves to patrol the street and deal with police events. Once the identification of the locations takes into account the spatial distribution of criminal events, budgetary restrictions, and the efficiency of the service provided, it is possible to maximize the return on investment in this area according to the quality of the service provided.
The Maximum Covering Location Problem (MCLP) was introduced by Church and ReVelle [22]. In this problem, the objective is to maximize the coverage of a population within a defined coverage radius considering a defined number of facilities. The MCLP, and its different variants, are commonly used to solve various location problems, mostly related to emergency services [23]. They are also applicable to public sector problems, in which resource limitations prevent all demands from being covered [24].
As a solution to the FLP, the MCLP needs to cover a service distance desired by the decision maker. However, the decision maker can not only focus on covering a region that serves the largest number of customers but must also focus on the response time for the provision of the service offered to customers within that coverage region [22].
In this sense, the service distance, in most cases, is linked to the response time, which is the displacement of the facility to the point of demand [25]. This means that it is not recommended to establish a very high distance ‘S’, and it must cover more points of demand, given that the response time to reach the most distant point makes high-quality service provisions in the region unfeasible. This is true for emergency services: hospitals, police stations, fire departments, etc. [17,22,26].
Thus, this work contributes to the literature by presenting a computational support tool with a hybrid analytical structure based on OR. In this paper, we extend on the previous work of de Gusmão et al. [27] by developing a tool to assist the visualization of data in complex decision-making processes. The proposed information system allows security problems to be understood and visualized in a broad way considering the different social impacts analyzed by public managers. The analytical structure of the tool can be adjusted and applied in different contexts of public management and can provide support to problems with other databases, such as police patrol routing, forecasts of natural disasters, and installations of medical units. To demonstrate the applicability and benefits of a structured decision support tool, the proposed MIS was carried out using data on criminal occurrences in a Brazilian city. The results obtained and the analyses made, all presented in the following sections, demonstrate that the proposed locations present a greater efficiency of the service provided in relation to the current locations.
This article is structured as follows: in Section 2 (Background), the most relevant perspectives for the development of this work are addressed; in Section 3 (Material and Methods), the developed system is detailed, and its application with real data is covered in Section 4 (Results—MIS for Police Centers Location). Lastly, some final considerations are presented in Section 5 (Discussion), and conclusions are presented in Section 6.
2. Background
2.1. Facility Location Problem
The Facility Location Problem (FLP) has attracted a lot of research focused on problem optimization in recent decades. These studies cover different contexts: the locations of cellular towers [28], the allocation problem considering the COVID-19 context [29,30], and urban services [31].
The FLP consists of allocating one or more facilities of different natures in a given location, meeting a set of pre-established criteria. In other words, it seeks to select the best possible alternative to locate a given number of facilities in order to serve a high level of service to customers, minimizing the costs of the operation and maximizing its profits [24,32].
Fernandes et al. [33] state that it is possible to group the location problems in a Euclidean plane or in a network. The authors describe that the location models in the plan commonly involve problems in which the possibilities for locating installations are endless. Network problems are continuous or discrete. They are continuous if the location of the facilities is at the vertices or anywhere on the arches. They are discrete if the location of the facilities can only be set at the vertices.
According to Guazzelli and Cunha [34], the most common model to solve location problems are the discrete ones, which consist of structuring pre-selected datasets of the possible locations that should be used to install the units. Church and Revelle [22] corroborate this statement, defining that the possible allocation points of an installation do not exist anywhere in the space but are generally considered through previous studies and analyses.
Today, facility-location models are well-structured and widespread in the most diverse areas of engineering, with wide applications and more than a century of history in the scientific literature [33]. However, this scenario was only reached due to the complexity imposed by the FLP, which has grown in recent years, leading to the need to develop mathematical models that can generate optimal solutions [5,25,26].
As location models seek to find the best places to allocate facilities according to locations of customer demand [35], researchers created vast volumes of literature to grapple with this issue. One of the problems that were addressed is maximum coverage, which suits the need to locate police facilities.
2.1.1. MCLP
According to Murray [26], the MCLP functions as a network of nodes and arcs that represent the event’s geographic space, in which the nodes are the concentrations of demand for the facilities’ services and the arcs reflect the distance between the nodes. Given that the model is applied to a plane, that is, a territorial region, the coverage of an installation using the Euclidean distance is represented by a circle of radius ‘S’ with the facility in the center [36].
Thus, a problem that contains multiple demand nodes dispersed in the geographic space can lead to a solution with a large number of facility allocations, which can make the project unfeasible from a budgetary point of view [9]. Therefore, the MCLP can be applied to locate a fixed number of installations on the network in order to maximize the number of demand nodes that are covered within a distance or time specified by the decision maker [37].
In the following, we present the mathematical structure of the MCLP model proposed by Church and ReVelle in [22]. The notation seeks to balance three issues: the coverage; the maximum distance covered to provide the service; and the budget constraint, translated into terms of the number of operations to be allocated.
The following variables are used in the mathematical formulations of the MCLP models:
- i = index for demand points;
- j = index for candidate locations;
- I = the set of demand nodes;
- J = the set of potential operating locations;
- Ni = , the set of locations that can cover demand point i;
- dij = the shortest distance from i to j;
- S = maximum value of the distance between the demand node and the operation node (desired service distance);
- ai = coefficient reflecting the desirability of covering demand point i;
- P = number of operations (facilities) to be allocated;
- xj = 1 if a facility is located at potential location j—0 otherwise;
- yi = 1 if demand point i is covered at least one operation j—0 otherwise.
The formulation of the MCLP is:
The objective in Equation (1) of the MCLP is to maximize the coverage demand within the desired service distance S. The constraint in Equation (2) ensures that a point of demand is only covered (i.e., y = 1) if there is at least one operation established in a candidate location within the set N. The restriction in Equation (3) refers to the number of operations (facilities) to be located, which is limited by P, as defined by the decision-maker (DM). Lastly, Equations (4) and (5) indicate that only integer values can be part of the solution (binary programming model). The problem is solved through heuristics and exact methods.
It is possible to invest resources more efficiently, allocating facilities to meet most of the demand with the available resources. The model presents a complete solution with the identification of facilities and specification of the maximum demand covered by the optimal location.
However, the MCLP model needs some inputs to be executed [17,22,38]. The inputs are the points of demand and the possible candidate locations to allocate a facility. Demand points can be collected according to registered demands (historical series), but candidate locations can be defined in different ways [15,39], as is the case with clustering methods [40,41,42].
2.1.2. Clustering and k-Means Procedure
Clustering is the classification of similar objects, data, or individuals into different groups. Objects, data, or individuals in the same group have greater similarity and have the smallest similarity in different categories. This analysis is an unsupervised learning technique that offers different views on the inherent structure of a given dataset [43,44,45]. Additionally, according to Cabrera-Barona et al. [46], clustering algorithms can be used as regionalization techniques.
According to Abonyi and Feil [47], there are different methods of clustering, which can be categorized into the hierarchical approach or in the partition approach. In the hierarchical approach, a nested series of partitions is produced, and in the partition approach, only one partition is obtained. The advantage of the partitional methods is realized in applications with large datasets; that is, when the construction of a dendrogram is computationally prohibitive in the hierarchical approach. Additionally, unlike hierarchical methods, in which clusters are not revisited after being built, reallocation algorithms can gradually improve clusters’ partitional methods. With proper data, this results in high-quality clusters. Regarding the partition approach, the squared error criterion is the most frequently used criterion, and the k-means is the simplest and most commonly used algorithm with this criterion.
The k-means algorithm, first introduced by MacQueen [48], starts with a random initial partition, and with each iteration, patterns are reassigned to the clusters based on the similarity between the pattern and the cluster centers. The interactions occur until a convergence criterion is met or the square error stops decreasing significantly after a few interactions. This reasoning comprises the following steps in Algorithm 1 [47]:
| Algorithm 1: Pseudo-code for the k-means implementation |
| Initialize k-means with random values |
| While (a given number of iterations ‘i’ < = ‘I’) { |
| Select ‘k’ cluster centers coinciding with ((k randomly chosen patterns) or (k randomly defined points)); |
| Assign each pattern to the closest cluster center; |
| For each ‘k’ new clusters: |
| Recalculate (new centroids) = mean of all points assigned to that cluster; |
| Recalculate new centroids; |
| Iterate through items: |
| Find the mean closest to the item; |
| Assign item to mean; |
| Update mean; |
| } |
| End when convergence criterion ‘i’ < = ‘I’ is met. |
There are many ways to implement the k-means algorithm [48,49,50,51]. Hartigan and Wong’s [51] algorithm has the advantage of avoiding unnecessary computations in each iteration. According to Morissette and Chartier [52], the purpose of Hartigan and Wong’s [51] algorithm is to identify the partition of the data space so that the sum of squares of errors (SSE) is locally ideal within the cluster. The first step of the algorithm is to choose the initial k centroid. This can be achieved based on previous empirical knowledge, if available, using k random observations from the dataset with the k observations that are farthest apart from each other in the data space. The cases are then assigned to the nearest centroid, and the centroid is averaged over the assigned data points. The iterations proceed as follows:
- -
- If the centroid has been updated in the last step, for each data point included, the within-cluster sum of squares for each data point, if included in another cluster, is calculated.
- -
- If one of the cluster sum of squares is smaller than the current one, the case is assigned to this new cluster.
As discussed at the end of the previous section and according to Revelle and Eiselt [15], the pre-processing required to identify candidate locations is essential for the execution of an MCLP. Thus, the k-means procedure could support models focused on the FLP of n facilities since it can be synthesized in the location of the k centroid, thus defining the possible candidate locations to position the facilities [39,41,42,53]. In addition, because k-means can be relatively scalable and efficient for large datasets, the method often ends up finding an optimal centroid, which minimizes the sum of distances between data points (facilities and demand points) [54].
It is through this formal k-means procedure that the importance of data clustering is widely recognized by several researchers. Thus, this procedure is understood as a model to better manage, browse, filter, and efficiently and intelligently summarize a large amount of data that can be used for decision making with greater safety [41,55,56,57,58,59,60,61,62,63,64,65,66,67].
Based on what has been exposed, k-means can be used as a computational tool for clustering MIS that require the treatment of large volumes of data. In this way, they allow MIS to run more efficiently to help decision makers in their day-to-day activities.
3. Materials and Methods
The database used in this assessment is from the platform ‘Where have I been robbed’ (in Portuguese, ‘Onde fui roubado’). Despite not being an official source of criminal data, ‘Onde Fui Roubado’ is a reliable, collaborative social platform that maps property crime and provides victim data for over 800 cities in Brazil. In 2016, it was recognized as the biggest collaborative platform (in several users and records) in the area of public security in the world. Many entries on the platforms also result in an official police report. One of the interfaces of this platform is illustrated in Figure 1.
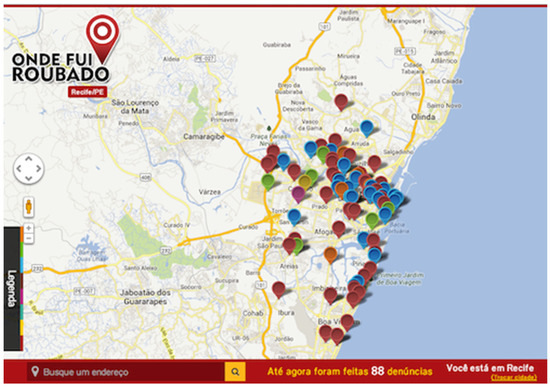
Figure 1.
The platform ‘Onde fui roubado’.
In this platform, users can mark on a map, anonymously, places with the occurrences of thefts, robberies, express kidnapping, group stealing, motor vehicle thefts and robberies, burglary, commercial burglary, flash robberies, and other types of crimes. The crimes are illustrated by different colors on the map. For a more specific analysis of the disaggregate typification of felonies in this platform, we recommend referring to Nepomuceno and Costa [58]. Currently, the platform is no longer available for data feeding or extraction.
For the police facility location problem, an MIS was proposed based on computational intelligence, which offers fast and reliable calculations on the optimality of the decision on the allocation of police facilities and the visualization of the data as the main functional requirement. It assumes that the recommendation of the police installation must meet the criterion of maximum coverage—that is, meet the maximum adequate geographic space considering the records of crimes in a given region. The results obtained by the proposed MIS allow managers of the public security area to view and analyze the recommendations for the problem being studied and increase their productivity by minimizing cognitive efforts and reducing the time needed to perform the analyses. Figure 2 shows the main components of the proposed MIS for the police facility location problem.
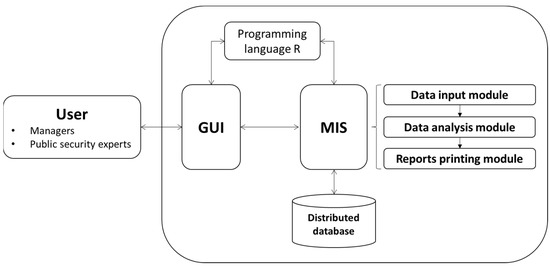
Figure 2.
Components of proposed MIS.
As seen in Figure 2, the main user of the proposed MIS is the technical manager of the public security area responsible for monitoring and recording the occurrence of crimes in a given region. This manager interacts with the system through the user interface to access the analysis modules available. The MIS presents three main modules: (i) data input, in which data are collected through importation into a table format, organized, and selected for manipulation within the system; (ii) data analysis, statistical analysis, the variations of mathematical modeling on the MCLP to indicate the recommendations based on k-means cluster analysis to indicate the centroids that are used to allocate police units on the map, and scenario building; and (iii) reports printing, which enables the download of the results in an appropriate format for a management report.
The database was modeled with a distributed structure to allow better performance in terms of data processing and aggregate more data for analysis in the future. Thus, the database is capable of storing different data formats, such as graphic, numerical, and geographical data. The main data used by MIS were imported from the database platform ‘Onde Fui Roubado’. Other data of equivalent importance are the parameters of the location model, such as the maximum service coverage and the number of police facilities to be allocated, as defined by the manager.
The MIS was implemented using R programming language and the RStudio platform to allow the easy writing and reading of computational interactions. This is a dynamic programming language focused on data manipulation, analysis, and visualization. In the first instance, MIS was designed for web platforms with the future intention of being implemented for mobile devices. In addition, as a usual requirement, user interactivity and graphic resources are implemented to enhance the cognitive components and make the user interface more friendly.
The MIS development phase was entirely carried out within the RStudio Software virtual environment. For the definition of candidate sites, clustering was used through k-means. With respect to the Hartigan–Wong algorithm, detailed in the previous section, a seed was specified containing the status of the random number generator that can be saved and restored, thus guaranteeing the reproducibility of the initial clustering points. Subsequently, the number of random starting points was established, and a filter was applied to the database so that only latitude and longitude information was used. Thus, only the number of clusters (candidate locations) that are defined by the user was missing.
Once the set of candidate sites is obtained, the application of the MCLP model, described in Section 2.1.2, becomes feasible. In the case of this research, a specific library was used in RStudio Software for the location problem, as described by Church and Revelle in [22].
The place of study chosen for this research was the city of Recife, the capital of the state of Pernambuco, located in the Northeast region of Brazil, the region with the highest homicide rate in 2017, according to Cerqueira et al. [59]. This study site was chosen because it is a region where crime rates have grown. After analyzing the scenario in which the city of Recife-PE finds itself in relation to its criminal indexes, it was identified, among other issues, that there was a lack of methodological support for the management of coverage by police units.
In the sensitivity analysis phase, it is possible to provide different values for the number of installations to be allocated and the maximum distance from the coverage radius. In this sense, through the analysis of the results, it is possible to generate a set of crucial information for possible decision making with more security in relation to the investments and the additional coverage provided by each allocated facility.
4. Results—MIS for Police Centers Location
The police facility location problem can be considered a complex problem due to several potential variables inserted into the context description. For example, Camacho-Collados et al. [8] identified the following as important attributes for a PDP: workload, response time, geometry, and other aspects according to the problem’s specificities. In a broader way, Ríos-Mercado [60] presented and defined some criteria that are common to an important class of district problems, such as compactness, unique assignment, balance, contiguity, and similarity with the existing plan. The use of mathematical models aids managers in structuring the relationships between objectives and variables in a problem that requires the analysis of a large amount of data. However, the computational procedure of these data treatments requires multiple interactivity actions to return useful results to the management process, which enables the development of specific computational tools capable of evolving the analytical processing of the data.
4.1. Graphical User Interface (GUI)
The main useful requirement in this MIS is friendly human–computer interaction and communication. The information flow begins with the upload of the file related to the crime database. Figure 3 illustrates the File screen, which is responsible for facilitating user access when importing data into the proposed MIS. From there, the user can view and format the data imported into the system.
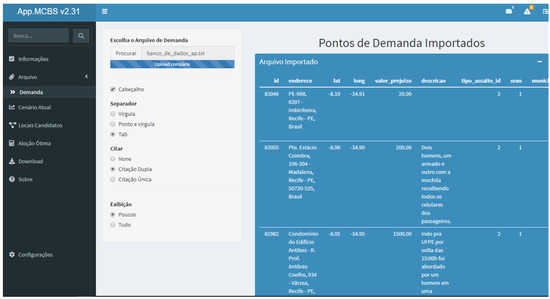
Figure 3.
File screen of proposed MIS.
After the insertion of data about the crime’s occurrence, particularly georeferenced data, the proposed MIS includes the points on a map and allows their interactive viewing. The user obtains more detailed information about the types of recorded occurrences. It is possible to carry out a descriptive analysis of the data and extract information about the different types of crimes; the period in which the crime was committed; if the victim officially registered what happened with the police units; and the victim’s personal data, such as gender and address, among others.
The data analysis module was implemented with interactive interface features, such as the graduated slide bar, which the user can manipulate to obtain different scenarios as it changes the number of centroids to be considered. At this stage, crimes are grouped into clusters based on the similarity of the region where crimes occur most frequently. It is possible to find the centroid of each cluster with the proposed MIS and work with this information as a candidate location to allocate a police facility. Figure 4 shows the cluster analysis visualization screen and highlights the centroid for each cluster.
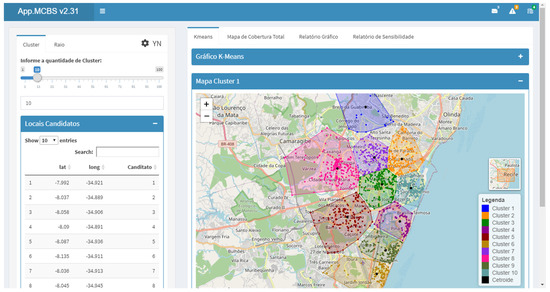
Figure 4.
Data analysis visualization screen; k-means recommendation.
Figure 5 shows the screen that indicates the candidate locations for police facilities. This graphic resource enables a detailed analysis of the crimes covered by the calculated radius in a given area of activity. Thus, the module has four simultaneous analysis options, which are (i) Maxima Coverage, (ii) Minimum Uncovered, (iii) Average Distance, and (iv) Average Deviation, which allow the user to obtain a broad understanding of the problem that is faced and provide more information for the decision-making process.
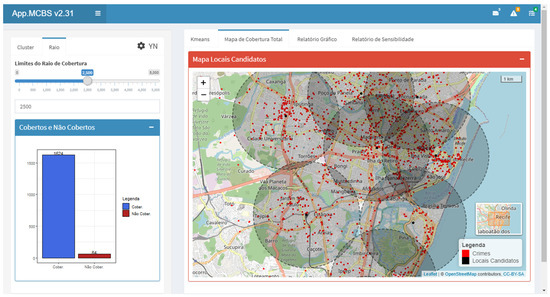
Figure 5.
Local candidates screen.
In the next step, the coordinates selected to install a police unit from the coordinates of the candidate locations are presented based on the information provided by the user regarding the radius and the number of facilities to be allocated. This potential allocation maximizes the number of crimes covered. The results of the analyses are composed of numerical information on the number of facilities, the geographical coverage radius, the average distance between police facilities, the number of crimes not covered, and various percentages in relation to the database used. These data are organized on the preprint reports screen.
4.2. The Preprint Reports Screen
The functional requirement for issuing management reports is valued by the manager. In this way, the report printing module allows one to configure documents with the most pertinent information about the police facilities to be downloaded. In general, the reports contain a summary and detailed data and information about the candidate locations, the locations selected by the user, the final allocation result, and the sensitivity analysis performed. Figure 6 presents the preprint reports screen of the proposed MIS.
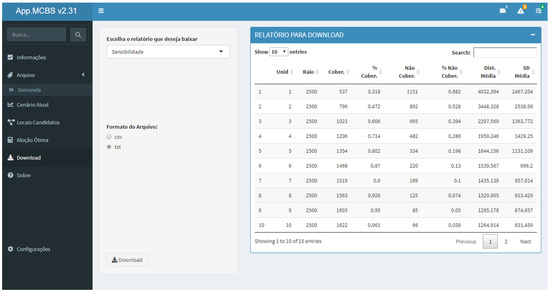
Figure 6.
Preprint reports screen.
The report model allows several configurations to be adopted to meet management needs. The information extracted from the MIS contributes to crime prevention as a critical step in the definition of strategies for actions related to public security. The identified candidates for the installation of police facilities can be the basis for logistical strategies and monitoring regions with a high rate of police occurrences.
The process of defining the strategic action considers several aspects, including investment in the allocation of police officers and studies based on data intelligence. The proposed MIS defines efficient communication processes that assist managers of police facilities in establishing indicators of productivity and quality to deal with criminal occurrences. From this perspective, other benefits that the proposed MIS adds are related to reducing operational costs, improving access to information by offering accurate and quick reports, improving the flow of information benefiting the structure of police facilities, improving interactions of users of the system, and increasing the motivation of managers to deal with the problem. In addition, to establish the most appropriate strategy for the context being studied, the MIS follows a logical sequence of the treatment of specific data for a given region. In order to validate the proposed MIS, a case study is carried out in the city of Recife, which is discussed in the next section.
5. Discussion
The location assessment in this work used criminal data distributed along Recife, a Brazilian municipality located in the Northeast Region of Brazil and the capital of the state of Pernambuco. Due to many exogenous factors and unfavorable social–economic structures in recent years, Brazil has experienced one of the highest rates of violent crime [61], and Pernambuco had about 50% of this violence increase. The location of police facilities is essential for reducing crime rates and improving efficient strategies for the demand for public security.
A higher population density than the average neighbors, higher economic activity, and inequality characterizes Recife. According to the Brazilian 13th Public Security Yearbook [3], there was a 22% increase in the violent life-related offenses in Recife between 2016 and 2017. There is an increasing effort by the state and municipal administrations to integrate police strategies with the academy and other sectors aiming at mitigating this scenario. Some important studies using Geographic Information Systems and statistical inference warrant these efforts and provide an interesting perspective on crime and violent behavior in the city [9,58,62,63,64,65,66,67,68,69].
5.1. Clusters Analysis and Candidates
The military police (MP) perform their activities via regions and shifts (dawn, morning, afternoon, or night) using vehicles to patrol a certain coverage area from an initial facility location. For this reason, MP facility locations are crucial to minimizing the vehicle response time to criminal occurrences. Thus, prior to carrying out an optimized location assessment for the police facilities, initial studies are necessary to define candidate zones to allocate the facilities and small stations. The proposed MIS and the described database were used to group crimes into clusters based on the regions’ similarity for crimes with a high incidence. Figure 7 illustrates ten regions where crimes occur with greater frequency and similarity in the city of Recife.
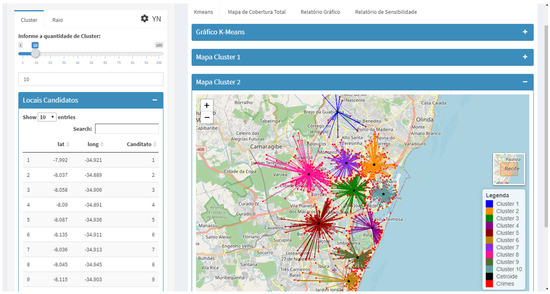
Figure 7.
Criminal clusters in Recife.
The centroid of each region delimited by the clusters is found using the proposed MIS. Each cluster’s centroid is a potential candidate location for a police facility. Table 1 presents the centroids’ information as geographic coordinates, with all ten candidate locations.

Table 1.
Candidate coordinates.
As there is no specific and exact coverage for the facilities in Recife, this assessment explores, in the next section, several potential scenarios through one to five kilometers of radius coverage. In addition, we analyze the sensitivity of this parameter, investigating the behavior of the optimized allocation of facilities for each coverage radius.
5.2. Optimal Locations
The budget constraint is defined after proposing the candidate locations and the range of values for the coverage radius, i.e., the definition of the number of facilities to be allocated. No more than five facilities are selected among the ten candidate zones due to the initial interest in comparing the optimal scenario using the proposed MIS with the five facilities of the MP currently operating in Recife.
The proposed MIS used to perform the optimal allocation for the five facilities along the radius of 1.0 to 5.0 km provides the optimal coverage rate presented in Table 2.
Table 2.
Optimal coverage.
This information highlights the gains in coverage by increasing the police’s operating radius of the allocated facilities. For instance, the operating radii of 2.0, 3.0, and 4.0 km provide acceptable coverages of criminal incidents, that is, 67.7%, 90.1%, and 98.6%, respectively. Figure 8 illustrates the optimal facility allocations based on a coverage radius of 3.0 km.
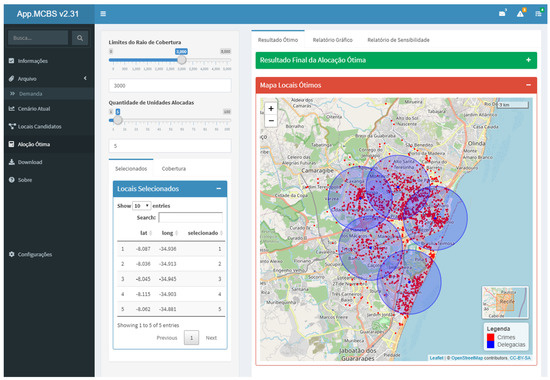
Figure 8.
Optimal police facility allocation for 3.0 km coverage.
It is worth mentioning that the allocation of police facilities in the territory of Recife is plausible given what is designed by the proposed MIS with reference to the specific database. From an efficiency perspective, a service unit aims at improving results while keeping the same use of resources or keeping the same results with fewer resources [10]. In the case of police facilities, this is obtained with a small coverage radius—for instance, operations with three kilometers of coverage, reaching 90.1% of occurrences, which is strategic: fewer police officers can operate more efficiently in communities with the highest crime incidence, improving effectiveness while reducing operating costs.
5.3. Comparing Scenarios
This section compares the prior results from the MIS theoretical application with the performance of MP facilities currently operating in Recife, taking into consideration the case for a 3 km radius coverage, aims to investigate differences in the performance of both scenarios, and suggests concluding remarks based on the proposed model to aid policy decisions regarding public safety.
Figure 9 provides the main results of this comparison. The illustration exhibits the performance of the proposed MIS in relation to the current configuration of police facilities in Recife (MP). The gain in the coverage of occurrences per facility is evident in Figure 9. The new police facility locations provide additional coverage in relation to the current configuration. Using the proposed MIS reports, it is possible to reach, at the end of the fifth allocated installation, a 90% coverage of occurrences, representing a 22% improvement compared to the current scenario.
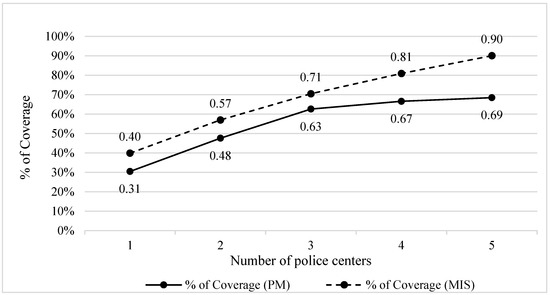
Figure 9.
Performance comparison (coverage).
The 22% improvement is more perceptible when analyzing this scenario with the number of police occurrences covered. Between 2012 and 2017, a total number of 1688 police occurrences were recorded using the platform ‘Onde Fui Roubado’. Considering the case of a 3 km radius coverage, of the total of 1688, only 167 crimes would not be covered if the police centers were established in the places suggested by the MIS, compared to 532 crimes that would not be covered by the current police center locations. This difference is significant given the magnitude of the evaluation. Due to problems with sub-notification and unreported occurrences, these rates could be higher.
Continuing the comparative analyses, from a spatial perspective, Figure 10 illustrates a significant reduction in the operating distance for a police patrol from the optimized locations to the occurrences. Figure 10 illustrates this additional prospect. It can be observed that the proposed model manages to significantly reduce the average distance of occurrences in relation to the current configuration of the MP. Achieving a significant difference, which can be extended to 920 m considering the fifth allocated facility, positively reduces the time that a police vehicle needs to leave the facilities and arrive at the locations of crimes.
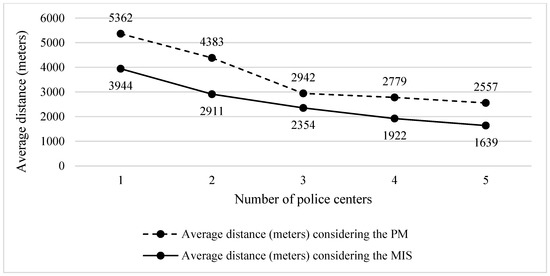
Figure 10.
Performance comparison (distance).
Table 3 reports a sensitivity analysis of the different numbers of candidates for five allocated facilities and a coverage distance of 3 km.
Table 3.
Sensitivity analysis of the number of candidates.
Table 3 reports a slightly better coverage percentage for K > 20 candidates compared to the 10 adopted candidates, as expected. As k-means attempts to divide data equally along the space, keeping everything else constant, increasing the number of candidates can also provide great coverage after optimizing Euclidean distances for the allocation of facilities. In the extreme case when the number of candidate points is equal or close to the number of criminal occurrences (the last rows of Table 3), the methodology indicates a single cluster for each feature, which makes it useless. For K = 5 candidates, there is also a slightly better coverage percentage. The authors in [70] describe this as a regularization problem, and it has the same explanation as that described above. Occurrences are closer and closer to a cluster centroid as K increases. This can create a distortion within concentrated occurrence distributions by making fewer candidates (in this case, 5 candidates compared to 10) cover more occurrences because cluster centroids are situated to be more distant from the main concentrations and therefore can cover outliers that are not covered by more candidate clusters.
Choosing between great coverage and closeness to concentrations of crime is an interesting trade-off. If outlier regions are important to be covered, one possible solution to maintain the preferred number of clusters is prioritizing. A more realistic option is the inclusion of value judgments on the importance of neighborhoods based on socio-economic status or educational attainments (for instance, prioritizing more vulnerable regions for community-oriented policing) and/or the type of crime Weighting different crimes according to their degree of severity, or clear-up complexity, which according to Nepomuceno et al. [10], relates to the efficiency of allocated resources, is expected to impact the clustering process and integrate the coverage prospects without reducing the ability to allocate facilities closer to concentrated centers of criminality. Since this analysis is limited to the coordinates, we aim to expand these solutions to future assessments while considering the expertise, preference elicitations, and value judgments of public administrations.
The proposed MIS manages to be ahead of the current MP configuration in all scenarios evaluated. The performance of the locations of the police facilities is visible and enables better and more efficient performance by covering more events and reducing the distance that police vehicles must travel to reach each crime location.
6. Conclusions
With the aim of mitigating crime rates and providing a safe atmosphere, it is convenient to locate police facilities close to criminal occurrences, taking into account the distance between the facility and the occurrence, as well as the budgetary allowance that limits the maximum number of facilities to be allocated.
In this way, an MIS is proposed to support decisions regarding improvements that can be implemented in public security, specifically proposing locations for police facilities that enable greater coverage, a shorter average distance traveled, and, consequently, better assistance to society. To accomplish this, the k-means clustering method is used to identify clusters, and thus candidate zones for police facilities and the MCLP are used to optimize the predefined locations. The support offered by the proposed MIS reduces the cognitive effort of the decision maker and enables the construction of a strategy with greater consistency and in less time. For this, the developed MIS has a potential set of analytical tools with sophisticated mathematical methods, which allows a variety of applications in the problem of the allocation of physical facilities. Data incorporating other relevant periods related to the costs of candidate locations or referring to other locations can feed the system and improve the analysis. Model parameters can also be changed considering the restrictions and the particularity of the problem. These issues make the proposed MIS flexible and replicable to other contexts.
The proposed MIS was validated using criminal data from 2012 through 2017 for a location assessment of Recife. The assessment compared the performance of the MIS-suggested locations, considering five police centers and a 3 km radius coverage, with the performance of the current location of the police facilities. The results demonstrate that it is possible to obtain an additional 22% gain in the coverage area of occurrences and a reduction of 920 m in the operating distance for a police patrol from the police station locations to crime occurrences using the suggested locations compared to the current locations. In practical terms, we have greater coverage of the most prone zones to criminal occurrences and a faster arrival by police vehicles at the crime scene. This proposal aids the increased efforts of public administrations to attain efficient public security strategies in terms of rapid responses to crime occurrences.
In the security policies and reduction in the crime rate, it is possible to define new police patrol routes with a focus on the most dangerous points, optimized surveillance schedules at border points between regions, simulations of a coverage radius for greater vehicle rotations in the marked locations with a greater probability of occurrences, inspections at times of lower flow of people to avoid approaches by suspects in deserted places, offline data for the prediction of possible occurrences, and the modeling of strategies to prevent occurrences, among other policies.
However, changing the current location of police units requires time, money, etc. Nevertheless, it was not the paper’s objective to define priorities but rather to allow decision-makers (public managers) to analyze the problem using a decision support tool (the proposed MIS). All the georeferenced entries in our sample from 2012 through 2017, obtained from this platform, represent only 4.12% of the official records for 2017 in Recife. We hope to overcome this limitation with a recent agreement for technical collaborations signed by the university and the state administration. Additionally, improvements with respect to MIS modeling should also focus on replacing the plane-based service area approach (based on Euclidean distance) with the street-based service area (based on the datasets of street network) of the facilities approach, since, as reported by Yu, W. et al. [71], there is a gain in the response time to emergency occurrences.
Author Contributions
Conceptualization, B.F.d.C.B., A.P.H.d.G. and T.R.N.C.; data curation, B.F.d.C.B. and T.C.C.N.; formal analysis, B.F.d.C.B. and T.C.C.N.; investigation, B.F.d.C.B.; methodology, B.F.d.C.B., A.P.H.d.G. and T.R.N.C.; project administration, A.P.H.d.G.; supervision, A.P.H.d.G.; validation, T.C.C.N.; writing—original draft, B.F.d.C.B. and A.P.H.d.G.; writing—review and editing, A.P.H.d.G., T.R.N.C. and T.C.C.N. All authors have read and agreed to the published version of the manuscript.
Funding
This research and the APC for this publication were partially funded by the Brazilian National Council for Scientific and Technological Development (CNPq).
Institutional Review Board Statement
Not applicable.
Informed Consent Statement
Not applicable.
Data Availability Statement
The data supporting this study’s findings are available from the corresponding author on request to ana.hgusmao@ufpe.br.
Acknowledgments
The authors would like to acknowledge the reviewers for their important considerations and contributions to the paper and the National Council for the Improvement of Higher Education (CAPES), a foundation affiliated with the Ministry of Education in Brazil, for the support received to develop this research. We would like to thank the platform ‘Onde fui roubado’ for their collaboration on our research.
Conflicts of Interest
The authors declare no conflict of interest.
References
- Tella, R.D.; Edwards, S.; Schargrodsky, E. Introduction to “The Economics of Crime: Lessons for and from Latin America”. In The Economics of Crime: Lessons for and from Latin America; NBER: Chicago, IL, USA; London, UK, 2010; pp. 1–15. [Google Scholar]
- United Nations Office on Drugs and Crime (UNODC). Available online: https://www.unodc.org/ (accessed on 20 May 2022).
- Brazilian Yearbook of Public Security [Anuário Brasileiro de Segurança Pública]; 13º Edição; Fórum Brasileiro de Segurança Pública: São Paulo, Brazil, 2019; ISSN 1983–7364. Available online: http://www.forumseguranca.org.br/wp-content/uploads/2019/09/Anuario-2019-FINAL-v3.pdf (accessed on 26 May 2022).
- Hess, S.W.; Weaver, J.B.; Siegfeldt, H.J.; Whelan, J.N.; Zitlau, P.A. Nonpartisan political redistricting by computer. Oper. Res. 1965, 13, 998–1006. [Google Scholar] [CrossRef]
- Mitchell, P.S. Optimal selection of police patrol beats. J. Crim. L. Criminol. Police Sci. 1972, 63, 577. [Google Scholar] [CrossRef]
- Bodily, S.E. Police sector design incorporating preferences of interest groups for equality and efficiency. Manag. Sci. 1978, 24, 1301–1313. [Google Scholar] [CrossRef]
- Maltz, M.D. From Poisson to the present: Applying operations research to problems of crime and justice. J. Quant. Criminol. 1996, 12, 3–61. [Google Scholar] [CrossRef]
- Camacho-Collados, M.; Liberatore, F.; Angulo, J.M. A multi-criteria police districting problem for the efficient and effective design of patrol sector. Eur. J. Oper. Res. 2015, 246, 674–684. [Google Scholar] [CrossRef]
- Gusmão, A.P.H.; Pereira, R.M.A.; Silva, M.M.; da Costa Borba, B.F. The Use of a Decision Support System to Aid a Location Problem Regarding a Public Security Facility. In Decision Support Systems IX: Main Developments and Future Trends; Springer: Cham, Switzerland, 2019; Volume 348. [Google Scholar] [CrossRef]
- Nepomuceno, T.C.C.; Santiago, K.T.M.; Daraio, C.; Costa, A.P.C.S. Exogenous Crimes and the Assessment of Public Safety Efficiency and Effectiveness. Ann. Oper. Res. 2020, 1–34. [Google Scholar] [CrossRef]
- Wilkins, L.T. Wartime Operational Research in Britain and Situational Crime Prevention. In Rational Choice and Situational Crime Prevention: Theoretical Foundations. Avebury; Newman, G., Clarke, R.V., Shoham, S.G., Eds.; Routledge: London, UK, 1997. [Google Scholar]
- Tilley, N.; Laycock, G. The Police as Professional Problem Solvers. In The Future of Policing; Brown, J.M., Ed.; Routledge: London, UK, 2014; pp. 369–382. [Google Scholar]
- Borrion, H.; Ekblom, P.; Alrajeh, D.; Borrion, A.L.; Keane, A.; Koch, D.; Mitchener-Nissen, T.; Toubaline, S. The problem with crime problem-solving: Towards a second generation POP? Br. J. Criminol. 2020, 60, 219–240. [Google Scholar] [CrossRef]
- Dewinter, M.; Vandeviver, C.; Beken, T.V.; Witlox, F. Analysing the Police Patrol Routing Problem: A Review. ISPRS Int. J. Geo-Inf. 2020, 9, 157. [Google Scholar] [CrossRef]
- ReVelle, C.S.; Eiselt, H.A. Location analysis: A synthesis and survey. Eur. J. Oper. Res. 2005, 165, 1–19. [Google Scholar] [CrossRef]
- Pizzolato, N.D.; Raupp, F.M.; Alzamora, G.S. Revisão de desafios aplicados em localização com base em modelos da p-mediana e suas variantes. Pesqui. Oper. Para O Desenvolv. 2012, 4, 13–42. [Google Scholar]
- Owen, S.H.; Daskin, M.S. Strategic facility location: A review. Eur. J. Oper. Res. 1998, 111, 423–447. [Google Scholar] [CrossRef]
- Fallah, H.; Naimisadigh, A.; Aslanzadeh, M. Facility Location: Concepts, Models, Algorithms and Case Studies; Physica Verlag: Berlin, Germany, 2009. [Google Scholar]
- Pánek, J.; Ivan, I.; Macková, L. Comparing residents’ fear of crime with recorded crime data—Case study of Ostrava, Czech Republic. ISPRS Int. J. Geo-Inf. 2019, 8, 401. [Google Scholar] [CrossRef]
- Sypion-Dutkowska, N.; Leitner, M. Land use influencing the spatial distribution of urban crime: A case study of Szczecin, Poland. ISPRS Int. J. Geo-Inf. 2017, 6, 74. [Google Scholar] [CrossRef]
- Wang, F. Why Police and Policing Need GIS: An Overview. Ann. GIS 2012, 18, 159–171. [Google Scholar] [CrossRef]
- Church, R.; ReVelle, C. The maximal covering location problem. In Papers of the Regional Science Association; Springer: Berlin/Heidelberg, Germany, 1974; Volume 32, pp. 101–118. [Google Scholar]
- Jia, H.; Ordóñez, F.; Dessouky, M. A modeling framework for facility location of medical services for large-scale emergencies. IIE Trans. 2007, 39, 41–55. [Google Scholar] [CrossRef]
- Farahani, R.Z.; Asgari, N.; Heidari, N.; Hosseininia, M.; Goh, M. Covering problems in facility location: A review. Comput. Ind. Eng. 2012, 62, 368–407. [Google Scholar] [CrossRef]
- 25. Cordeau, J.F.; Furini, F.; Ljubić, I. Benders decomposition for very large scale partial set covering and maximal covering location problems. Eur. J. Oper. Res. 2019, 275, 882–896. [Google Scholar] [CrossRef]
- Murray, A.T. Maximal coverage location problem: Impacts, significance, and evolution. Int. Reg. Sci. Rev. 2016, 39, 5–27. [Google Scholar] [CrossRef]
- De Gusmão, A.P.H.; da Costa Borba, B.F.; Clemente, T.R.N. Management Information System for Police Facility Location. In Decision Support Systems X: Cognitive Decision Support Systems and Technologies; ICDSST 2020; Moreno-Jiménez, J., Linden, I., Dargam, F., Jayawickrama, U., Eds.; Lecture Notes in Business Information Processing; Springer: Cham, Switzerland, 2020; Volume 384. [Google Scholar] [CrossRef]
- Bharadwaj, S.; Dubey, R.; Zafar, M.I.; Tiwary, S.K.; Faridi, R.A.; Biswas, S. A Novel Method to Determine the Optimal Location for a Cellular Tower by Using LiDAR Data. Appl. Syst. Innov. 2022, 5, 30. [Google Scholar] [CrossRef]
- Karabegovic, A.; Ponjavic, M.; Hukic, M. Epidemic Location Intelligence System as Response to the COVID-19 Outbreak in Bosnia and Herzegovina. Appl. Syst. Innov. 2021, 4, 79. [Google Scholar] [CrossRef]
- Manupati, V.K.; Schoenherr, T.; Wagner, S.M.; Soni, B.; Panigrahi, S.; Ramkumar, M. Convalescent plasma bank facility location-allocation problem for COVID-19. Transp. Res. Part E Logist. Transp. Rev. 2021, 156, 102517. [Google Scholar] [CrossRef] [PubMed]
- Farahani, R.Z.; Fallah, S.; Ruiz, R.; Hosseini, S.; Asgari, N. OR models in urban service facility location: A critical review of applications and future developments. Eur. J. Oper. Res. 2019, 276, 1–27. [Google Scholar] [CrossRef]
- Mapa, S.M.S.; Lima, R.D.S. Uso combinado de sistemas de informações geográficas para transportes e programação linear inteira mista em problemas de localização de instalações. Gestão Produção 2012, 19, 119–136. [Google Scholar] [CrossRef]
- Fernandes, S.; Captivo, M.E.; Clímaco, J. Sabiloc: Um sistema de apoio a decisão para análise de problemas de localização bicritério. Pesqui. Oper. 2007, 27, 607–628. [Google Scholar] [CrossRef]
- Guazzelli, C.S.; Cunha, C.B.D. Otimização multicritério para o problema de localização de centros de distribuição de uma empresa com unidade produtiva no Polo Industrial de Manaus. Gestão Produção 2015, 22, 480–494. [Google Scholar] [CrossRef]
- Kchaou Boujelben, M.; Boulaksil, Y. Modeling international facility location under uncertainty: A review, analysis, and insights. IISE Trans. 2018, 50, 535–551. [Google Scholar] [CrossRef]
- Bansal, M.; Kianfar, K. Planar maximum coverage location problem with partial coverage and rectangular demand and service zones. INFORMS J. Comput. 2017, 29, 152–169. [Google Scholar] [CrossRef]
- Snyder, S.A.; Haight, R.G. Application of the maximal covering location problem to habitat reserve site selection: A review. Int. Reg. Sci. Rev. 2016, 39, 28–47. [Google Scholar] [CrossRef]
- Hakimi, S.L. Optimum locations of switching centers and the absolute centers and medians of a graph. Oper. Res. 1964, 12, 450–459. [Google Scholar] [CrossRef]
- Silva, V.F.; Cabral, L.A.F.; Quirino, R. Estratégia para seleção de locais candidatos voltada ao problema de localização de viaturas policiais. In Proceedings of the XLVSBPO-19 Simpósio Brasileiro de Pesquisa Operacional, Natal/RN, Brasil, 16–19 September 2013. [Google Scholar]
- Kaveh, P.; Zadeh, A.S.; Sahraeian, R. Solving capacitated p-median problem by hybrid k-means clustering and FNS algorithm. Int. J. Innov. Manag. Technol. 2010, 1, 405. [Google Scholar]
- Friggstad, Z.; Rezapour, M.; Salavatipour, M.R. Local search yields a PTAS for k-means in doubling metrics. SIAM J. Comput. 2019, 48, 452–480. [Google Scholar] [CrossRef]
- Yang, W.; Su, Q.; Zhou, M.; Qin, X. Ambulance allocation considering the spatial randomness of demand. Comput. Ind. Eng. 2020, 139, 106202. [Google Scholar] [CrossRef]
- Reddy, A.J.; Tripathy, B.; Nimje, S.; Ganga, G.S.; Varnasree, K. Performance analysis of clustering algorithm in data mining in R language. In Proceedings of the International Conference on Soft Computing Systems, Kollam, India, 19–20 April 2018; Springer: Berlin/Heidelberg, Germany, 2018; pp. 364–372. [Google Scholar]
- Kumar, D.P.; Amgoth, T.; Annavarapu, C.S.R. Machine learning algorithms for wireless sensor networks: A survey. Inf. Fusion 2019, 49, 1–25. [Google Scholar] [CrossRef]
- Zou, H. Clustering Algorithm and Its Application in Data Mining. Wirel. Pers. Commun. 2020, 110, 21–30. [Google Scholar] [CrossRef]
- Cabrera-Barona, P.F.; Bayón, M.; Durán, G.; Bonilla, A.; Mejía, V. Generating and Mapping Amazonian Urban Regions Using a Geospatial Approach. ISPRS Int. J. Geo-Inf. 2020, 9, 453. [Google Scholar] [CrossRef]
- Abonyi, J.; Feil, B. Cluster Analysis for Data Mining and System Identification; Birkhauser Verlag: Basel, Switzerland, 2007. [Google Scholar]
- MacQueen, J. Some methods for classification and analysis of multivariate observations. In Proceedings of the Fifth Berkeley Symposium on Mathematical Statistics and Probability, Oakland, CA, USA, 21 June–18 July 1966; Le Cam, L.M., Neyman, J., Eds.; University of California: Los Angeles, CA, USA, 1967; Volume 1, pp. 281–297. [Google Scholar]
- Lloyd, S. Least squares quantization in PCM. IEEE Trans. Inf. Theory 1982, 28, 129–137. [Google Scholar] [CrossRef]
- Forgy, E. Cluster analysis of multivariate data: Efficiency versus interpretability of classification. Biometrics 1965, 21, 768–769. [Google Scholar]
- Hartigan, J.A.; Wong, M.A. Algorithm AS 136: A k-means clustering algorithm. J. R. Stat. Soc. Ser. C Appl. Stat. 1979, 28, 100–108. [Google Scholar] [CrossRef]
- Morissette, L.; Chartier, S. The k-means clustering technique: General considerations and implementation in Mathematica. Tutor. Quant. Methods Psychol. 2013, 9, 15–24. [Google Scholar] [CrossRef]
- Risso, L.A.; Issoe, L.K.; Picanco, A.R.S.; da Silva, A.L.; Ignacio, P.S.A. Clusterização K-Means Para Decisão De Localização Industrial. In Proceedings of the XXXV Encontro Nacional de Engenharia de Produção, Fortaleza, Brasil, 13–16 October 2015. [Google Scholar]
- Berkhin, P. A survey of clustering data mining techniques. In Grouping Multidimensional Data; Springer: Berlin/Heidelberg, Germany, 2006; pp. 25–71. [Google Scholar]
- Oyelade, O.J.; Oladipupo, O.O.; Obagbuwa, I.C. Application of k Means Clustering algorithm for prediction of Students Academic Performance. arXiv 2010, arXiv:1002.2425. [Google Scholar]
- Cohen-Addad, V.; Klein, P.N.; Mathieu, C. Local search yields approximation schemes for k-means and k-median in euclidean and minor-free metrics. SIAM J. Comput. 2019, 48, 644–667. [Google Scholar] [CrossRef]
- Dhalmahapatra, K.; Shingade, R.; Mahajan, H.; Verma, A.; Maiti, J. Decision support system for safety improvement: An approach using multiple correspondence analysis, t-SNE algorithm and K-means clustering. Comput. Ind. Eng. 2019, 128, 277–289. [Google Scholar] [CrossRef]
- Nepomuceno, T.C.C.; Costa, A.P.C.S. Spatial visualization on patterns of disaggregate robberies. Oper. Res. 2019, 19, 857–886. [Google Scholar] [CrossRef]
- Cerqueira, D.; Bueno, S.; de Lima, R.S.; Neme, C.; Ferreira, H.; Alves, P.P.; Marques, D.; Reis, M.; Cypriano, O.; Sobral, I.; et al. Atlas da Violência 2019. IPEA. Brasília. Available online: http://www.ipea.gov.br/atlasviolencia/download/19/atlas-da-violencia-2019 (accessed on 26 May 2022).
- Ríos-Mercado, R.Z. Optimal Districting and Territory Design; Springer Nature: International Series in Operations Research & Management Science; Springer Nature: Berlin/Heidelberg, Germany, 2020; Volume 284. [Google Scholar] [CrossRef]
- Cerqueira, D.; de Lima, R.S.; Bueno, S.; Neme, C.; Ferreira, H.; Coelho, D.; Alves, P.P.; Pinheiro, M.; Astolfi, R.; Marques, D.; et al. Atlas da Violência 2018. IPEA e Fórum Brasileiro de Segurança Pública. Rio de Janeiro. Available online: http://www.forumseguranca.org.br/wp-content/uploads/2018/06/FBSP_Atlas_da_Violencia_2018_Relatorio.pdf (accessed on 26 May 2022).
- Figueiredo, C.J.J.D.; Mota, C.M.D.M. A classification model to evaluate the security level in a city based on GIS-MCDA. Math. Probl. Eng. 2016, 2016, 3534824. [Google Scholar] [CrossRef]
- Nepomuceno, T.C.C. A Violent Crimes Determination Model Applied over the Most Violent Cities of the World; GRIN Verlag: Munich, Germany, 2019. [Google Scholar]
- Nepomuceno, T.C.C.; Costa, A.P.C.S. Invalid Votes, Deliberate Abstentions, and the Brazilian Crisis of Representation. Politics Policy 2019, 47, 381–406. [Google Scholar] [CrossRef]
- Nepomuceno, T.C.C.; de Moura, J.A.; Silva, L.C.; Costa, A.P.C.S. Alcohol and violent behavior among football spectators: An empirical assessment of Brazilian’s criminalization. Int. J. Law Crime Justice 2017, 51, 34–44. [Google Scholar] [CrossRef]
- Pereira, D.V.; Mota, C.M.; Andresen, M.A. Social disorganization and homicide in Recife, Brazil. Int. J. Offender Ther. Comp. Criminol. 2015, 61, 1570–1592. [Google Scholar] [CrossRef]
- Pereira, D.V.; Mota, C.M.; Andresen, M.A. The homicide drop in Recife, Brazil: A study of crime concentrations and spatial patterns. Homicide Stud. 2017, 21, 21–38. [Google Scholar] [CrossRef]
- Menezes, T.; Silveira-Neto, R.; Monteiro, C.; Ratton, J.L. Spatial correlation between homicide rates and inequality: Evidence from urban neighborhoods. Econ. Lett. 2013, 120, 97–99. [Google Scholar] [CrossRef]
- Mota, C.M.M.; Figueiredo, C.J.J.; Pereira, D.V.S. Identifying areas vulnerable to homicide using multiple criteria analysis and spatial analysis. Omega 2020, 100, 102211. [Google Scholar] [CrossRef]
- Raykov, Y.P.; Boukouvalas, A.; Baig, F.; Little, M.A. What to do when K-means clustering fails: A simple yet principled alternative algorithm. PLoS ONE 2016, 11, e0162259. [Google Scholar] [CrossRef] [PubMed]
- Yu, W.; Chen, Y.; Chen, Z.; Xia, Z.; Zhou, Q. Service area delimitation of fire stations with fire risk analysis: Implementation and case study. Int. J. Environ. Res. Public Health 2020, 17, 2030. [Google Scholar] [CrossRef] [PubMed]
Publisher’s Note: MDPI stays neutral with regard to jurisdictional claims in published maps and institutional affiliations. |
© 2022 by the authors. Licensee MDPI, Basel, Switzerland. This article is an open access article distributed under the terms and conditions of the Creative Commons Attribution (CC BY) license (https://creativecommons.org/licenses/by/4.0/).