Article

Credibility Analysis of User-Designed Content Using Machine Learning Techniques

1
Bharati Vidyapeeth Deemed to Be University, College of Engineering, Pune 411043, India
2
Symbiosis Institute of Technology, Symbiosis International (Deemed University), Pune 412115, India
3
Jaywant Shikshan Prasarak Mandal’s Rajarshi Shahu College of Engineering, Pune 411046, India
*
Authors to whom correspondence should be addressed.
Appl. Syst. Innov. 2022, 5(2), 43; https://doi.org/10.3390/asi5020043
Submission received: 28 December 2021 / Revised: 24 March 2022 / Accepted: 6 April 2022 / Published: 14 April 2022

Abstract

:
Content is a user-designed form of information, for example, observation, perception, or review. This type of information is more relevant to users, as they can relate it to their experience. The research problem is to identify the credibility and the percentage of credibility as well. Assessment of such content is important to convey the right understanding of the information. Different techniques are used for content analysis, such as voting the content, Machine Learning Techniques, and manual assessment to evaluate the content and the quality of information. In this research article, content analysis is performed by collecting the Movie Review dataset from Kaggle. Features are extracted and the most relevant features are shortlisted for experimentation. The effect of these features is analyzed by using base regression algorithms, such as Linear Regression, Lasso Regression, Ridge Regression, and Decision Tree. The contribution of the research is designing a heterogeneous ensemble regression algorithm for content credibility score assessment, which combines the above baseline methods. Moreover, these factors are also toned down to obtain the values closer to Gradient Descent minimum. Different forms of Error Loss, such as Mean Absolute Error, Mean Squared Error, LogCosh, Huber, and Jacobian, and the performance is optimized by introducing the balancing bias. The accuracy of the algorithm is compared with induvial regression algorithms and ensemble regression separately; this accuracy is 96.29%.

1. Introduction

Content is increasing rapidly, because of the websites providing a review, Online Social Networking (OSN), blog, e-commerce websites, and discussion forums. Engagement of these websites is comparatively more than any other platform, because of the usefulness of the content. A huge amount of content is created. People read and tend to believe the content and react accordingly. The exactness of information in the content is necessary to not mislead the people. Credibility is decided by classifying the information into credible and non-credible information [1,2]. The volume of content is increasing continuously, the pace is likely to be increased in the future. The user creates content with their perception, they are not experts in this field so errors can be expected in content. Though the content is more useful and practical, there is a necessity for an approach to avoid misuse of the content [3,4,5].
The commercialization of this issue has already been started [6]. Companies are promoting content creators. To promote their products with positive reviews. The individual user also obtains a reward after writing the review with the product specification. Users may misinterpret reality because of this content [7,8]. This can be done by using an evaluation system to identify the information in content in the correct form. If the credibility of information is not checked, this may lead to the inorganic spread of information. Examples of this form of content are spam, marketing using unethical ways, clickbait, Fake News, and enticing content with irrelevant information [9,10].
A user defines content with his/her perception and understanding it may contain varying percentages of information. Extraction of the correct information from the story, post, blog, tweet, and microblog is a challenging task [11]. The various threats and misuse of data can be seen in Figure 1. Misleading, Incomplete, Unreliable, Conflicting, Invalid. All these types of information cause deception in users and they may have led to an incorrect opinion, thinking, or decisions based on it. There are several combinations (of misleading information) of A, B, C, D, and E as stated in Figure 1 [11,12]. Section 1, covers the introduction to the content generated especially on social networking forums and a blog. Information about the organic content and mechanism to create, propagate and validate is discussed. The possible ways to address any one of the issues are suggested. Section 2, covers materials and methods used to deal with credibility. Additionally, the experimentation performed is discussed in brief. The importance of Feature Analysis and Regression algorithms are discussed. Performance can be optimized using minima and load balancing is also elaborated. Section 3, elaborates on the generic representation of the research work using algorithms and mathematical expressions. Important phrases are covered. The uniqueness of the algorithm relies on a combination of boosting and stacking. Moreover, performance is further improved using load balancing and (search for) minima. Section 4, covers the validation technique applicable for the regression algorithm, wherein various losses are discussed to name a few, Mean Squared Error, Mean Absolute Error, and Huber Loss. This error loss technique is useful to highlight the gap between actual and expected outcomes.
Section 5, covers the Result of the algorithm and their validation using the error loss techniques discussed in Section 4. The separate plotting of the Mean Squared Error, Mean Absolute Error, and Huber Loss is completed. The result of the FERMO approach is satisfactory as the minimal losses indicate the higher efficacy of the algorithm. Section 6 deals with the discussion on the result achieved by the algorithm and the improvement in the result after optimization. The use of a Credibility Score to understand the quality of the content rather than just 1 and 0, is the classification approach. Section 7 explains the Conclusion of the research work completed. The accuracy is improved by using a combination of stacking and boosting mechanisms together followed by optimization and load balancing. Reference Section is a list of References used in the research in the field of content credibility, organic content, machine learning algorithms, user perception, and quality assessment of content for propagation.

2. Literature Survey

This section covers the research in the field of information credibility, fake news detection, and trust in social media content. The majority of the research articles used are from 2019 to 2021. Author PK Verma et al. [1] focused on the WELFake approach based on the classification of fake news using the voting method. The 20 shortlisted features are used then a weighted classification of selected features delivers high accuracy. Kaushal et al. [2] say clickbait is the design of the content to attract the readers. The study suggests a relation between the clickbait mechanism and readers’ correlation. M. Faraon [13] assigns the score to the article to understand the trustworthiness of the article. The author believes that the credibility of an article cannot be simply calculated using a machine. Human interference is necessary to decide the credibility of the content. R. Kumar et al. [3] designed the FakeBERT model to classify fake news using CNN, where the features are detected automatically. Erwin B. et al. [13] used 10,000 samples from Twitter and Facebook, 56 accounts with 23,489 messages for performing the classification using Naive Bayes (NB), Support Vector Machine, (SVM), Logistic Regression (Logit), and the J48 algorithm (J48). Seventeen new features for Twitter and 49 features for Facebook used along with spam and sentiment are also considered. The output of the experiment is a message and the user credibility. Results are compared with earlier classifier accuracy. Andrew J et al. [9], the sampling is selected to represent the entire USA population, the professional research firm GfK’s probability-based participants are used. The questionnaire is prepared with a logic to address a multi-step and multi-method process including feedback, and direct interviews. The author compared context with all sides of the content using Linkert’s scale. The features are Message sidedness, Flexible thinking (FT), Need for cognition, and Interaction.
Depending upon the interaction and whether it is a two-way or three-way interaction, the balance or inclination towards the specific opinion is decided; for validation, ANOVA is used. Melissa T [10] performed a survey of 1207 participants first and then 603 participants. Analysis suggests that the Twitter accounts are available in 60% of the 603 participants, who are more educated. According to the author, credibility depends upon the tweet, media literacy, platform, and misinterpretations. The accuracy of the model is decided using the Chi-Square testing method. Additionally, recall helps in deciding the coverage of the total information. F. Liu et al. [11] address one of the important issues—Effective crises management through the narrators. To accomplish this the task force of adults in the U. S. is asked to perform a survey. This survey is performed considering seven different points. Crisis information-seeking intentions, emotions, government responsibility attribution, and perceived information credibility, are the parameters for studying the credibility of the narrator [14]. The literature survey led to an important observation about the sources and the type of dataset useful for the experiment. Different types of Linguistic, platform-specific, and user-specific features are analyzed. The approach to deciding the credibility based on the survey, machine learning, or a combination of both was discussed. Details of the scale for the survey and techniques to perform the survey are observed. Machine learning techniques and the use of specific algorithms depended upon classification and regression. The potential threat of not addressing the content modeling is noted.

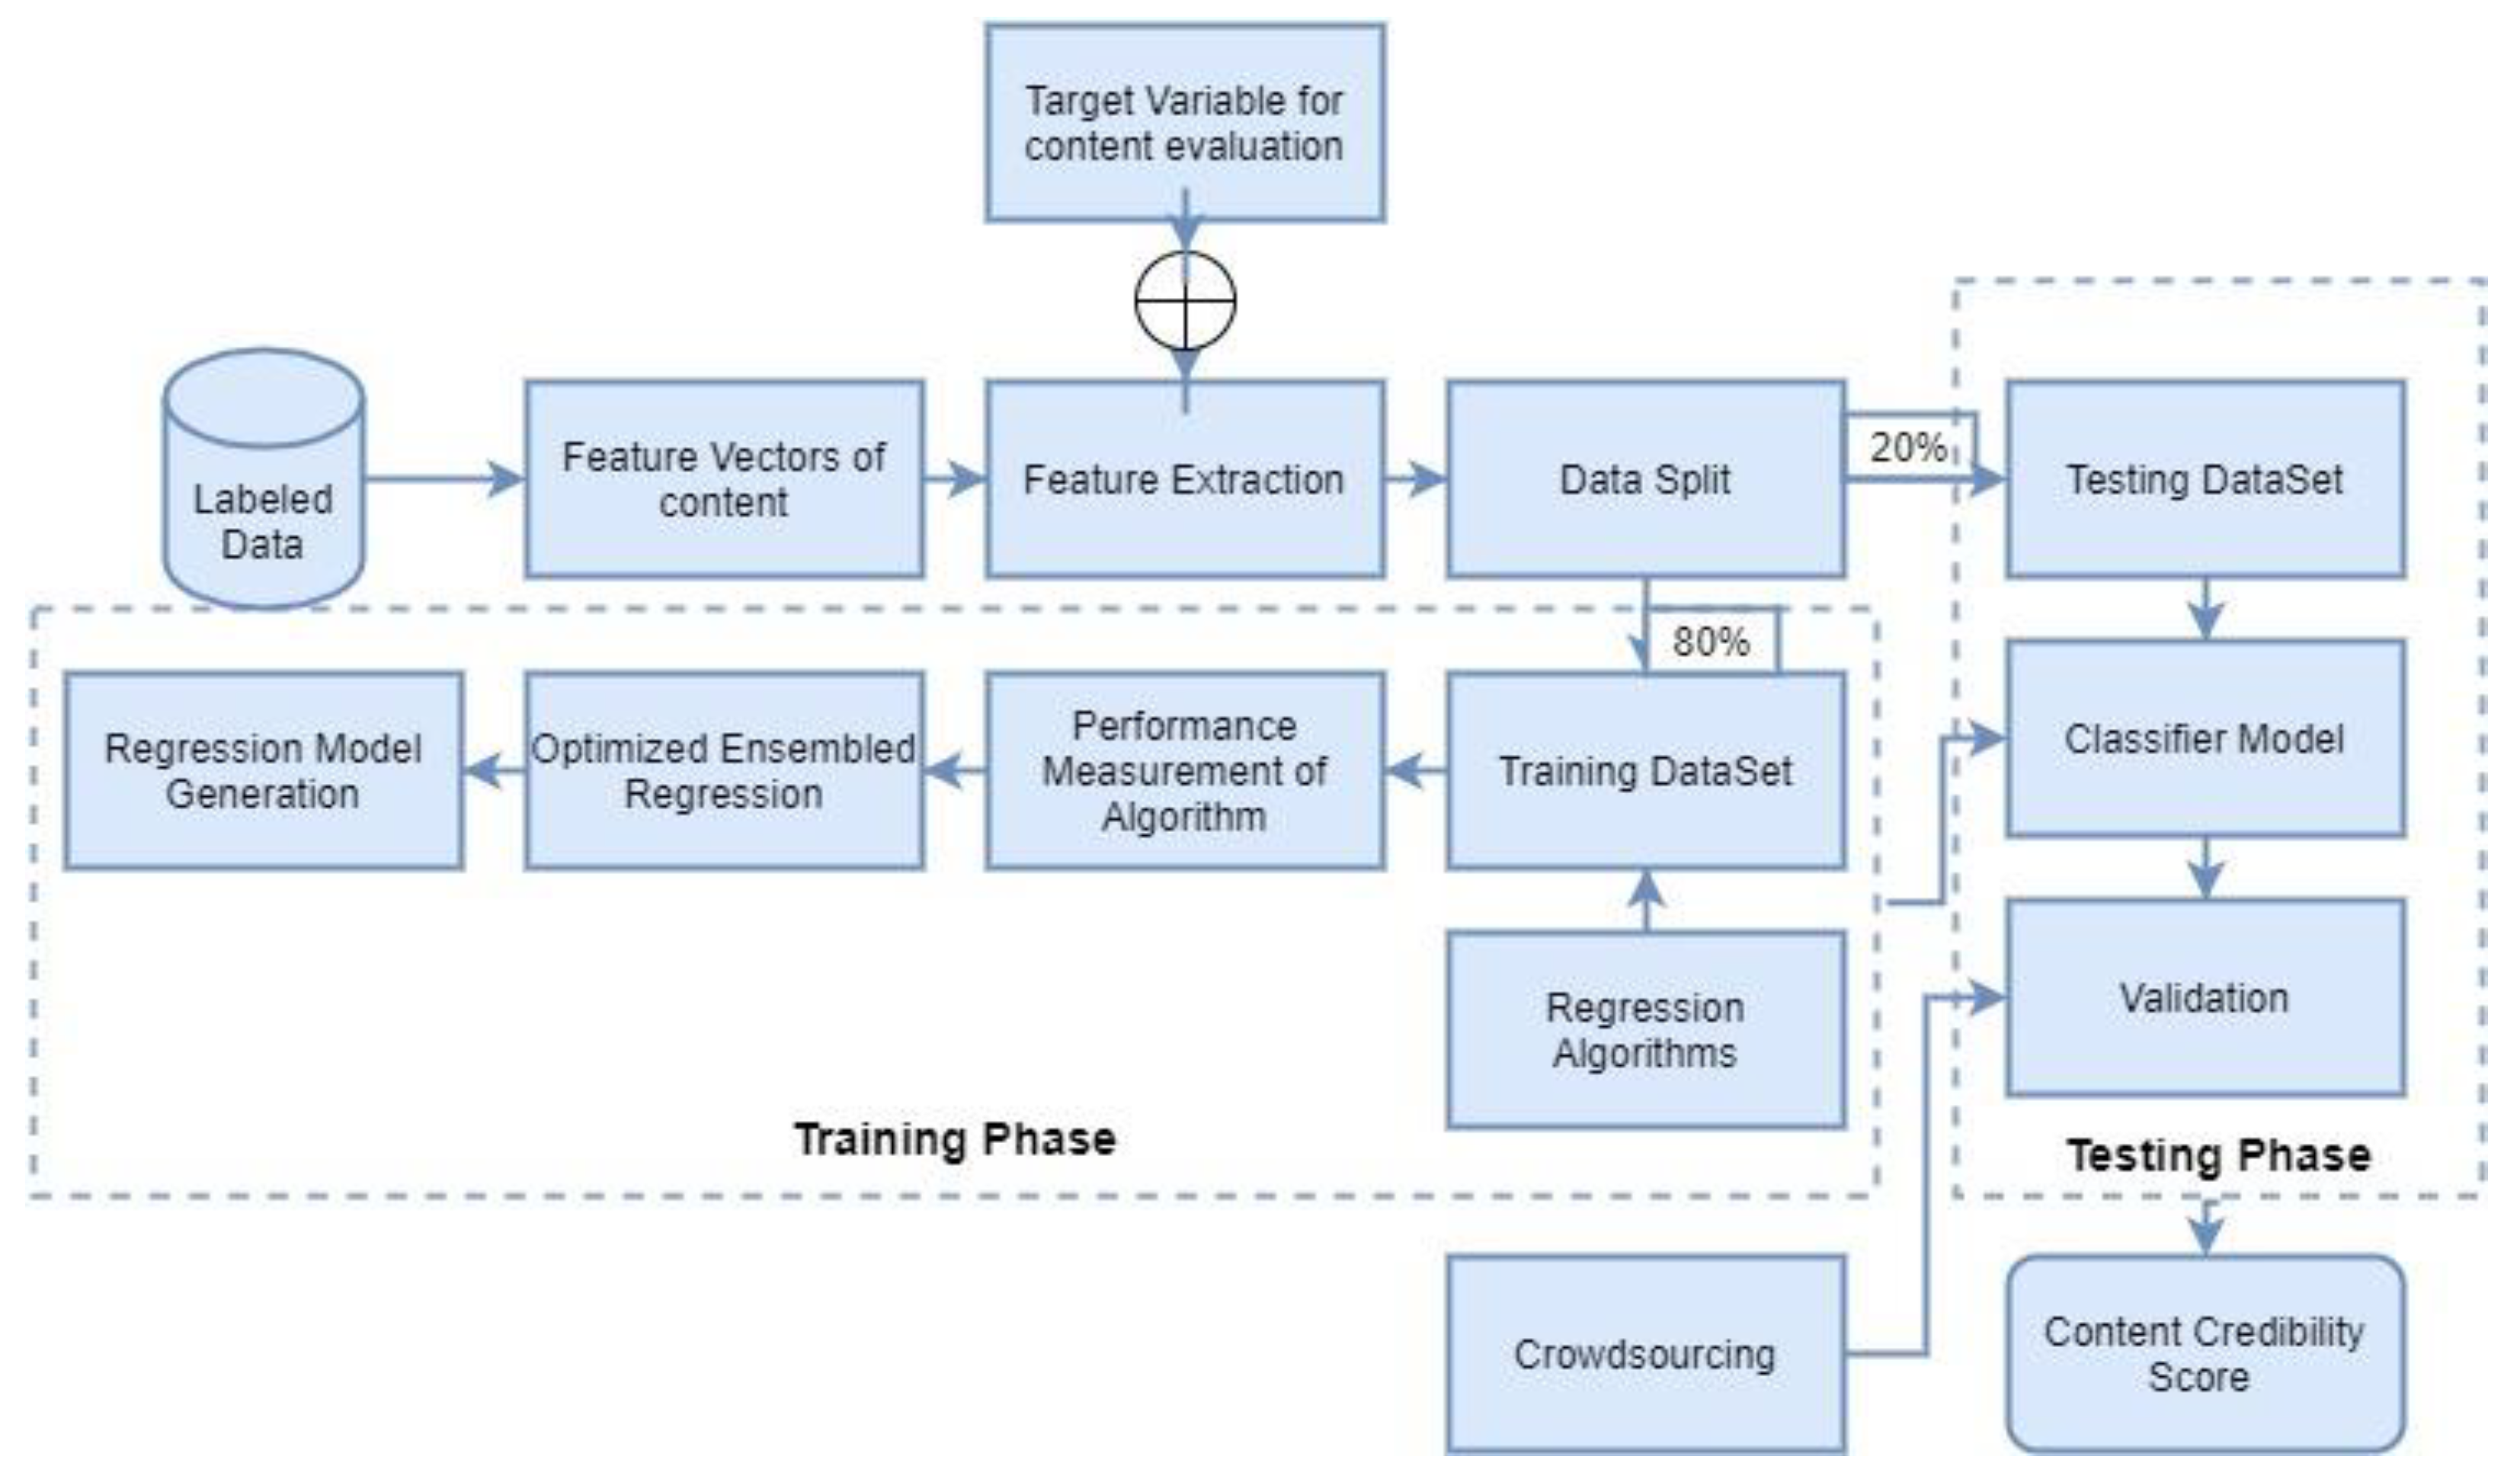
3. Materials and Methods

The experiment was performed to implement the regression technique and devise the method to predict the score for the document

3.1. Data Set Collection

The volume of the data set was 17 million records of a Movie Review data set from Rotten Tomatoes available at Kaggle. The dataset contained a review of the movie with ratings and information about freshness [8]. The purpose of selecting this data set was it addressed the description of the movie (Information) in the form of review (content) [15,16].

3.2. Feature Analysis

Set was carried out by checking the missing elements in a dataset, the conversion of the dataset into a structured format for data processing, the conversion of “fresh” and “rotten” keywords to “1” and “0”, respectively, for further processing as a Boolean variable [3,17]. The data set contained a total of eight features Link, Review, Top_Critique, Publisher_Nme, Review_Date, Review_Score, Critique_Name [18]. The analysis of these features was necessary, such as data type of these Features (Data Format), Director derived form of the values associated with features, etc. Prima fascia the type of variable and the relevance of the value of the parameter indirect (or derived) form is analyzed by using the IBM SPSS Statistic tool [8,19] (Figure 1).
Figure 1. System prototype for content modeling.
Asi 05 00043 g001
The detailed information about the dataset processing is mentioned below.
The data analysis of missing records is covered using IBM SPSS. Table 1, specifies the missing values, which are none in this case as per IBM, SPSS.
Similarly, the analysis of review score inclusion and exclusion can be seen by looking at the report in Table 2.
Feature analysis concerning data type, and dependent and independent variables are discussed in Table 3. As a target variable Review score is the most relevant feature along with the review score, Top critique and review type also reveal some important content.
Table 4 represents the fundamental operations applied to the numerical features (Also non-numerical features also converted to numerical values). This operation helps in identifying the outliers and getting rid of those outliers.

3.3. Regression Algorithm

Regression is necessary to predict the credibility of a given document based on the features and operations applied [6]. Regression algorithms are implied first in their original format and then the processing to use the best of these algorithms is imparted. Random Forest, Lasso Regression, Linear Regression, Polynomial Regression, Support Vector Machine, and Decision Tree, XGBoost are the algorithms that are used to perform the regression of the data [20,21,22]. The combination of the algorithm is used to improve the accuracy [5,7,17]. The existing techniques are strengthened using stacking and then boosting. This unique mechanism helps in predicting the qualitative measures of the content accurately.

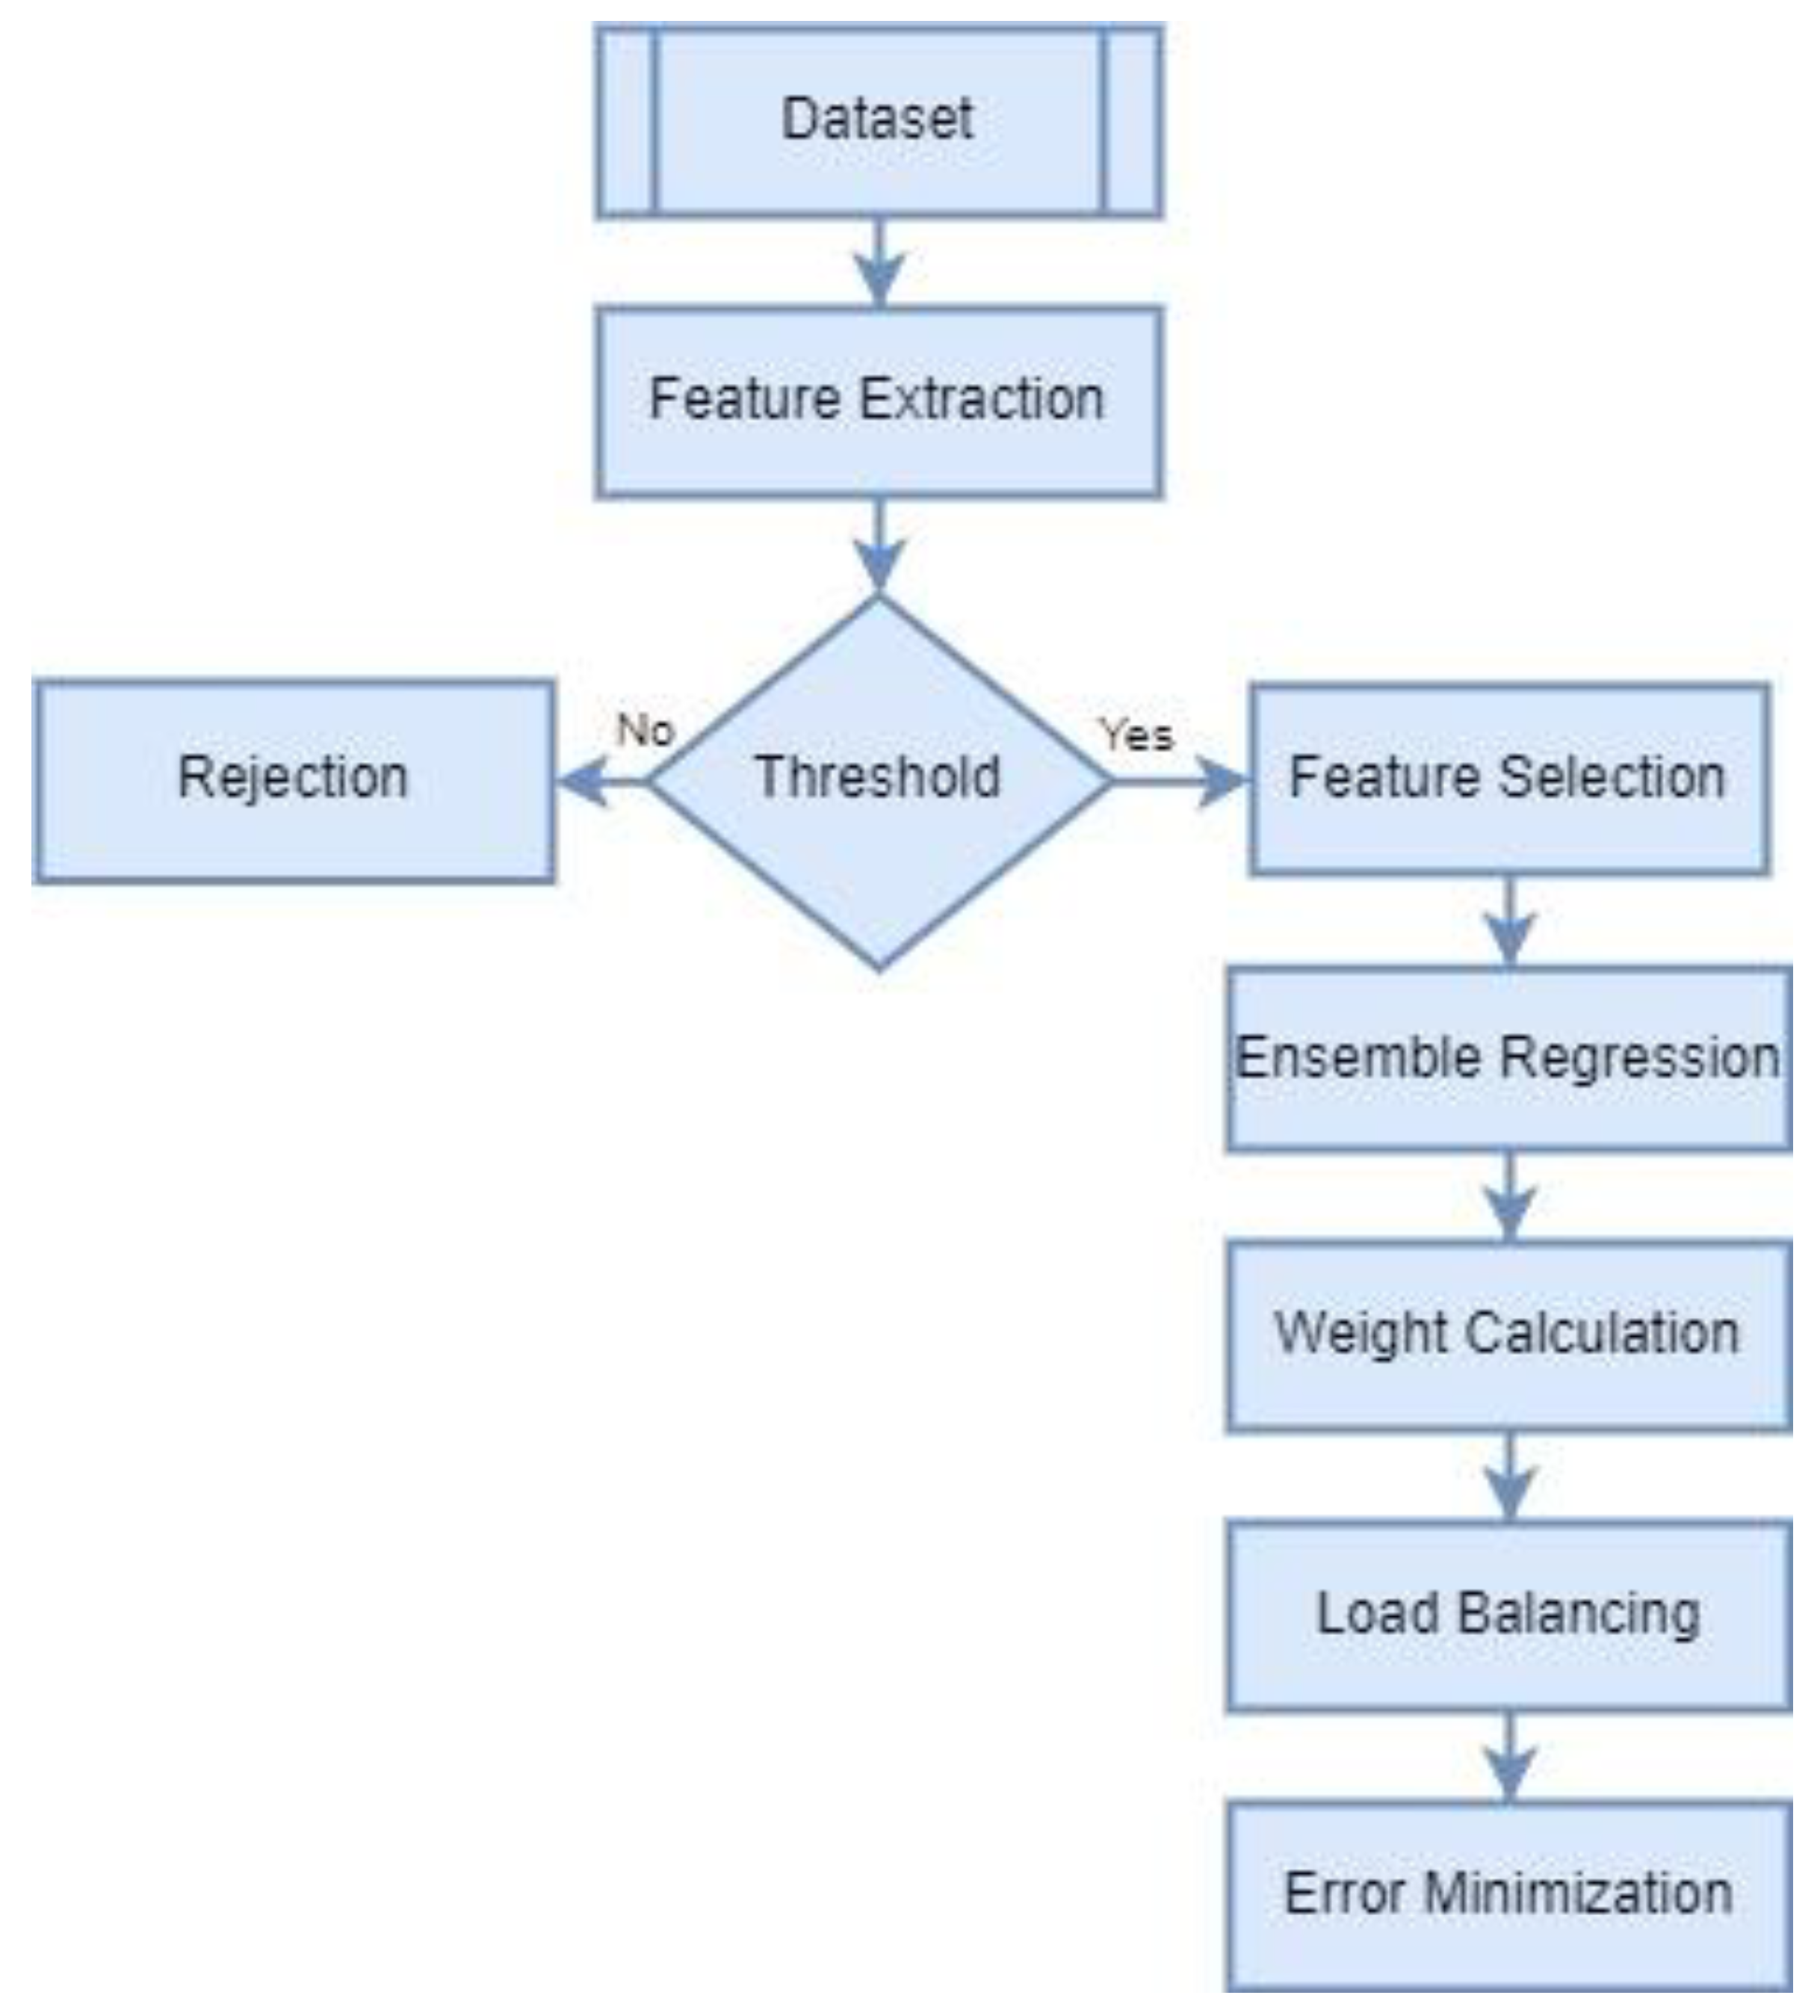
3.4. Ensemble Regression

Regression can be further improvised with the bagging, boosting-like approaches. The ensemble approach used here is a combination of conventional ensemble and hybrid models [4,12]. In a normal ensemble, the best-performing algorithms are used for the ensemble approach. The ensemble contributors are again used to train the system with their best features for delivering better results. (This is different from stacking) [23].

3.5. Error Loss Calculation

Loss is associated with the difference between the expected outcome and the actual outcome. The regression cannot be assessed with any other measurement tool, as in the case of the classification algorithm, precision, recall, F-Measure, and MAP [5]. To measure the performance, algorithms were compared and their respective loss was compared [24]. Use of the error loss calculation with Mean Squared Error, Mean Absolute Error, and Huber Error was applied. The accuracy was further modified by applying Optimization [8].

3.6. Optimization

Regression was enhanced using an ensemble algorithm, it was improvised again with the blend of contributors of the ensemble algorithm. The loss was minimized by adding the constant for balancing and regularization [25]. The optimization technique was one more unique feature of this model, which strives for the minima to reach the equilibrium point near the minima [26,27]. This was possible by using the load balancing of the weight in proportion to all contributors of the regression algorithm [4,6].

3.7. Credibility Score

Credibility Score prediction—The score was calculated and credibility was identified with the help of the score. The credibility score was the outcome to measure the quality of the user-generated content. The higher the score, the better the quality of the content.

4. Methodology

The methodology to select feature variables, Target variables, Dataset normalization, and cleansing, is discussed in detail. The use of the individual base model for regression, combining base models to form the ensemble model to obtain higher accuracy is generalized below.

4.1. Problem Formulation

  • Let x = [ x 1 ,   x 2 ,   x 3 , x n ] be the feature vector
  • Where n is the total number of features
  • Let y be the target variable
  • Let D = (X, Y) be the dataset, where X = [ x i , j ]
  • Where i is sample number and j is feature index. i ∈ [1, m] j ∈ [1, n]
  • m is equal to the number of samples and n is equal to the number of features
  • Here, x i , j is the value of the jth feature in the ith sample.
  • Y = [ y i ]
  • Where i is the sample number. i ∈ [1, m].
  • m is equal to the number of samples and n is equal to the number of features
  • Here, y i is the value of target variable y for ith sample

4.2. Explanation about Stacking in the Ensemble

The accuracy of the model can be increased using bagging and boosting if the algorithms are homogeneous. For heterogeneous algorithms, stacking is used. To further improve the accuracy the cost function should be designed in such a way to minimize the losses.
In the experimentation, stacking is used to consider the heterogeneous algorithms. There are two levels L-0 and L-1 [28,29], to deal with individual regression and ensemble regression.
Level -0 (L-0)- Base algorithms Linear Regression, Lasso Regression, Ridge Regression, Decision Tree [30,31]. are used to train the model to calculate the credit score. The base models for L-0 are trained for a number of samples n and a number of models k. The accuracy of each individual algorithm is stated in Table 5. These accuracies are further improvised by employing the next stage Level-1 [32,33].
Level -1 (L-1)- The model is trained more using the Meta-Learning regression approach. The objective function is defined with the intent to minimize the error by adding the balancing factor [34,35]. The weights are identified by using backpropagation—stochastic gradient descent.

4.3. Algorithm

Algorithms used for the regression deliver the accuracy, and weight to each algorithm required. The model should be further balanced to avoid overtraining hence, balancing is used to maintain the equilibrium needed for the gradient descent. The efficiency of the algorithm is extended by minimizing the value of the curve. The gradient descent is decreased to its lowest value (Algorithm 1). The flow of the data can be well interpreted with the help of the diagram mentioned in Figure 2. The unique contribution of the work can be seen in weight calculation, error minimization, and optimization during the regression process.
Algorithm 1: Content credibility using Fair Ensemble Regression with Optimization (FERMO)
Step 1: Training Models—Train k base regression models (M = M1, M2, …, Mk) using training sets X and Target Output Y
   y i j   be   the   predicted   output   of   j t h   model   for   i t h Sample.
Step 2: Error Calculation—Objective Function is defined as follows
I ( θ ) = 1 n i = 1 n ( y i   θ j × y i j )   2   + µ j = 1 k   θ j 2
where θ = [ θ 1 , θ 2 ,     θ 3 θ n ]   θ i is a weight associated with model M   i .
   µ is a regularization parameter used to control the selected value of θ by an optimization algorithm.
Step 3: Minimization Optimization problem can be defined as follows
M i n θ   I ( θ )   = M i n θ   { 1 n ( i = 1 n ( y i θ j × y i j ) )   2 + µ j = 1 k θ j 2 }
Where   0     θ j     1 j = 1 k   θ j = 1
  To obtain the values of θ j by solving the equation mentioned above
Step 4: Testing the dataset
  For test dataset x t e s t = [ x 1 ,   x 2 ,   x 3 , x n ] predicted value of y ^ i   for   ith   sample   in   x t e s t as follows
y ^ i = 1 n j = 1 k ( θ j × y i j )
where y ^ ij is the predicted value for   i   t h sample x i , by j   t h base model M j
Figure 2 indicates the flow of the data from input collected from the dataset to the final outcome.

5. Regression Loss

When the regression problem is converted into a classification problem, the accuracy of classification can be verified with Precision, Recall, F-Measure, MAP, etc. To assess the performance of the regression there is no direct assessment available [36]. The error loss is calculated to know the exactness of the prediction, which is also called an R2score. In this experiment losses include Mean Squared Error, Mean Absolute Error, Mean Absolute Logarithmic Error, Mean Absolute Percentage Error, Huber loss, LogCosh, and Quantile loss.

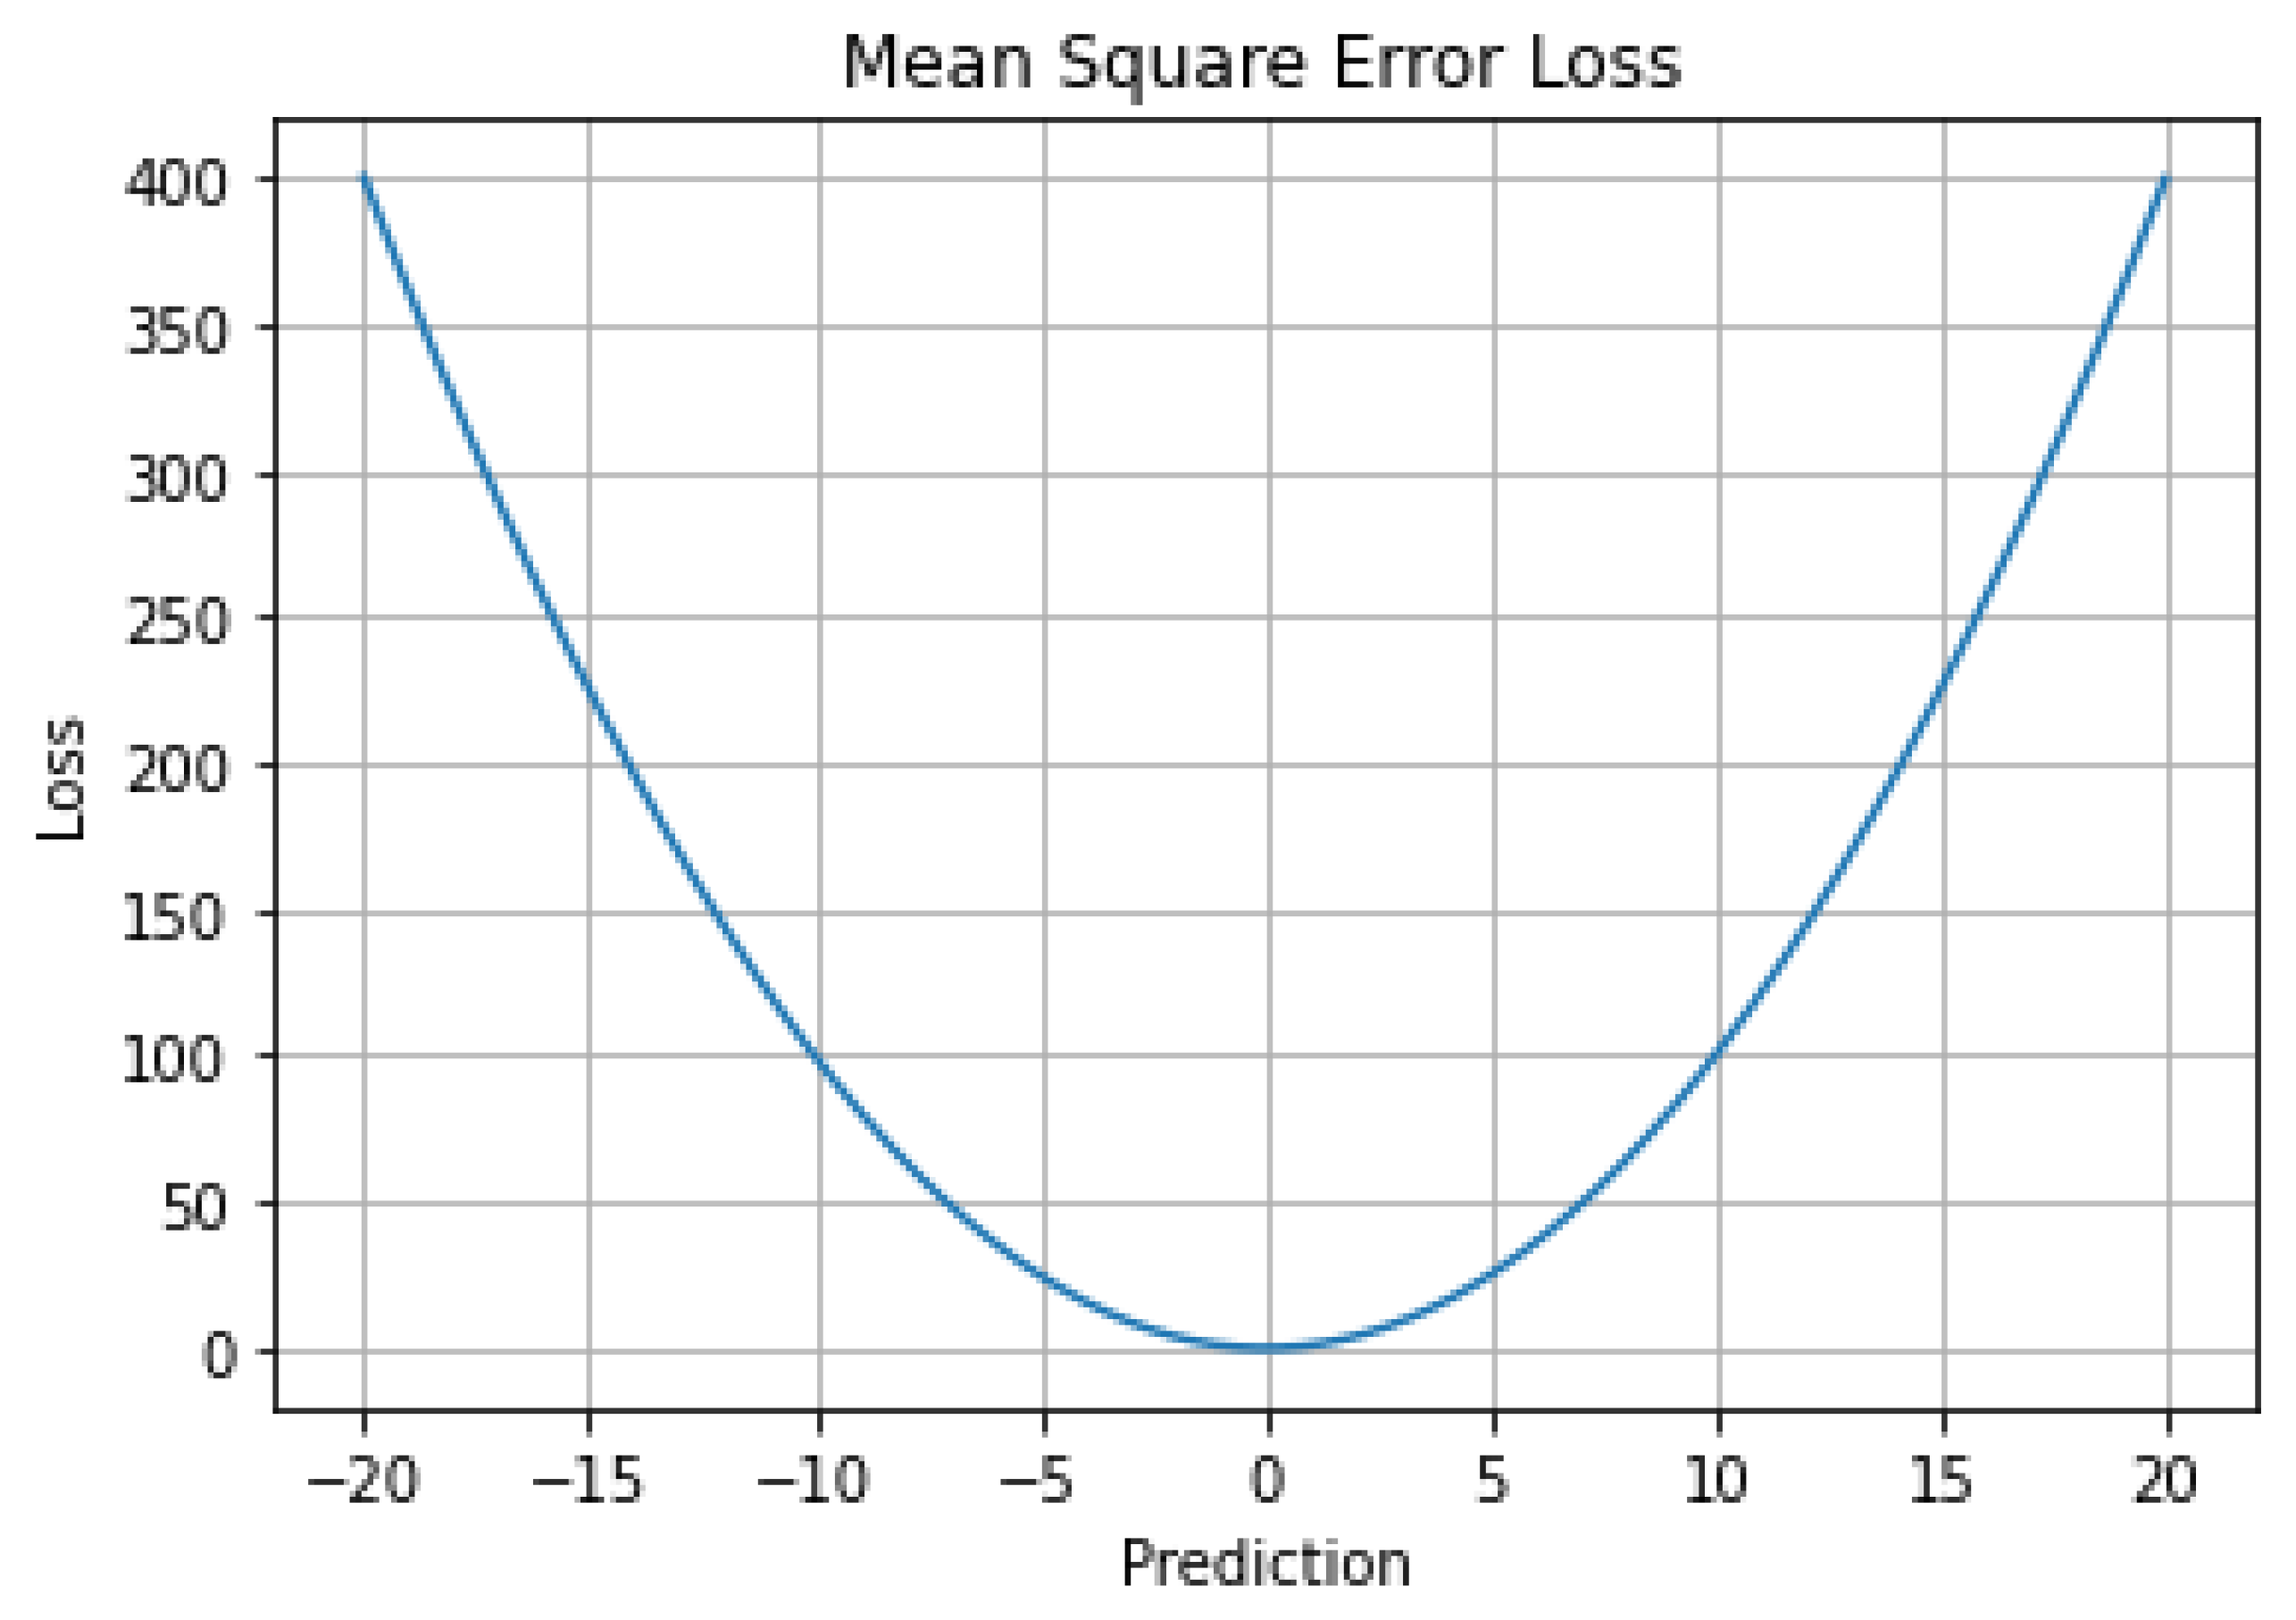
5.1. Mean Squared Error (MSE) L2 Loss, Quadratic Loss

Sum of squared distance between expected variable and the target variable.
M S E = 1 n i = 1 n ( y i y ^ i ) 2
Graph MSE Loss Vs Prediction (“U” shape). MAE is robust for outliers, but learning is not smooth or good because of the absence of a curve. The mean is more susceptible to outliers than the median. Use MSE when the loss of data is costlier than the presence and absence of an outlier.

5.2. Mean Absolute Error (MAE)

Summation of the absolute difference between the predicted and the target variable [2]. If we consider the direction, then it is Mean Bias Error (sum of residuals/errors). MAE loss Vs Predictions (“V” shape)
M A E = 1 n i = 1 n | y i y ^ i |
The value of the gradient remains the same throughout; the learning is difficult. A small value causes a change in the gradient, which degrades the learning. Use MAE when outliers cannot be tolerated [9].

5.3. Huber Loss Function, Smooth Mean Absolute Error

Error is a small quadratic function. Delta determines the smaller value of error. Training the delta parameter in the iteration is a problem. This combines the robustness of MAE and decreased minima of MSE [15].
Problem—Missing minima because of a large curve.
L δ ( y , f ( x ) ) = { 1 2 ( y f ( x ) ) 2 , f o r   | y f ( x ) | δ δ   | y f ( x ) | 1 2 δ 2 , x 0

5.4. LogCosh Loss

It is similar to the squared error, it is not affected by wrong predictions. It is twice differentiable but may become affected by large outliers [13].
L ( y , y p ) = i = 1 n log ( cosh ( y i p ) y i )

5.5. Quantile Loss

The difference between the Actual and expected value is constant [37,38,39]. Instead of exact prediction, the interval prediction gives more accurate. The non-linear model is more practical. It is an extension to MAE. Half quantile is MAE [17].
L γ ( y , y p ) = i = y i < y i p ( γ 1 ) . | y i y i p | + i = y i < y i p ( γ ) . | y i y i p |

6. Results

The result section covers the accuracy and error loss in actual and expected output. Minima adhered to a sharp curve represents the favorable results. These errors can be minimized, in the Optimization section, the details about the minima and enhancement are addressed. Results received after the experimentation are represented with nine different graphs presented in Figure 3, Figure 4, Figure 5, Figure 6, Figure 7, Figure 8 and Figure 9.
Result analysis is carried out considering two different perspectives or levels. At level zero L-0 there are individual algorithms—Decision Tree, Ridge, lasso, Linear Regression algorithm, details are given in Table 5 and Table 6.
Similarly, some important ensemble techniques are used to calculate the accuracy of the regression algorithm. The percentage of the prediction is more in L-1 in comparison to L-0. The accuracy of the FERMO is 96.29%.
To understand the error quotient in the prediction, loss is also calculated. The details of loss analysis during the ensemble regression are as below.

6.1. Mean Squared Error (MSE)

It is the square of the difference between the actual and expected outcome. Analysis of this error helps in minimizing the effect of overall loss. Figure 5 indicates the regression loss calculation using MSE. Ideally, it must represent the U shape. FERMO is resilient to the loss of data. The curve, which is flatter is generally away from the minima [40,41].
Figure 3 represents the MSE plotting for the movie dataset instead of the Movie Review. The sharpness in the curvature can be easily noticed. This indicates the influence of a large volume of data on a curvature.

6.2. Mean Absolute Error (MAE)

Mean Absolute Error (MAE) is the average of the difference between the expected and actual outcome. This is robust to the outlier this means only magnitude is covered, there is no coverage of direction [42].

6.3. Huber Loss Function

Huber loss function is less sensitive to the outliers, so there is no sharp angle at minima. This is also called a smooth function. This function uses the robustness of MAE and MSE. The smaller value of the delta Huber function resembles MSE and for higher values, it resembles MAE [16].

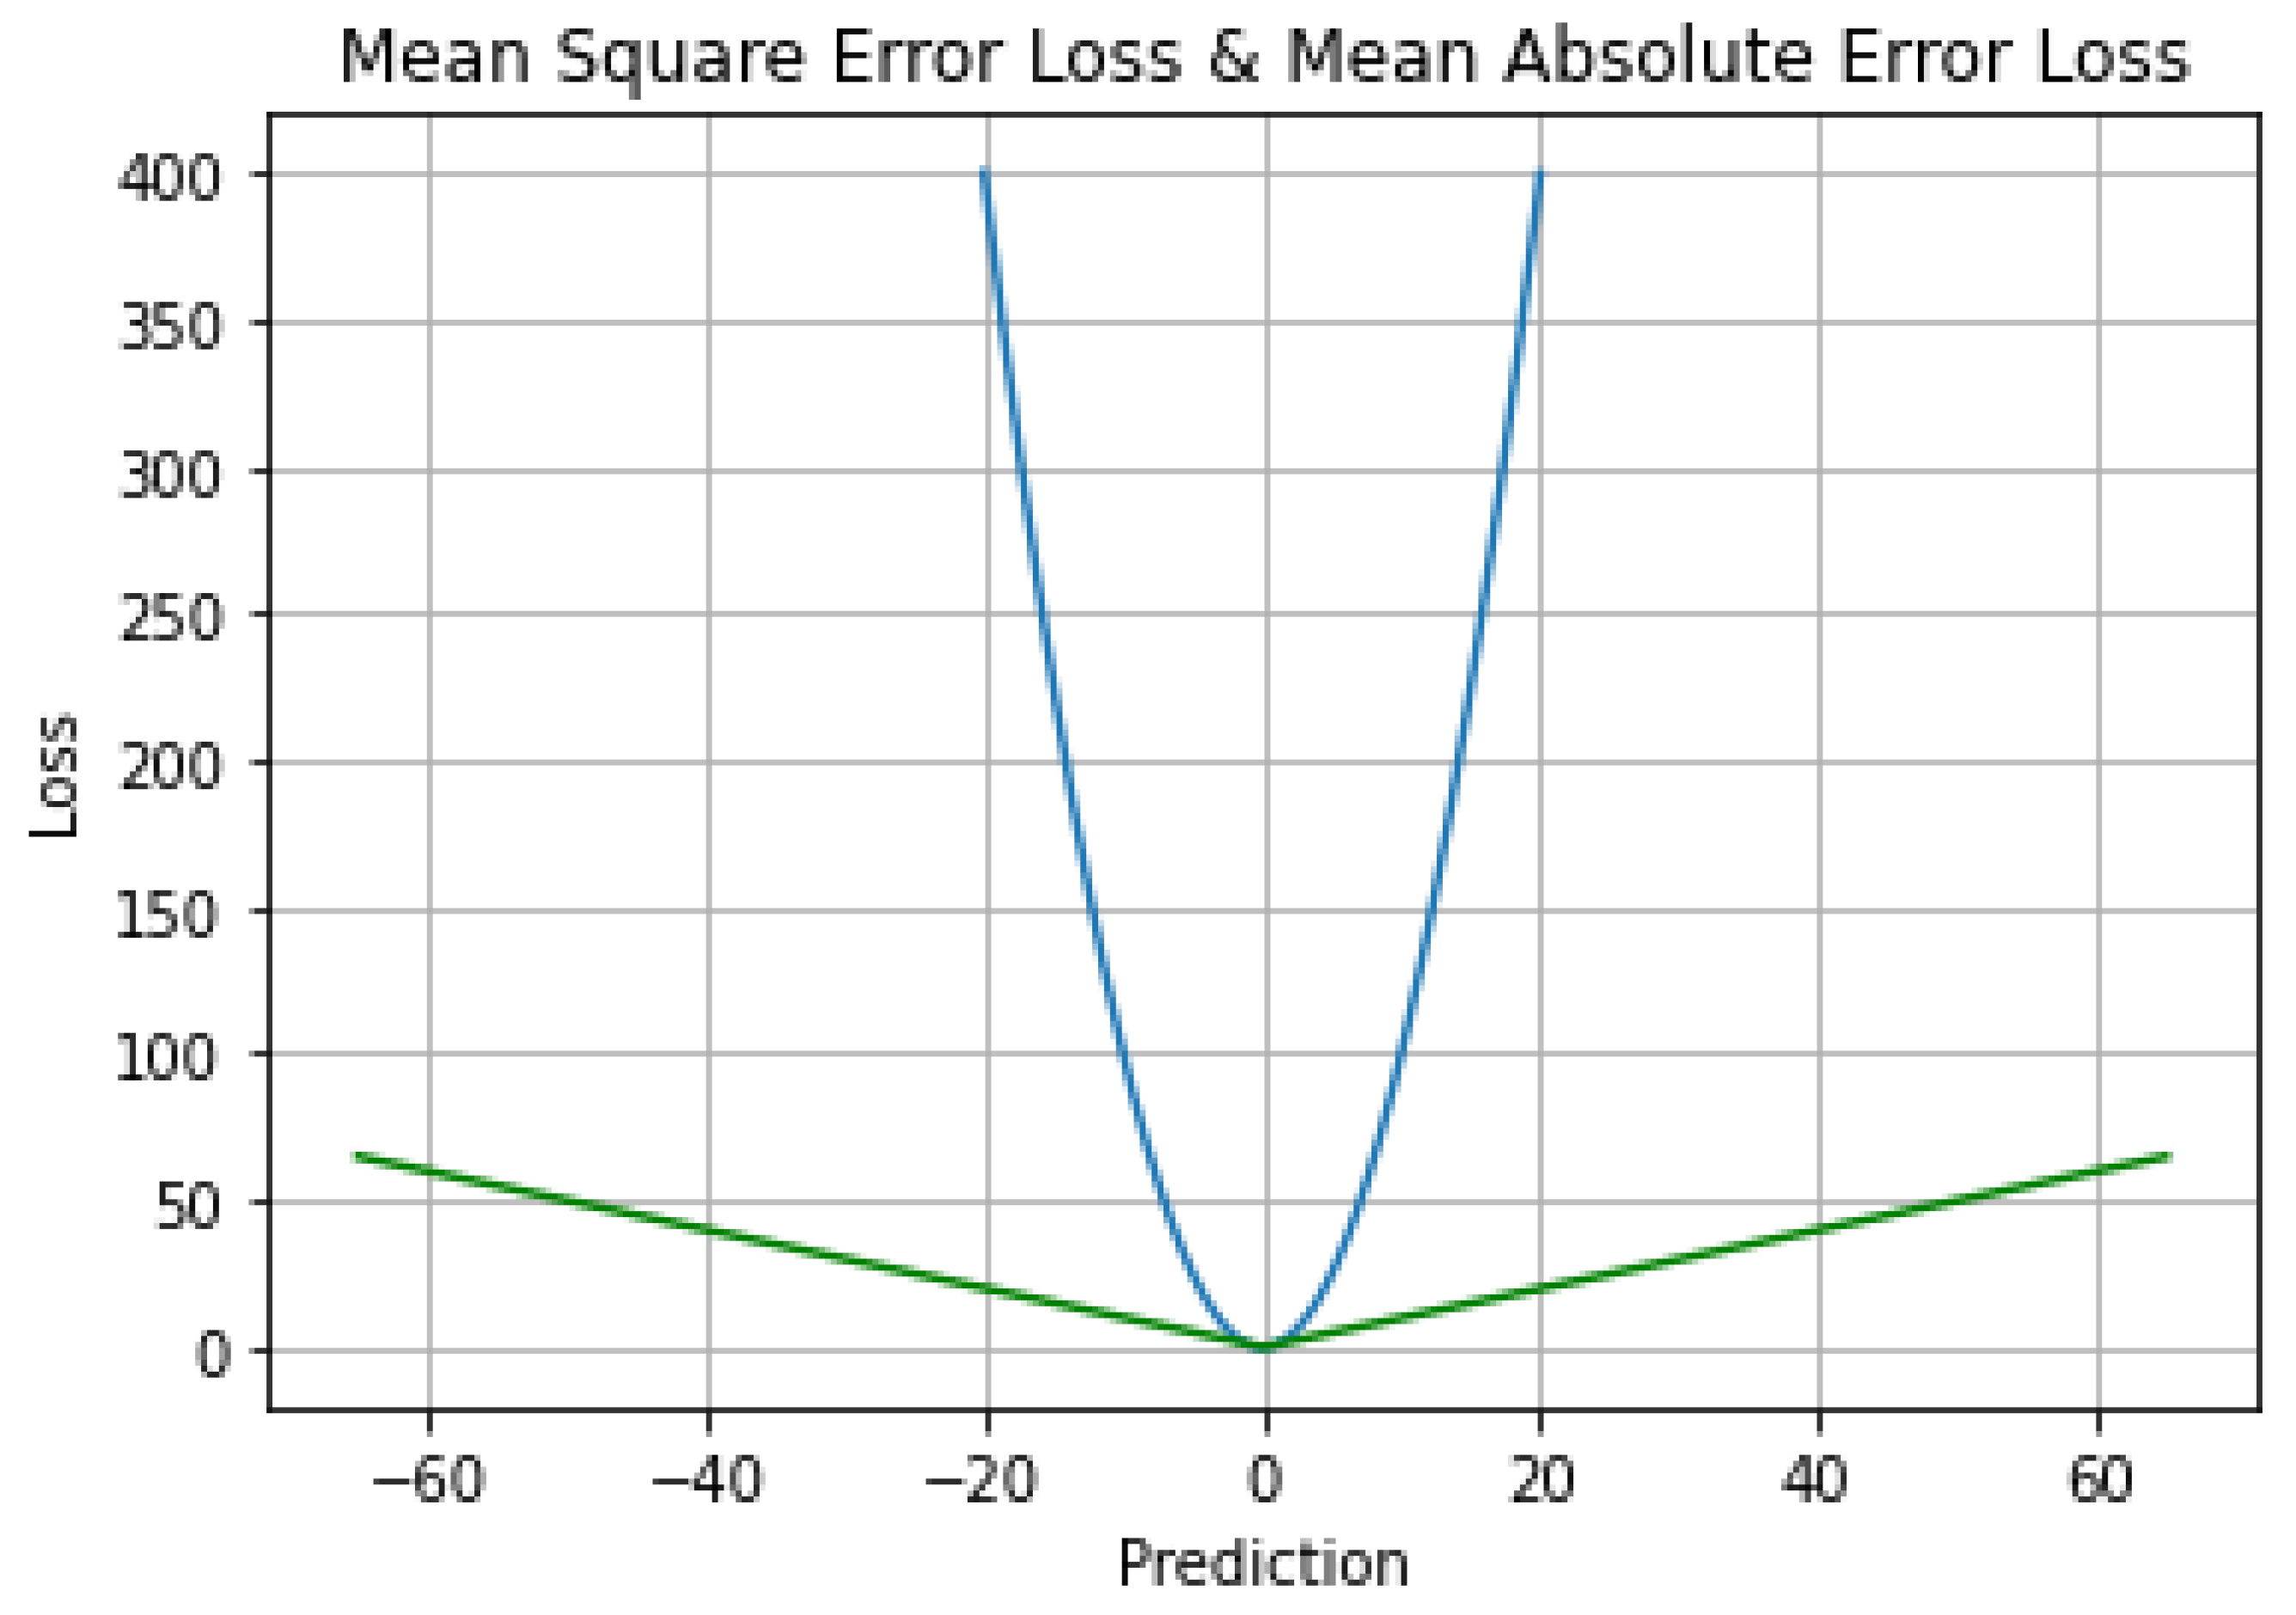
6.4. Mean Square Error Loss & Mean Absolute Error Loss

Relative plotting of the graph of Mean Square Error Loss & Mean Absolute Error Loss together, helps in understanding the errors explored using a different perspective [12,43]. In Figure 6 the area under the Mean Square Error Loss is smaller than the area covered by Mean Absolute Error Loss. This is proof of the logical derivation of the square function.

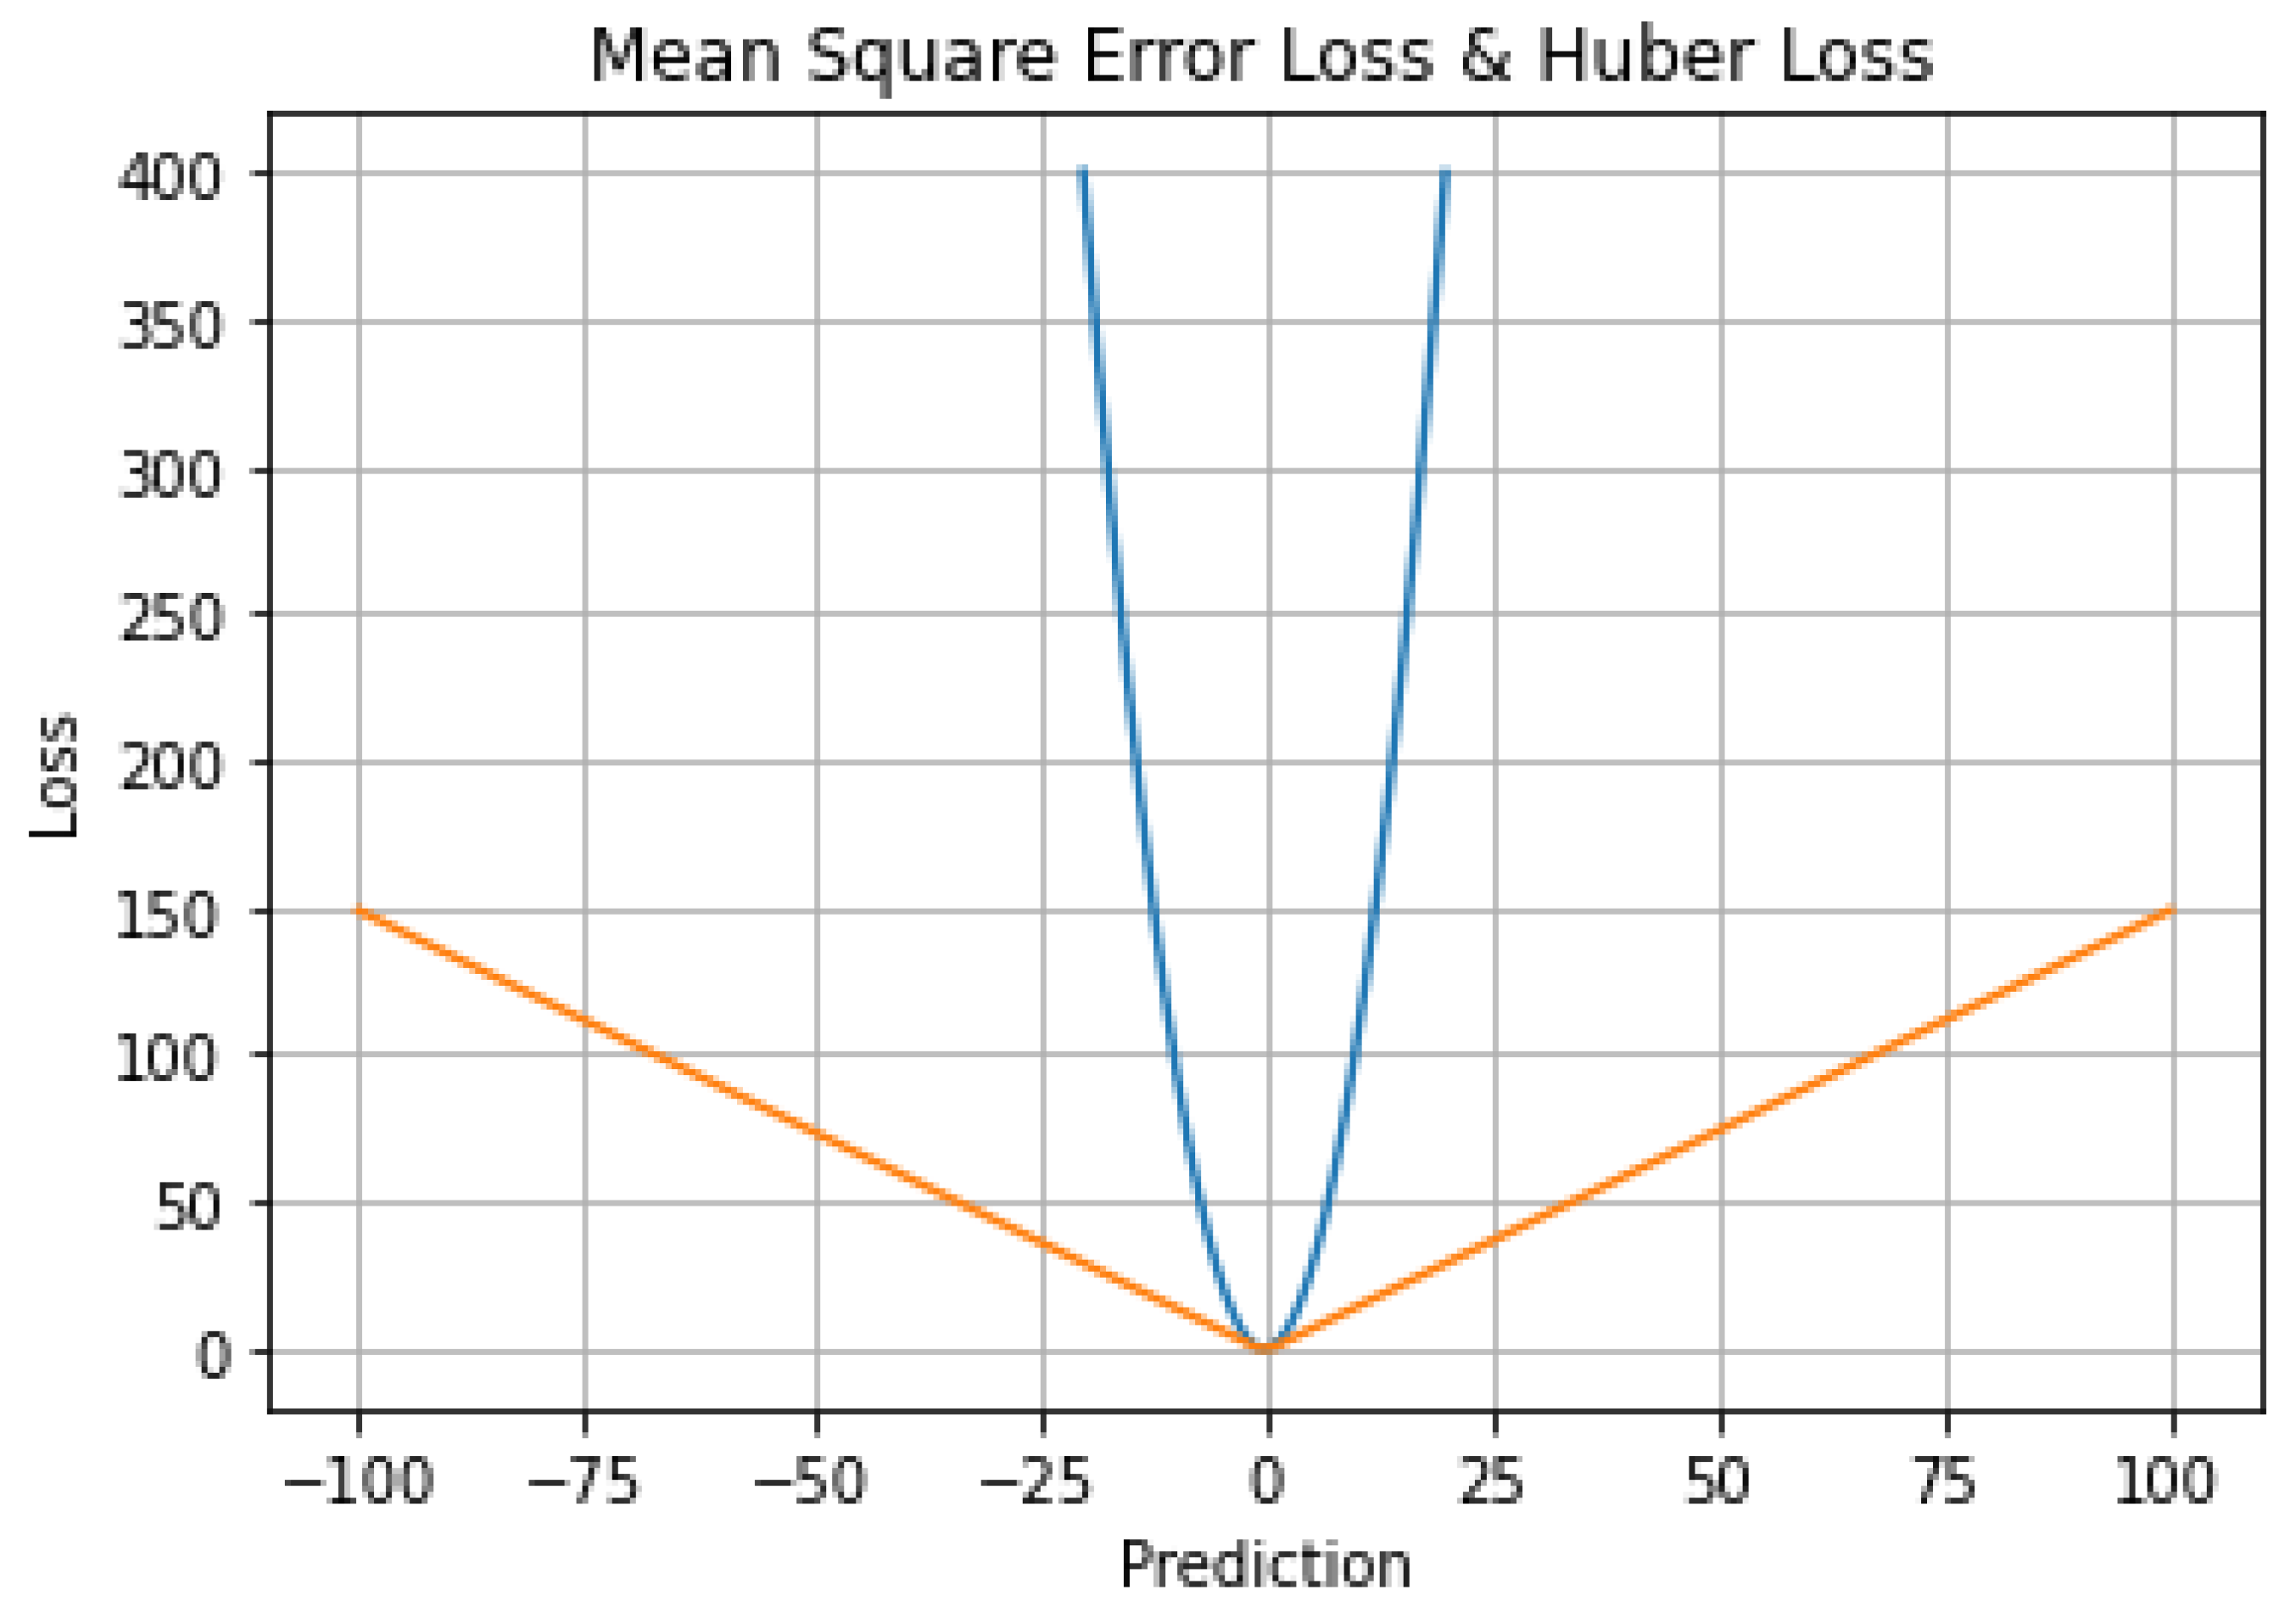
6.5. Mean Square Error Loss & Huber Loss

Figure 7 indicates the plotting of Mean Error loss and Huber Loss. The representation of the Mean Square Error Loss plotted with Mean Absolute loss and Huber Loss looks similar to that shown in Figure 8 and Figure 9, but there is a difference between the scales used in both graphs. The details can be seen in the relative error loss in Figure 7. Figure 7 indicates the increased smoothness for the value of delta [3,8]. There are a lot of variants, which can be studied by varying the delta value. For the constant value of 0.5, the plotting represents the minima close to the equilibrium. This proves that there is no further training or backpropagation is needed to achieve the minima separately [44].

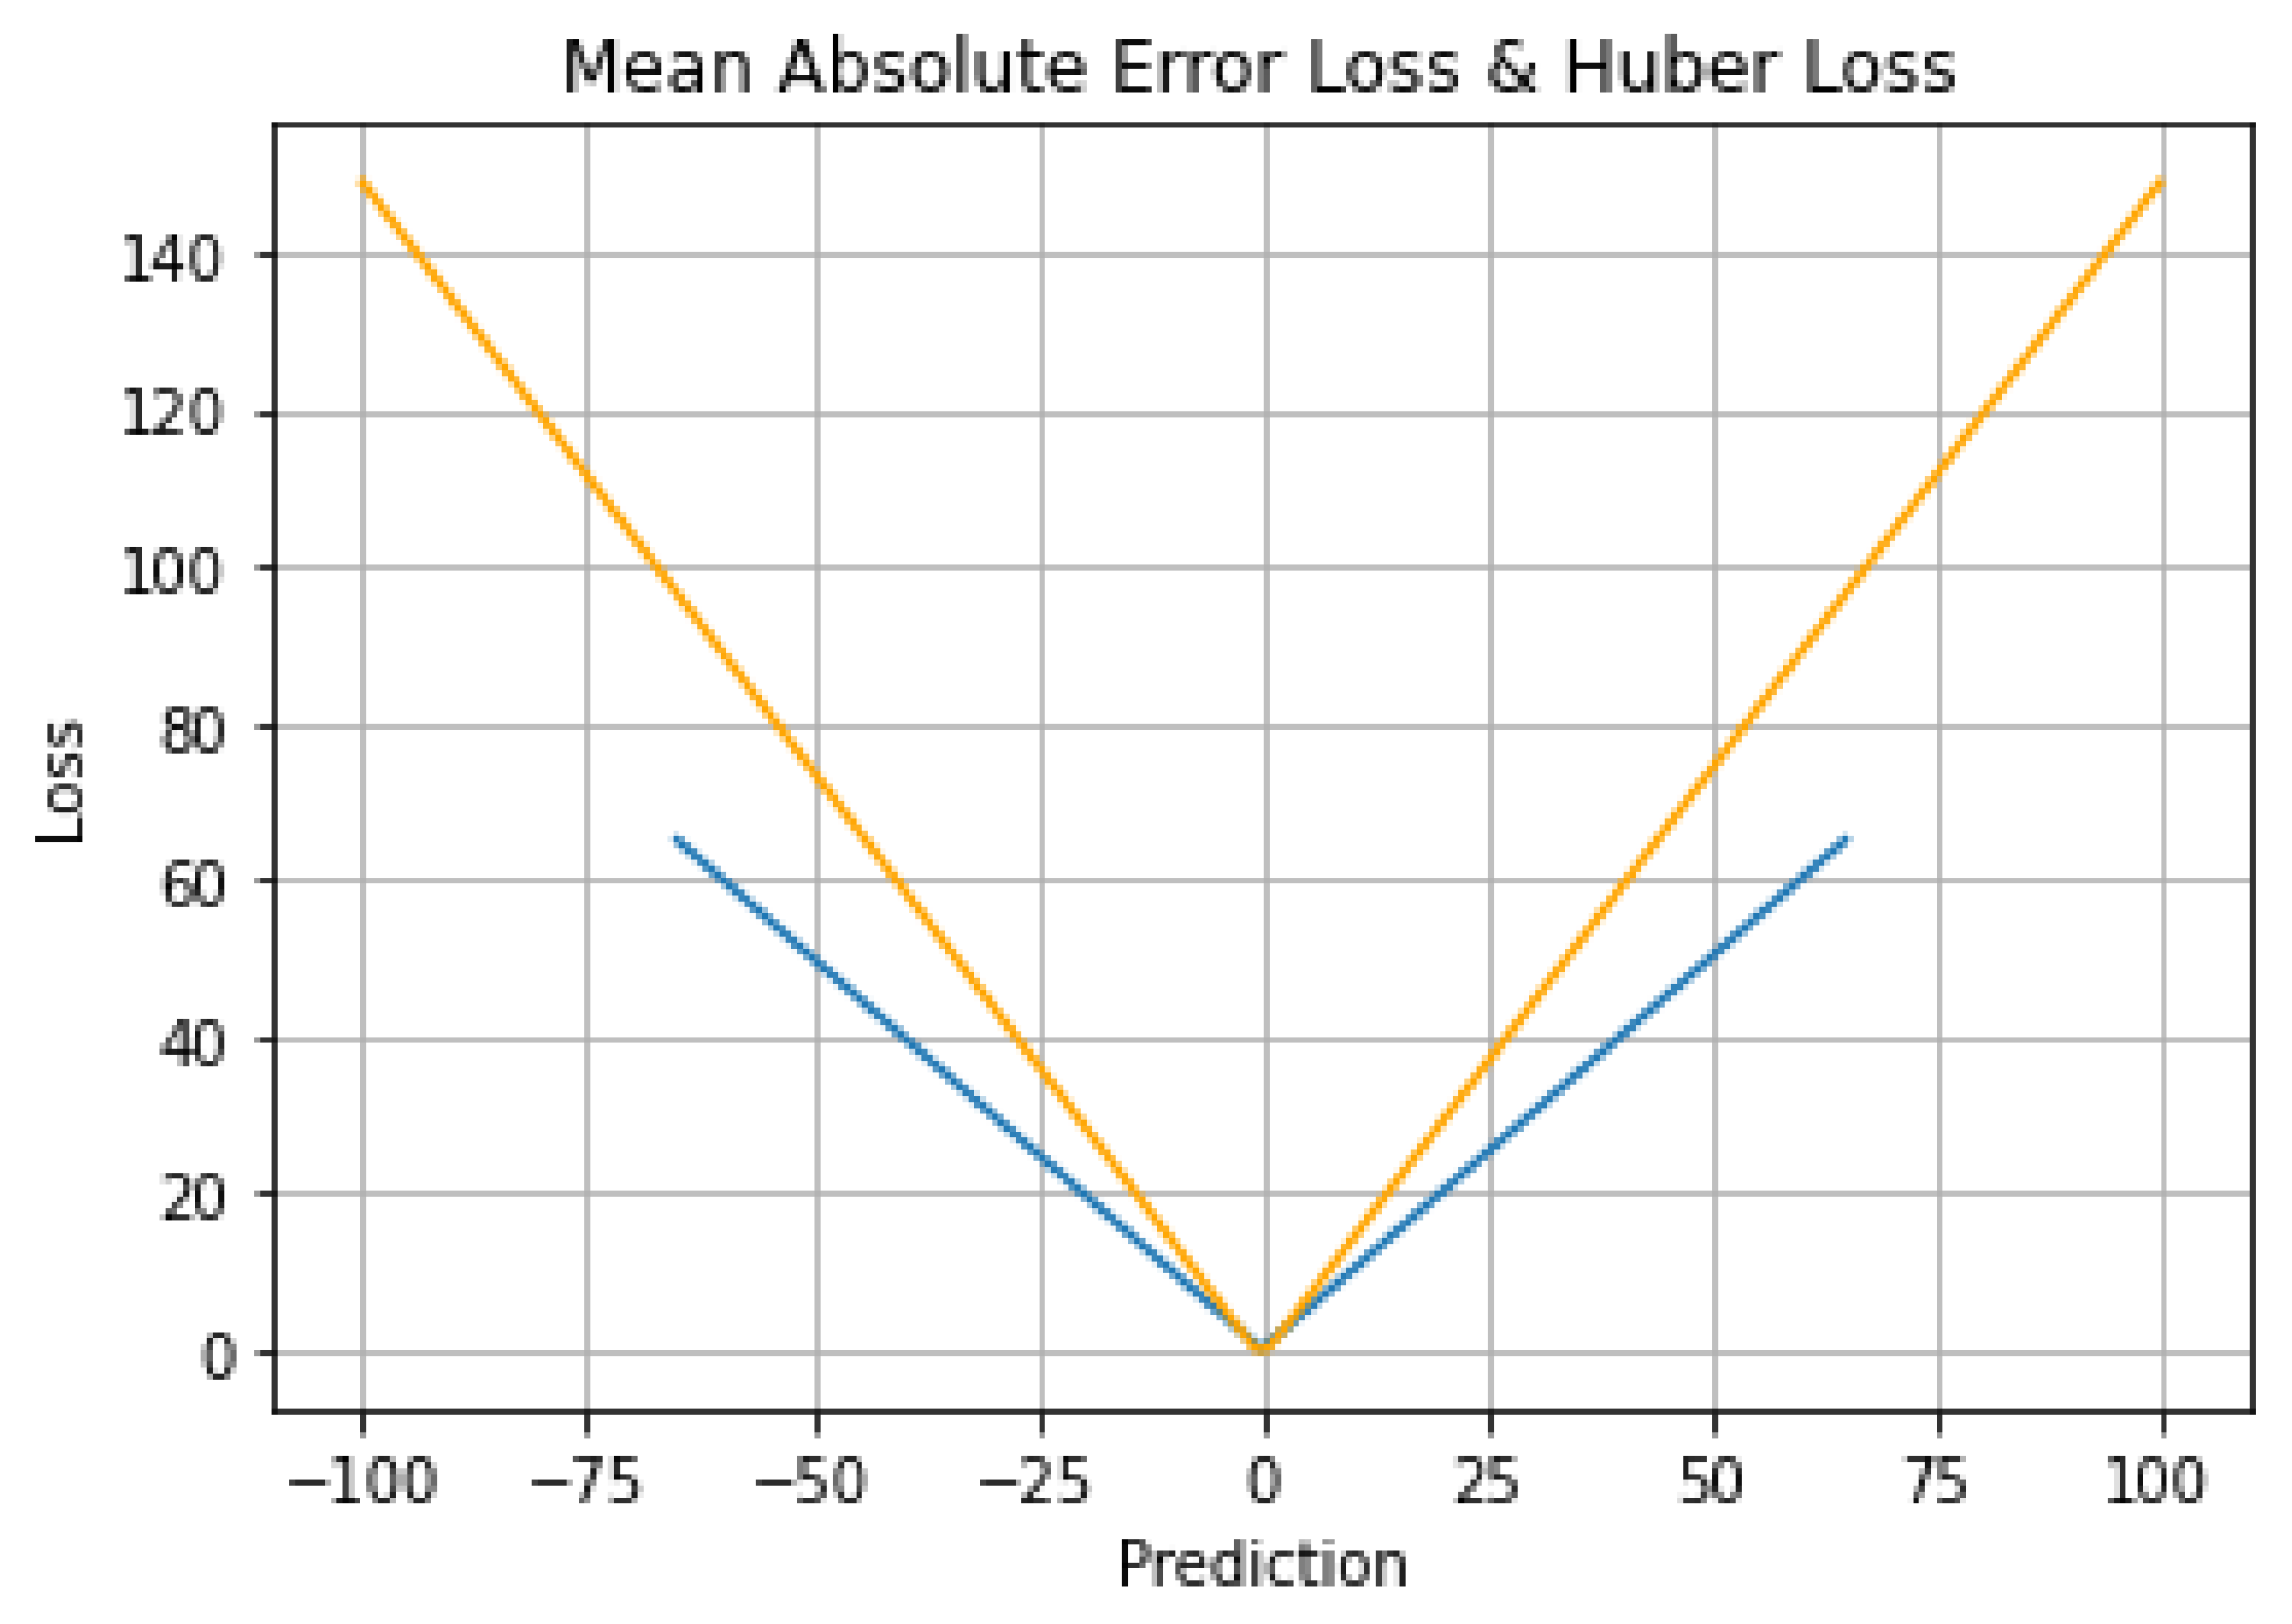
6.6. Mean Absolute Error Loss & Huber Loss

Figure 8 represents Mean Absolute Error and Huber loss. The association helps in depicting the minimum loss at the intersection of these graphs.

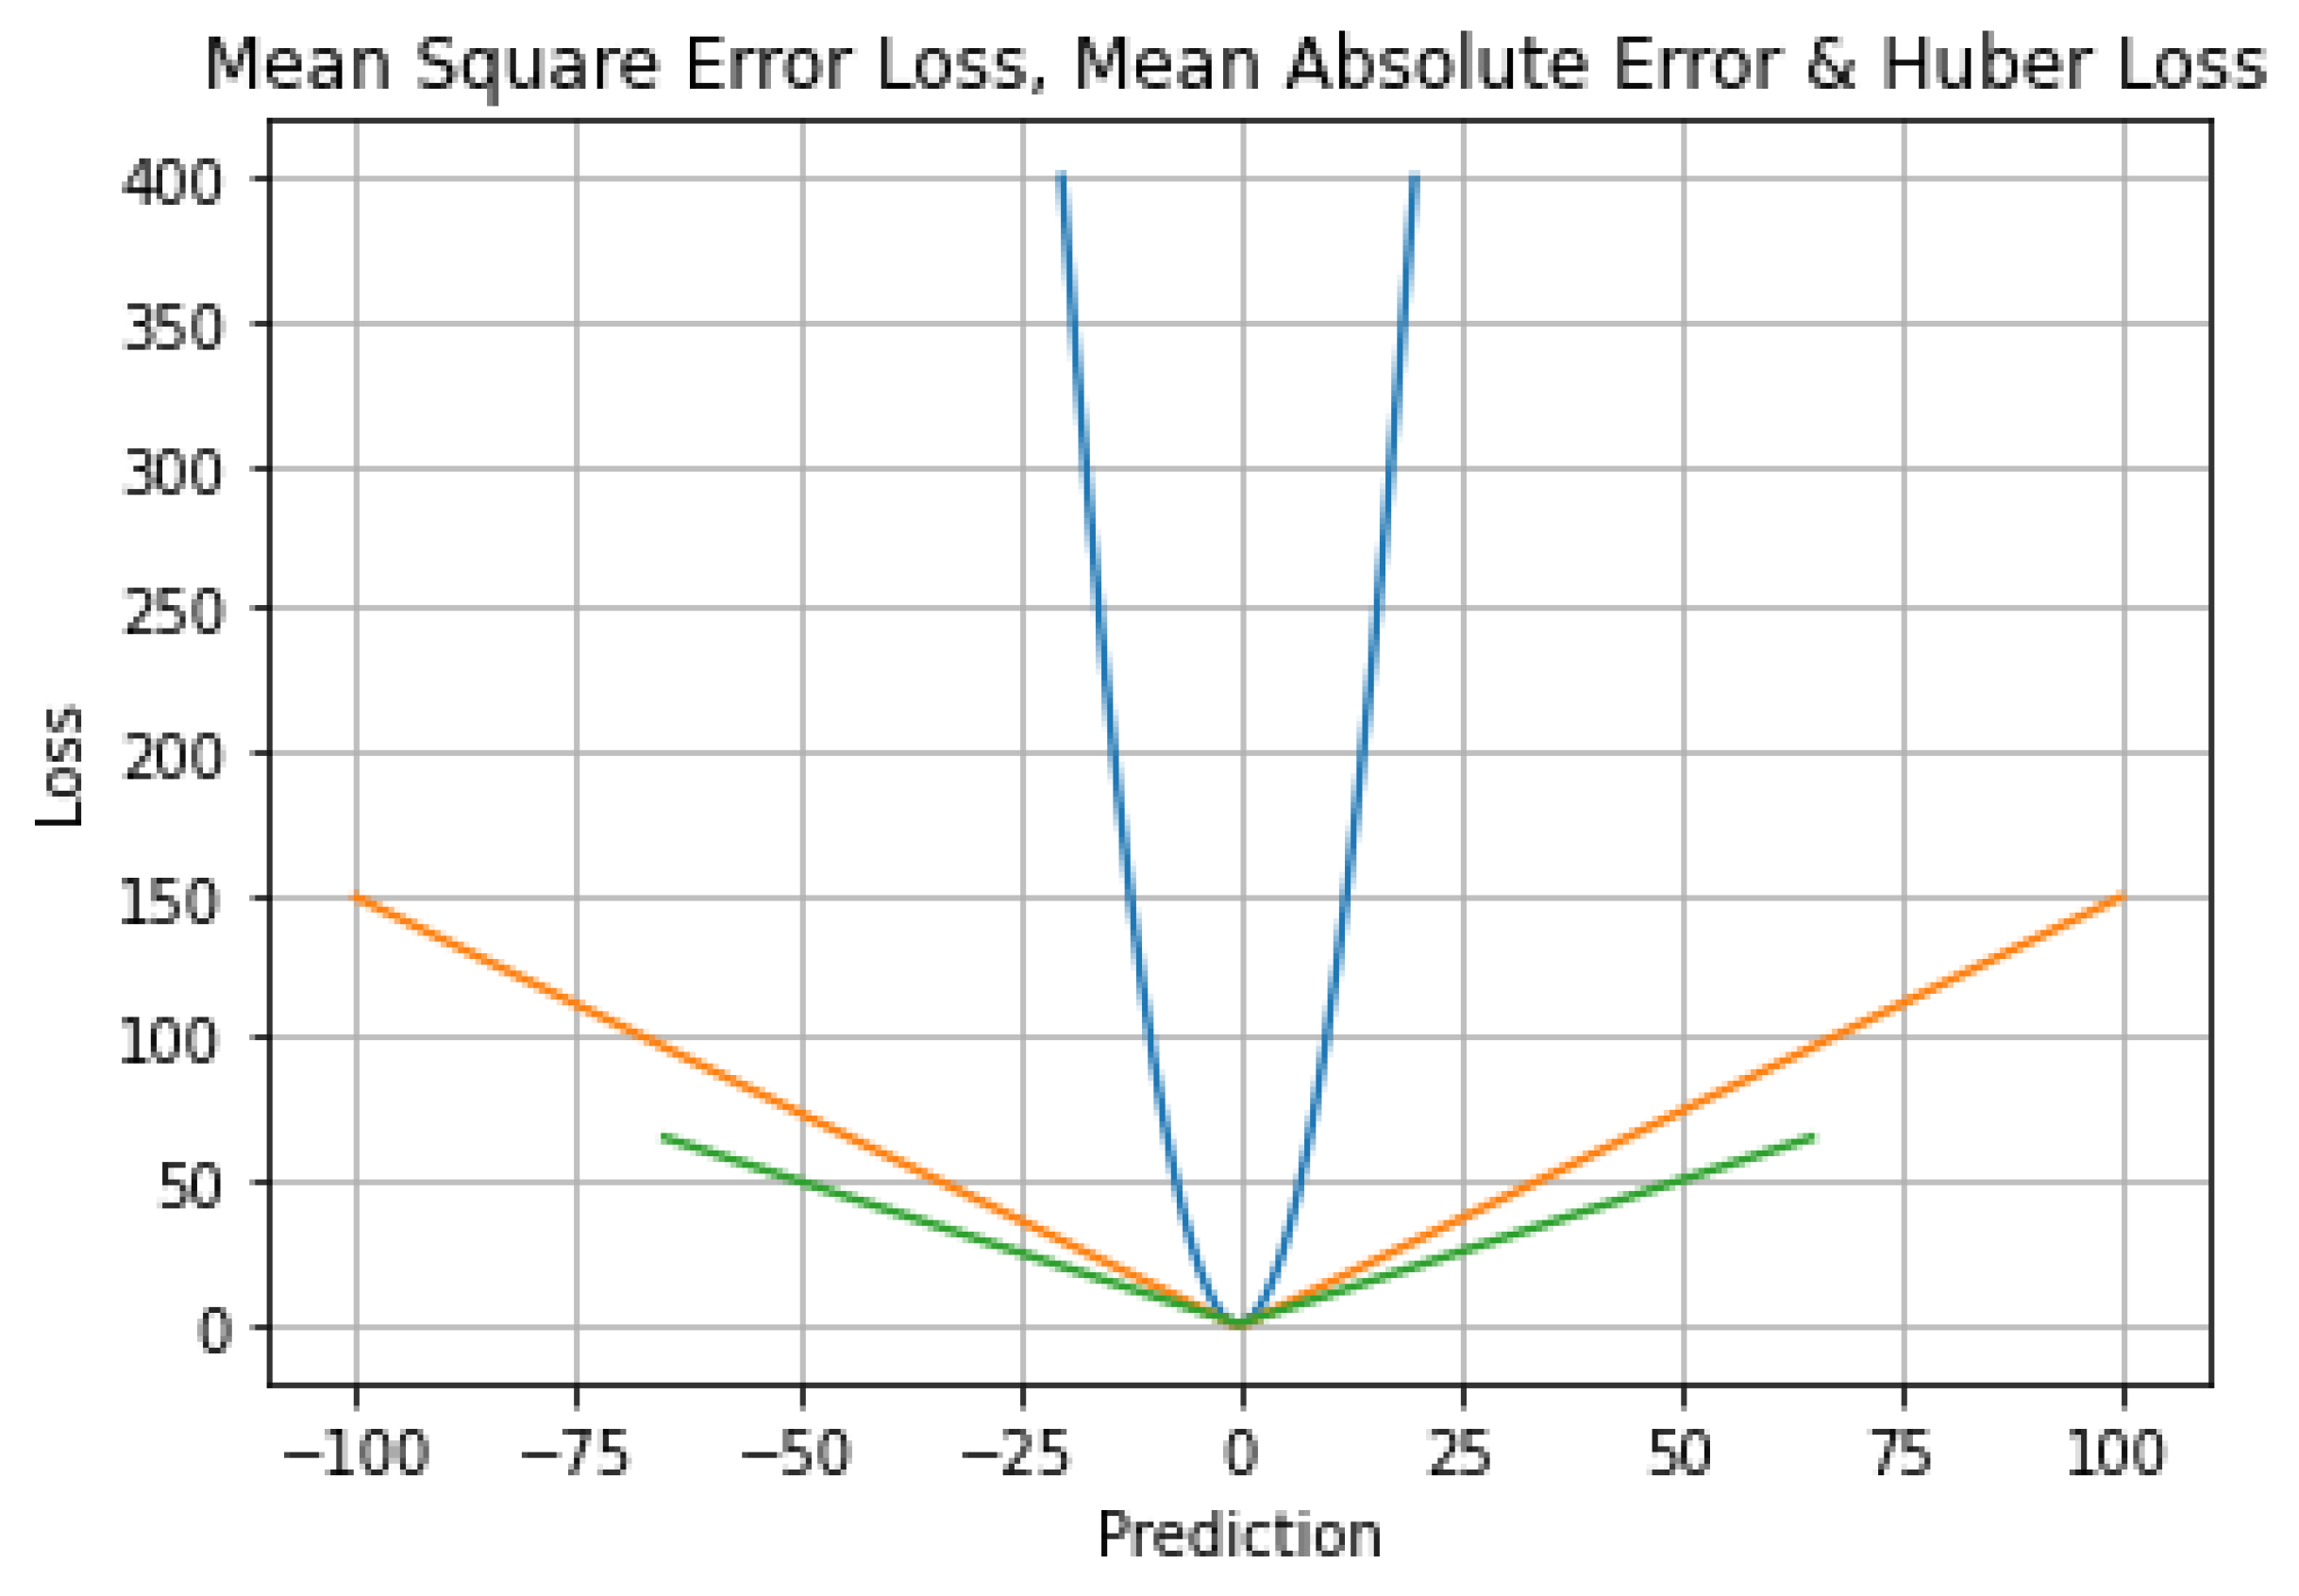
6.7. Mean Square Error Loss, Mean Absolute Error Loss & Huber Loss

Figure 9 represents the Huber Loss function with Mean Square Error Loss, Mean Absolute Error Loss can be seen at the side of the smoothness of a loss function curve [45]. This represents that there are fewer outliers available. The area under the curve is the smallest in MSE and the largest in MAE. The Huber Loss function is between the MSE and MAE represented with orange color [29,46].
Individual regression accuracies of Linear Regression, Lasso Regression, Ridge Regression, Decision Tree are 65%, 67%, 66%, 71%, respectively. Ensemble regression algorithms XGBoost, Gradient Boost, Adaboost, random Forest, Bagging Regressor give accuracies equal to 86%, 84.22%, 79%, 81%, 83.52%, 96.29%, respectively.

7. Conclusions

The FERMO algorithm delivers an accuracy, which is higher in comparison with all other individual regression algorithms and their combined versions, this accuracy is considerably higher than the approaches considered for the comparison of the performance. This enhancement is because the two unique features of the algorithm are: (i) load distribution amongst the regression algorithms and (ii) the identification of the weight factor. The validation mechanism used is exploring all types of possible losses in form of the regression. Even if there are any linear or non-linear losses, all of them are highlighted with this loss analysis. Minimum loss incurred in the process of the regression indicates maximum accuracy. The experiment proves that the accuracy is acceptable. The accuracy can be improvised by minimizing the precision loss, here training cannot be employed otherwise the model will suffer from overtraining and thus the values will be away from the gradient descent. Hence, balancing factors are used instead of further training the model.

Author Contributions

Conceptualization, M.G., R.J., S.J. and K.K. (Ketan Kotecha); methodology, S.P. (Suhas Patil); investigation, S.P. (Sharnil Pandya); resources, S.G., S.R. and A.K.; validation, M.S.; writing—original draft preparation, K.K. (Kalyani Kadam); writing—review and editing, A.K., M.S., S.P. (Suhas Patil) and M.G. All authors have read and agreed to the published version of the manuscript.

Funding

This research was funded by “Research Support Fund of Symbiosis International (Deemed University), Pune, Maharashtra, India”.

Institutional Review Board Statement

Not Applicable.

Informed Consent Statement

Not applicable.

Data Availability Statement

Dataset referred is open source: https://www.kaggle.com/datasets/stefanoleone992/rotten-tomatoes-movies-and-critic-reviews-dataset (accessed on 15 November 2021).

Conflicts of Interest

The authors declare no conflict of interest.

References

  1. Verma, P.K.; Agrawal, P.; Amorim, I.; Prodan, R. WELFake: Word Embedding Over Linguistic Features for Fake News Detection. IEEE Trans. Comput. Soc. Syst. 2021, 8, 881–893. [Google Scholar] [CrossRef]
  2. Kaushal, V.; Vemuri, K. Clickbait—Trust and Credibility of Digital News. IEEE Trans. Technol. Soc. 2021, 2, 146–154. [Google Scholar] [CrossRef]
  3. Zhou, C.; Li, K.; Lu, Y. Linguistic characteristics and the dissemination of misinformation in social media: The moderating effect of information richness. Inf. Process. Manag. 2021, 58, 102679. [Google Scholar] [CrossRef]
  4. Gehrau, V.; Fujarski, S.; Lorenz, H.; Schieb, C.; Blöbaum, B. The Impact of Health Information Exposure and Source Credibility on COVID-19 Vaccination Intention in Germany. Int. J. Environ. Res. Public Health 2021, 18, 4678. [Google Scholar] [CrossRef] [PubMed]
  5. Purba, K.R.; Asirvatham, D.; Murugesan, R.K. Instagram Post Popularity Trend Analysis and Prediction using Hashtag, Image Assessment, and User History Features. Int. Arab. J. Inf. Technol. 2021, 18, 85–94. [Google Scholar]
  6. Daowd, A.; Hasan, R.; Eldabi, T.; Rafiul-Shan, P.M.; Cao, D.; Kasemsarn, N. Factors affecting eWOM credibility, information adoption and purchase intention on Generation Y: A case from Thailand. J. Enterp. Inf. Manag. 2021, 34, 838–859. [Google Scholar] [CrossRef]
  7. Kaliyar, R.K.; Goswami, A.; Narang, P. FakeBERT: Fake news detection in social media with a BERT-based deep learning approach. Multimed. Tools Appl. 2021, 80, 11765–11788. [Google Scholar] [CrossRef]
  8. Zheng, Q.; Qu, S. Credibility Assessment of Mobile Social Networking Users Based on Relationship and Information Interactions: Evidence From China. IEEE Access 2020, 8, 99519–99527. [Google Scholar] [CrossRef]
  9. Flanagin, A.J.; Winter, S.; Metzger, M.J. Making sense of credibility in complex information environments: The role of message sidedness, information source, and thinking styles in credibility evaluation online. Inf. Commun. Soc. 2020, 23, 1038–1056. [Google Scholar] [CrossRef]
  10. Tully, M.; Vraga, E.K.; Bode, L. Designing and Testing News Literacy Messages for Social Media. Mass Commun. Soc. 2019, 23, 22–46. [Google Scholar] [CrossRef]
  11. Liu, B.F.; Austin, L.; Lee, Y.-I.; Jin, Y.; Kim, S. Telling the tale: The role of narratives in helping people respond to crises. J. Appl. Commun. Res. 2020, 48, 328–349. [Google Scholar] [CrossRef]
  12. Wu, H.C.; Greer, A.; Murphy, H. Perceived Stakeholder Information Credibility and Hazard Adjustments: A Case of Induced Seismic Activities in Oklahoma Information credibility, disaster risk perception and evacuation willingness of rural households in China. Nat. Hazards 2020, 103, 2865–2882. [Google Scholar]
  13. Setiawan, E.B.; Widyantoro, D.H.; Surendro, K. Participation and Information Credibility Assessment Measuring information credibility in social media using a combination of user profile and message content dimensions. Int. J. Electr. Comput. Eng. (IJECE) 2020, 10, 3537–3549. [Google Scholar] [CrossRef]
  14. Hu, S.; Kumar, A.; Al-Turjman, F.; Gupta, S.; Seth, S. Reviewer Credibility and Sentiment Analysis Based User Profile Modelling for Online Product Recommendation. Special Section on Cloud-Fog-edge computing in cyber-physical-social systems (CPSS). IEEE Access 2020, 8, 26172–26189. [Google Scholar] [CrossRef]
  15. Alsmadi, I.; O’Brien, M.J. How Many Bots in Russian Troll Tweets? Inf. Process. Manag. 2020, 57, 102303. [Google Scholar] [CrossRef]
  16. Li, H. Communication for Coproduction: Increasing Information Credibility to Fight the Coronavirus. Am. Rev. Public Adm. 2020, 50, 692–697. [Google Scholar] [CrossRef]
  17. Karande, H.; Walambe, R.; Benjamin, V.; Kotecha, K.; Raghu, T.S. Stance detection with BERT embeddings for credibility analysis of information on social media. PeerJ Comput. Sci. 2021, 7, e467. [Google Scholar] [CrossRef]
  18. Beldar, K.K.; Gayakwad, M.D.; Beldar, M.K. Optimizing Analytical Queries on Probabilistic Databases with Unmerged Duplicates Using MapReduce. Int. J. Innov. Res. Comput. Commun. Eng. 2016, 4, 9651–9659. [Google Scholar]
  19. Shah, A.A.; Ravana, S.D.; Hamid, S.; Ismail, M.A. Web Pages Credibility Scores for Improving Accuracy of Answers in Web-Based Question Answering Systems. IEEE Access 2020, 8, 141456–141471. [Google Scholar] [CrossRef]
  20. Gayakwad, M. VLAN implementation using IP over ATM. J. Eng. Res. Stud. 2011, 186–192. [Google Scholar]
  21. Shevale, K.; Bhole, G. Probabilistic Threshold Query on Uncertain Data using SVM. Int. J. Adv. Res. Comput. Sci. 2017, 8, 1967–1969. [Google Scholar]
  22. Keshavarz, H. Evaluating credibility of social media information: Current challenges, research directions and practical criteria. Inf. Discov. Deliv. 2020, 49, 269–279. [Google Scholar] [CrossRef]
  23. Faraon, M.; Jaff, A.; Nepomuceno, L.P.; Villavicencio, V. Fake News and Aggregated Credibility: Conceptualizing a Co-Creative Medium for Evaluation of Sources Online. Int. J. Ambient. Comput. Intell. 2020, 11, 93–117. [Google Scholar] [CrossRef]
  24. Yan, W.; Huang, J. Microblogging reposting mechanism: An information adoption perspective. Tsinghua Sci. Technol. 2014, 19, 531–542. [Google Scholar] [CrossRef]
  25. Mahmood, S.; Ghani, A.; Daud, A.; Shamshirband, S. Reputation-Based Approach Toward Web Content Credibility Analysis. IEEE Access 2019, 7, 139957–139969. [Google Scholar] [CrossRef]
  26. Liu, B.; Terlecky, P.; Bar-Noy, A.; Govindan, R.; Neely, M.J.; Rawitz, D. Optimizing information credibility in social swarming applications. IEEE Trans. Parallel Distrib. Syst. 2011, 23, 1147–1158. [Google Scholar] [CrossRef] [Green Version]
  27. Wu, D.; Fan, L.; Zhang, C.; Wang, H.; Wang, R. Dynamical Credibility Assessment of Privacy-Preserving Strategy for Opportunistic Mobile Crowd Sensing. Transl. Content Min. 2018, 6, 37430–37443. [Google Scholar] [CrossRef]
  28. Khan, J.; Lee, S. Implicit User Trust Modeling Based on User Attributes and Behavior in Online Social Networks. IEEE Access 2019, 7, 142826–142842. [Google Scholar] [CrossRef]
  29. Gayakwad, M.D.; Phulpagar, B.D. Research Article Review on Various Searching Methodologies and Comparative Analysis for Re-Ranking the Searched Results. Int. J. Recent Sci. Res. 2013, 4, 1817–1820. [Google Scholar]
  30. Liu, Y.; Xu, S. Detecting Rumors Through Modeling, Information Propagation Networks in a Social Media Environment. IEEE Trans. Comput. Soc. Syst. 2016, 3, 46–62. [Google Scholar] [CrossRef] [Green Version]
  31. Weng, J.; Shen, Z.; Miao, C.; Goh, A.; Leung, C. Credibility: How Agents Can Handle Unfair Third-Party Testimonies in Computational Trust Models. IEEE Trans. Knowl. Data Eng. 2009, 22, 1286–1298. [Google Scholar] [CrossRef]
  32. Alrubaian, M.; Al-Qurishi, M.; Alamri, A.; Al-Rakhami, M.; Hassan, M.M.; Fortino, G. Credibility in Online Social Networks: A Survey. IEEE Access 2018, 7, 2828–2855. [Google Scholar] [CrossRef]
  33. Beldar, K.K.; Gayakwad, M.D.; Bhattacharyya, D.; Kim, T.H. A Comparative Analysis on Contingence Structured Data Methodologies. Int. J. Softw. Eng. Its Appl. 2016, 10, 13–22. [Google Scholar] [CrossRef]
  34. Boukhari, M.; Gayakwad, M. An Experimental Technique on Fake News Detection in Online Social Media. Int. J. Innov. Technol. Explor. Eng. 2019, 8, 526–530. [Google Scholar]
  35. Sato, K.; Wang, J.; Cheng, Z. Credibility Evaluation of Twitter-Based Event Detection by a Mixing Analysis of Heterogeneous Data. IEEE Transl. Content Min. 2019, 7, 1095–1106. [Google Scholar] [CrossRef]
  36. Das, R.; Kamruzzaman, J.; Karmakar, G. Opinion Formation in Online Social Networks: Exploiting Predisposition, Interaction, and Credibility. IEEE Trans. Comput. Soc. Syst. 2019, 6, 554–566. [Google Scholar] [CrossRef]
  37. McKnight, H.; Kacmar, C. Factors of Information Credibility for an Internet Advice Site. In Proceedings of the 39th Annual Hawaii International Conference on System Sciences (HICSS’06), Kauai, HI, USA, 4–7 January 2006. [Google Scholar]
  38. Gayakwad, M.; Patil, S. Assessment of Source, Medium, and Intercommunication for Assessing the Credibility of Content. In Proceedings of the 2021 International Conference on Smart Generation Computing, Communication and Networking (SMART GENCON), Pune, India, 29–30 October 2021; pp. 1–5. [Google Scholar] [CrossRef]
  39. Kang, B.; Höllerer, H.; Turk, M.; Yan, X.; O’Donovan, J. Analysis of Credibility in Microblogs. Master’s Thesis, University of California, Santa Barbara, CA, USA, 2012. [Google Scholar]
  40. Gayakwad, M.I.L.I.N.D.; Patil, S. Content Modelling for unbiased information analysis. Libr. Philos. Pract. 2020, 1–17. [Google Scholar]
  41. Yan, J.; Zhou, Y.; Wang, S.; Li, J. To share or not to Share? Credibility and Dissemination of Electric Vehicle-Related Information on WeChat: A Moderated Dual-Process Model. IEEE Access 2019, 7, 46808–46821. [Google Scholar] [CrossRef]
  42. Organic Content Design. Available online: http://www.webxpedition.com/ (accessed on 9 November 2021).
  43. Gayakwad, M. Requirement Specific Search BDP. IJARCSSE 2013, 3, 121. [Google Scholar]
  44. Cai, Y.; Zhang, S.; Xia, H.; Fan, Y.; Zhang, H. A Privacy-Preserving Scheme for Interactive Messaging Over Online Social Networks. IEEE Internet Things J. 2020, 7, 6817–6827. [Google Scholar] [CrossRef]
  45. Topf, J. Introduction: Social Media and Medical Education Come of Age. Semin. Nephrol. 2020, 40, 247–248. [Google Scholar] [CrossRef]
  46. Mackiewicz, J.; Yeats, D. Product Review Users’ Perceptions of Review Quality: The Role of Credibility, Informativeness, and Readability. IEEE Trans. Dependable Secur. Comput. 2014, 57, 309–324. [Google Scholar] [CrossRef]
Figure 2. Data flow diagram FERMO algorithm.
Asi 05 00043 g002
Figure 3. Mean Squared Error (MSE)—MR.
Asi 05 00043 g003
Figure 4. Mean Absolute Error (MAE).
Asi 05 00043 g004
Figure 5. Huber loss.
Asi 05 00043 g005
Figure 6. Mean Square Error loss & Mean Absolute Error loss.
Asi 05 00043 g006
Figure 7. Mean Square Error Loss & Huber loss.
Asi 05 00043 g007
Figure 8. Mean Absolute Error loss & Huber loss.
Asi 05 00043 g008
Figure 9. Mean Square Error loss, Mean Absolute Error loss & Huber loss.
Asi 05 00043 g009
Table 1. Summary of Missing Values.
Included Excluded Total
nPercentnPercentnPercent
Review_Score1,130,017100%00%1,130,017100%
Table 2. Case processing summary (IBM SPSS).
VariablesCasesValues
Incomplete Data000
Complete Data1001,130,0173,390,051
Table 3. Feature analysis of rotten tomatoes movie review (Data Source—Kaggle.com (accessed on 15 November 2021).
FeaturesData
Type
CategoricalNumerical
Direct
Derived
LINKStringNoNoNo
REVIEWStringNoNoNo
TOP_CRITIQUEBooleanYesYesNo
PUBLISHERStringNoNoNo
REVIEW_TYPEBooleanYesNoYes
REVIEW_DATEDateNoNoNo
REVIEW_SCOREFloatYesYesYes
CRITIQUE_NAMEStringNoNoNo
Table 4. Statistical analysis of features of rotten tomatoes movie review.
FeaturesMinMaxMeanStd Dev
LINK55617,992445167
REVIEW010.6880.233
TOP_CRITIQUE2120.6610.365
PUBLISHER010.5980.457
REVIEW_TYPE252316227123
REVIEW_DATE110.8560.036
REVIEW_SCORE111Yes
CRITIQUE_NAME110.775No
Table 5. Individual regression algorithm at level zero (L-0).
Sr. No.AlgorithmAccuracy in %
1Linear Regression65
2Lasso Regression67
3Ridge Regression66
4Decision Tree71
Table 6. Ensemble regression algorithm at level zero (L-1).
Sr. No.AlgorithmAccuracy in %
1XGBoost86
2Gradient Boost84.22
3Adaboost Regressor79
4Random Forest81
5Bagging Regressor83.52
6FERMO96.29
Publisher’s Note: MDPI stays neutral with regard to jurisdictional claims in published maps and institutional affiliations.

