1. Introduction
Rice is the primary food source on Java Island, Indonesia. Even though Indonesia has a large amount of agriculture, its rice supply is still import dependent. The government lacks the ability to maintain food security, and investments in agriculture are still small. A shortage of rice supply may lead to a national stability problem [
1]. Most of the shortage issues are caused by poor post-harvest rice management, affecting the quality of rice and reducing its durability [
2].
Rojolele is a variety of rice from Delanggu Village. It is fragrant, has big grains, is bright white in color, and has a soft texture when cooked. The name Rojolele is derived from its taste and texture, which people found to be the best amongst all varieties of rice in Indonesia. However, this variety of rice is more expensive than the others because the post-harvest product management is complex and the crop is more vulnerable to pest attacks, since its fragrance attracts planthoppers and sparrows.
Most farmers consider the pest issue to be the main reason to refuse planting Rojolele in their rice fields. In addition, Rojolele takes 6 months to be fully grown, whereas the regular variety of rice only takes 3 months to grow. Thus, the popularity of Rojolele has been declining since 1968.
On November 2020, BATAN (the government organization for nuclear power) entrusted GMO Rojolele rice to the local farming community. This Rojolele rice takes 3.5 months to be fully grown and is more durable against pest attacks. The farming community accepted this offer but decided to use organic production without pesticides and artificial fertilizers. They decided to install UVUS technology assembled by the startup Ecokarsa for pest control. The UVUS is a solar-powered, adjustable ultraviolet and ultrasonic pest controller. Solar panels are very suitable for use in Indonesia because of the abundant sunlight from morning to evening, so innovations using solar power should be especially encouraged [
3]. The ultraviolet light attracts insects, including planthoppers [
4]; then, they can be trapped inside special vials. In addition, a certain frequency of ultrasonic sound dispels sparrows [
5]. Universities are expected to be able to take over the process of developing technology of this kind and innovating, which should accelerate the innovation and development of such products so that they can enter the market quickly [
6].
Every business requires efficient supply-chain design [
7]. If there are too many UVUS, then the investment cost will be higher than it should be. On the other hand, the number of UVUS is directly proportional to the coverage area, in which losses caused by pest infestation are prevented. We designed a supply chain model to determine the optimal locations of UVUS on a rice field. The solution of this model provides the number of UVUS needed and their coordinates, to maximize the profits of the system.
This research considers three aspects of sustainability: economic, environmental, and social [
8]. Sustainability is an interesting topic in both research and business [
9]. It describes the goal of satisfying present demands without sacrificing future generations [
10]. Mixed-integer linear programming (MILP) was proposed to solve problems in which the variables of sustainability are constrained to be integers, while other variables are allowed to be non-integers.
The environmental aspect of sustainability is determined by the reduction in carbon emissions. This research compares the amount of carbon emissions produced by conventionally powered and solar-powered UVUS. The social aspect of UVUS installment represents the perceptions of the farming community: how they perceive and use the technology. Most of these farmers are not used to modern agricultural technology. Thus, their perceptions were analyzed. For the economic aspect, this research presents the net present value (NVP) and break-even point (BEP) to avoid the risk of losses and simplify the investment planning [
11].
Table 1 describes the state of the art of this research.
2. Materials and Methods
2.1. Data Collection
The process of collecting data was based on the
Table 2. We used direct observation, interviews, and a questionnaire. This process was carried out from December 2020 to October 2021 in Delanggu Village, Delanggu District, Klaten City, Jawa Tengah Province, Indonesia.
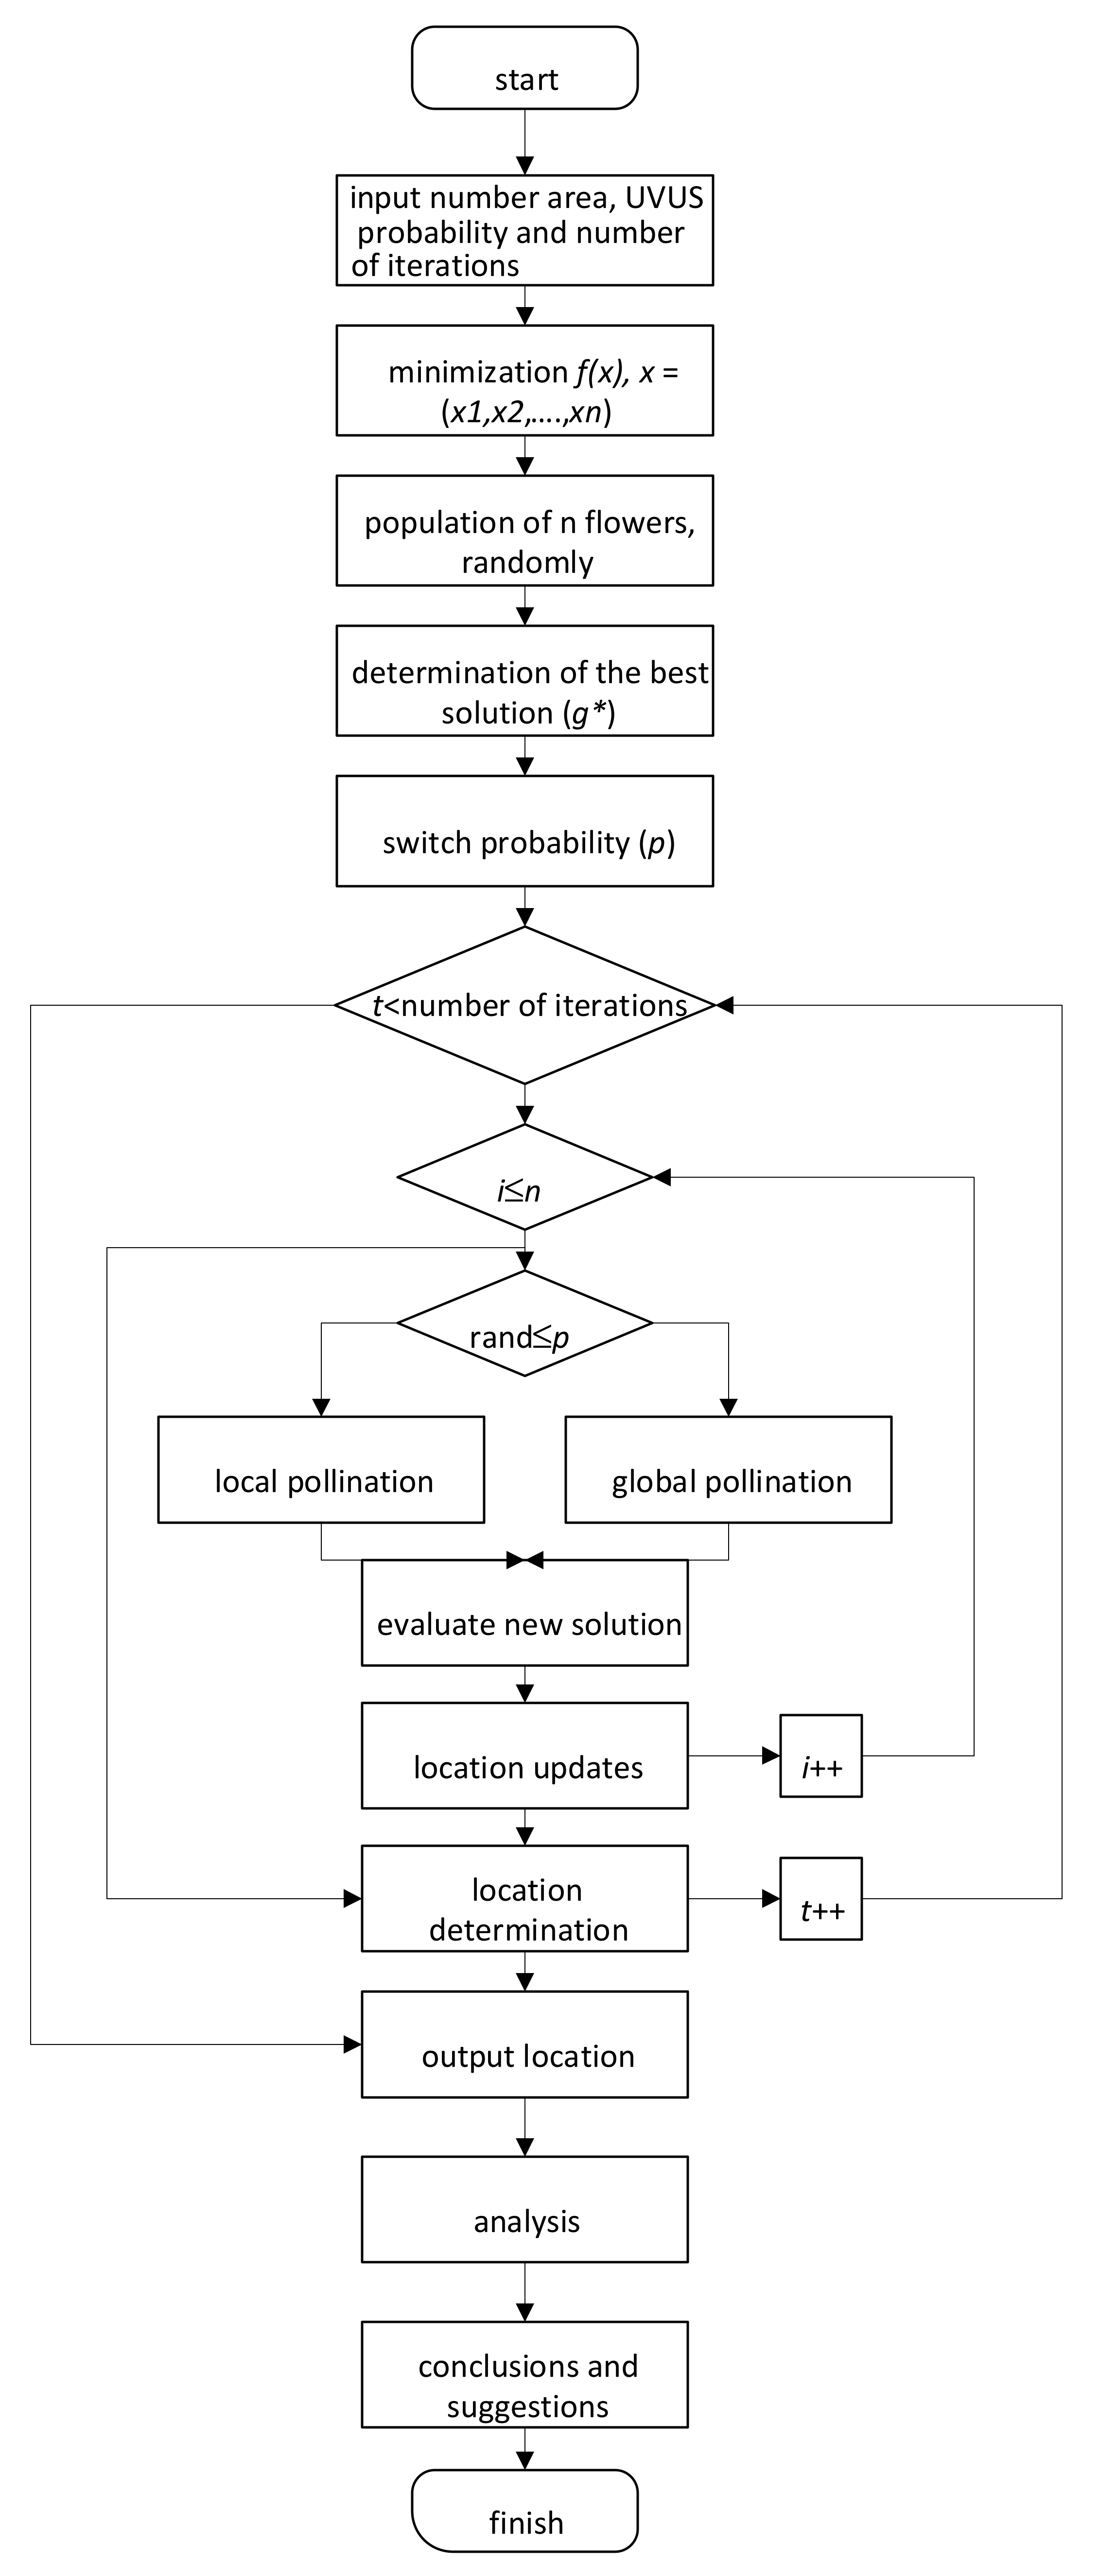
2.2. Flower Pollination Algorithm (FPA)
We used image processing to identify the rice field’s coordinates. Then, we determined some coordinates on the map for installing some UVUS, and each tool was considered to cover some area of the map. The FPA was used to change the locations of UVUS such that the area uncovered by UVUS was the minimum. Location assignment is part of the real-world problem of warehouse operation, which is considered an optimization problem [
19]. FPA shows better performance than other metaheuristic algorithms. Since FPA was found, there are many variants that established this method to solve complex problems in different research domains [
20]. FPA performs well on single-objective problem examples but still shows inefficiencies in the number of function evaluations [
21].
In 2012, Xin-She [
22] suggested an algorithm that is inspired by flower pollination by bees. There are two types of pollination: local pollination and global pollination. Local pollination occurs when the pollen of a flower fertilizes the buds of its own flower, whereas global pollination involves other flowers. The FPA is based on those modes of pollination, and it is represented in
Figure 1. Local or global pollination is determined by the switching probability. This number indicates the probability of a bee switching to another flower to enable global pollination or staying with the same flower to perform local pollination.
Let n be the number of initial UVUS in the system; then, , i = 1, 2, …, n represents the axis from the i-th UVUS coordinate for t-th iteration(s). The objective of FPA is to determine for every UVUS based on its pollination type, such that they will cover as large an area as possible.
Equation (1) is used to set new UVUS coordinates for the local pollination in FPA:
In Equation (1), the value of ε is a random number between 0 and 1 to determine the new coordinates of the i-th UVUS based on the coordinates of two other UVUS—i.e., the j-th UVUS and the k-th UVUS. Thus, there must be at least three UVUS to perform this simulation.
Equation (2) is used to set new coordinates for an UVUS for global pollination in the FPA:
In Equation (2), the value of represents the flight distance; it is derived from the Levy distribution function. is the present best solution available amongst the possible populations (case scenarios).
The optimum function in FPA to determine its solution is in (3).
where
Z: the optimum value.
n: the area of rice field, represented by the pixels of the rice field map.
: the m-th point in the rice field, m = 1,2,…,n.
b: the nearest UVUS to .
r: the radius of UVUS tools.
k: the number of UVUS tools.
d(,b): the distance between and b.
We used the Euclidean distance formula in (4) to determine the distance between two points.
where
: the axis of the coordinate’s location.
: the axis of the coordinate’s location.
: the ordinate of the coordinate’s location.
: the ordinate of the coordinate’s location.
2.3. The FPA Simulation
To determine the optimum coordinates for UVUS tools, we chose three initial populations. These were used to find the best solution for the area covered by UVUS. The initial coordinates for 3–5 UVUS tools are shown in
Table 3,
Table 4 and
Table 5, respectively.
2.4. The Sustainability of UVUS Installation
The development of UVUS began with the problems of farmers in Delanggu who needed technological assistance for the cultivation of Rojolele rice varieties. The development of UVUS and the recommendation of solar panels came about in answer to the reliable and economically attractive climate-smart sustainable agricultural technology solution, and modernly [
23]. The use of solar panels in different and innovative ways in the industry is on the rise, and this technology is easier to access than ever [
24]. This system is called the Agro-photovoltaic system. This system is attractive to the agricultural industry because it can generate electricity and crops on the same farm [
25].
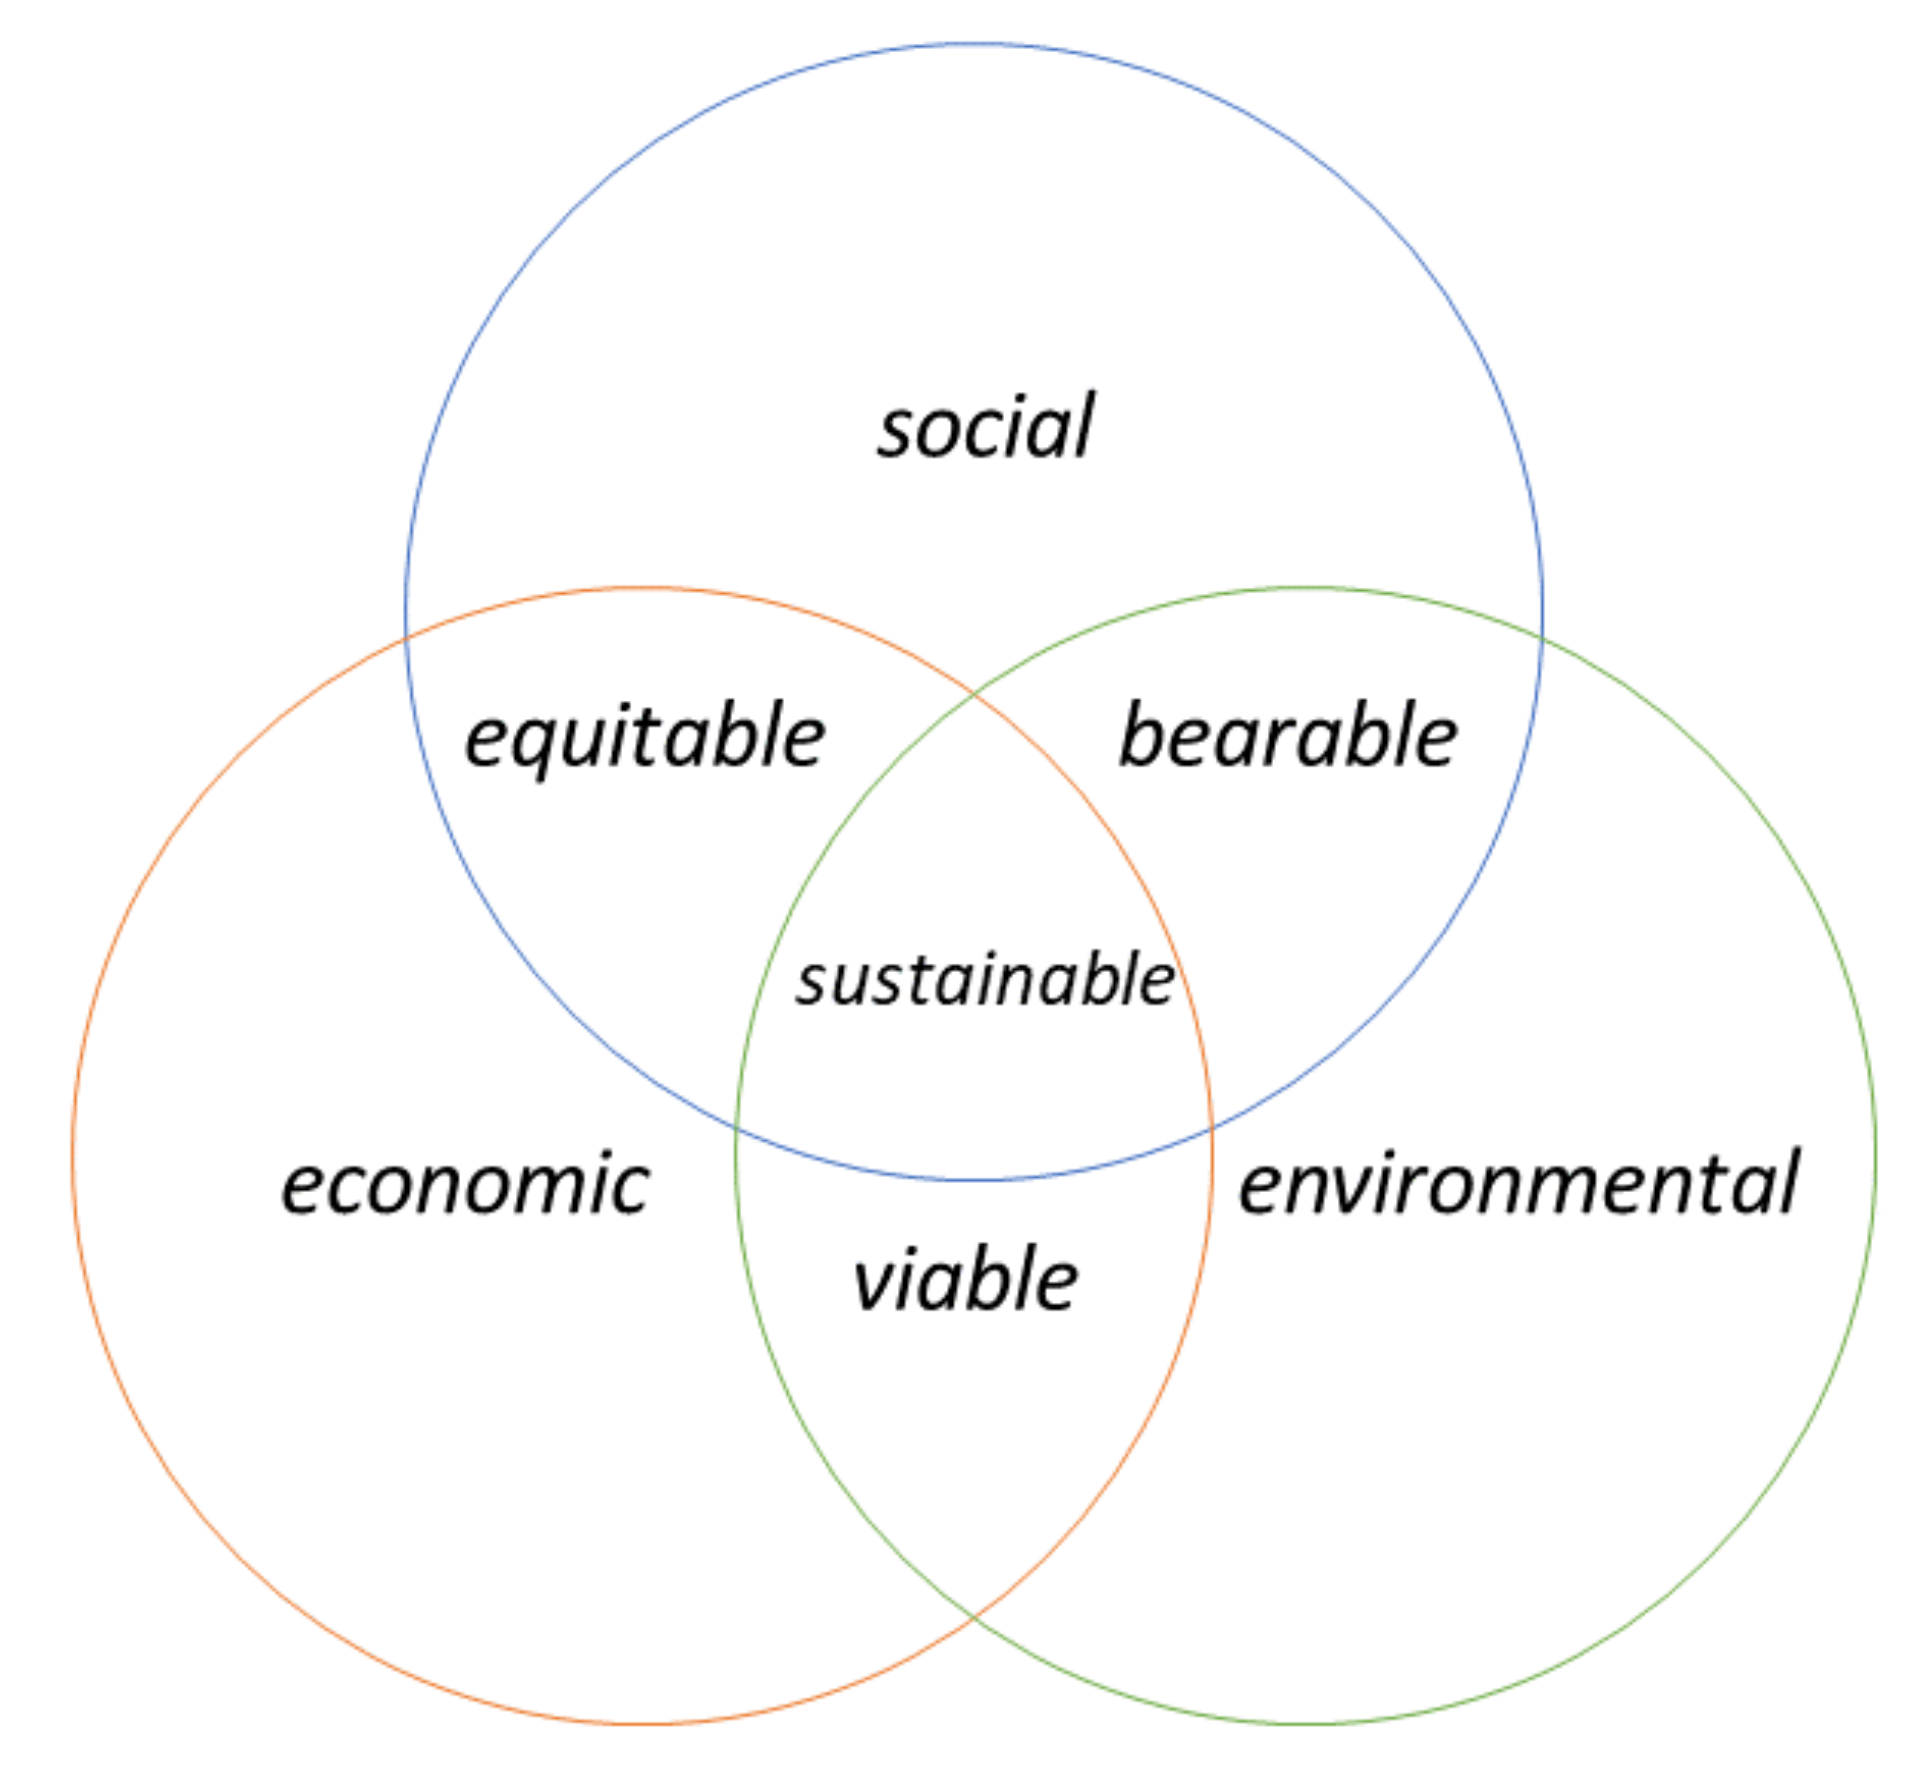
The Triple-Bottom-Line (TBL) by Elkington [
26] is the earliest concept of sustainability. It considers the 3 Ps: people, planet, and profit. Later, this concept was derived into three practical dimensions for the sustainability of a system [
27,
28,
29], as presented in
Figure 2.
We used the approach by Chabowski et al. [
30] to formulate the influences on the sustainability of the model. The influence diagram is shown in
Figure 3.
The formula for sustainability, based on
Figure 3, is in Equation (5).
where
: revenue of the sales, the economic portion in CSA.
: revenue of the sales, the social portion in the CSA.
: revenue of the sales, the environmental portion in CSA.
: economic cost—the total required for rice production and UVUS investment.
: social cost—the cost of managing festivals and maintaining relations with local farmers.
: environmental cost—the cost of buying pesticide for the area uncovered by UVUS.
3. Results
3.1. Economic Results
The results were obtained using the algorithm in
Figure 2 and the data in
Table 3,
Table 4 and
Table 5, respectively. Ultraviolet radiation from UVUS using an acoustic device successfully traps insect pests that exhibit phonotaxis or other orientation behaviors, including mosquitoes, sparrows, mice, and cockroaches with various waves [
31].
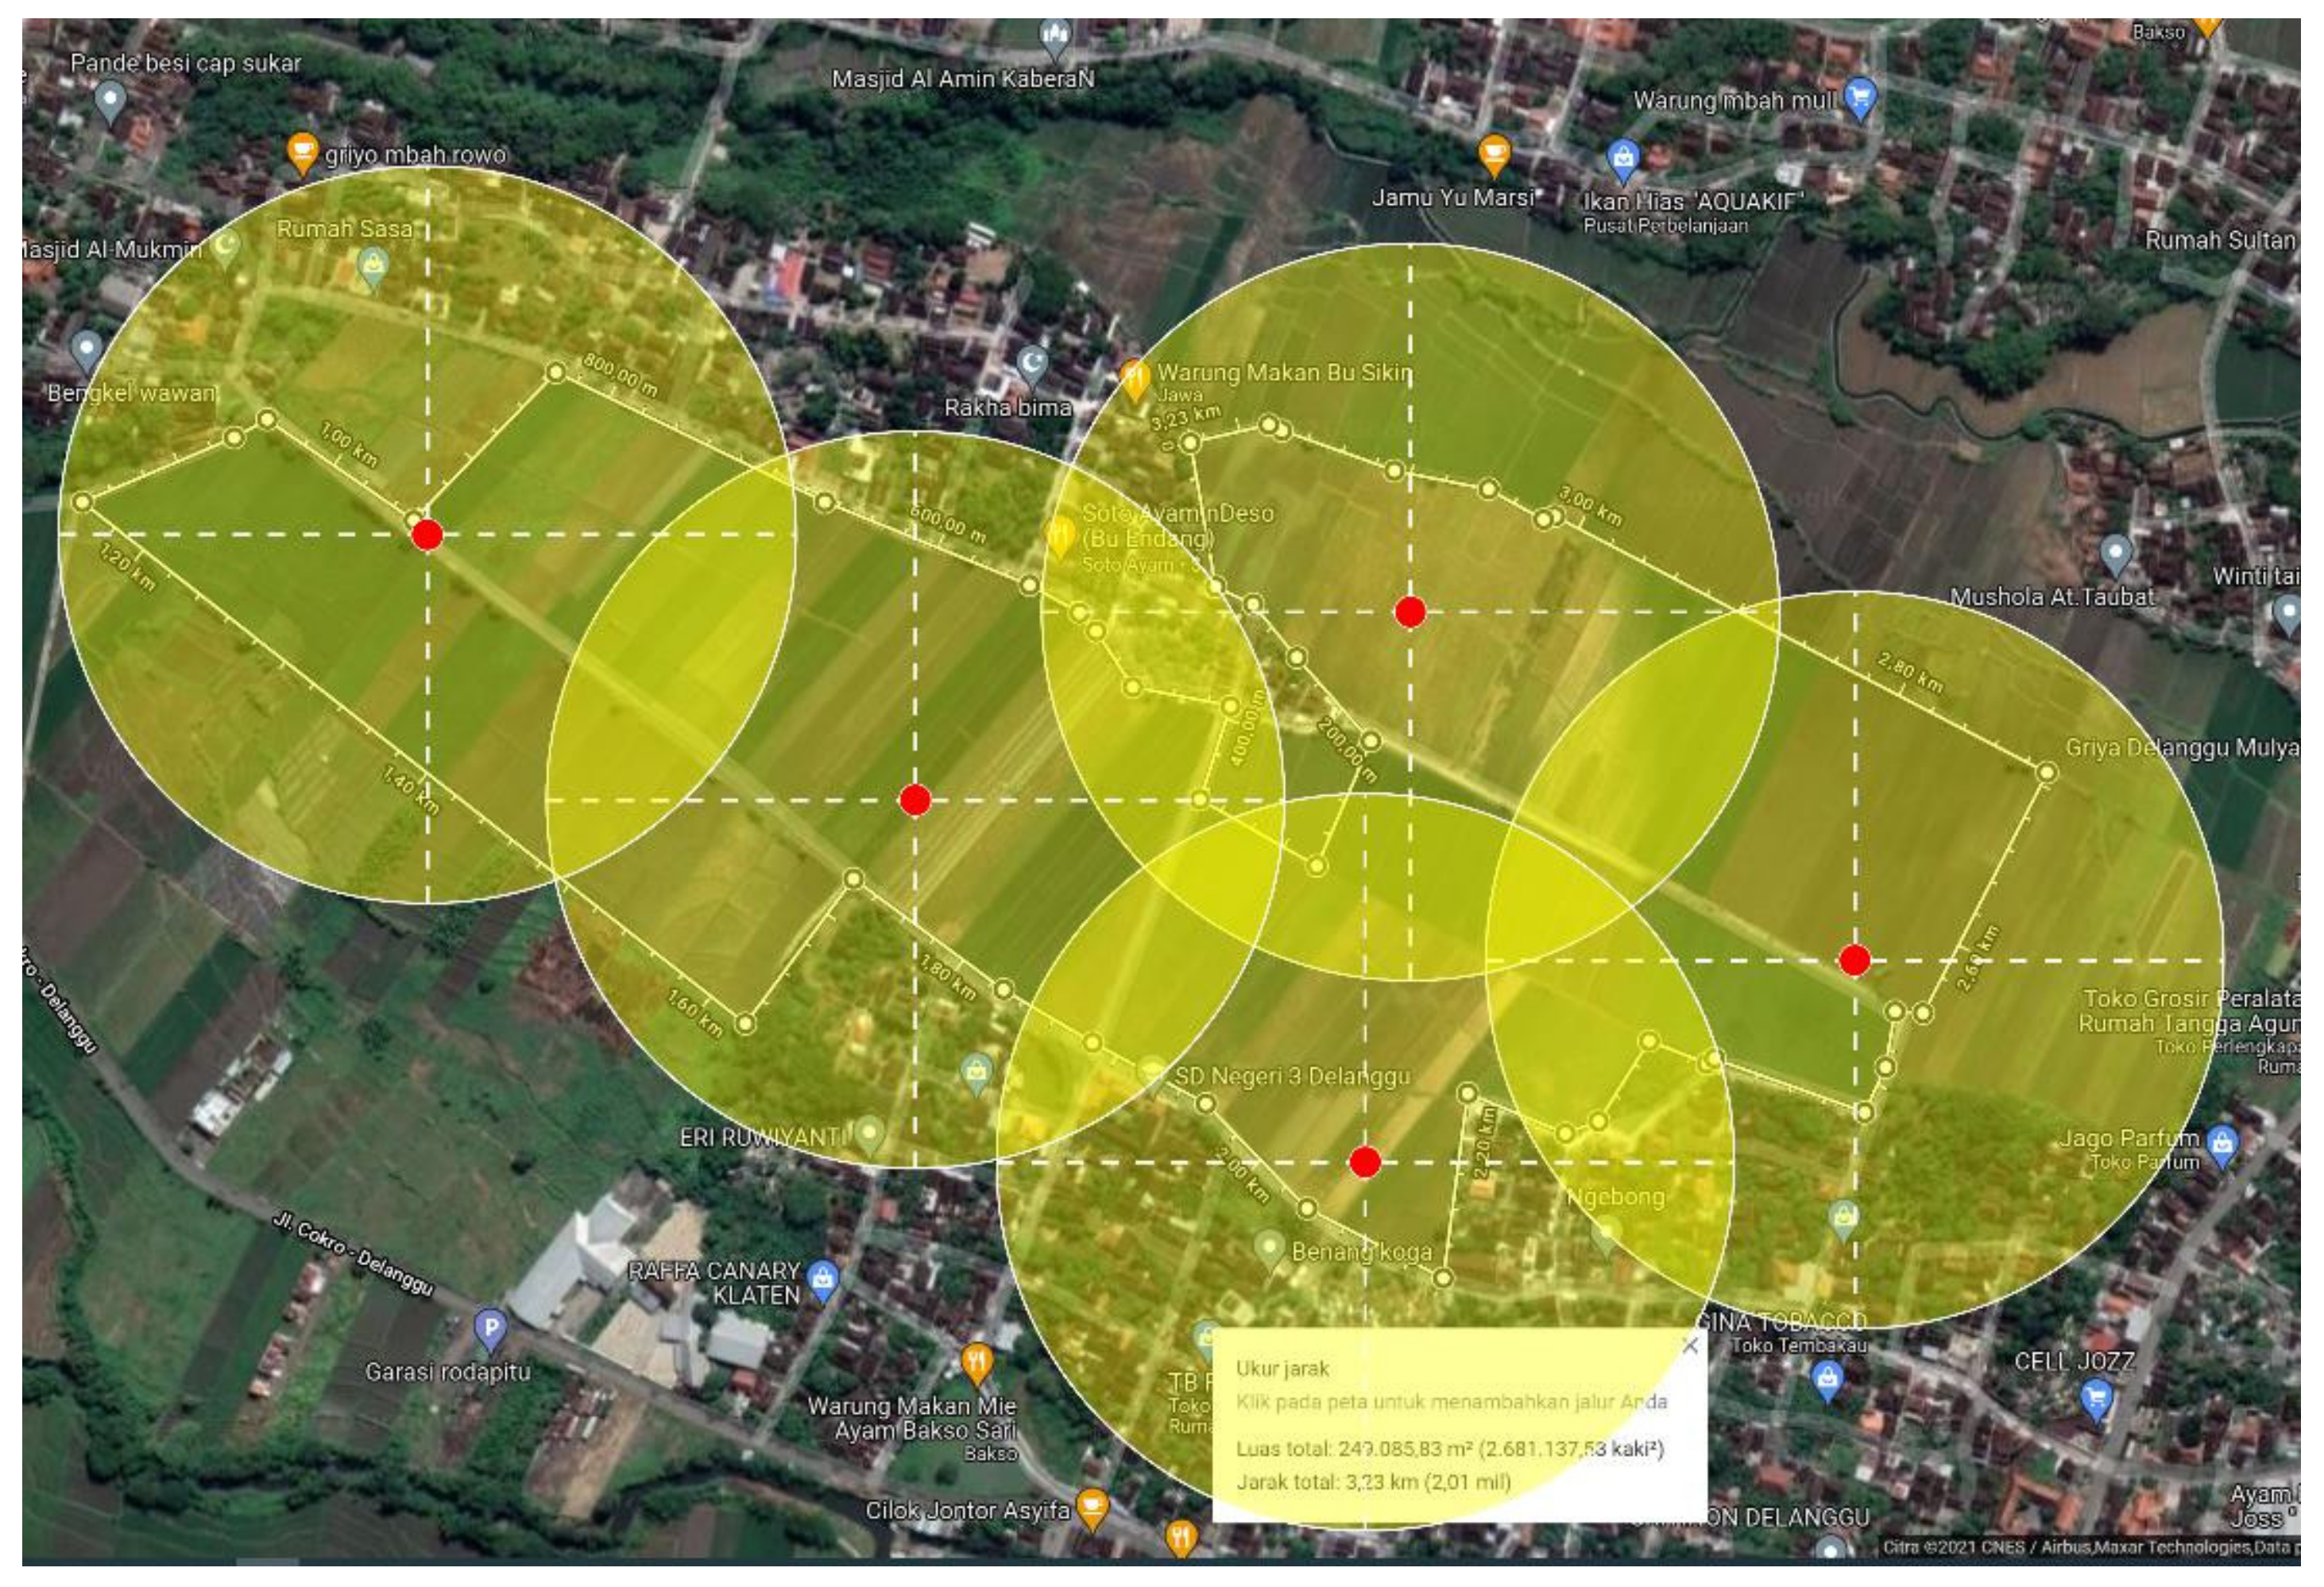
Table 6 shows the comparison of the results to reveal the optimum solution. These results were obtained by plugging the optimum solution for each scenario into Equation (5).
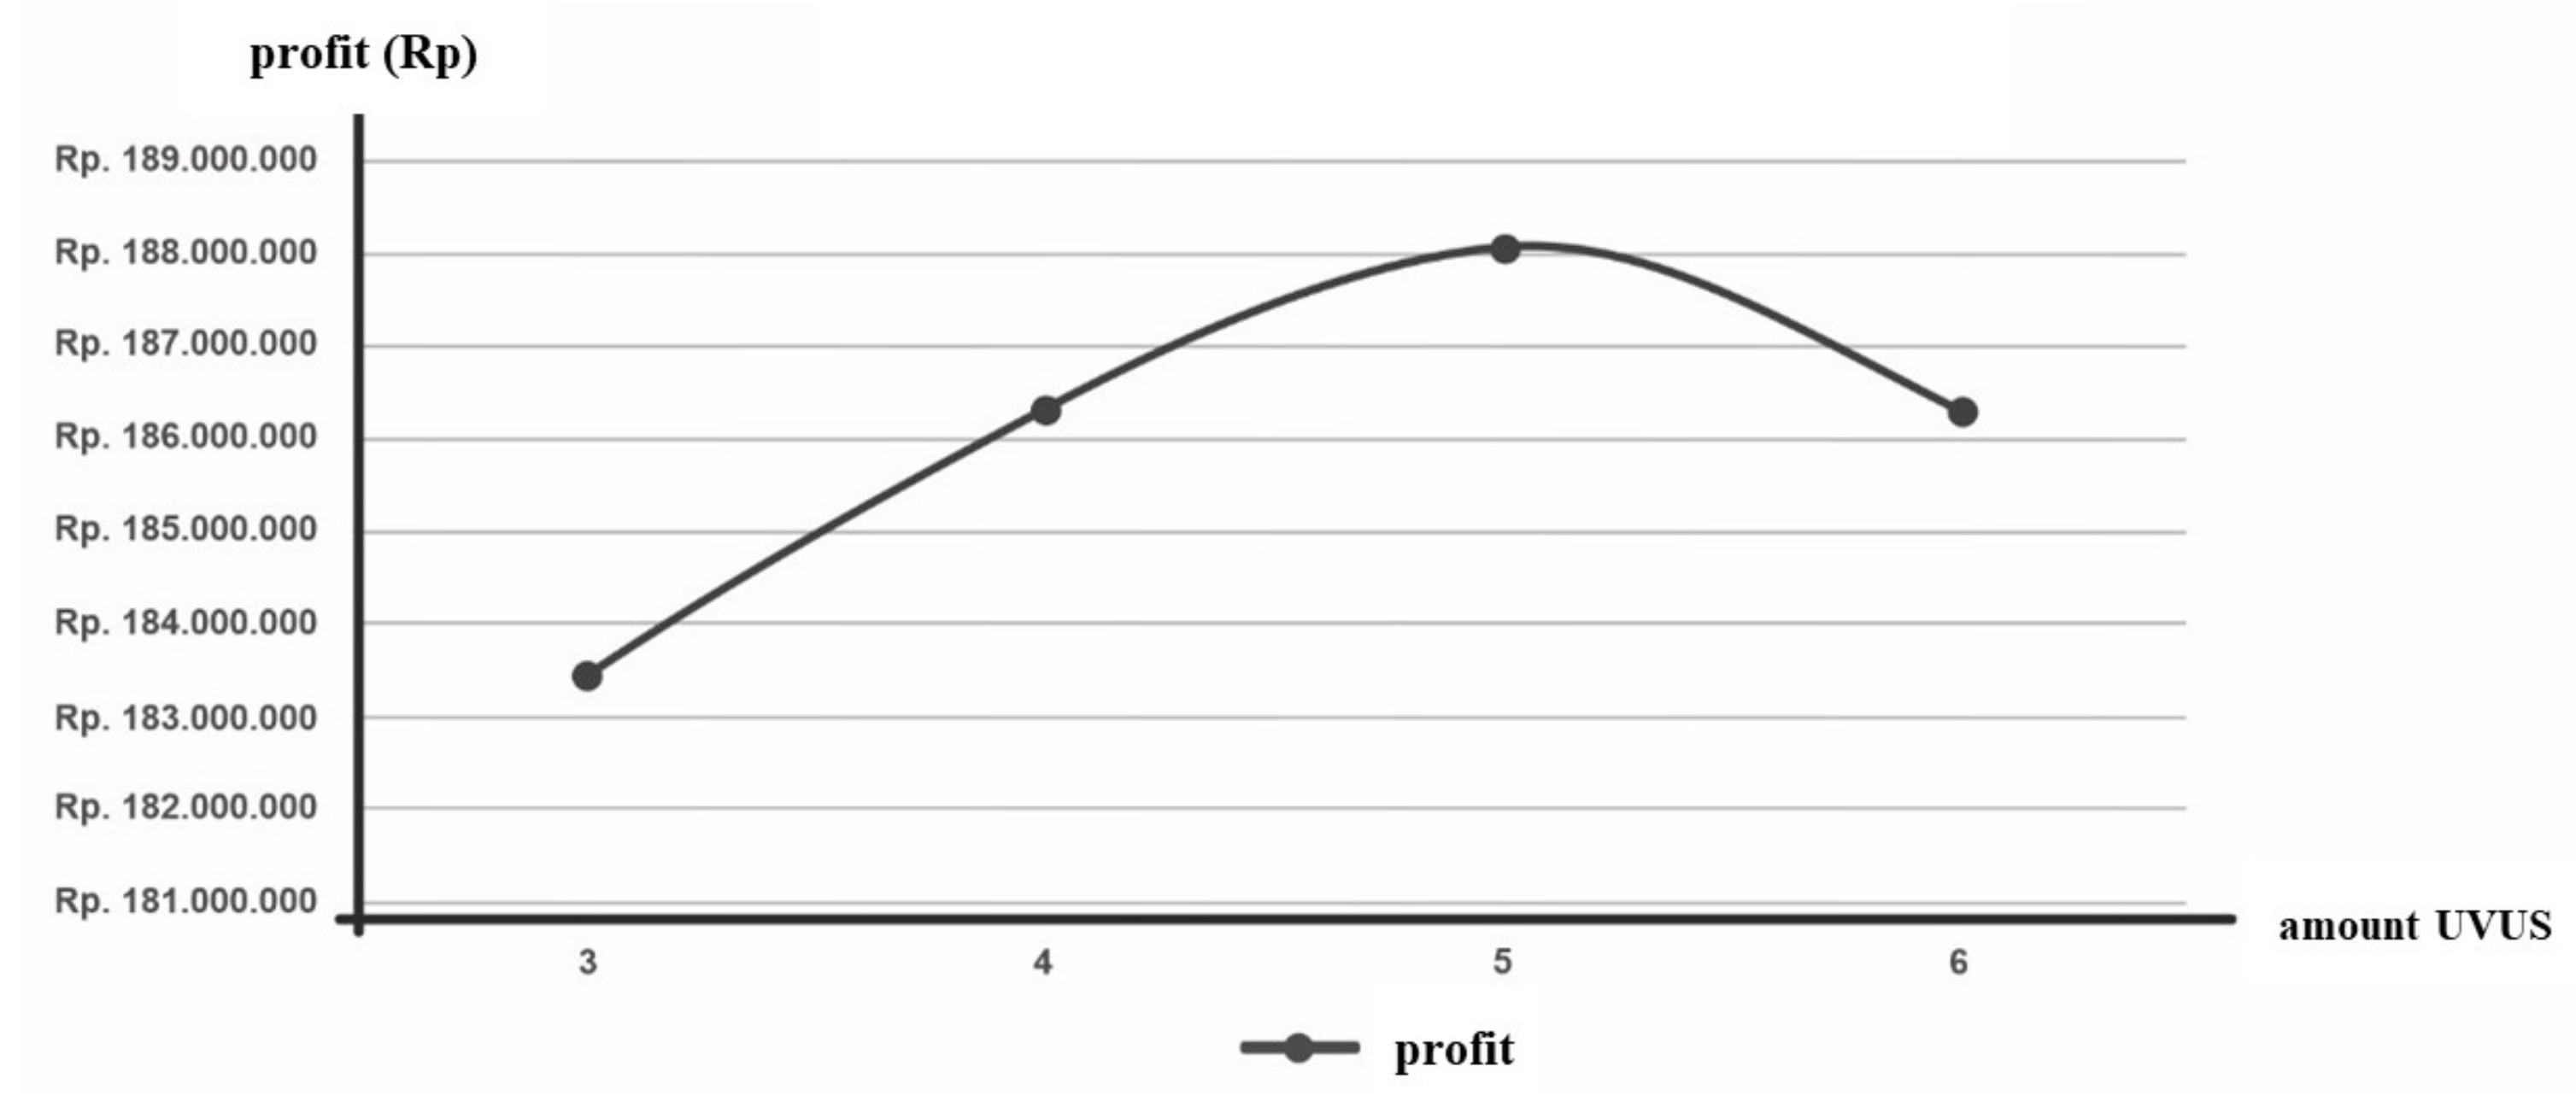
Table 6 shows that the maximum profits are obtained with five UVUS. A representation of the best scenario overlaid on a satellite image is shown in
Figure 4.
3.2. Environment Results
To reduce the carbon emissions, installing solar panels of 20 WP for each UVUS was performed. The data obtained are as follows:
| Energy produced | 20 WP × optimum time |
| | 20 WP × 5 p/h |
| | 0.1 kWh |
| Carbon Emission Factor | 0.877 kg CO2/kWh |
| GWP CO2 Value | 1 |
From these data, it can be concluded that the carbon reduction results from UVUS are: 0.1 kWh × 0.877 kg CO2/kWh × 1 × 5 tools × 30 days = 13,155 kg CO2. Thus, it can be concluded that the emission reduction that can be achieved for five UVUS units for a month is 13,155 kg of CO2.
3.3. Social Results
The social success of this study lay in the recognition of this solution’s usefulness by farmers and the application of the technology, which was installed by the Ecokarsa startup in the Delanggu rice fields. We distributed questionnaires to the farmers involved. It is hoped that the existence of UVUS will prompt farmer groups, assisted by Sanggar Rojolele, to start shifting from conventional agriculture to modern agriculture. The results of the questionnaire show that of the 30 farmers in the Sanggar Rojolele farmer group, 22 farmers understand the use and performance of UVUS very well thanks to a willingness to learn. Five farmers felt good about UVUS while only understanding its function, and did not study further because of their age. Three farmers felt bad about UVUS, because they felt that the implementation of UVUS is still dangerous in rice fields, fearing that ultrasonic waves disturb other types of pests.
Meanwhile, regarding the impacts of UVUS, 26 farmers achieved very good results with UVUS because they did not need to buy and apply inorganic pesticides on their land regularly, they did not need to rent nets to anticipate attacks from sparrows, and environmental impacts that result in the arrival of rice eels were avoided. One farmer said that he was pleased because he felt that he would not need to rent and install nets in his fields, saving him energy and time. The remaining three farmers did not see any impacts because they felt that the UVUS were not installed optimally.
4. Discussion
4.1. Product Design and Product Installation
At this stage, we should mention the product design. The design ideas were influenced by cost, because with UVUS, it is hoped that farmers in Indonesia can be helped economically by providing a means of reducing the costs of rice production through cheaper control of leafhoppers and sparrows. The product is environmentally friendly, because UVUS is expected to reduce the use of pesticides, which can reduce the level of soil fertility in rice fields and are unhealthy. The product has a social impact, because it is expected to stimulate the acquisition of new knowledge about technological developments and make farmers want to learn about renewable agricultural technologies.
UVUS is considered safe because it uses a low voltage, so the current is also low and safer than PLN electricity. The ultrasonic frequencies can also be said to be friendly to humans because the ultrasonic frequencies released by UVUS cannot be heard by human ears; they are above the threshold of human hearing.
The installation of UVUS products was carried out in the Delanggu rice fields using a social approach: we used a farming festival event and introduced UVUS slowly, taking the time needed to strengthen the narrative about the benefits of an environmentally friendly agricultural system. Many farmers are elderly and find it difficult to understand agricultural technology, so a social approach was important for the UVUS installation process. It is hoped farmers will operate UVUS independently with maintenance assistance by the UVUS manufacturer.
We explained the possible negative impacts of UVUS, such as pests being forced to nearby places to look for food. To address that problem, there needs to be an allocation of food for these pests that are not driven completely away by the UVUS. The ultrasonic frequency issued by UVUS may also be ineffective, because the sparrows who initially felt uncomfortable were becoming used to the ultrasonic sound, but further research is needed on this.
4.2. The Effect of Location Allocation on Harvest
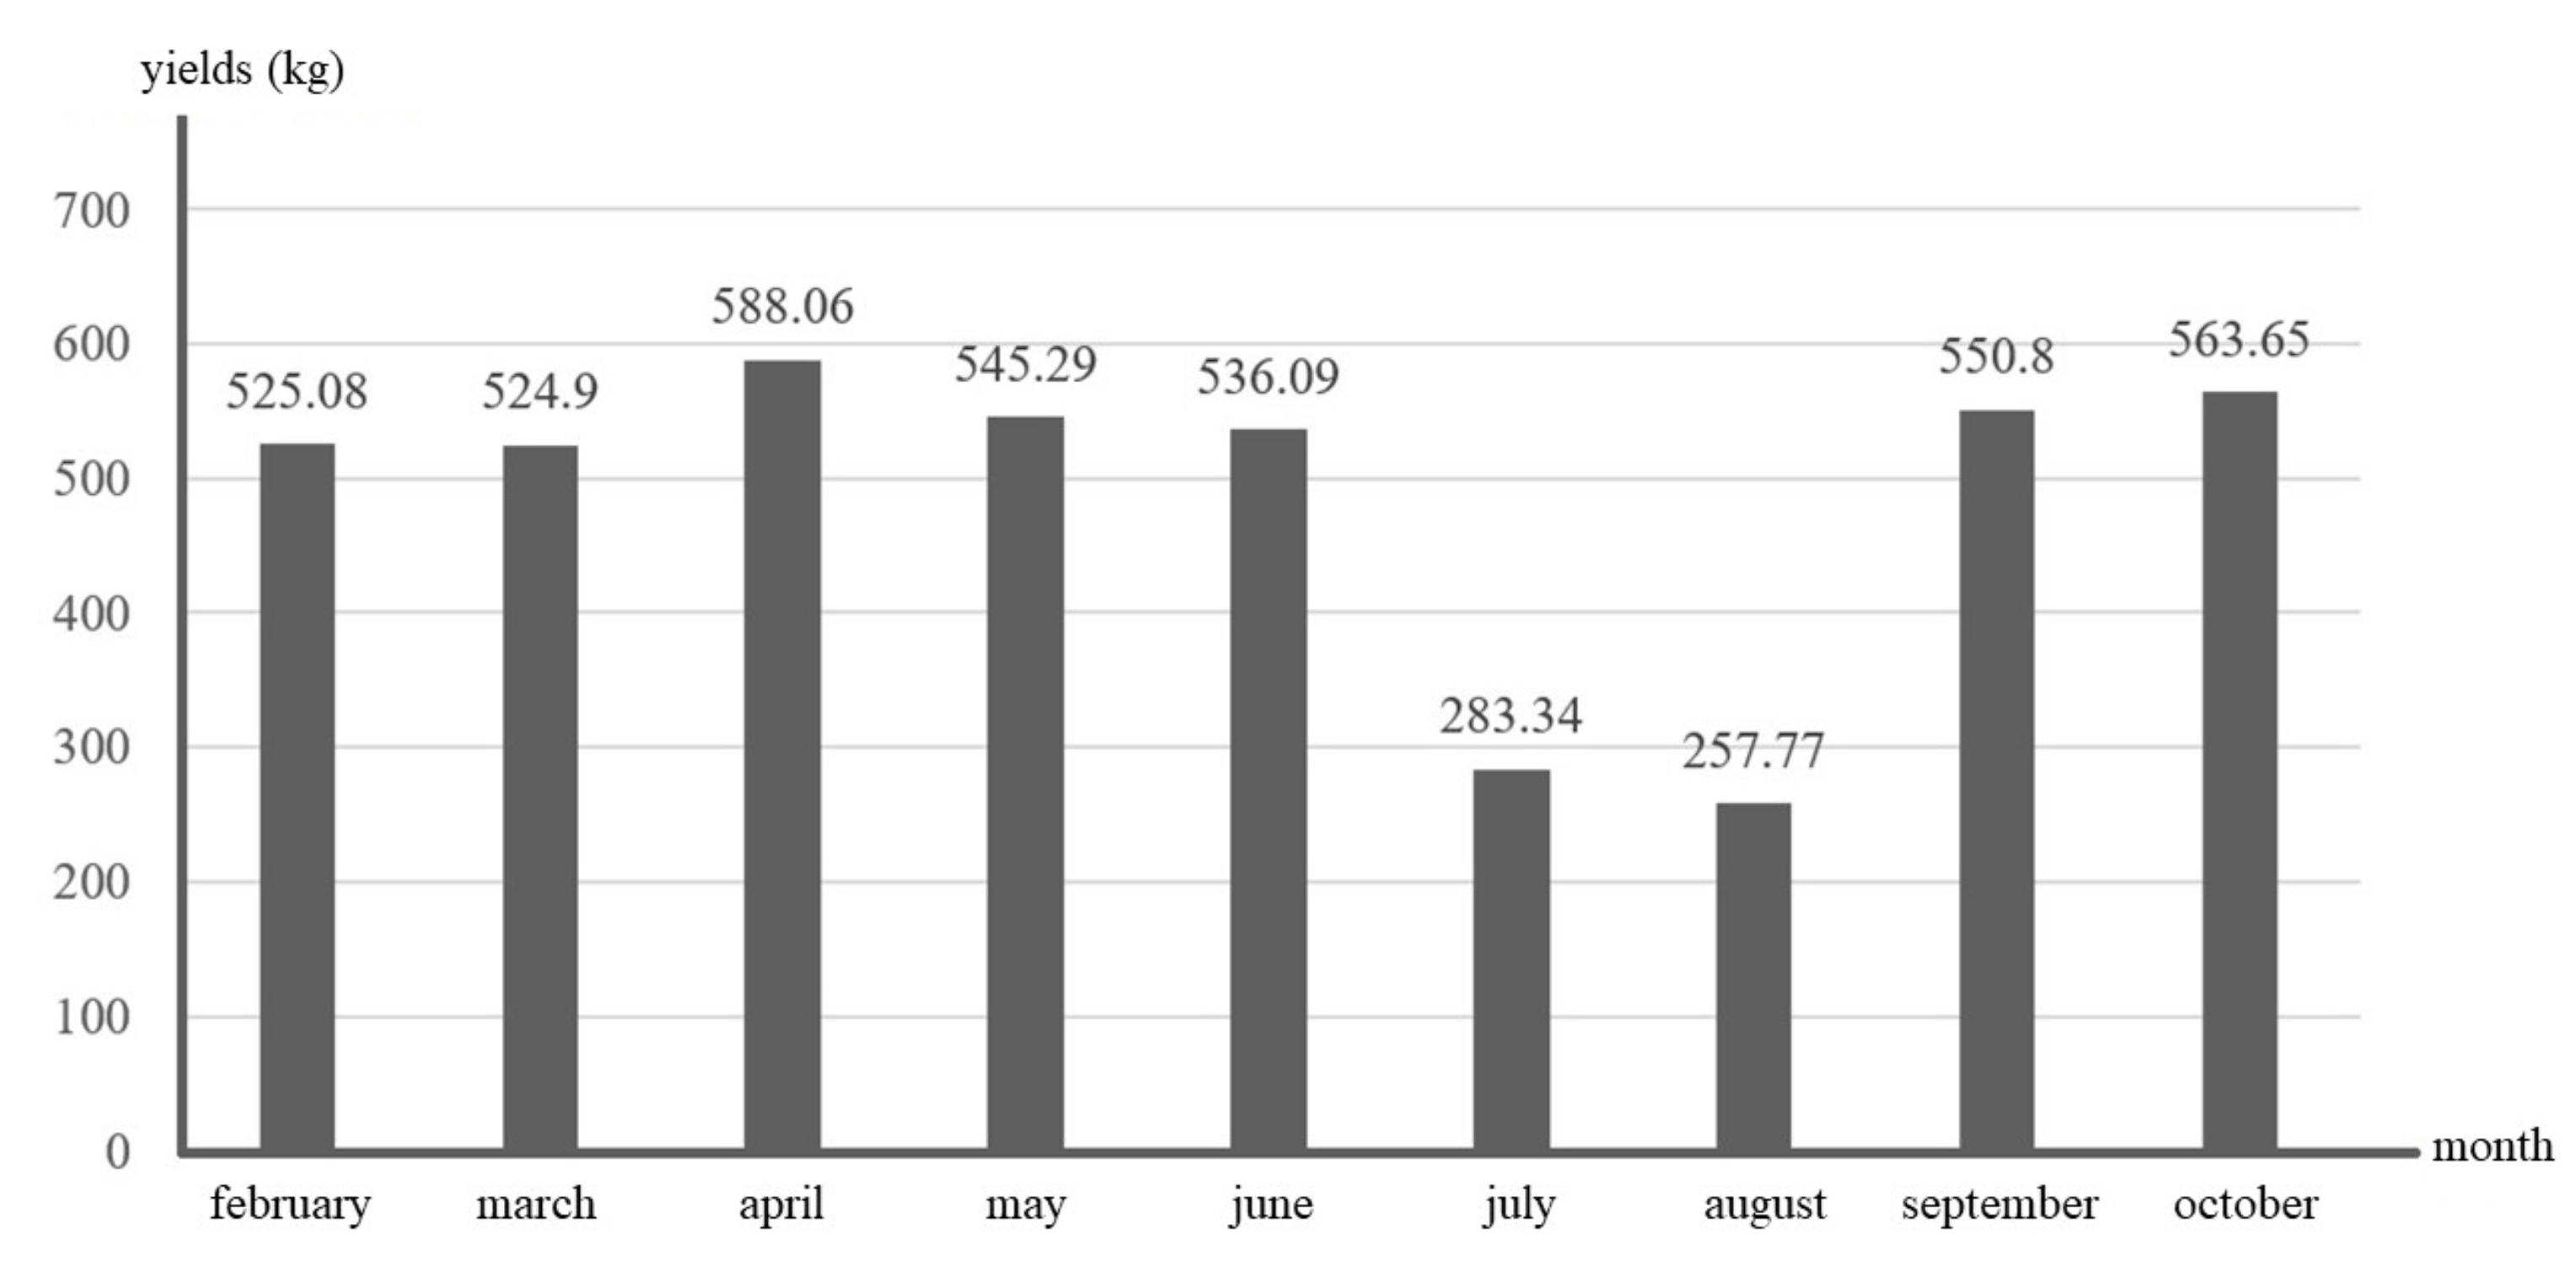
The effect of unit allocation used in this study on Rojolele rice harvest is explained here. Based on
Table 5, it can be seen that the productivity decreased in July and August because the UVUS experienced disturbances and did not function. The average yield when using five UVUS in the Delanggu rice fields for 7 months was 547.6942 kg, whereas the average harvest when UVUS was disturbed was 270.5513 kg. Based on the graph, the average yield per stake is presented in
Figure 5.
Based on these data, the harvest productivity is influenced by the number of UVUS, but the installation of UVUS also requires capital, so a simulation is needed to determine the number of UVUS that will provide the maximum profit. The results of the modeling using the flower pollination algorithm with 3, 4, or 5 UVUS are shown in
Figure 6.
Thus, based on the comparison of 3, 4, and 5 UVUS installed in the Delanggu rice fields, it can be concluded that the number of UVUS that should be installed to obtain maximal profits is five. Five is considered optimal because when the number of UVUS in Delanggu’s rice fields is five, all of the rice fields are covered. Thus, six or more UVUS would only decrease profits, because the investment costs would increase but productivity would not.
4.3. Environmental Aspects
The role of environmental aspects in modeling the sustainability of solar-powered midges technology is explained here. Solar panels should reduce carbon emissions resulting from UVUS. We calculated the maximum reduction in carbon emissions using five UVUS: 13,155 kg CO2 every month. In addition to reducing carbon emissions, UVUS also do not damage the ecosystem, as the UVUS did not kill leafhoppers and sparrows, but only expelled these pests from the Delanggu rice fields.
4.4. Social Aspects of UVUS Installation
The role of social aspects in the sustainability modeling solar-powered UVUS is explained here. With UVUS, it is hoped that farmers in Delanggu village will learn more about agricultural technology. We hope this will lower the workload of farmers and increase their yields. We calculated the level of satisfaction and determined the positive impacts on farmers by the installation of UVUS in Delanggu village based on a questionnaire distributed to 30 farmers. The results of the questionnaire show that 90% of farmers received some positive impact, and 90% of farmers were satisfied with UVUS. Based on these results, it is hoped that socialization and training can be carried out on the importance of UVUS agricultural technology.
5. Conclusions
A location-allocation model was developed in accordance with the flower pollination algorithm (FPA) and sustainability considerations to solve the problem of rice productivity using the innovative technology of solar-powered pest control. The development of UVUS involved open innovation in startups and the adaption of existing technologies, such as batteries, solar panels, and sensors. UVUS was developed with three things in mind: farmers, the energy supply, and midges. The mixed-integer linear programming (MINL) approach was used to determine the decision variable of the number of UVUS in order to minimize the non-covered area. Numerical analysis using a case study at Sanggar Rojolele, Delanggu Village showed that the model can be used to determine the number of UVUS. By installing five UVUSs with an investment cost of IDR 8,500,000, all of Delanggu’s rice fields can be covered, and farmers can save IDR 5,346,500 in maintenance costs, which will come to IDR 500,000 every 3 years. The CO2 per month can be reduced by 13,155 kg. Finally, up to 90% of farmers were satisfied.
Further research is needed to extend the model by not assuming that the ultraviolet light and ultrasonic sound have the same coverage; instead, the coverage should be calculated separately in detail. Other economic benefits can be calculated for sustainability considerations, such as the positive impacts on air and soil that result from not using pesticides to kill pests.


