1. Introduction
In the mining industry, technological advancements are being successfully applied to enhance the productivity and the performance using the industry 4.0 concept [
1]. However, energy management and efficiency have not kept pace with these changes, which is a key element to directly optimize the energy consumption and increase profitability. The objective of this work is to design a new architecture for a smart energy management system according to ISO 50001 standard [
2] for mining industry [
3]. The application was oriented to an experimental open-pit mine respecting all requirements and needs. After studying these requirements, we proposed a prototype which simulates the control and data acquisition system of the open-pit architecture. The use of the plan-do-check-act methodology proposed by the ISO 50001 standard shows the integrity of the applied architecture with the requirements [
3].
In the design phase of this application and before implementation, a full study on the control system was done, showing lack of infrastructure. The open-pit mine was designed in the first place for production regardless of energy consumption or grid quality predictive maintenance. So, to overcome this challenge, new hardware was installed in parallel with the existent infrastructure, including smart meters, programmable logic controllers and servers [
4]. The developed communication and data recording program was tested and validated through the prototype before implementing it in the open-pit mine. After acquiring data, a predictive model was proposed using the fast forest quantile regression to forecast the energy consumption. The visualization of real time [
5] and predicted values was developed in the same SCADA system using the Citect Scada software and for web access using things board solution which still under design for security reasons [
6,
7].
One of the biggest challenges in applying the energy 4.0 transition in the open-pit mine was infrastructure. A large investment in hardware was required to monitor all types of loads in the three stations. Another issue was cybersecurity because the recorded data in the server must have access to production KPIs linked to the intranet, which has strict security standards.
The study presents a full design and architecture for applying a smart energy management system in mining industry regardless the situation and the technology of the control system adapted because the use of OPC data transmission this system can be implemented in different types of open pit mines [
3].
The goal behind this work is offering a novel energy management system infrastructure for a typical open-pit mine, where the system can record, monitor different energy and electrical grid quality data, and give insights on the grid’s real-time state of health. The system proposes a load forecasting algorithm to predict the energy demand response in the open-pit mine. This proposed and tested architecture will enable the different smart microgrid features such as optimization and load scheduling techniques, power shedding, decentralized energy production through renewable sources and energy storage systems, and making the energy audit procedures easy using report generation function.
2. The Challenges of the Implementing the Smart Energy Management System in the Open-Pit Mine
2.1. Introduction
The experimental open-pit mine was initially designed for a required function: to extract mining products and maximize the production, regardless of energy consumption and grid quality monitoring. The maintenance technicians use a curative and preventive maintenance system. The supervisory control and data acquisition (SCADA) was completely oriented to process machining supervision and production key performance indicators [
4]. The goal of this study is to redesign the control system and integrate the energy and electrical grid data by giving insights and predictions.
2.2. Monitoring All Different Loads and Supplies
In the open-pit mine, the main components of the mining machines, such as bucket wheel reclaimers, stackers, draglines, jaw crushers, conveyors, screening and loading stations, are squirrel cage induction motors (SCIM) and direct current (DC) motors. The number of machines per stage is very big, the goal is to instrument all these loads by energy sensors, so the amount of data will be very huge to store, to visualize and to process [
8]. The monitoring techniques used in this work are global to specific, supervising different process stages, destoning, screening and train loading. The goal is to prepare a first proof of concept (POC) that validates the idea then to go to specific load consumption monitoring.
2.3. Feeding the Supervisors by Real Time Energy Data on the Same Process SCADA View
After studying the requirements of the supervisory control and data acquisition (SCADA) system, to implement such a solution, all hardware, recorded data, processed data and views must be embedded in the same process SCADA system, in order to facilitate monitoring by the supervisors so they can have insights on process, maintenance, energy consumption and forecasted data.
2.4. Parallel Integrating Hardware Solutions to the Same Process Control System
The biggest challenge that we faced during while implementing the POC was not to impact the process control system or the database server. The solution was to integrate parallel sensors to acquire energy data using the same programmable logic controller (PLC) so the data acquisition system was very limited because the PLC is used for controlling the process. The data collection must be stored in the same database of the production to find correlations, but it was forbidden to change the architecture, so we added a parallel database and fed it from the first one.
2.5. Predict the Energy Demand Response Based on the State of Different Historical Scenarios
One of the needs is to understand the behavior of some machines and to calculate the energy efficiency of each component, such as conveyors which transport the same amount of mined material, by storing the demand response of each machine, in order to take maintenance decisions and optimize the production strategy and the stage-scheduling program [
9].
2.6. Finding Correlations between the KPIs of Energy Consumption and Mine Production Process
The goal after acquiring data from different system components was to look for correlations between different KPIs, so the open-pit site managers could have insights about the causes of problems and act as rapidly as possible. In this study we used the fast forest quantile regression to make a data-driven model [
7,
10] on the impact of different stages on the specific and the general open-pit energy consumption [
11].
2.7. Giving Insights on the Electrical Grid Quality
By introducing such a system, the installed smart energy sensors gave power grid quality basic readings: voltage, current, frequency and energy in real time [
12]. So, the calculation of other variables such harmonics, voltage sags, voltage swell, RMS, and others, can help to give general insights about power grid quality and can also detect abnormal behavior in different components [
13].
2.8. Real-Time Energy Consumption Feedback Tarrif
The goal was to help the energy manager in taking decisions and preparing reports. The real time energy consumption views must integrate the price value and compare it to the profit [
14]. Those reports can be used to anticipate and predict the specific annual energy consumption and make negotiations and agreements with energy supplier companies easy to manage [
15].
2.9. Cybersecurity and Data Sharing
As mentioned, the first server that collects production data is mandatory and is connected to different sites. The new designed system must have a parallel data base, so feeding the second database from the first one makes the solution very challenging because the results of the acquired data processing must be shared through the same SCADA views. That is why the PLC were directly connected to the sensors, so the system would be secured and integrated in the same intranet. However, a parallel cloud database was set as a backup of the second database, respecting the network security requirements [
16].
3. Methodology of the Integrated Smart Energy Management System
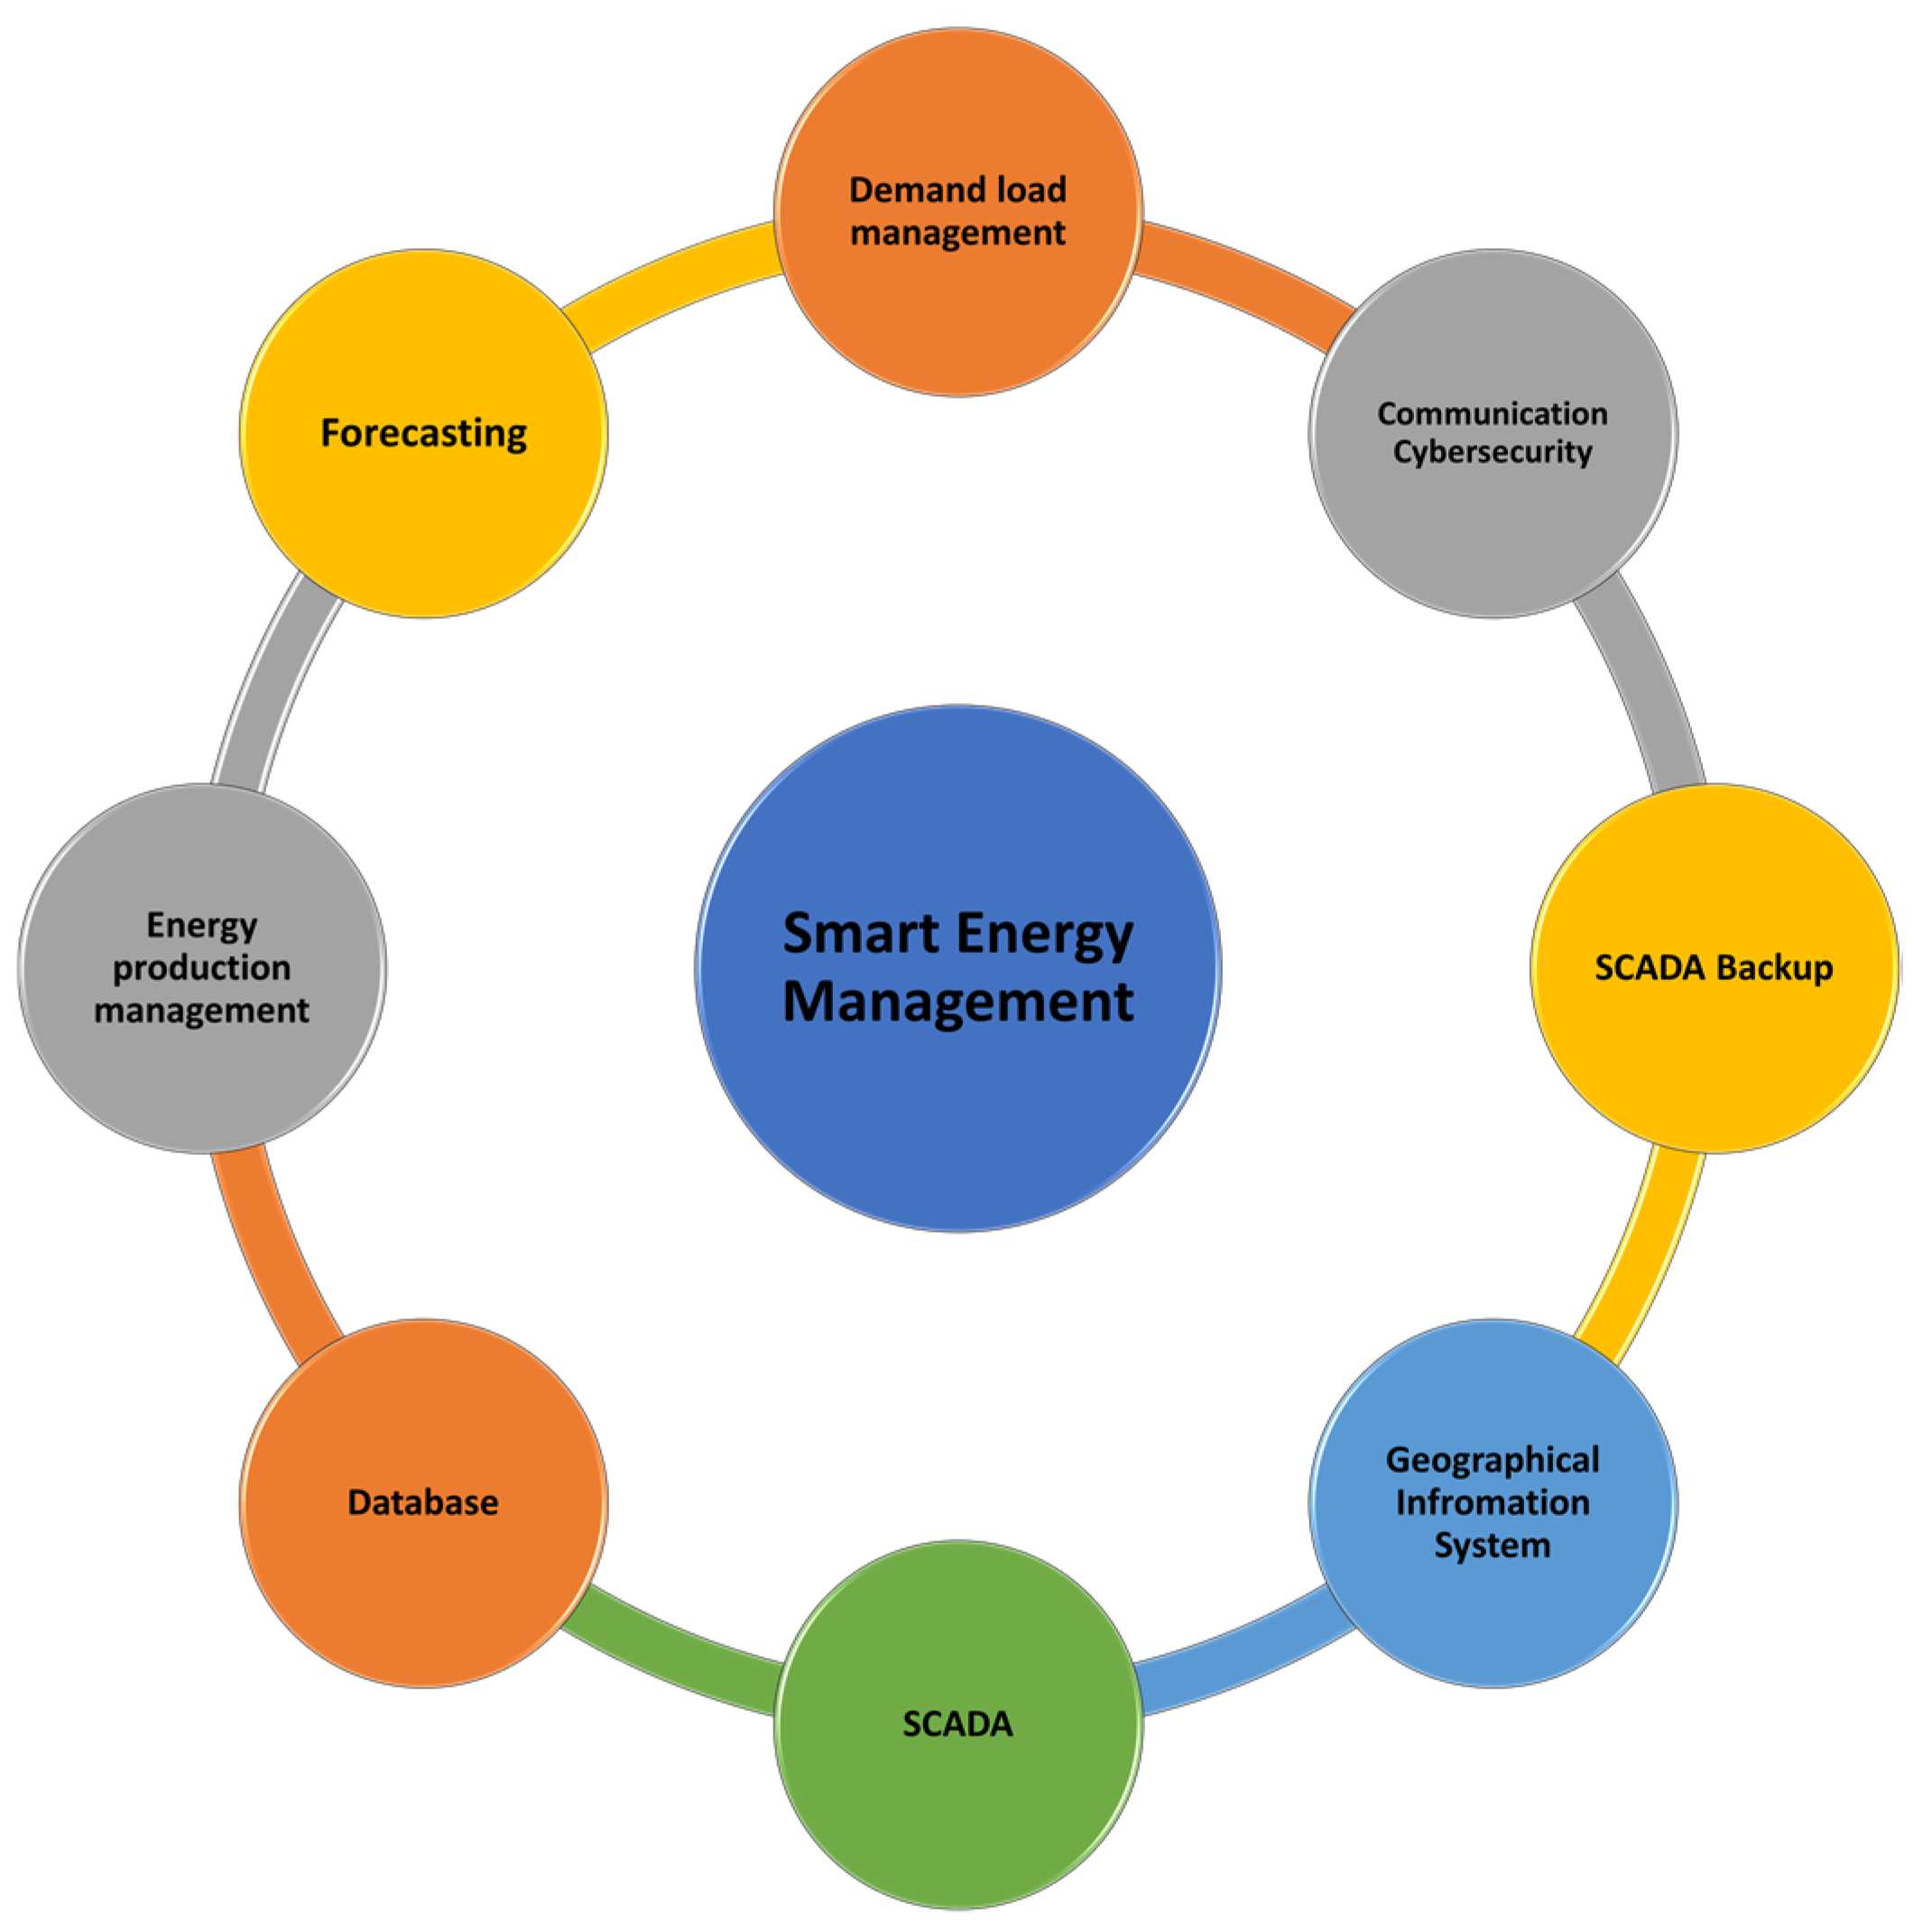
The smart energy management system (SEMS), as shown in
Figure 1, is a dataflow of energy consumption, generation data, between SCADA, SCADA back up for redundancy, the database, and the supervision dashboard, which shows the forecasted and predicted energy profile and demand response of the different components of the open-pit mine electrical grid. It detects all anomalous equipment and its placement using a geographical information system for easy and direct maintenance [
4].
In such a system, cybersecurity management ranks highly and has a critical priority because of the flow of energy. A cyberattack can generate false data and falsify the algorithm to give wrong decisions that can risk insufficient energy management, low indicators, false anomalies alarms, and even blackout, so to maintain an online SEMS, a cybersecurity strategy must be implemented and always maintained [
3].
Figure 1 represents a general schematic of different components of the SMES on which we based the design of the open-pit mine system solution. The next step was to choose the methodology.
According to ISO 50001 standard [
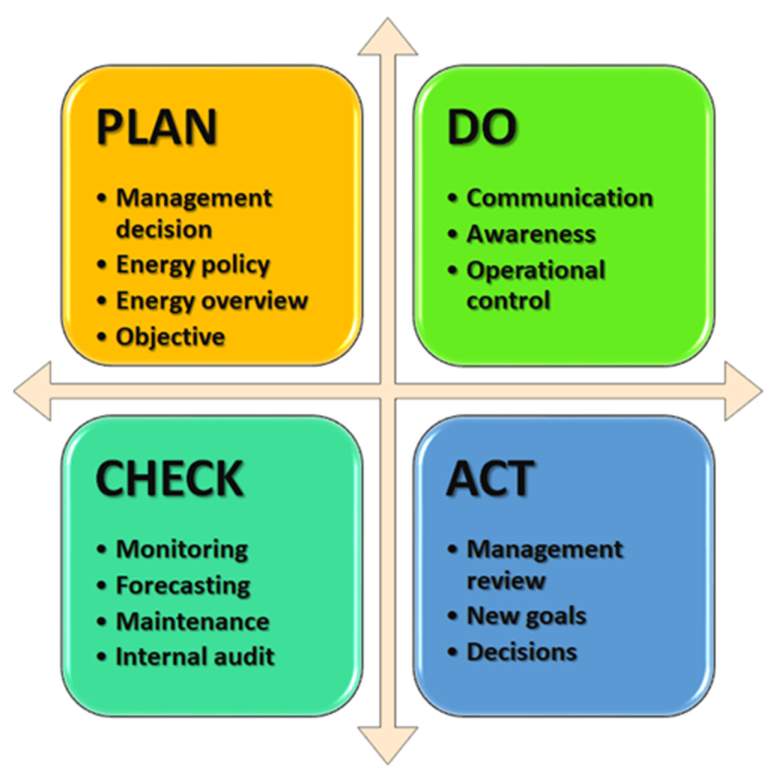
2], which is the guide to design energy management systems respecting specific requirements, the use of the methodology, plan-do-check-act (PDCA) has shown satisfying results to achieve continuous improvement.
Figure 2 shows the general PDCA cycle of different SEMS goals [
5].
In the plan phase, the SEMS will be designed to achieve the main objective which is minimizing the energy consumption and sending alarms whenever an abnormal consumption is detected. It must share in real time the energy data of different stages of the open-pit mine. It gives insights on the energy policy and help energy managers to have better decisions. In the do phase, the system must have interactive views that communicate with different open-pit components and stakeholders, by sharing data, alarms, insights and reports and aware them, those alarms can operate and control directly the system if there is a critical anomaly detection [
8,
17]. In the act phase, the stakeholders can review the SEMS and decide new energy efficiency goals to improve the system. In the check phase, the stakeholders, and principally the energy managers, can check and analyze the SEMS, monitoring system, predictions and generated reports. They must use those reports as an input for maintenance planning and preparing internal energy audits.
After having a general view of the PDCA methodology, we must define how can this approach increases the profitability.
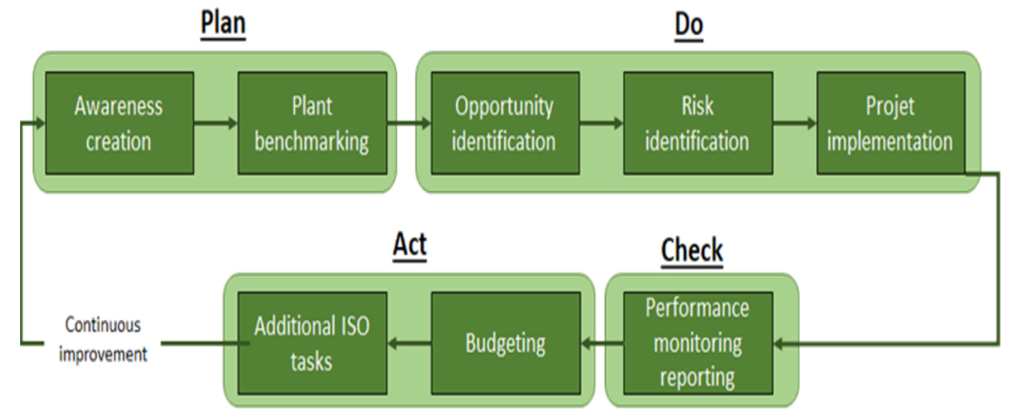
Figure 3 describes the steps required to apply the methodology, by raising the energy consumption awareness of the open-pit stakeholders, then starts a full internal audit on the different equipment and classifies them into the plant benchmarks. After completing the planning phase, we must identify the top opportunities and risks using of the existent state, to make the project implementation more reliable and complete the do phase. All generated reports and feedbacks based on acquired and processed data are used to check the performance of the system. After revising and analyzing reports, the energy manager prepares the budget of the energy consumption and adds more ISO tasks answering the feedbacks of all SEMS stakeholders, to improve continuously the system and recreate the awareness strategy [
5].
4. State of Art of the Smart Energy Management Systems
4.1. Introduction
Energy management is becoming a more important component of industrial energy efficiency strategies. Recent work indicates that the mining industry is still in the early phase of energy 4.0, digital twins [
18] application and the transition [
10]. Knowing that industrial businesses are scrutinizing their energy profiles more thoroughly for cost-cutting, decarbonization, and resilience purposes. They are progressively using energy management systems and thinking about onsite resources such as renewable energy and energy storage. Many people are taking part in current utility programs to meet their energy management objectives, and some see further potential in the more participatory electric utility and market programs [
19].
Many researchers are trying to digitize energy management systems and machine learning so it can help forecast, analyze, and diagnose anomalous and abnormal energy consumption behavior, by proposing models and ensuring proper supervised learning capabilities in a microgrids cluster environment [
20]. The use of sophisticated machine learning, for an effective energy management strategy for microgrid, such as forecasting, and scheduling has shown very satisfactory results in power plants [
21]. The same goes for hybrid energy systems, using the machine learning in order to choose the optimal combination from the available energy sources based on different criteria [
22]. The goal is to apply the same approaches in the mining industry and combine solutions, by testing different algorithms then comparing the outcomes to select the algorithm with the best performance and to rank them in terms of both performance and accuracy [
23].
4.2. Peak Load Forecasting Models
The energy consumption prediction and peak load forecasting is an important feature in the proposed design. After collecting the data and completing the integration of hardware with the SCADA system is the phase to choose the best peak load forecasting model to validate the POC.
Based on a comparative study proposed in recent work [
3], we can see that the quantile regression model has very satisfying results.
Table 1 shows the different applications of quantile regression, neural networks, and support vector machines to predict the energy consumption and the peak load. So, we chose to apply fast forest quantile regression (FFQR) [
24] to complete the proposed design as a first version of algorithm. In future work we will test more algorithms to enhance the models and improve the prediction while the data are being recorded and first results are analyzed.
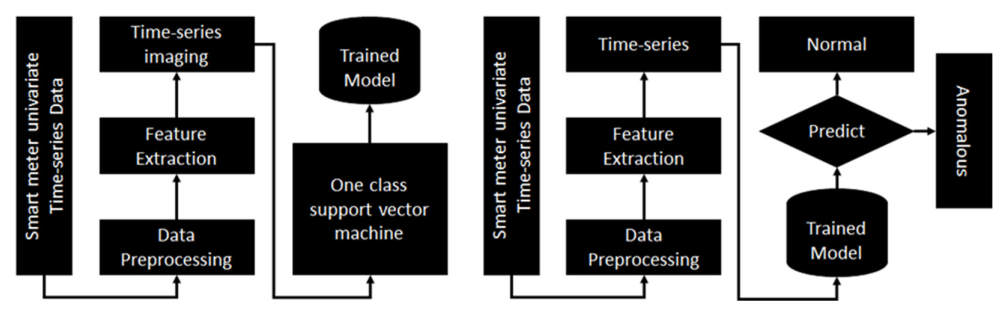
In recent work, a training and testing model was used to predict abnormal energy consumption for residential building [
25]. The goals, as shown in
Figure 4, were collecting time series data from smart meters, processing the data and extracting the principal features, training the model using support vector machine, and then predicting the abnormal energy consumption behavior of each open-pit equipment [
26]. This feature can be proposed after validating the proof of concept of this designed infrastructure.
4.3. Smart Energy Meter
The key component in the proposed SEMS architecture in the open-pit mine application is the energy meter. In this section, we select the best energy meter that can fit perfectly with the existing SCADA architecture. We used PM8000 Schneider energy meters, which can communicate easily with the PLCs through the Modbus protocol. The power meter measures all the basic readings [
27].
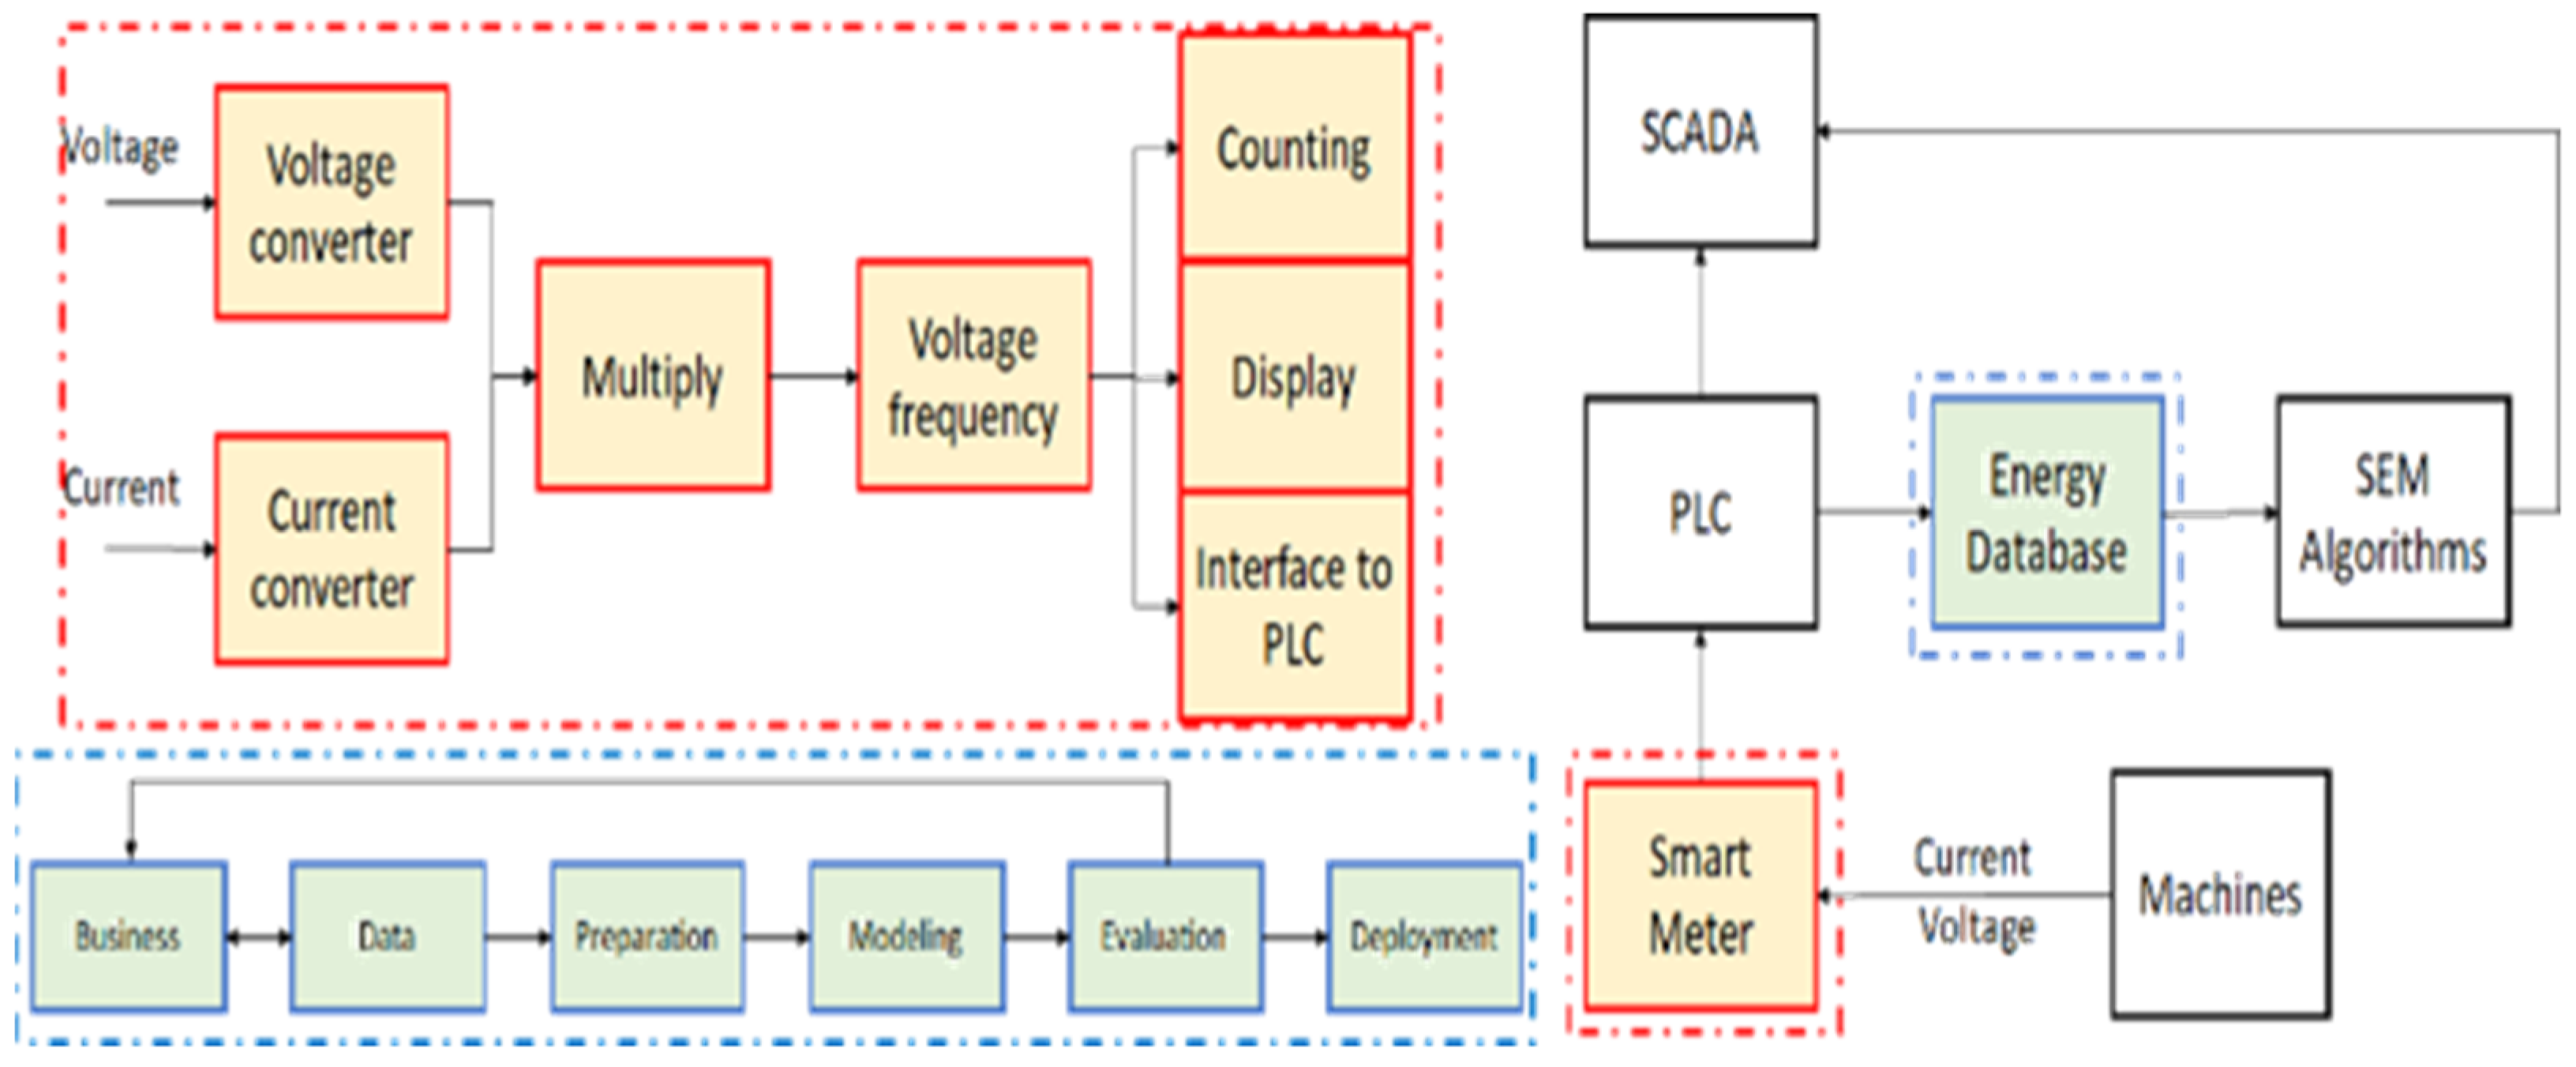
The PLC transfers all the acquired data to the energy database, as shown in
Figure 5. Then the predictive model calculates the forecasted data, after the preparation, modelling and evaluating processes. The SCADA system shows both real time data and forecasts energy consumption [
25]. It also shows alerts and the abnormal consumption [
8], so the technician could take decisions.
4.4. Smart Energy Management System Architecture
In this section, we have based our design on an architecture proposed in recent work [
3], where the SEMS is presented in
Figure 6 as a data flow from different open-pit sections. In the field, all monitored machines and equipment, such as draglines, bucket wheel reclaimers and conveyors, are instrumented by current and voltage sensors, depending on the values of the equipment, regarding the accuracy, drift, linearity, phase shift, integration, and price, of course. The sensors installed are interfaced with power meters, which communicate directly with PLC in the control layer, the PLC interface with the SCADA system to collect, store and visualize the data. In the artificial intelligence layer of the SEMS, the database feeds the defects diagnosis and the load forecasting algorithms, which report the current and the predicted state of the demand response [
28].
In the operational layer, the SEMS manages the load and sources in order to optimize the energy efficiency and improve the system as well, these operations reports to management layer where the energy manager can oversee all changes and can take real time decisions [
22].
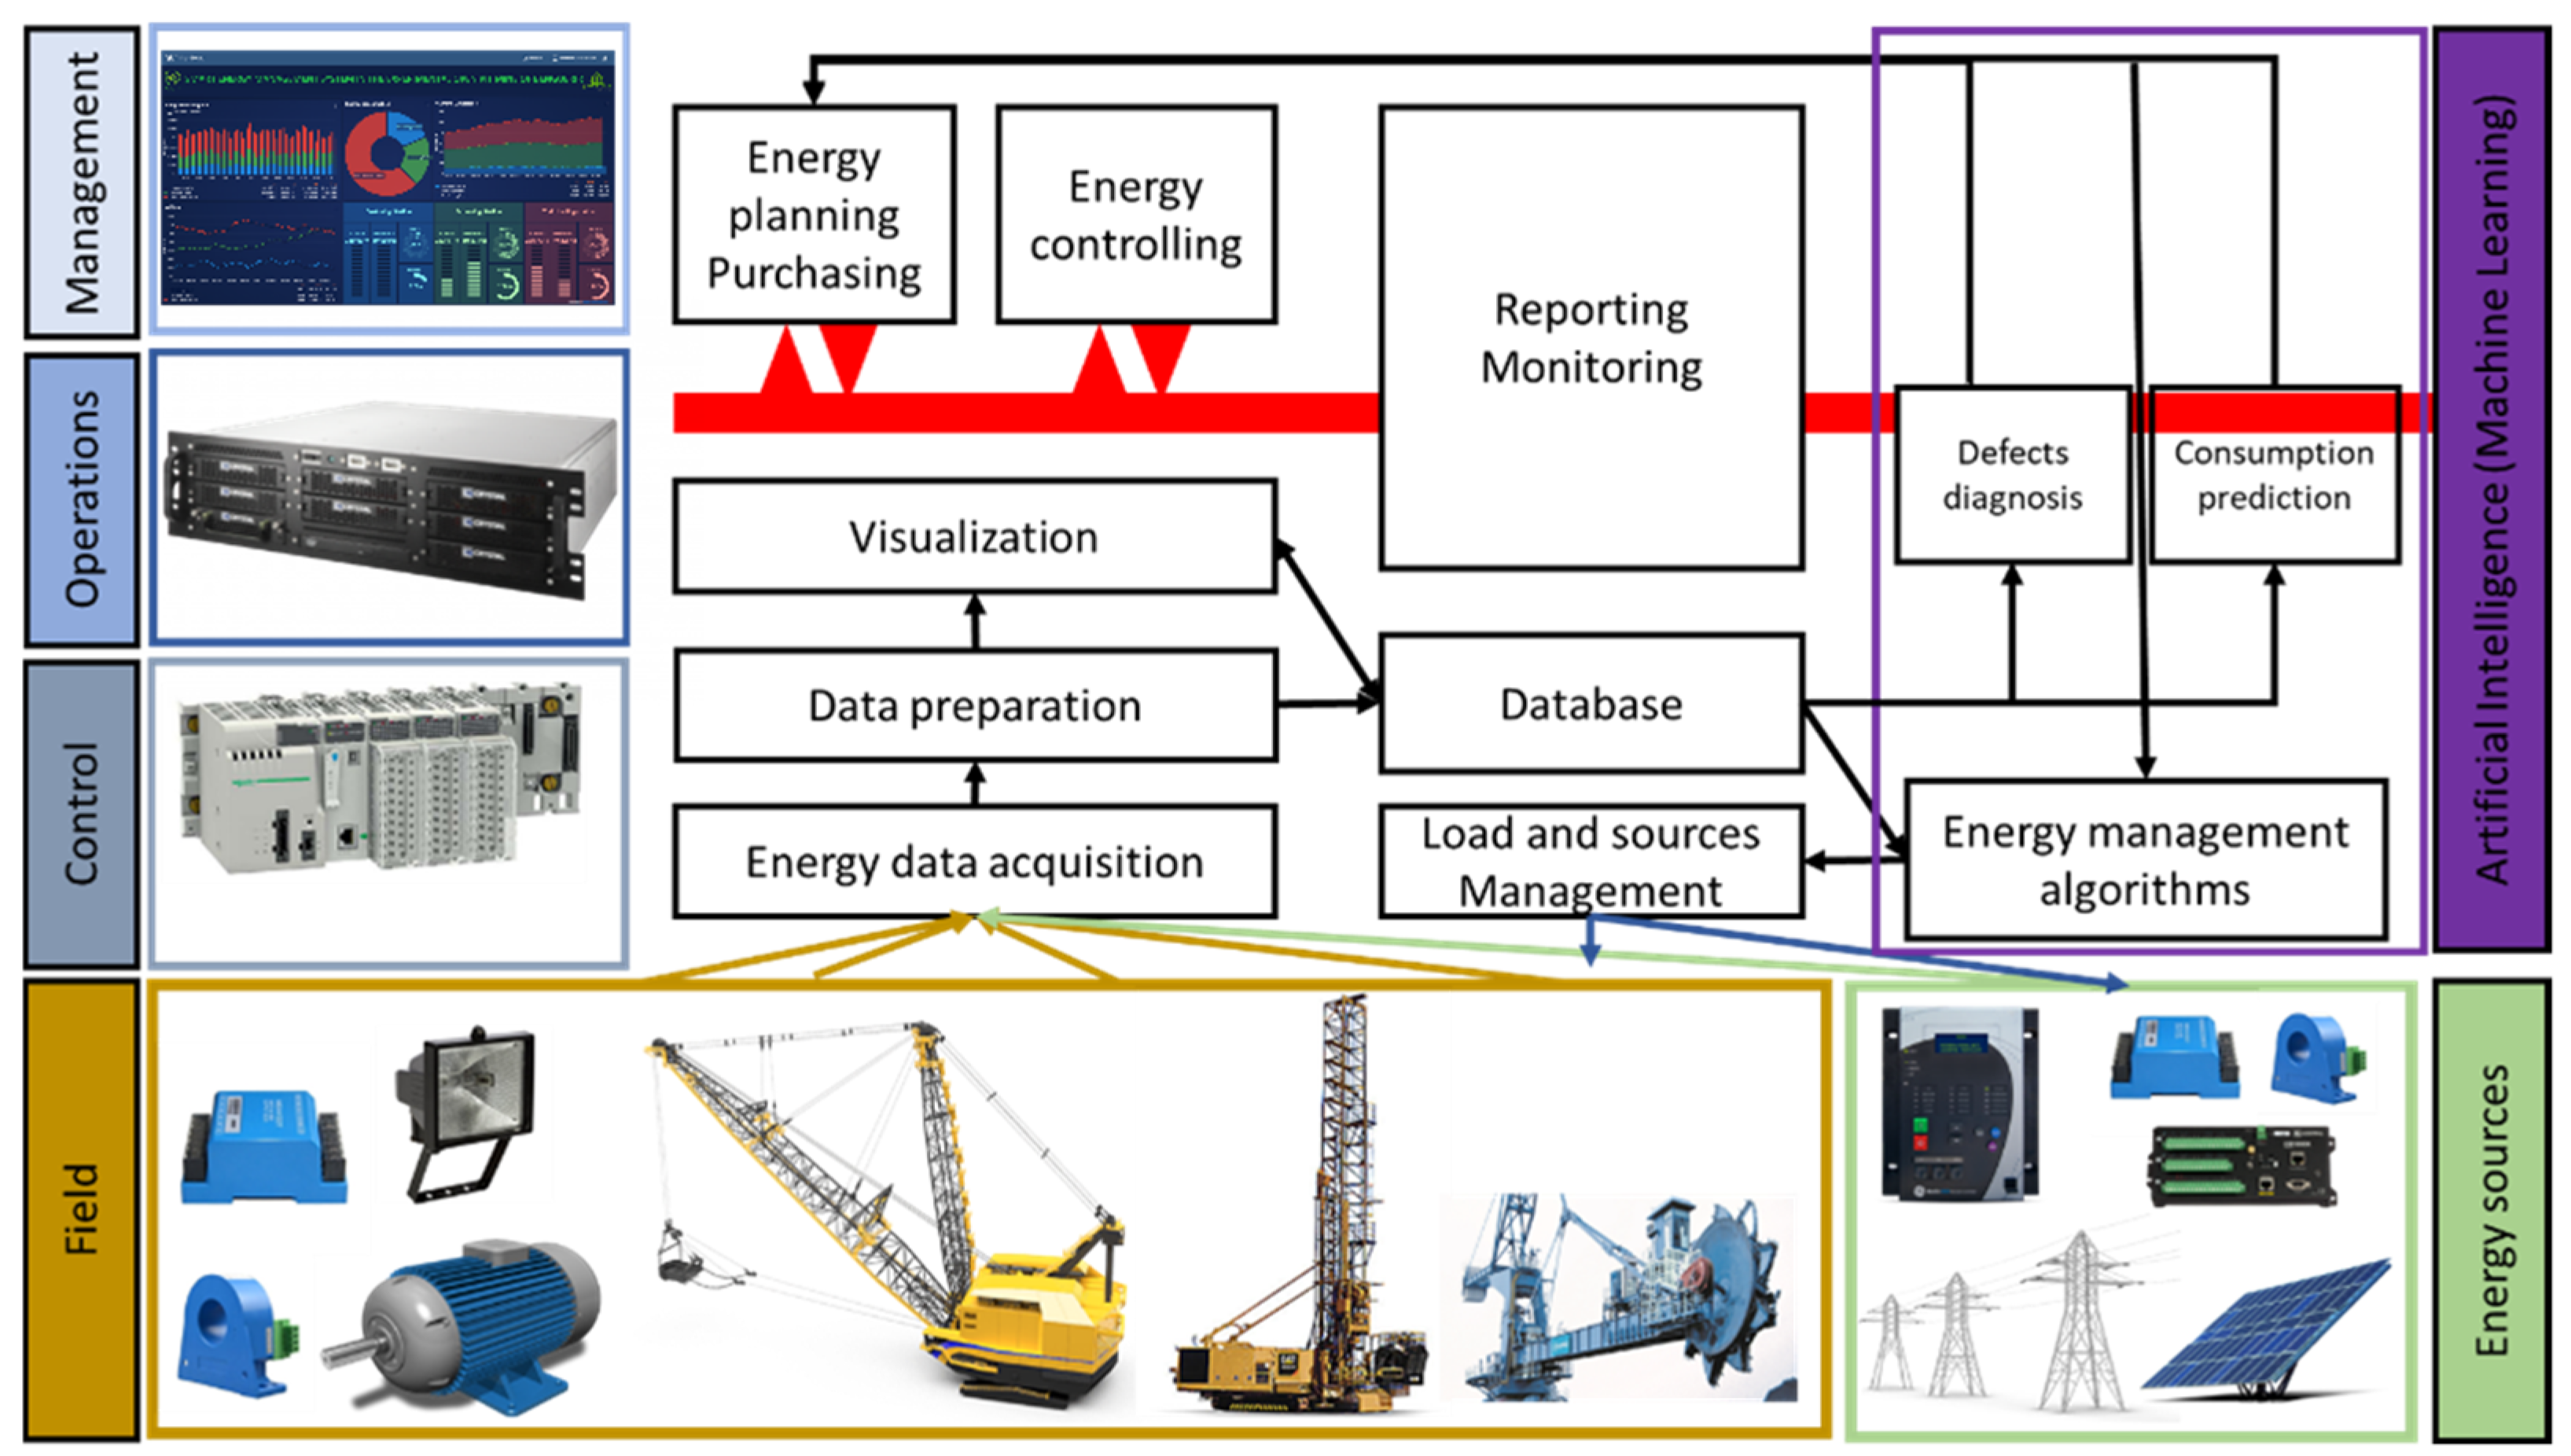
Figure 7 shows the general subsystems of a SEMS that can be implemented in industries, typically chemical processing and the mining industry. The data management subsystem collects energy consumption and generation data and runs the regressors to forecast the energy profile and demand then uses the classification algorithms to diagnose the system, detect abnormal consumption and anomalies and predict critical grid failures [
8,
13].
The supervisory control and data acquisition system is implemented and connected to energy meters and the process system which allows an efficient and fast data acquisition and processing.
4.5. Power Grid Key Performance Indicators
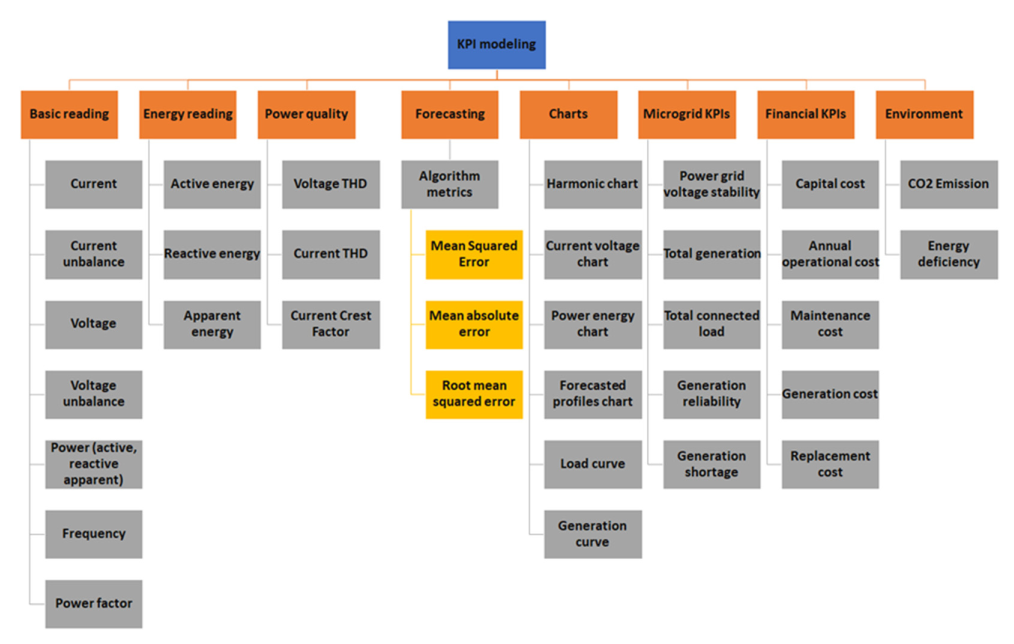
The monitoring of the electrical grid requires several types of data to be precalculated or acquired from sensors. As shown in
Figure 8, these data are classified as basic readings, energy reading and power quality which are directly alimented by the power meters, and the forecasting algorithms of the energy demand response which are based on data collected and stored in the database.
In the energy SCADA system, the most important type of visualization are charts, to supervise alarms, and critical conditions, current and voltage charts show the line main defects and failures, harmonic and instantaneous power charts shows the power quality condition in real time to help taking an action if needed, load curve, generation curve and the forecasted profile can help the supervisor to take a decision on a load or a power flow [
15].
Other KPIs such as generation reliability, shortage, voltage stability, total generation, and total load, give a general view of the microgrid condition, and calculate the financial KPIs, maintenance, replacement cost, capital cost, then calculating the environmental KPIs CO2 emission, and the energy deficiency.
As discussed in the state of art section, the literature review on implementing an energy management system infrastructure in the mining industry, precisely the open-pit mine, these systems are not widely used. The lack of these infrastructures will stop the energy 4.0 transformation which will slow down the implementation of smart energy management features. The tested and proposed architecture enables real-time energy monitoring, load forecasting and grid state of health estimation using machine learning algorithms. The most used algorithms to predict the energy consumption are quantile regressions. In this paper we propose the fast forest quantile regression technique. The data are recorded into the system database which enables the system to integrate new prediction models as features. This architecture helps to add more electrical grid classification algorithms and defect detection as shown in
Figure 4. So, implementing this architecture is the first step to take for digital transformation in the mining industry.
5. Smart Energy Management System Requirements for the Open-Pit Mine
To implement a smart energy management system in mining industry, the requirements of the system must meet the ISO 50001 [
2], ISO 50006 [
29], IEC 61557-12 [
30], IEC 62974-1 [
31] and ISO IEC 17799 [
32] standards requirements, the schematic represents the requirements diagram for this system, and it proposes a methodology on how making it smart.
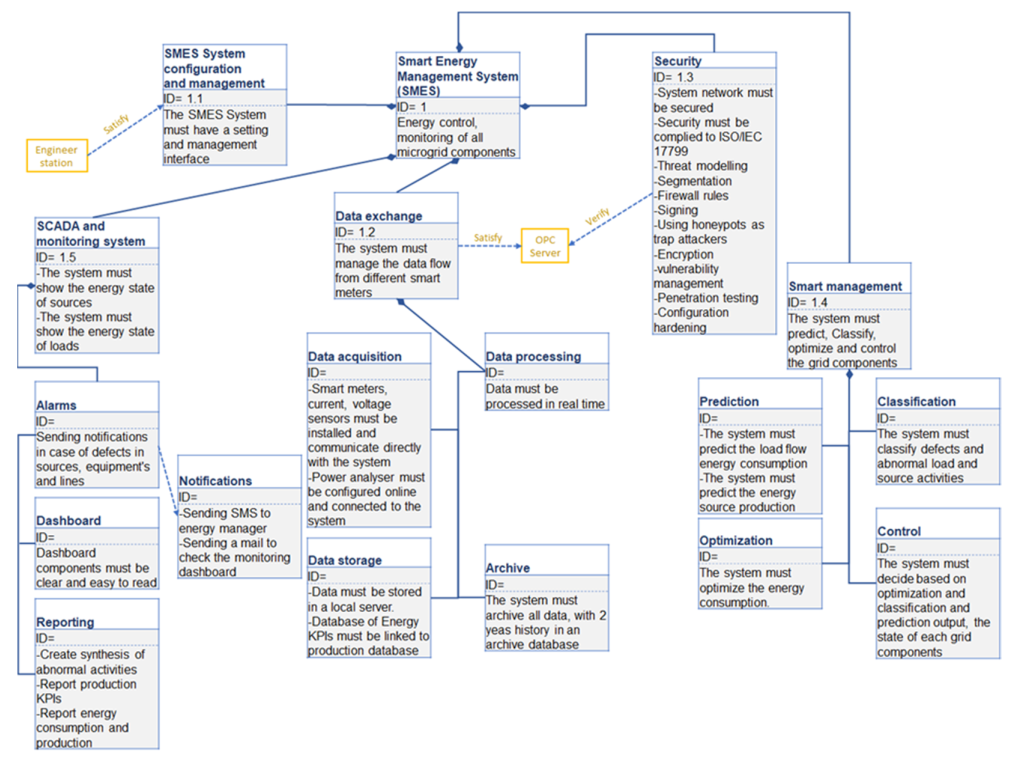
The requirements diagram shown in
Figure 9 sums up the requirements for a smart energy management system considering five important parts: SCADA and the monitoring system which contains alarms for sending notifications in case of a defects or an abnormal behavior of the grid components, a dashboard that shows the different KPIs and results of the microgrid, and a reporting system that summarize the results and generates reports automatically. The data exchange between different smart meters, power analyzers and the communication system, where the data acquisition processing and storage must be in real time and automatic.
The data exchange must satisfy the OPC server communications, after being verified by the security system. The part that makes the system intelligent is the smart management by predicting the energy behavior of the machines, classifying the abnormal consumption of each component, optimizing the power flow in the microgrid, and then controlling loads and sources, which is a decision based on artificial intelligence.
The tested and implemented architecture has offered insights on specific energy consumption in the proof-of-concept load, the views were fully integrated with the existing SCADA system which makes the supervision and KPI data sharing easy to manage, the proposed solution used parallel architecture which does not impact the process automation which is one of the biggest fears of the maintenance team. As a first smart layer of the system, an energy demand response prediction was added using the fast forest quantile regression which is under test due to the lack of energy data. The implemented solution gives real time insights into the electrical grid quality which used to be done manually and discretely. It also enables adding more features in future works to overcome other challenges, for example cybersecurity and false data injection diagnostics. After gathering more data, the system can integrate more classification and diagnostic models to detect abnormal behaviors, track energy consumption tariffs and take real time decisions.
6. Peak Load Forecasting Testing Algorithm
6.1. Fast Forest Quantile Regression
As an extension of the ordinary regression, the fast forest quantile regression can estimate the predictor variable effect based on the mean and conditional quantile [
26].
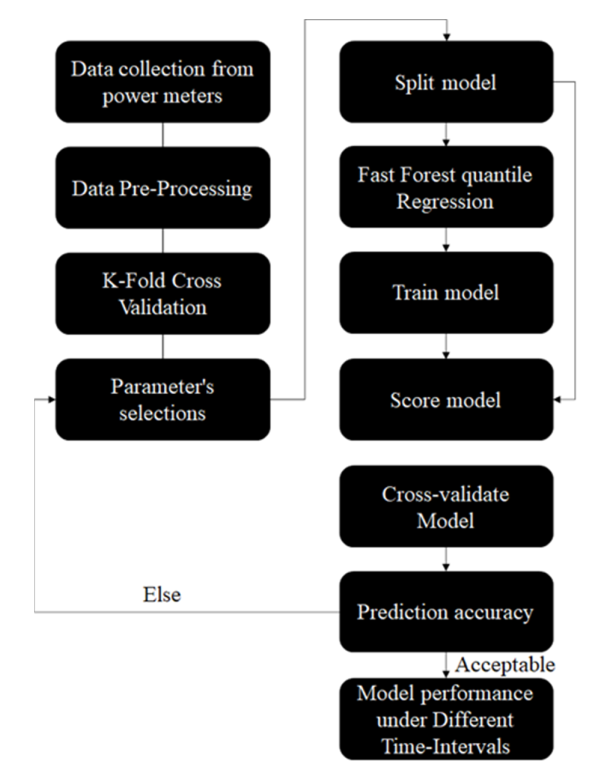
6.2. Flowchart Methodology
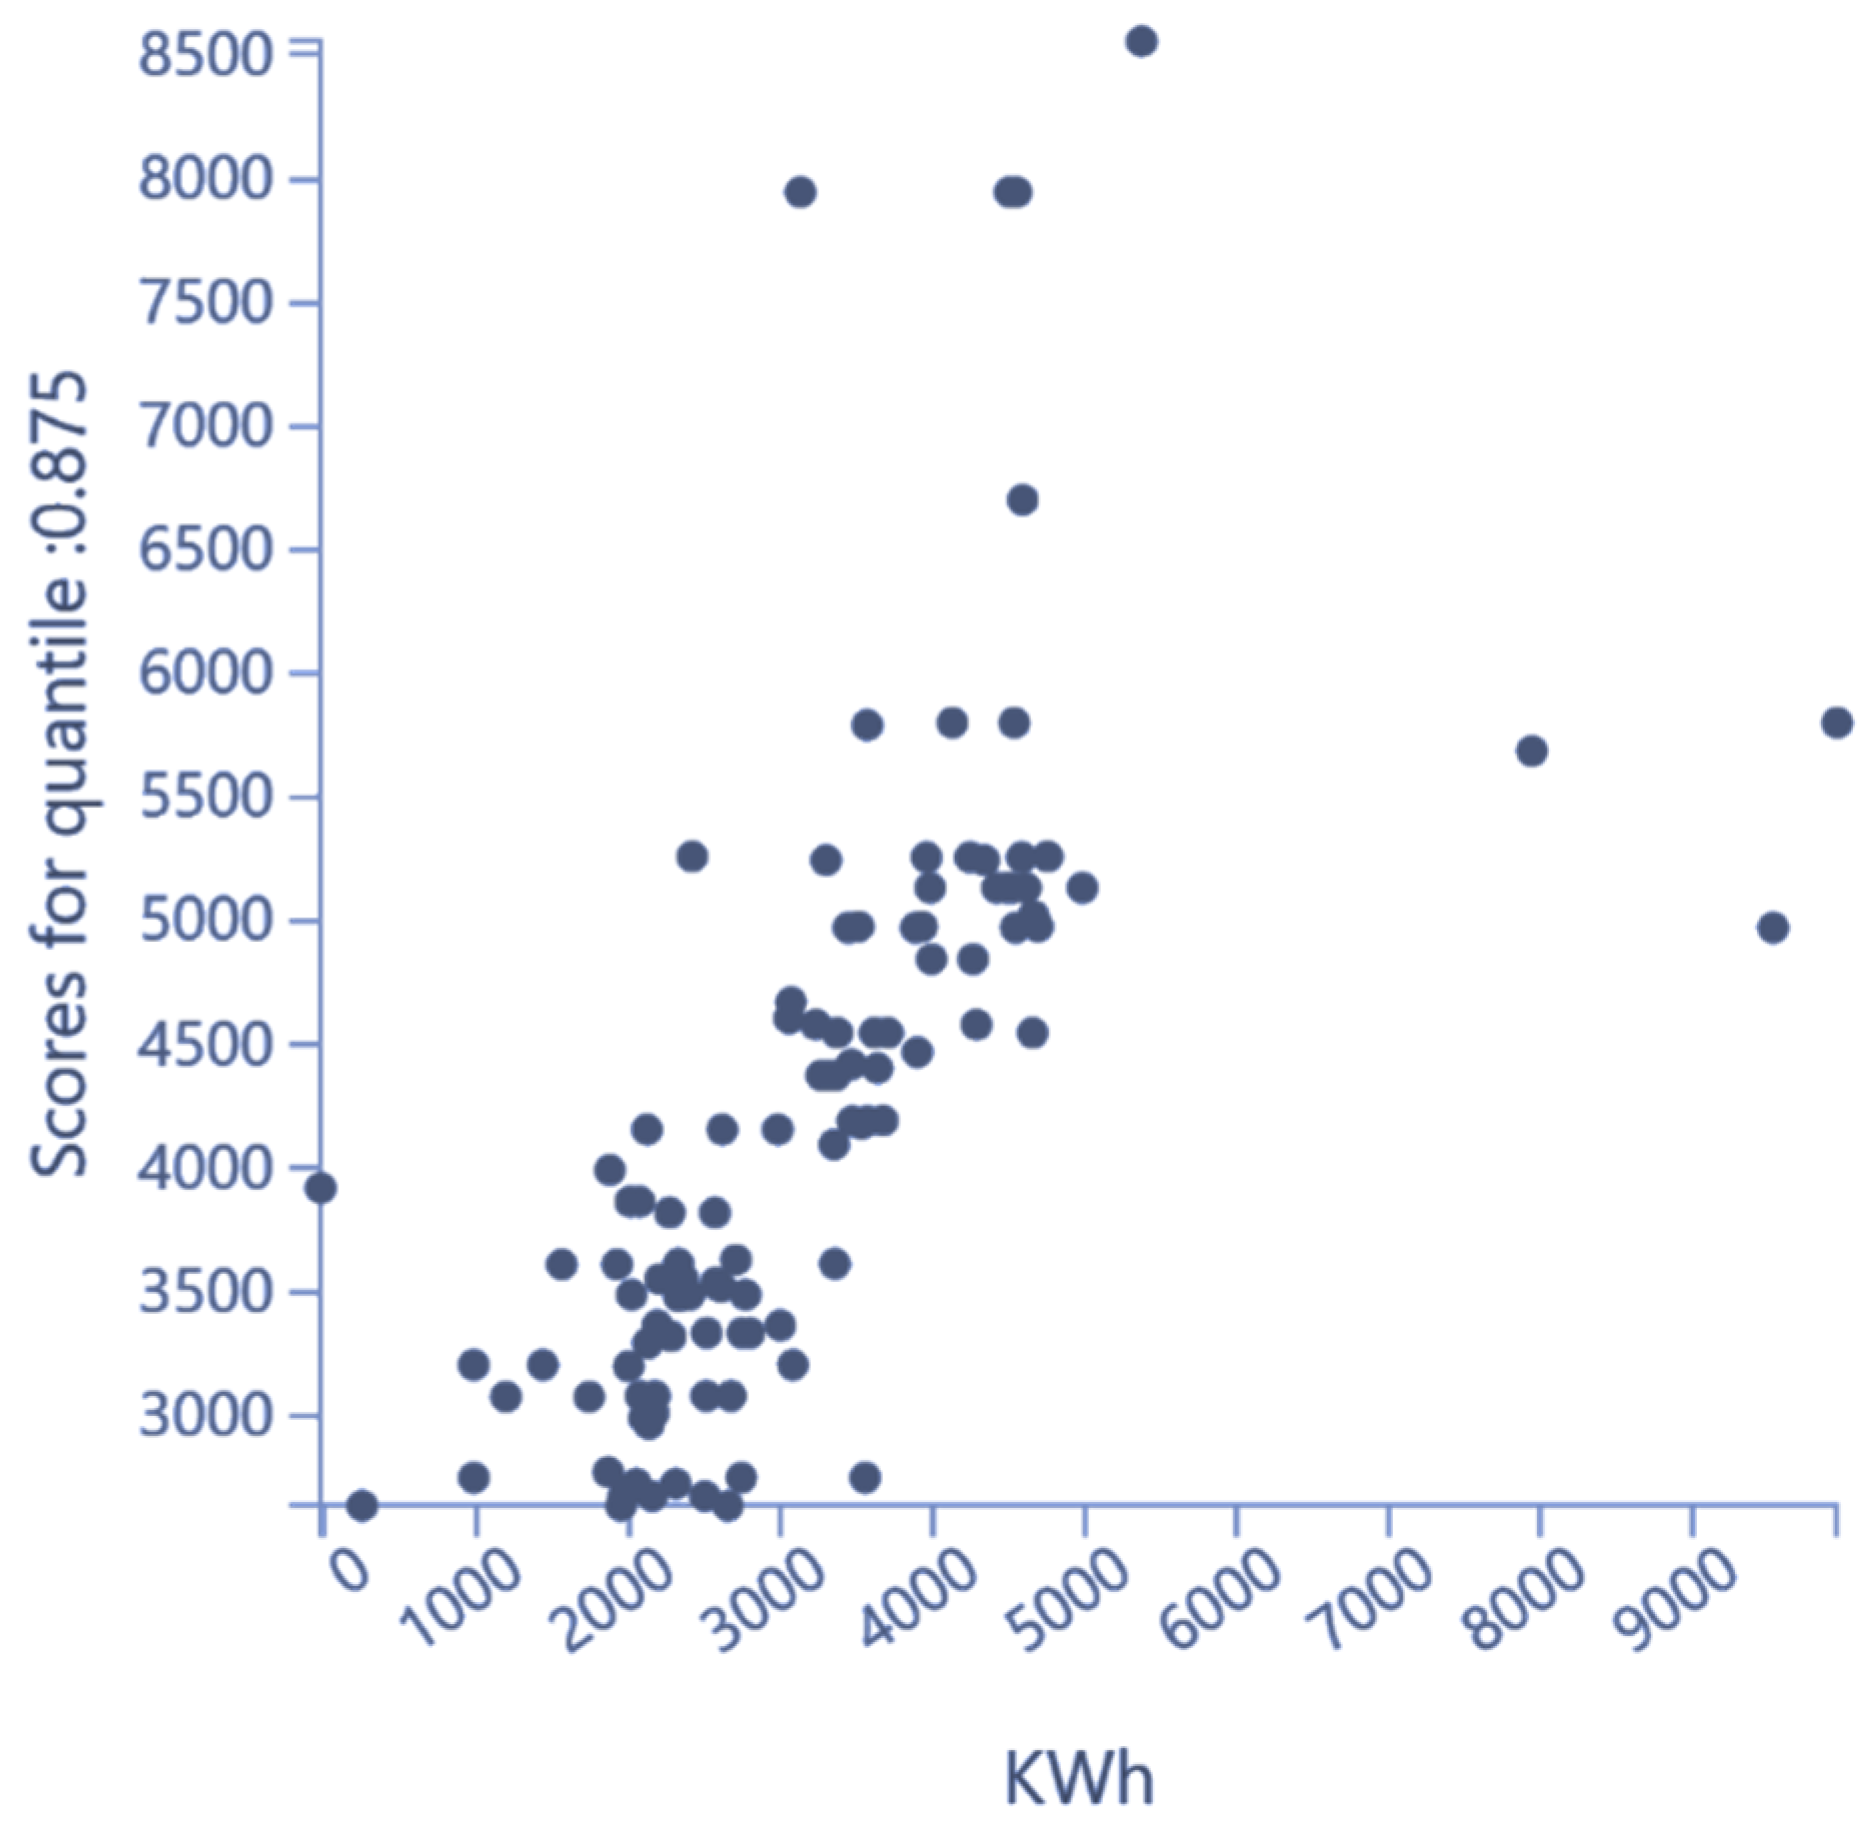
The data collected from the power meters in a case study of a destoning station in an open-pit mine, had been preprocessed and cross-validated using the k-fold cross validation. The parameters selected are production, energy consumption and functioning hours. The data were split for train and test, for which 70% of the dataset was reserved to train the model using the FFQR.
The score of the model indicates the accuracy of the FFQR model to predict the amount of the energy consumed as shown in
Figure 10.
In the proposed algorithm, the energy consumption data for each station are collected from power meters and stored into a database that contains functioning hours and production.
In the data preprocessing stage, the gathered data are cleaned removing unwanted observations, such as energy consumed without equivalent timestamped production or functioning hours, dropping missing data. In the k-fold cross validation stage, the dataset is shuffled randomly, then split into groups, considering the group to be test data set or a holdout to compare. The remaining groups are considered training data set. Then comes fitting the model to the training data and testing it on the test data, keeping the evaluation score and discarding the model.
In the phase of the FFQR model many combinations were used, changing the number of trees, number of leaves and quantile loss calculation in each experiment.
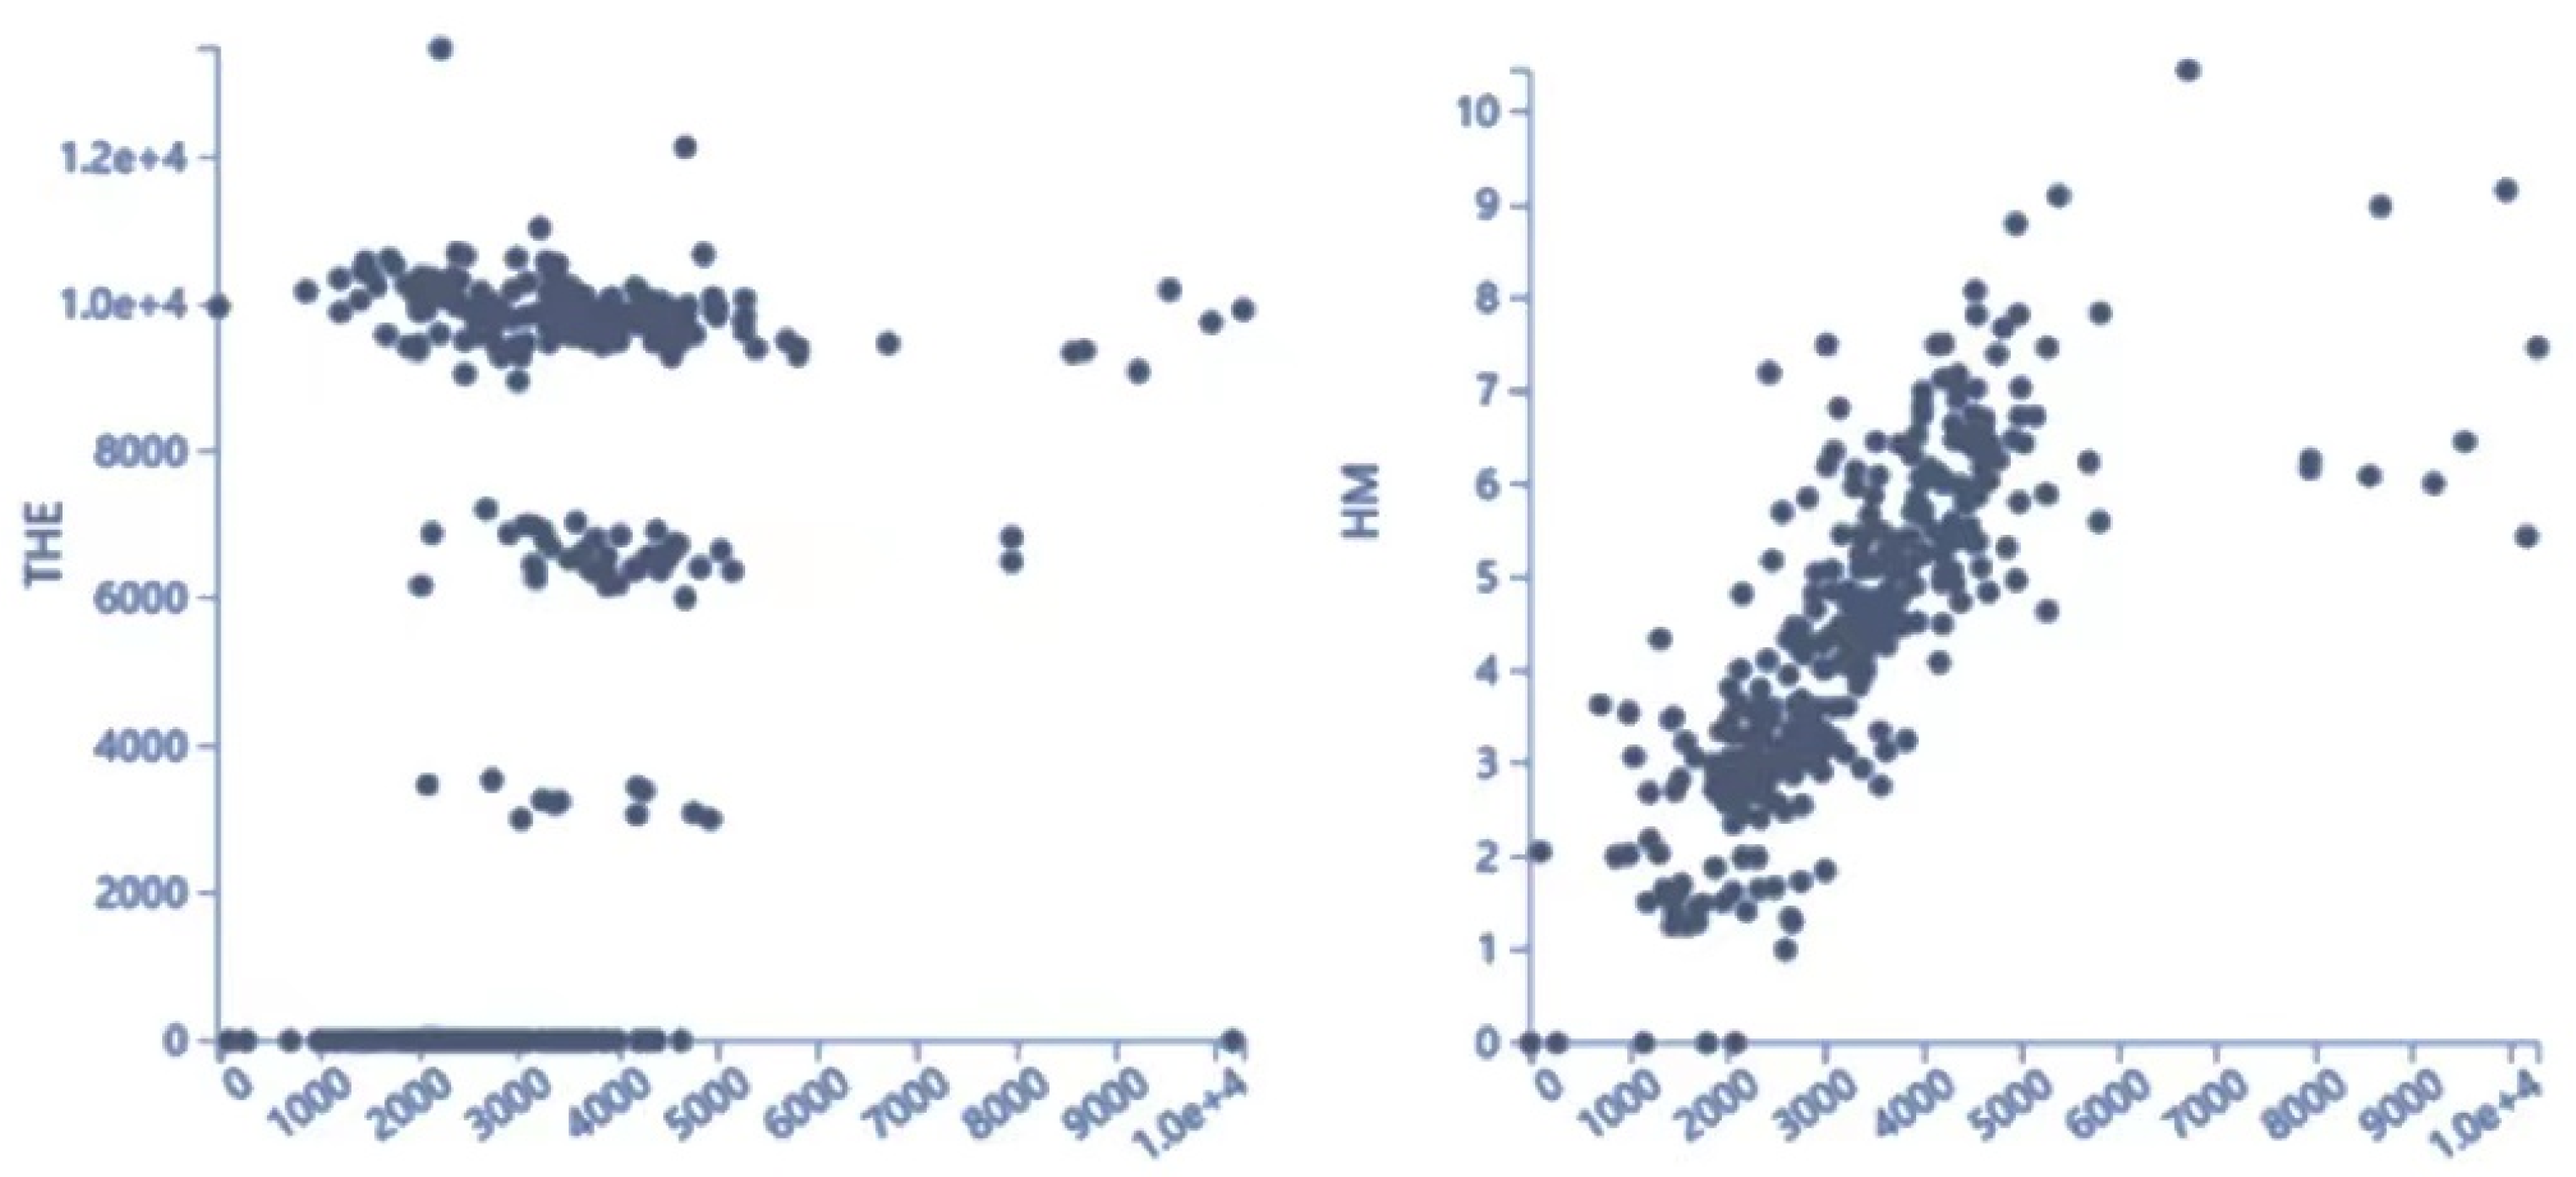
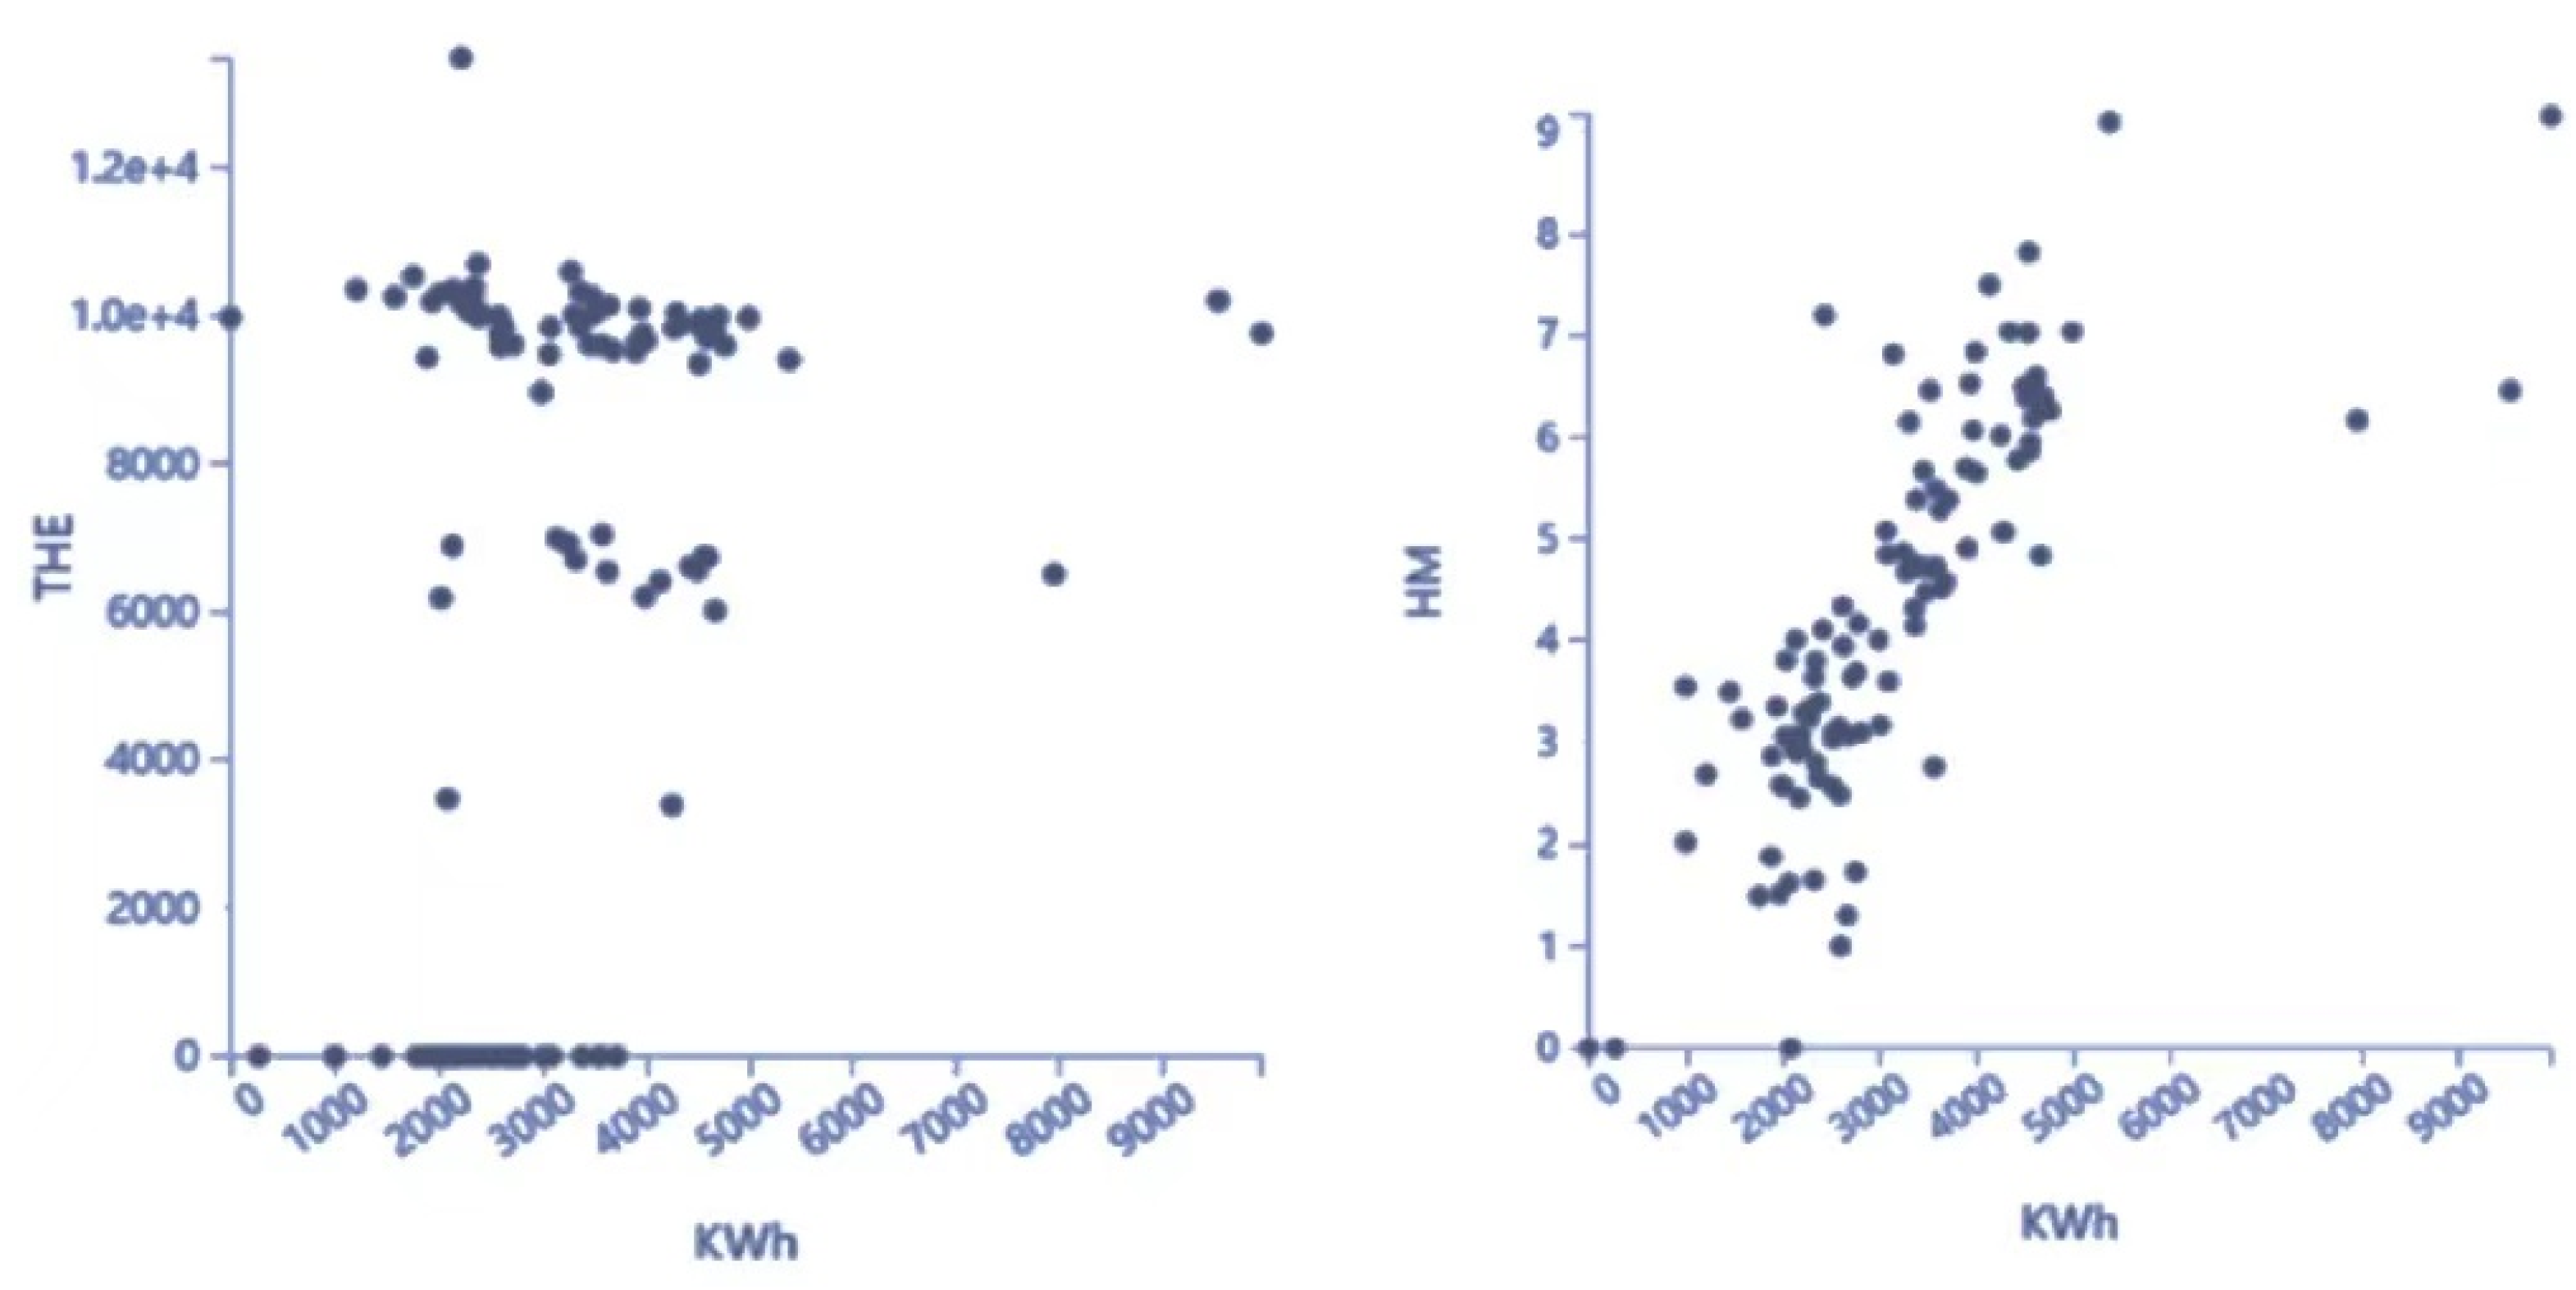
6.3. Experimental Results
In the first experiment, we used a low number of random trees and leaves and the quantile loss on average, as shown in
Figure 11,
Figure 12,
Figure 13 and
Figure 14, shows the high performance of the FFQR model:
Seventy percent of the dataset was reserved to train the model and 30% for the test.
Quantile loss: 0.250–219.358729
Quantile loss: 0.5–314.989019
Quantile loss: 0.750–410.619309
Average quantile loss: –314.989019
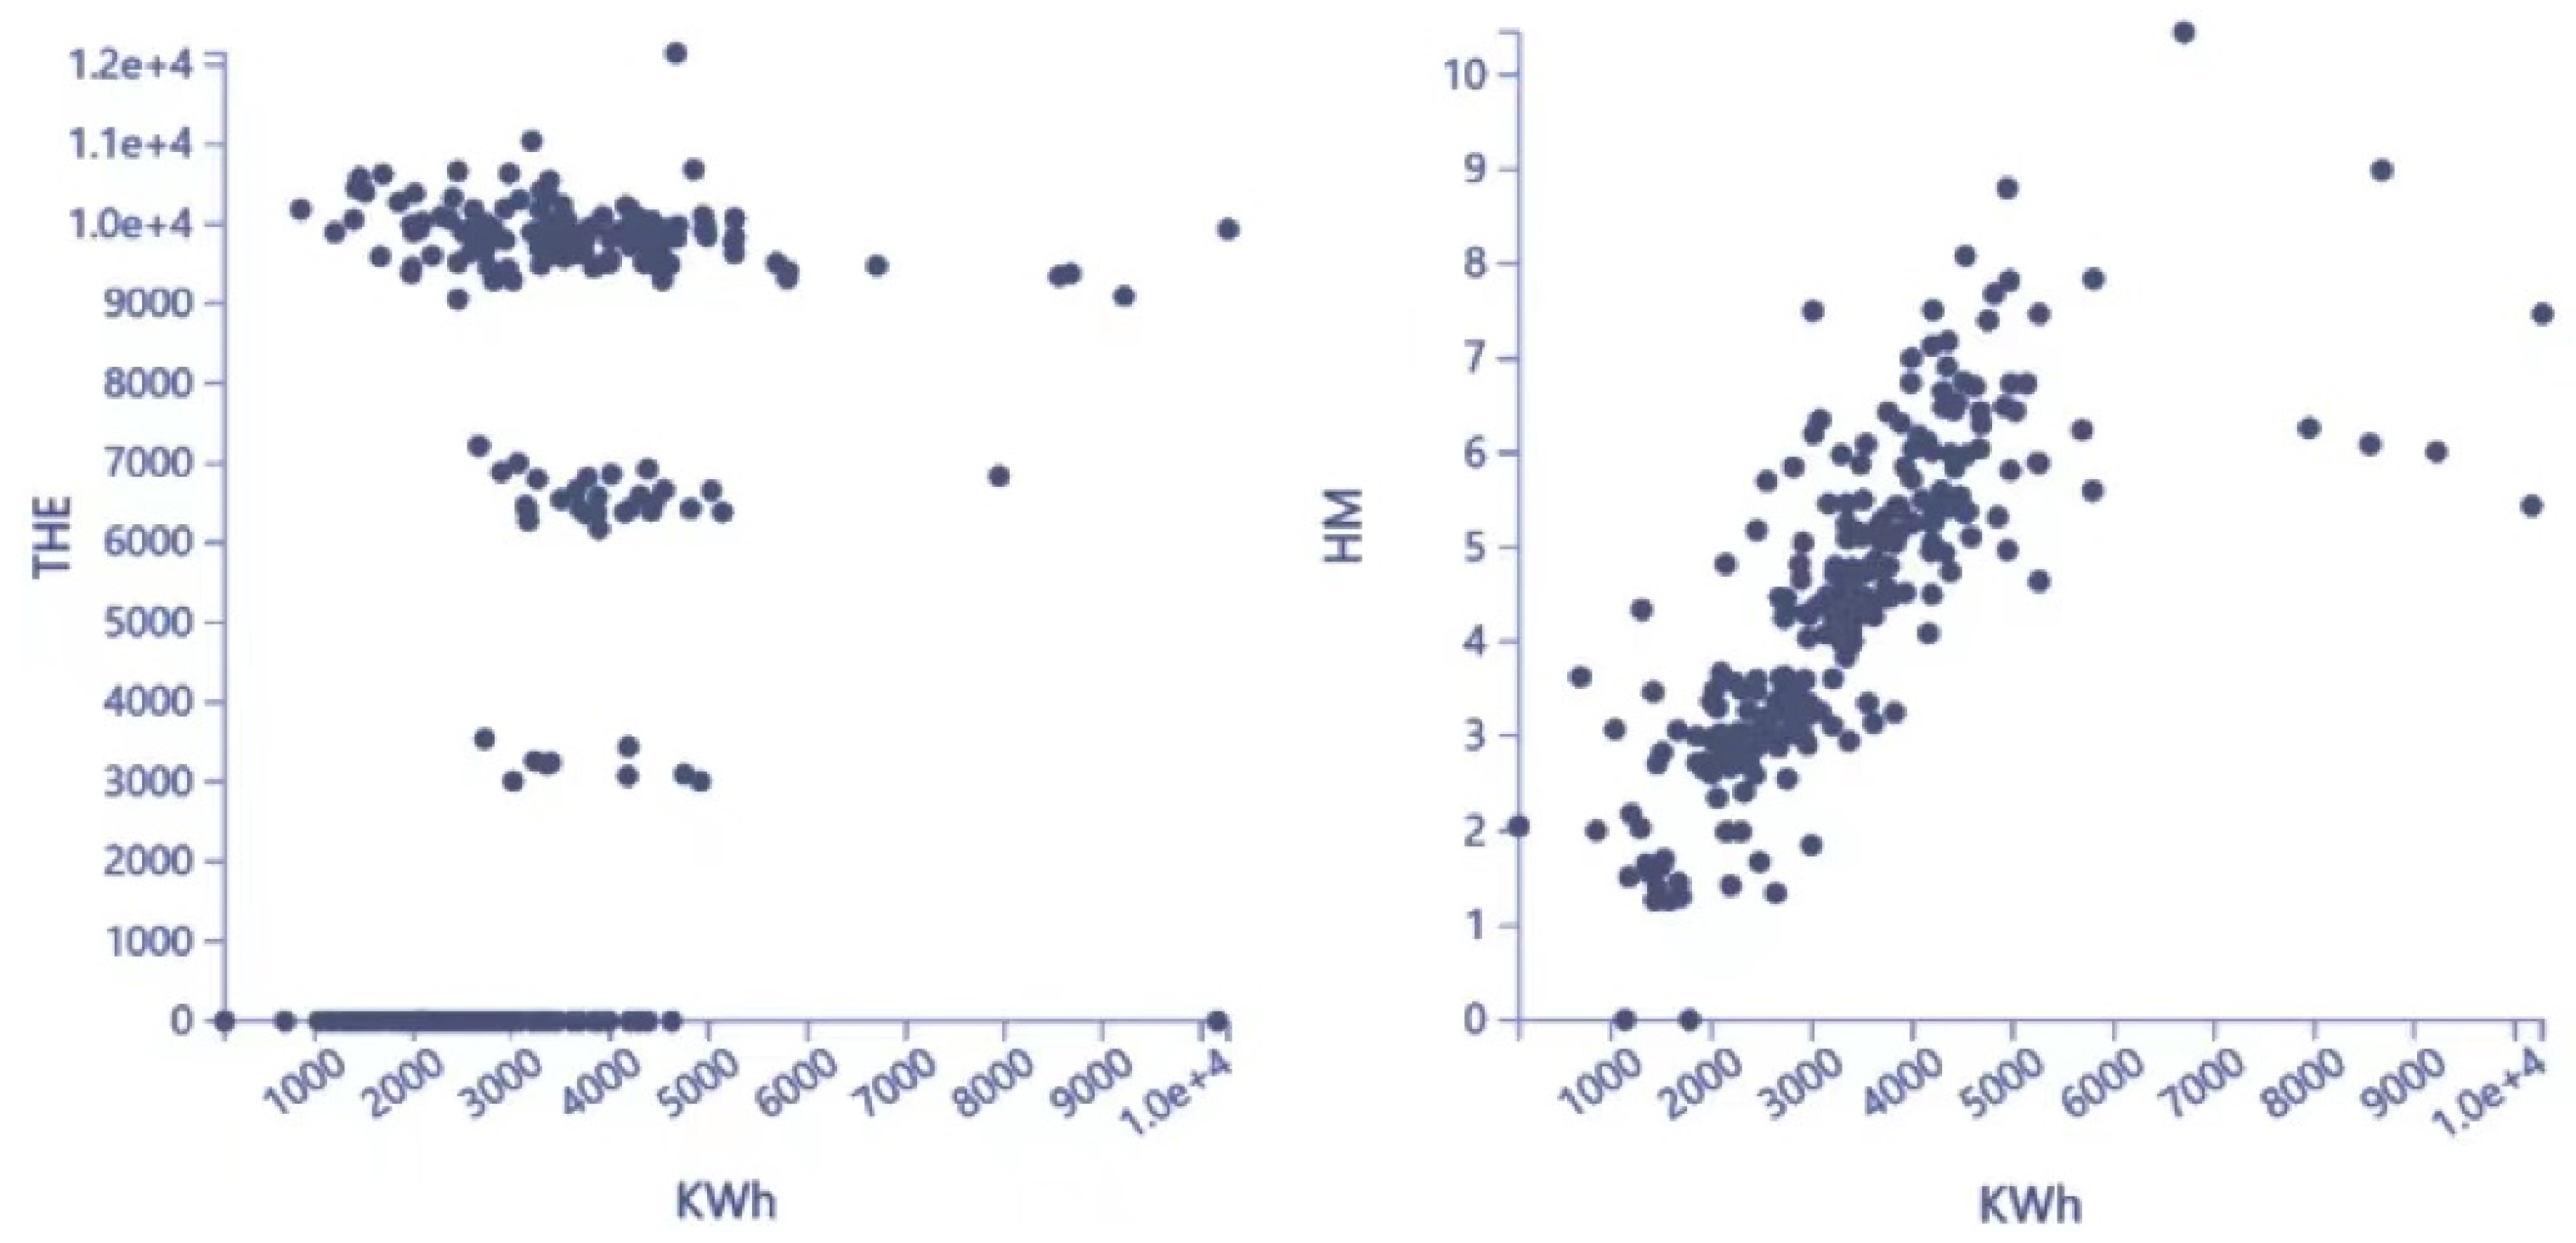
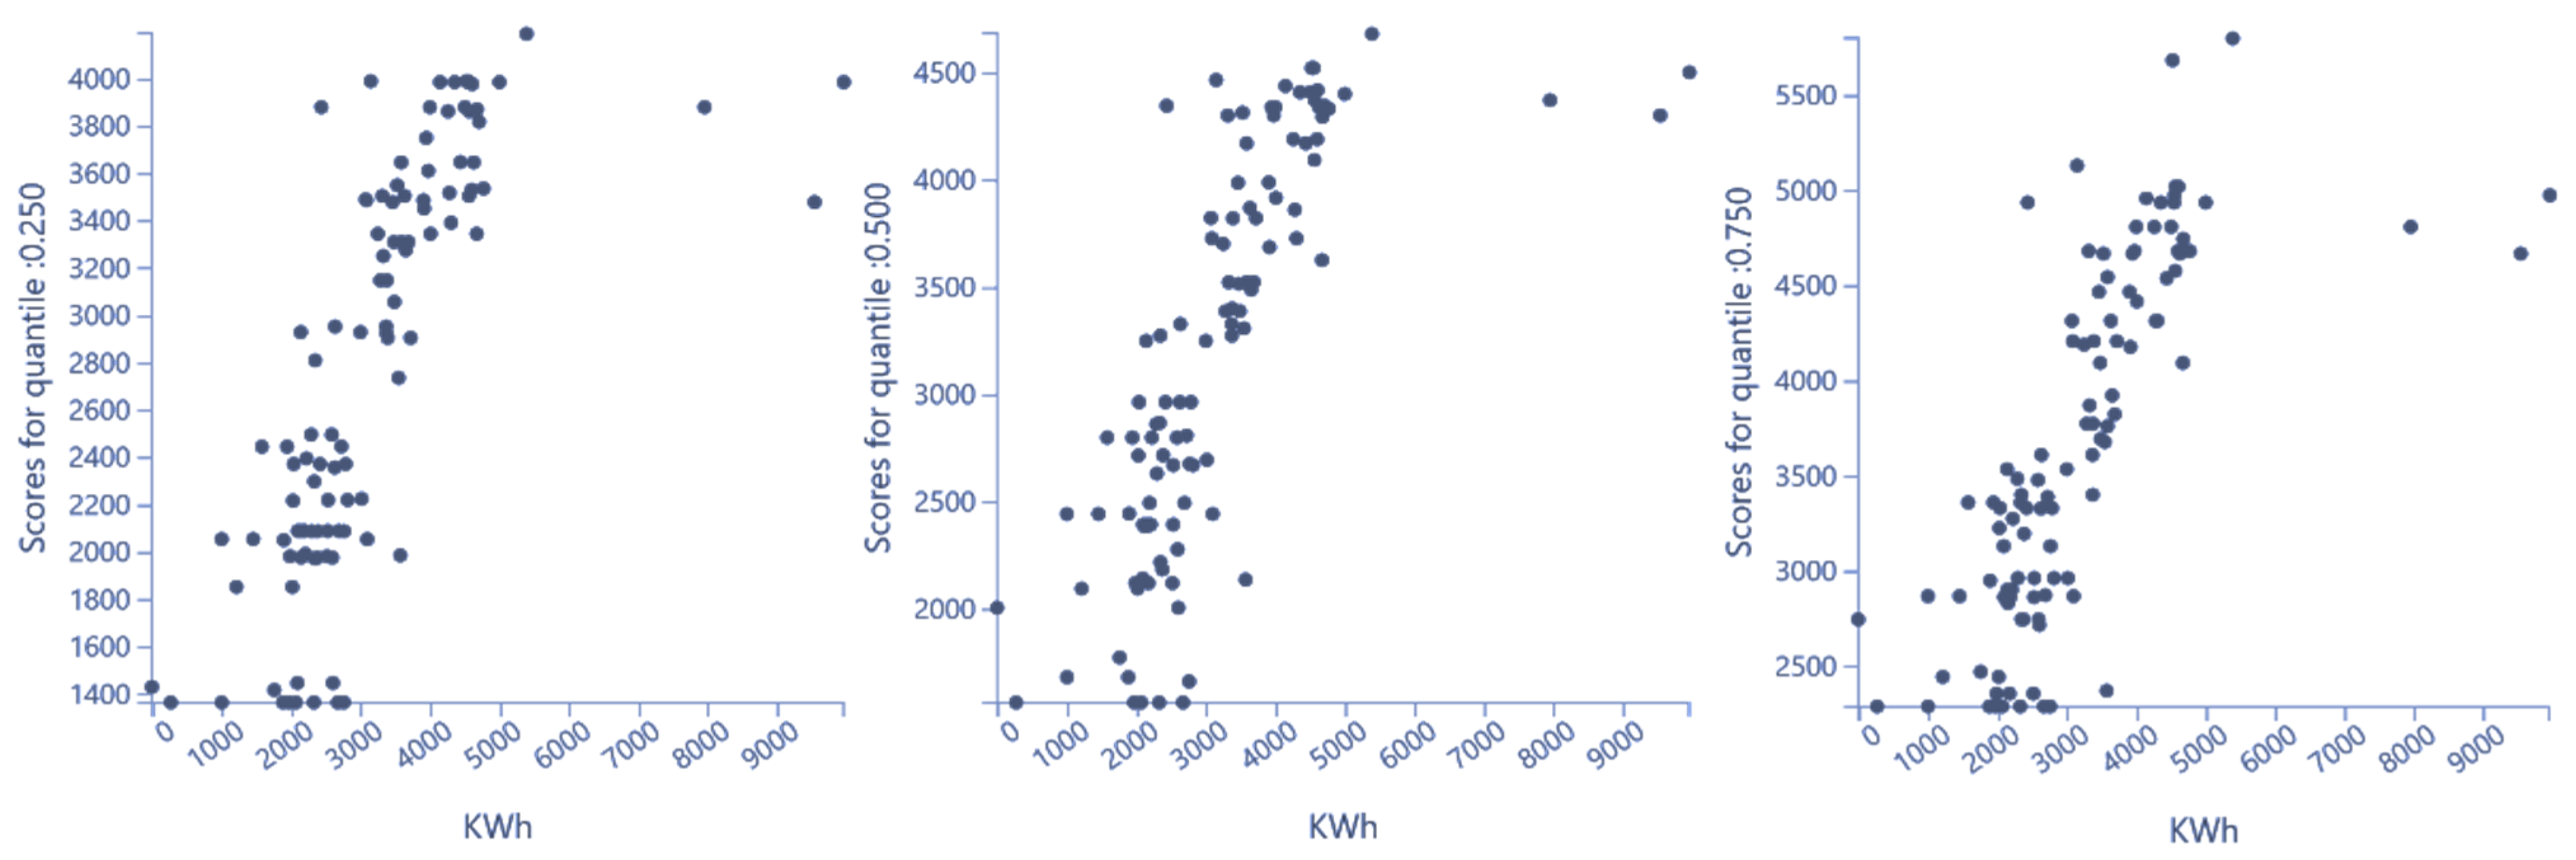
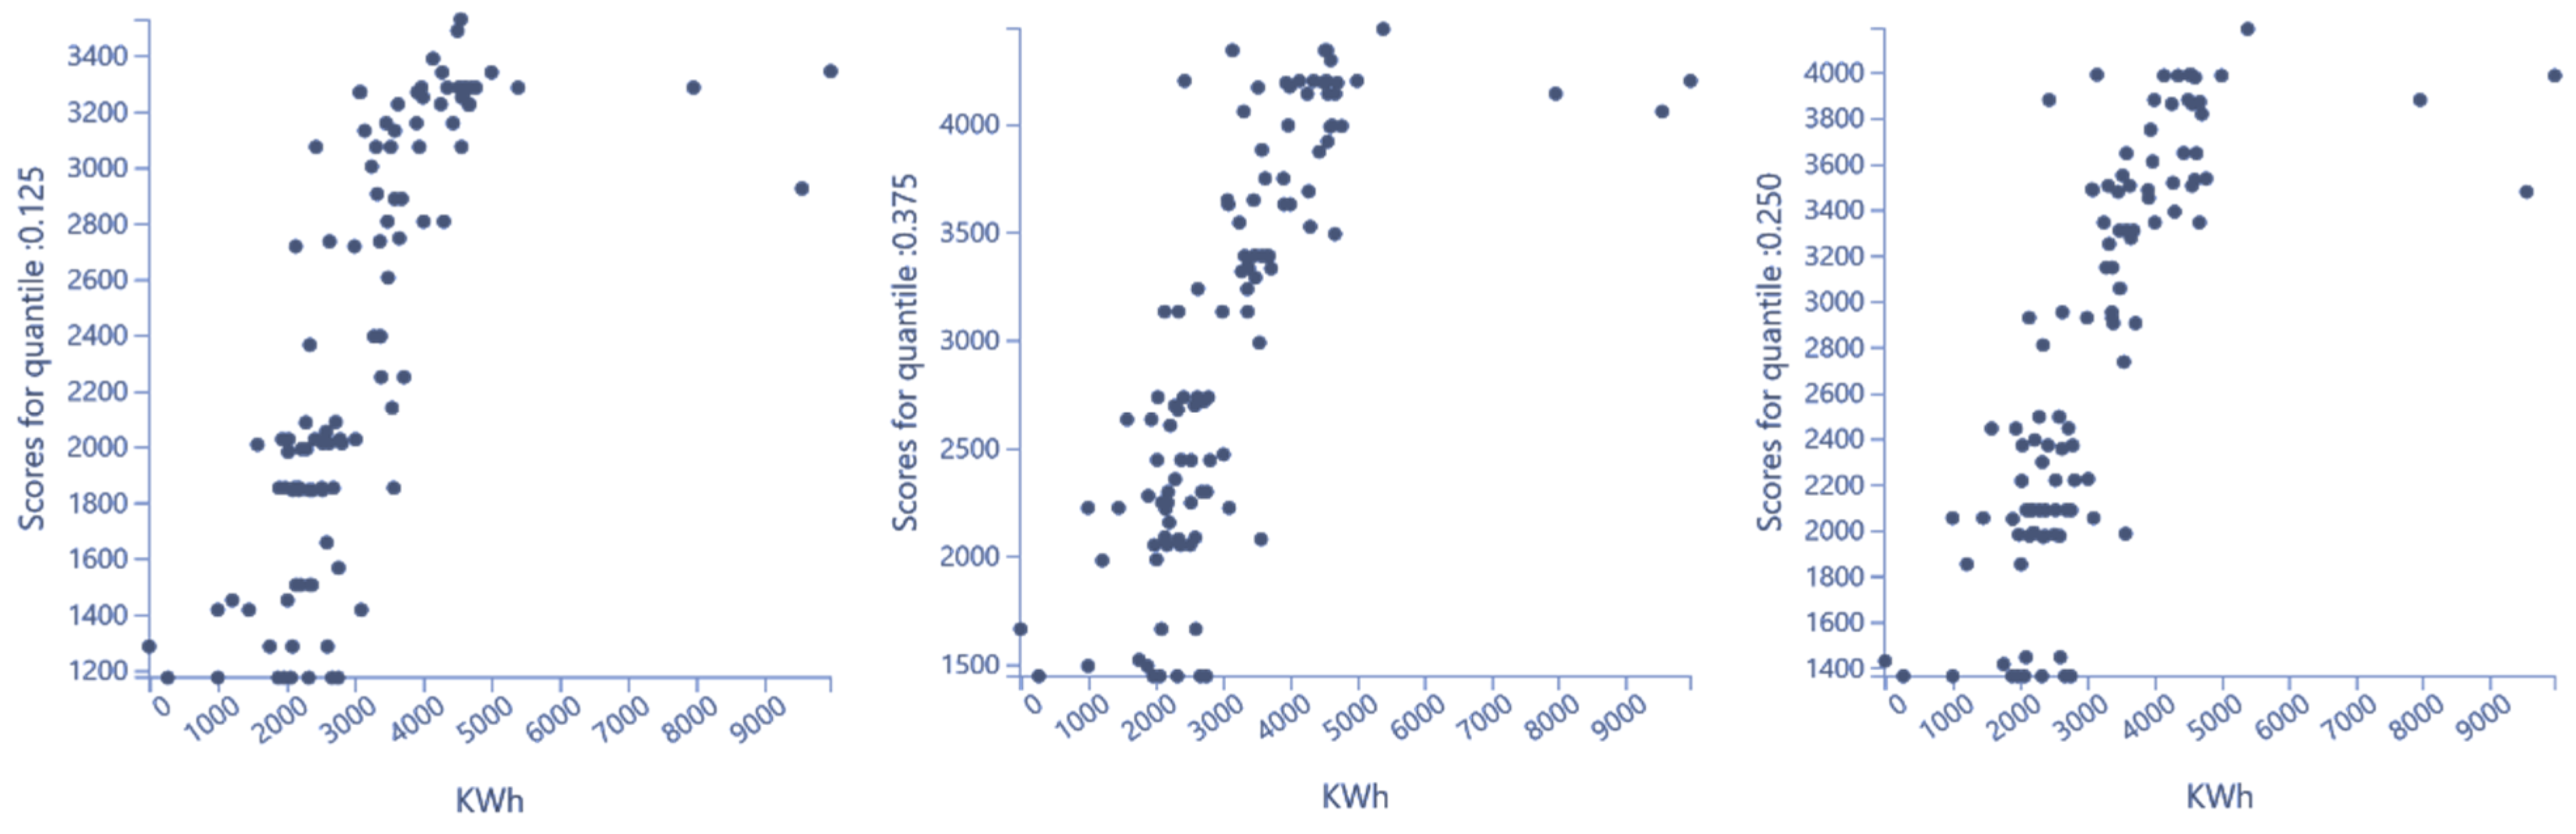
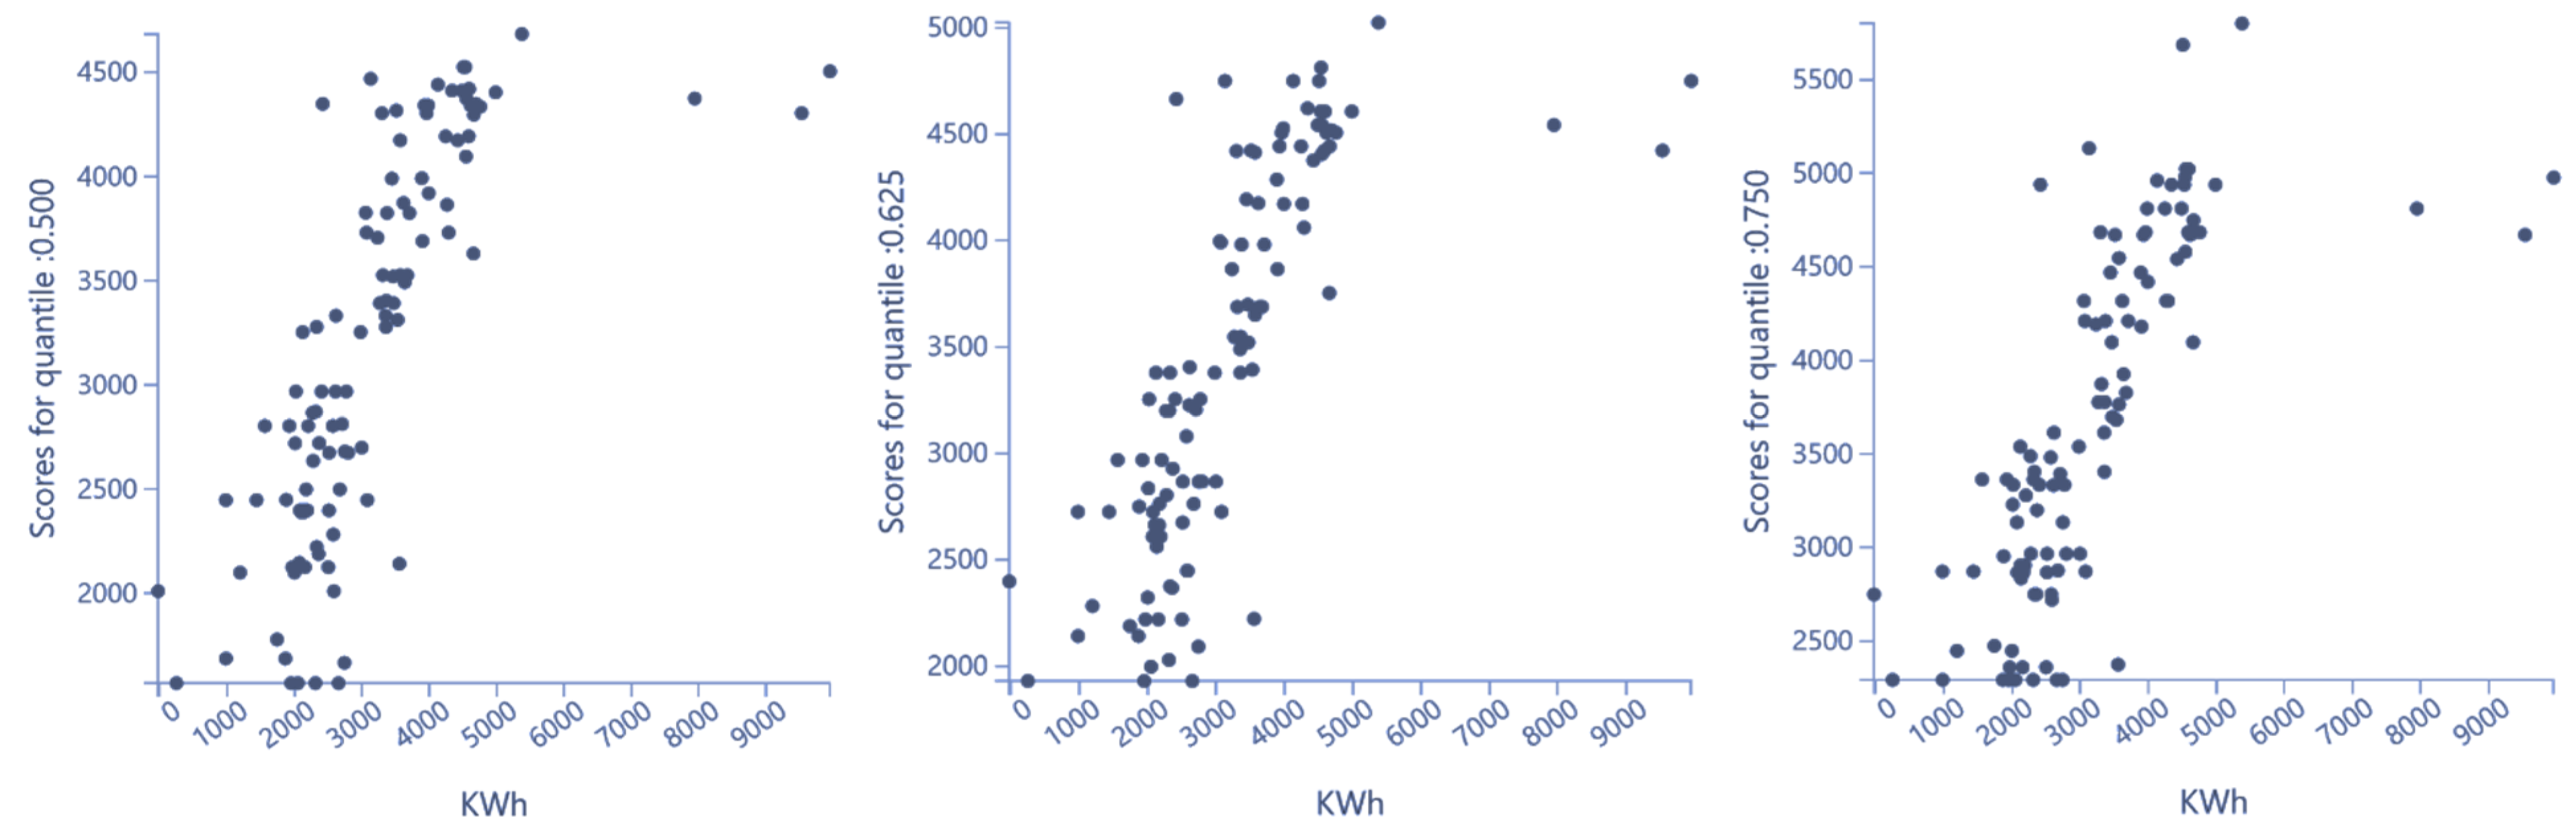
To validate the FFQR model, the second experiment used more random trees and leaves and increased the quantile losses as shown in
Figure 15,
Figure 16,
Figure 17 and
Figure 18 which are from the tested application:
Number of trees: 1000
Number of leaves: 200
Quantile loss: 12.5%, 25%, 37.5%, 50%, 62.5%, 75% and 87.5%
Seventy percent of the dataset was reserved to train the model and 30% for the test.
7. Open-Pit Mine Application
7.1. Introduction
After the design and requirements study, this section presents the current state of the smart energy management system’s proof of concept at the experimental open-pit mine. Before implementing the architecture in the field, a test bench was designed in order to test the communication protocols, the database connection, the SCADA system and the prediction algorithm.
7.2. Industrial Application in the Open-Pit Mine SEMS Architecture and Designed Test Bench
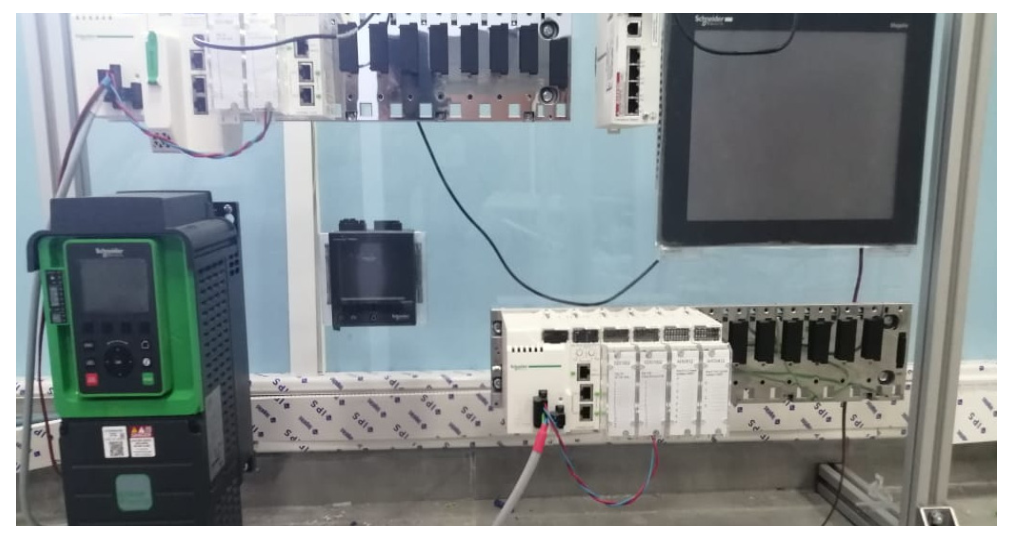
After studying the existent SCADA architecture in the field, we designed a prototype of the control system, using a Modicon M580 PLC, an MP8000power meter, a squirrel cage induction motor with a variable frequency drive. The PLC uses a wifi module to share data between other deported PLCs.
Figure 19 represents the test bench adding an HMI to visualize the data. The program is tested and built on the same PLC using Unity pro XI software.
The PLC is connected to a server that contains the database, using the Python program that retrieves data from the PLC Modbus protocol and inserts them into tables as a time series dataset, which is connected to both SCADA views using Citect SCADA software and to ThingsBoard for web browser connection.
7.3. SCADA Views
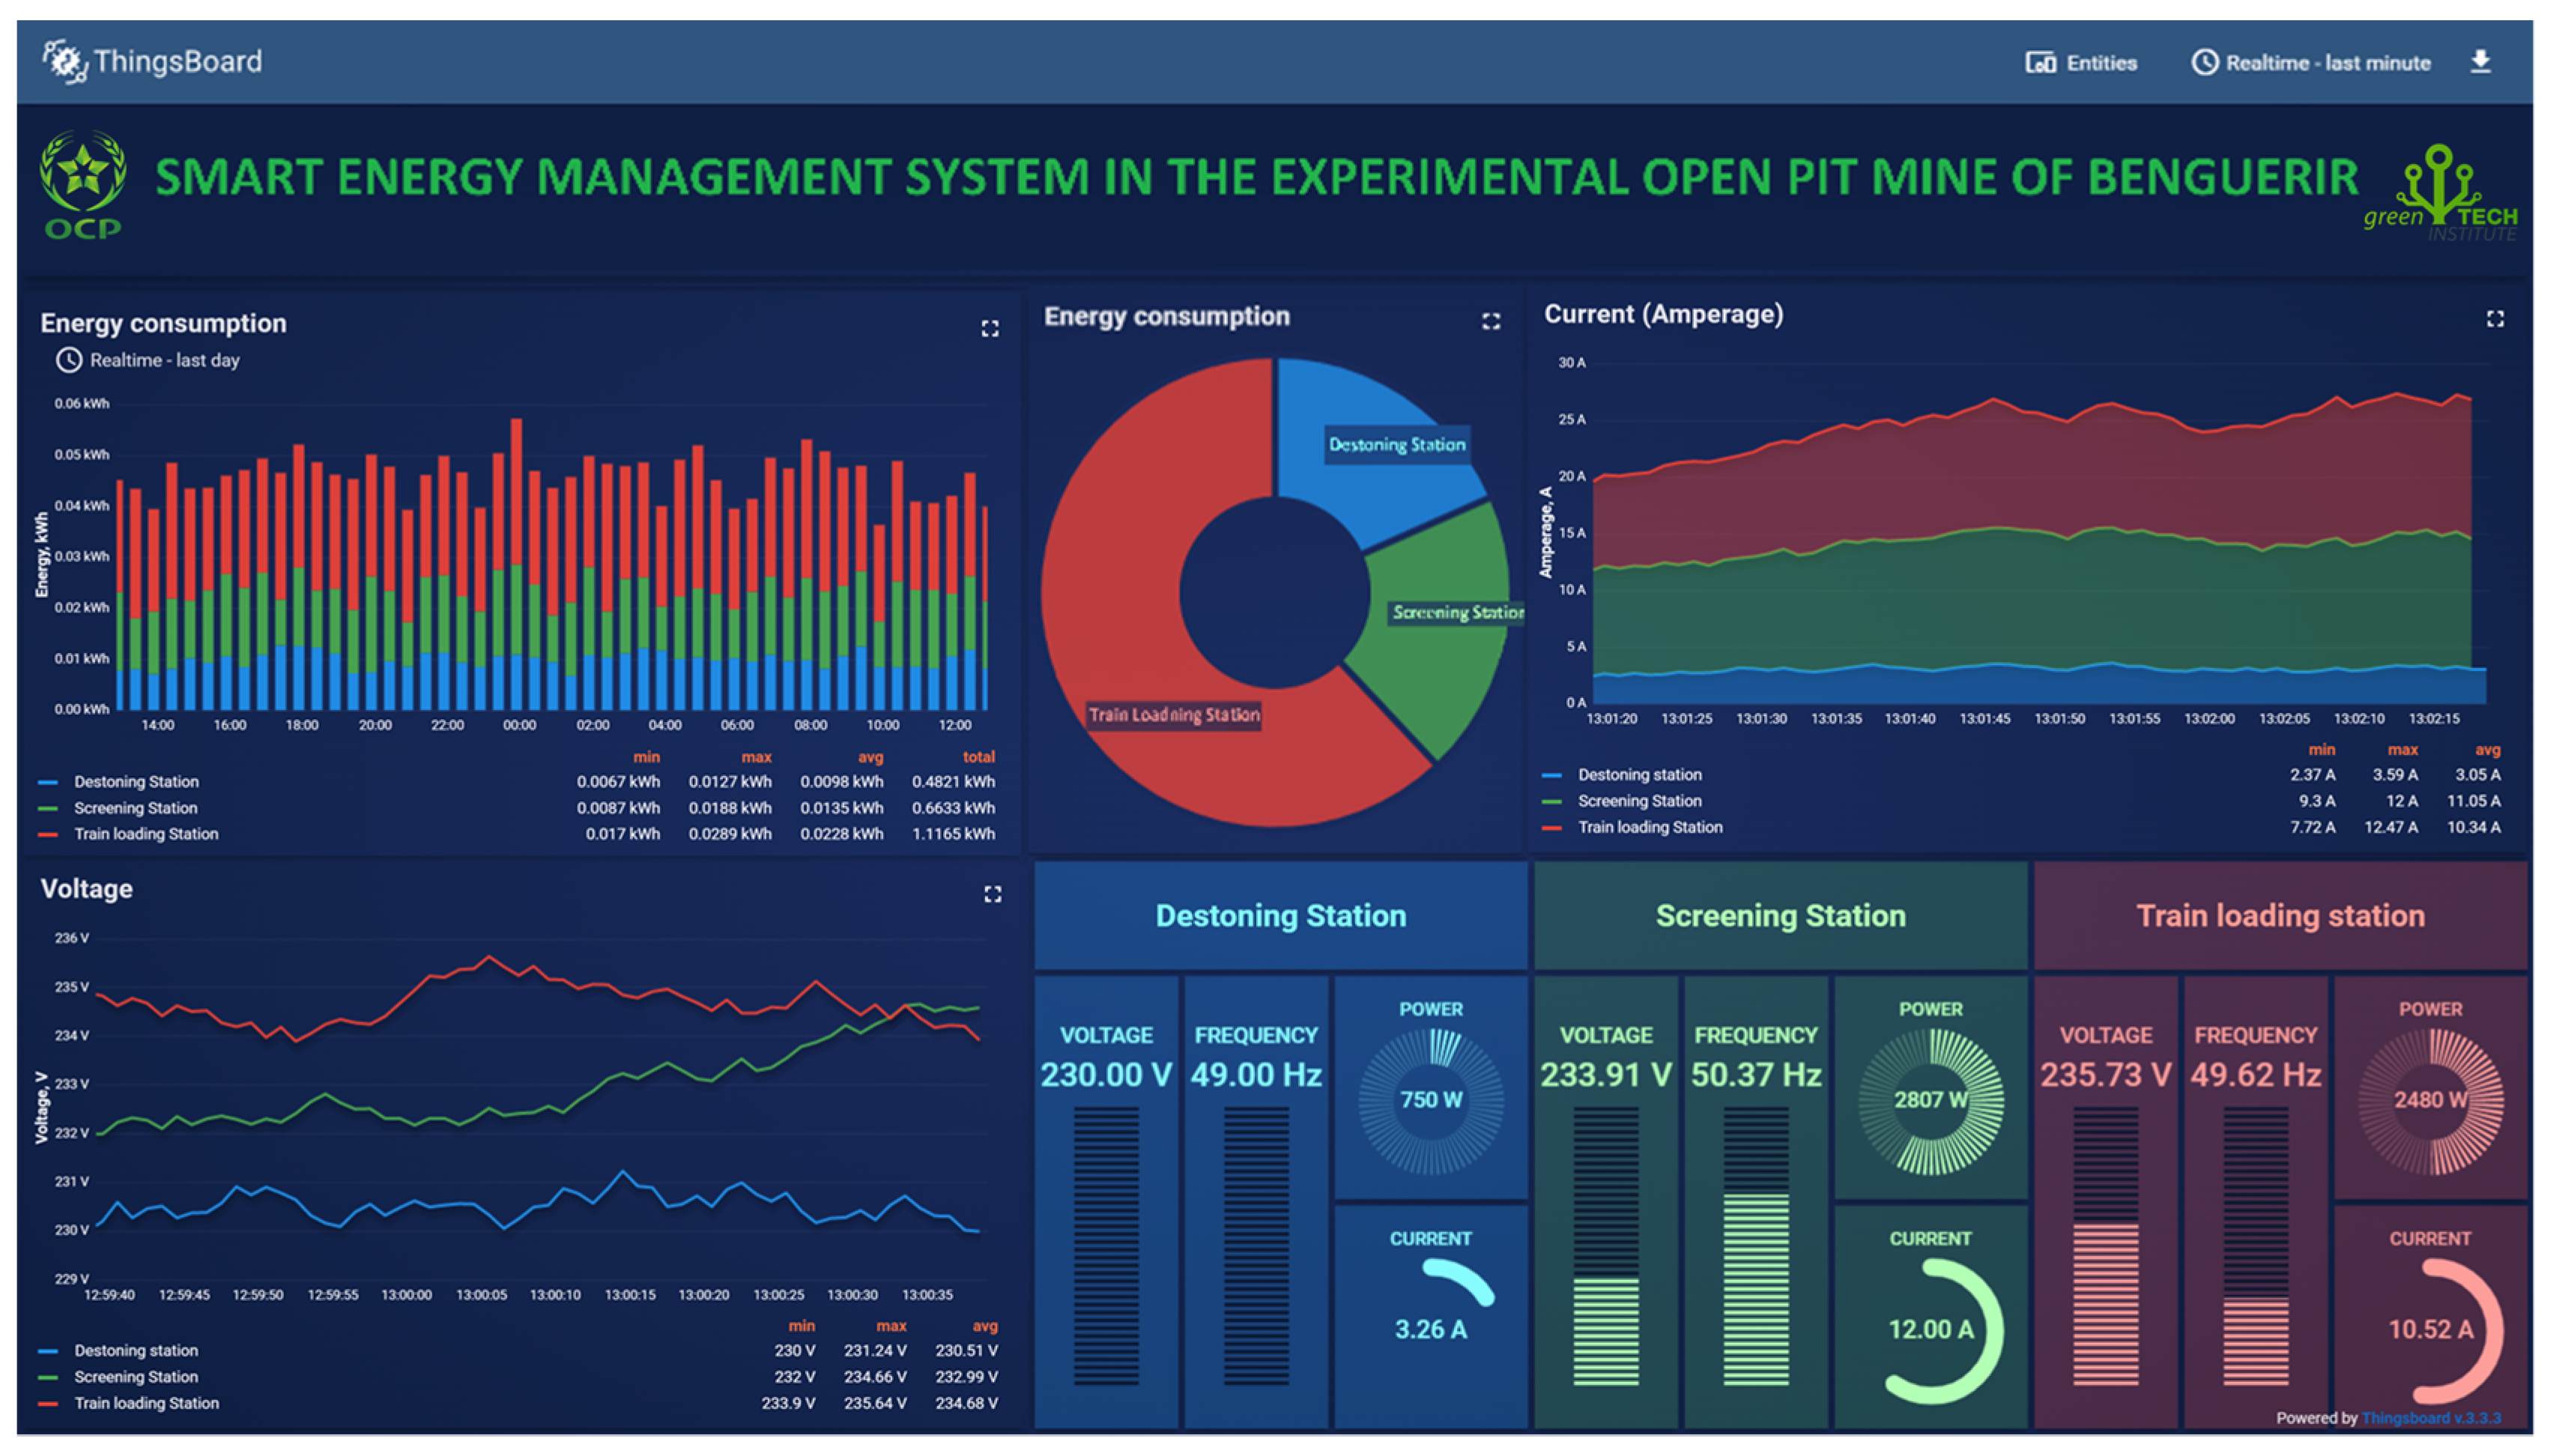
In this section, we have chosen two types of views for operators and field engineers, using Citect SCADA software and the ThingsBoard solution for the energy manager, where he or she can visualize all data and download reports without accessing the SCADA system.
Figure 20 shows the ThingsBoard for web browser access. This view is under design. The communication with the database has been done successfully; however, the implementation phase in the open-pit mine has not been done yet.
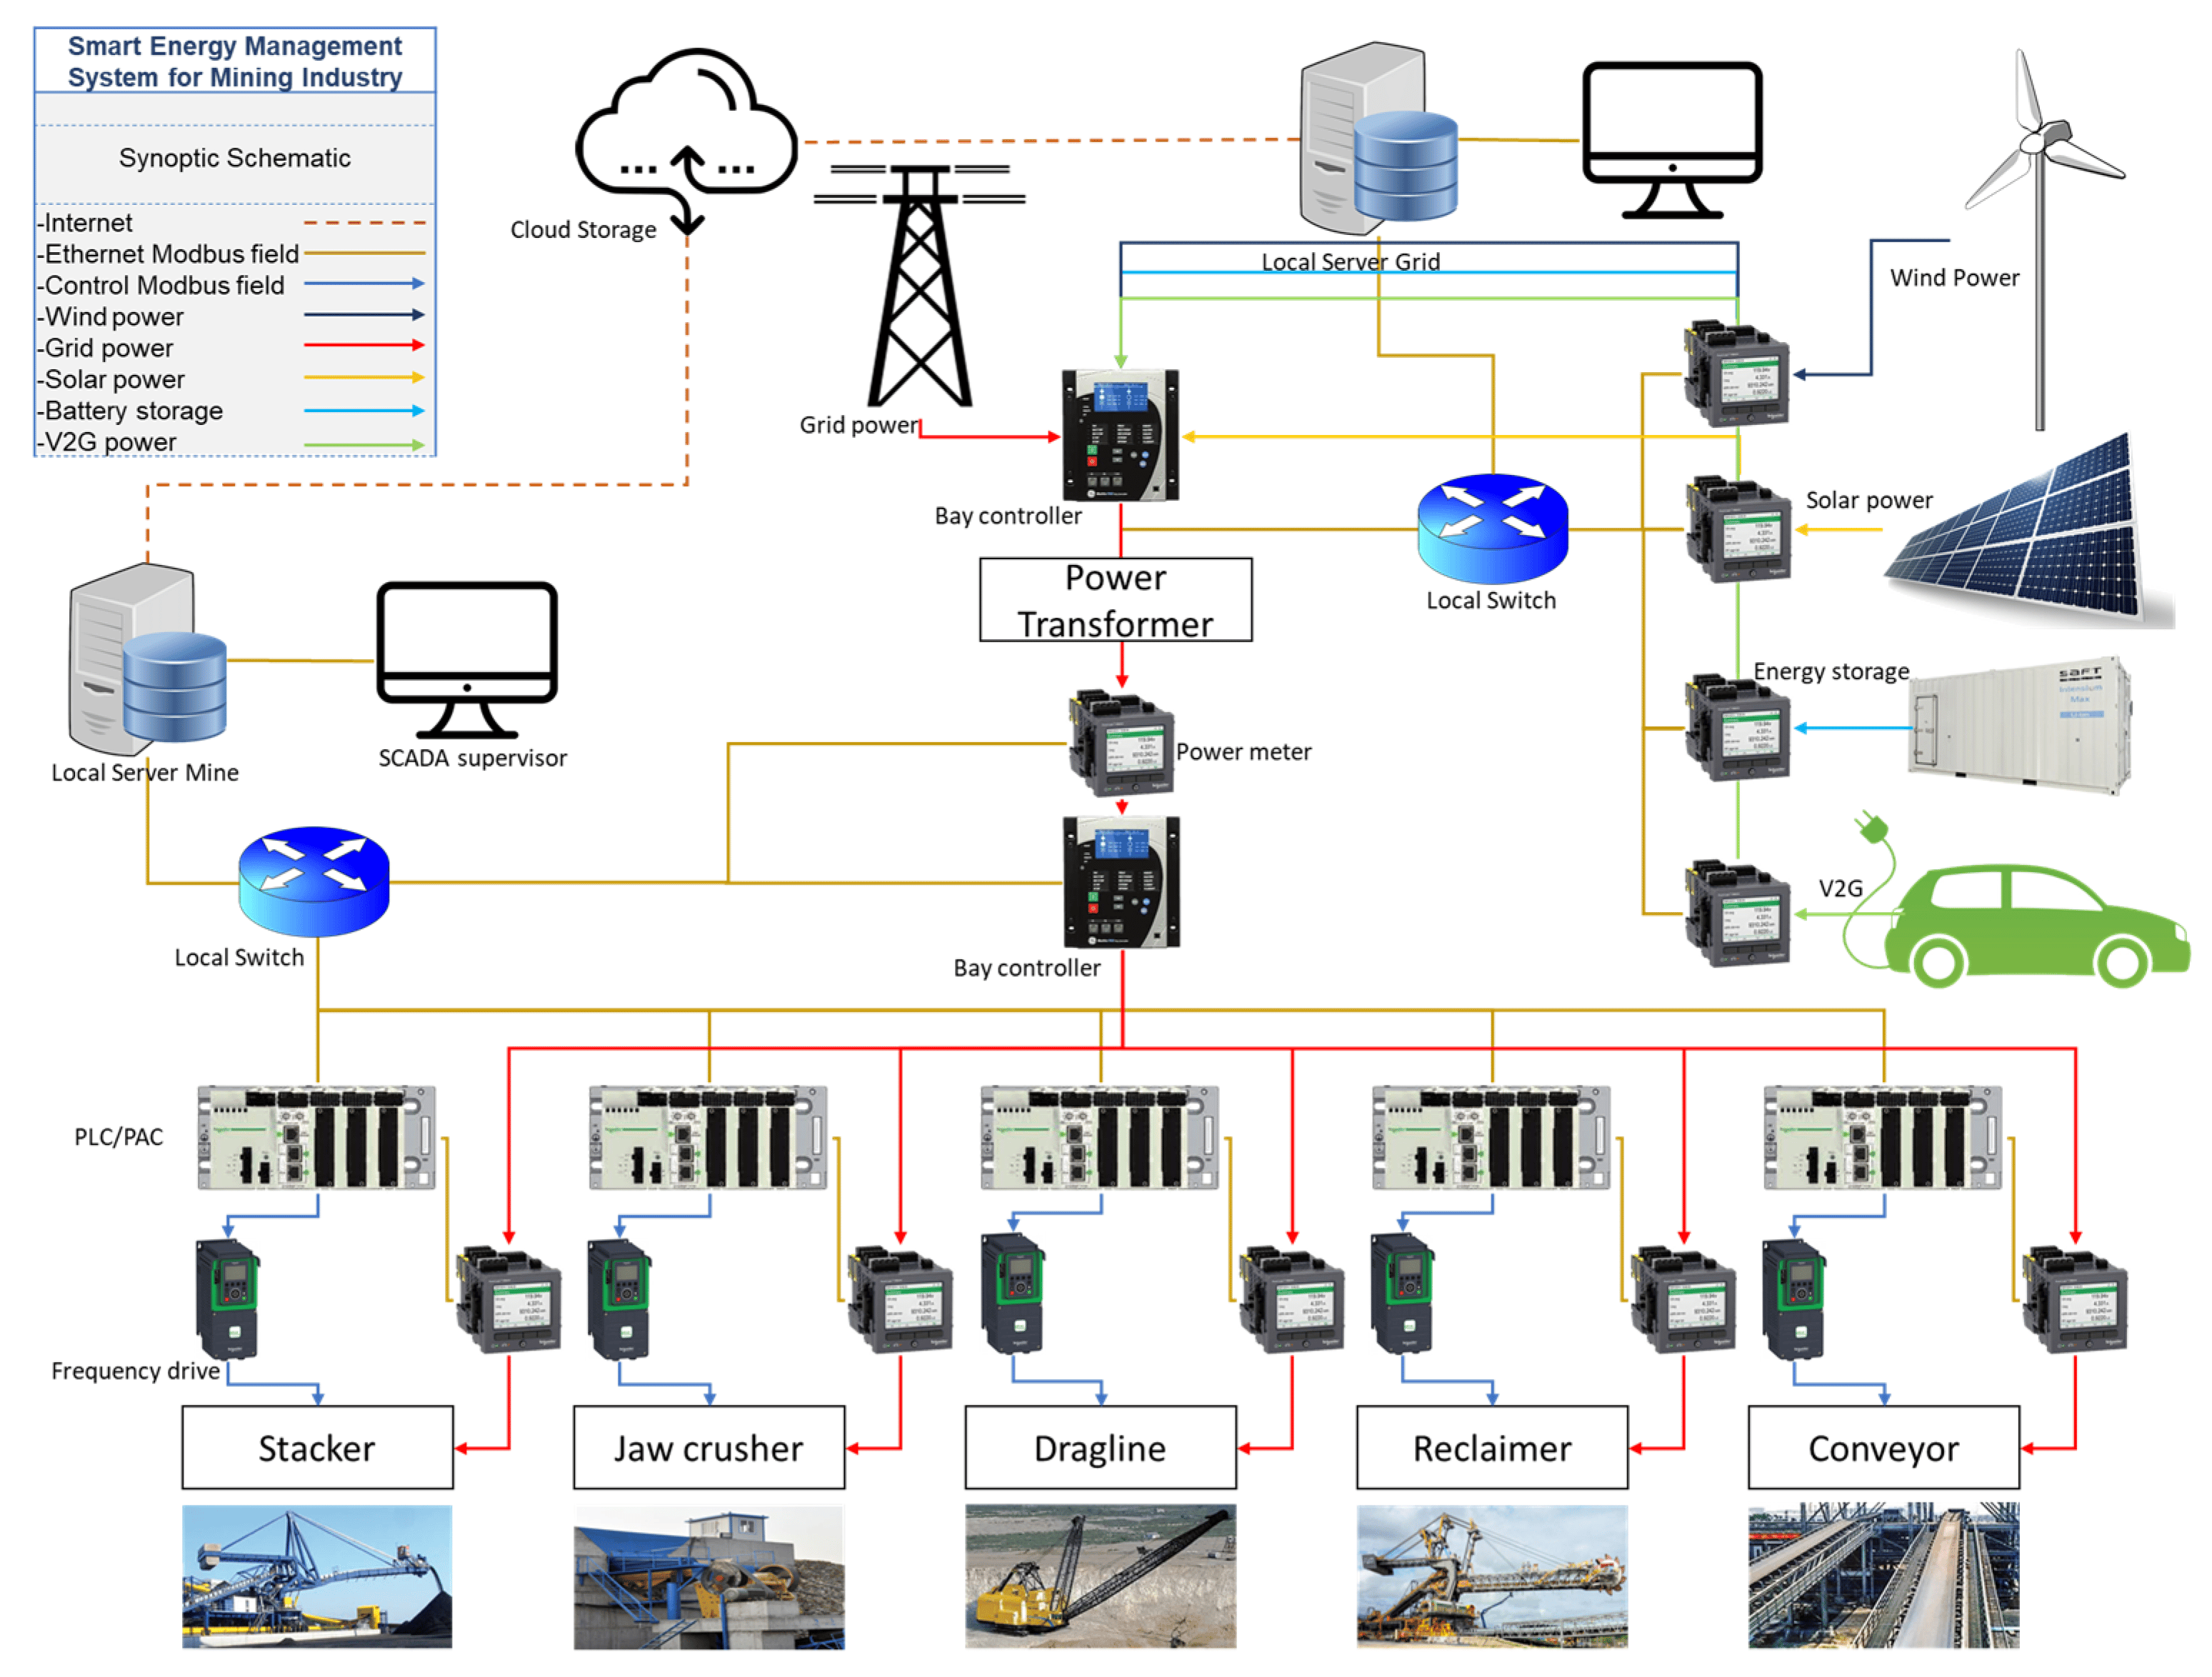
7.4. Inhanced Architecture toward Smart Grid Open-Pit Mine
The proposed application of the SMES is on an experimental open-pit mine application, using power meters of different machines, mainly, draglines, jaw crushers, conveyors, bucketwheel reclaimers and stackers, to collect energy consumption data and then then understanding their behaviors at different times of year and different production constraint scenarios. These power meters are interfaced with programmable logic controllers (PLC), and distributed control systems (DCS) [
33], which apply the decisions and control directly the motors in order to optimize energy consumption. The same type of power meters shown in
Figure 11 are connected to renewable energy sources in case the open-pit mine has photovoltaic, wind power, electric vehicles [
34], or any other type of energy storage, for a global monitoring system integrating sources and loads. As shown in
Figure 21 a smart micro grid dedicated for mining industry open pit is developed integrating different communication protocols and energy flow.
8. Conclusions
This work is the result of implementing a new smart energy management system architecture in the experimental open-pit mine of Benguerir. The proposed system is based on higher requirements and integrating different smart grid features as modular solutions with multiple layers. This infrastructure will be used for energy monitoring respecting the ISO 50001 standards, as a transition toward energy 4.0 in the concept of digitization, which represents the first layer of the smart energy management system. The implementation phases and steps were described regarding the requirements and the challenges, and they should be token as best practices.
The first step was listing the important grid key performance indicators to monitor, then choosing and installing the required sensors, which are power meters. The third step is to interface the developed system with the existing SCADA. A layer of internet of things was added into the architecture of the smart energy management system in the mining industry where the data are being transferred wirelessly in real time into the servers. The tests as mentioned were done in the laboratory using Schneider PLCs, power meters, variable frequency drives and communication modules, these tests were mandatory before passing to implementation in the field of the open-pit mine.
The algorithm used in this application is the fast forest quantile regression which is used in many energy forecasting applications, as mentioned in the comparative table and in the state of art. The algorithm shows good performance with a set of 100 trees and 20 leaves in different quantiles. The use of an energy forecasting and prediction algorithm in the system and linking it with the SCADA system will help to predict the energy demand and make energy efficiency decisions easy to take, easing the work of the energy manager.
In future work, and after acquiring more data, the use of other algorithms such as neural network regressions, stochastic models, time series and others will be tested to compete with the proposed algorithm. The infrastructure is still under testing and validation, which will be enhanced with other renewable energy sources to empower the experimental open-pit mine into a smart microgrid, where other control and shedding optimization techniques will be tested for research and educational purposes.
Supplementary Materials
The following supporting information can be downloaded at:
https://www.mdpi.com/article/10.3390/asi5010018/s1, SDataset+Code+API: The dataset contain an example of energy consumption, Functioning hours and Production KPI of different stages of the experimental open pit mine, mainly the destoning, the screening, and the train loading station. The Code is an example of the prediction algorithm, and the API can be used to apply the same algorithm used in this article.
Author Contributions
Conceptualization, O.L., M.B. and A.C.; methodology, O.L., M.B. and A.C.; validation, O.L., M.B. and A.C.; formal analysis, O.L.; investigation, O.L., M.B. and A.C.; resources, O.L., M.B. and A.C.; data curation, O.L.; writing—original draft preparation, O.L. and A.C.; writing—review and editing O.L., M.B. and A.C.; visualization, O.L., M.B. and A.C.; supervision, O.L., M.B. and A.C.; project administration, O.L., M.B. and A.C.; funding acquisition, O.L. and A.C. All authors have read and agreed to the published version of the manuscript.
Funding
This research was funded by OCP and TTO of UM6P and tested at the experimental open-pit mine at Benguerir.
Institutional Review Board Statement
Not applicable.
Informed Consent Statement
Not applicable.
Data Availability Statement
The data used in this study were provided by OCP and the TTO under the Automation Project where O.L is the Principle Investigator and the Project Manager, which is a part of the Experimental Open pit mine program. Readers could obtain example of the dataset code using python and API from
Supplementary Materials.
Conflicts of Interest
The authors declare no conflict of interest.
References
- Carvalho, A.V.; Chouchene, A.; Lima, T.M.; Charrua-Santos, F. Cognitive Manufacturing in Industry 4.0 toward Cognitive Load Reduction: A Conceptual Framework. Appl. Syst. Innov. 2020, 3, 55. [Google Scholar] [CrossRef]
- ISO 50001; Energy Management Systems. ISO: Geneva, Switzerland, 2018. Available online: https://www.iso.org/iso-50001-energy-management.html (accessed on 20 September 2021).
- Laayati, O.; Bouzi, M.; Chebak, A. Smart energy management: Energy consumption metering, monitoring and prediction for mining industry. In Proceedings of the 2020 IEEE 2nd International Conference on Electronics, Control, Optimization and Computer Science (ICECOCS), Kenitra, Morocco, 2–3 December 2020; pp. 1–5. [Google Scholar] [CrossRef]
- Chen, H.; Xie, C.; Dai, J.; Cen, E.; Li, J. SCADA Data-Based Working Condition Classification for Condition Assessment of Wind Turbine Main Transmission System. Energies 2021, 14, 7043. [Google Scholar] [CrossRef]
- Bayrak, G.; Ertekin, D.; Alhelou, H.H.; Siano, P. A Real-Time Energy Management System Design for a Developed PV-Based Distributed Generator Considering the Grid Code Requirements in Turkey. Energies 2021, 14, 6684. [Google Scholar] [CrossRef]
- Mda Rocha, V.G.; Hell, M.B.; Alves, K.S.T.R.; Oliveira, F.L.C.; de Aguiar, E.P. Power Transformers Thermal Modeling using an Enhanced Set-Membership Multivariable Gaussian Evolving Fuzzy System. Electr. Power Syst. Res. 2021, 194, 107088. [Google Scholar] [CrossRef]
- Elamin, N.; Fukushige, M. Quantile Regression Model for Peak Load Demand Forecasting with Approximation by Triangular Distribution to Avoid Blackouts. Int. J. Energy Econ. Policy 2018, 8, 119–124. [Google Scholar]
- Laayati, O.; Bouzi, M.; Chebak, A. Smart Energy Management System: SCIM Diagnosis and Failure Classification and Prediction Using Energy Consumption Data. In Digital Technologies and Applications; Motahhir, S., Bossoufi, B., Eds.; Springer International Publishing: Cham, Switzerland, 2021; Volume 211, pp. 1377–1386. [Google Scholar] [CrossRef]
- Hui, H.; Ding, Y.; Shi, Q.; Li, F.; Song, Y.; Yan, J. 5G network-based Internet of Things for demand response in smart grid: A survey on application potential. Appl. Energy 2020, 257, 113972. [Google Scholar] [CrossRef]
- Amabile, L.; Bresch-Pietri, D.; Hajje, G.E.; Labbé, S.; Petit, N. Optimizing the self-consumption of residential photovoltaic energy and quantification of the impact of production forecast uncertainties. Adv. Appl. Energy 2021, 2, 100020. [Google Scholar] [CrossRef]
- Zhang, W.; Quan, H.; Srinivasan, D. Parallel and reliable probabilistic load forecasting via quantile regression forest and quantile determination. Energy 2018, 160, 810–819. [Google Scholar] [CrossRef]
- Aqueveque, P.; Wiechmann, E.P.; Henriquez, J.A.; Munoz, L.G. Energy Quality and Efficiency of an Open Pit Mine Distribution System: Evaluation and Solution. IEEE Trans. Ind. Applicat. 2016, 52, 580–588. [Google Scholar] [CrossRef]
- Laayati, O.; Bouzi, M.; Chebak, A. Design of an oil immersed power transformer monitoring and self diagnostic system integrated in Smart Energy Management System. In Proceedings of the 2021 3rd Global Power, Energy and Communication Conference (GPECOM), Antalya, Turkey, 5–8 October 2021; pp. 240–245. [Google Scholar] [CrossRef]
- Panda, D.K.; Das, S. Smart Grid Architecture Model for Control, Optimization and Data Analytics of Future Power Networks with More Renewable Energy. J. Clean. Prod. 2021, 301, 126877. [Google Scholar] [CrossRef]
- Balwani, M.R.; Thirumala, K.; Mohan, V.; Bu, S.; Thomas, M.S. Development of a Smart Meter for Power Quality-Based Tariff Implementation in a Smart Grid. Energies 2021, 14, 6171. [Google Scholar] [CrossRef]
- Nawaz, R.; Akhtar, R.; Shahid, M.A.; Qureshi, I.M.; Mahmood, M.H. Machine learning based false data injection in smart grid. Int. J. Electr. Power Energy Syst. 2021, 130, 106819. [Google Scholar] [CrossRef]
- Oliveira, E.E.; Miguéis, V.L.; Guimarães, L.; Borges, J. Power Transformer Failure Prediction: Classification in Imbalanced Time Series. U. Porto J. Eng. 2018, 3, 34–48. [Google Scholar] [CrossRef]
- Moshood, T.D.; Nawanir, G.; Sorooshian, S.; Okfalisa, O. Digital Twins Driven Supply Chain Visibility within Logistics: A New Paradigm for Future Logistics. Appl. Syst. Innov. 2021, 4, 29. [Google Scholar] [CrossRef]
- Kirpes, B.; Mengelkamp, E.; Schaal, G.; Weinhardt, C. Design of a microgrid local energy market on a blockchain-based information system. Inf. Technol. 2019, 61, 87–99. [Google Scholar] [CrossRef]
- Yuan, G.; Wang, H.; Khazaei, E.; Khan, B. Collaborative advanced machine learning techniques in optimal energy management of hybrid AC/DC IoT-based microgrids. Ad. Hoc. Netw. 2021, 122, 102657. [Google Scholar] [CrossRef]
- Rosero, D.G.; Díaz, N.L.; Trujillo, C.L. Cloud and machine learning experiments applied to the energy management in a microgrid cluster. Appl. Energy 2021, 304, 117770. [Google Scholar] [CrossRef]
- Musbah, H.; Ali, G.; Aly, H.H.; Little, T.A. Energy management using multi-criteria decision making and machine learning classification algorithms for intelligent system. Electr. Power Syst. Res. 2022, 203, 107645. [Google Scholar] [CrossRef]
- Yuan, D.; Lu, Z.; Zhang, J.; Li, X. A hybrid prediction-based microgrid energy management strategy considering demand-side response and data interruption. Int. J. Electr. Power Energy Syst. 2019, 113, 139–153. [Google Scholar] [CrossRef]
- Torossian, L.; Picheny, V.; Faivre, R.; Garivier, A. A review on quantile regression for stochastic computer experiments. Reliab. Eng. Syst. Saf. 2020, 201, 106858. [Google Scholar] [CrossRef]
- Awan, U.; Knight, I. Domestic sector energy demand and prediction models for Punjab Pakistan. J. Build. Eng. 2020, 32, 101790. [Google Scholar] [CrossRef]
- Kanda, I.; Veguillas, J.M.Q. Data preprocessing and quantile regression for probabilistic load forecasting in the GEFCom2017 final match. Int. J. Forecast. 2019, 35, 1460–1468. [Google Scholar] [CrossRef]
- Mbungu, N.T.; Bansal, R.C.; Naidoo, R.M.; Bettayeb, M.; Siti, M.W.; Bipath, M. A dynamic energy management system using smart metering. Appl. Energy 2020, 280, 115990. [Google Scholar] [CrossRef]
- Badenhorst, W.; Zhang, J.; Xia, X. Optimal hoist scheduling of a deep level mine twin rock winder system for demand side management. Electr. Power Syst. Res. 2011, 81, 1088–1095. [Google Scholar] [CrossRef][Green Version]
- ISO 50006; Energy Management Systems. ISO: Geneva, Switzerland, 2014. Available online: https://www.iso.org/standard/51869.html (accessed on 20 September 2021).
- IEC 61557-12; Electrical Safety in Low Voltage Distribution Systems up to 1 000 V AC and 1 500 V DC. IEC: Geneva, Switzerland, 2018. Available online: https://webstore.iec.ch/preview/info_iec61557-12%7Bed2.0.RLV%7Den.pdf (accessed on 20 September 2021).
- IEC 62974-1; Monitoring and Measuring Systems used for Data Collection, Gathering and Analysis. IEC: Geneva, Switzerland, 2018. Available online: https://standards.iteh.ai/catalog/standards/iec/d29c8479-8b3a-473a-b4e4-fbca08cc9e5f/iec-62974-1-2017 (accessed on 20 September 2021).
- ISO IEC 17799; Security Techniques. IEC: Geneva, Switzerland, 2005. Available online: https://www.iso.org/standard/39612.html (accessed on 20 September 2021).
- Shi, Y.; Tuan, H.D.; Savkin, A.V.; Lin, C.-T.; Zhu, J.G.; Poor, H.V. Distributed model predictive control for joint coordination of demand response and optimal power flow with renewables in smart grid. Appl. Energy 2021, 290, 116701. [Google Scholar] [CrossRef]
- Musbah, H.; Aly, H.H.; Little, T.A. Energy management of hybrid energy system sources based on machine learning classification algorithms. Electr. Power Syst. Res. 2021, 199, 107436. [Google Scholar] [CrossRef]
| Publisher’s Note: MDPI stays neutral with regard to jurisdictional claims in published maps and institutional affiliations. |
© 2022 by the authors. Licensee MDPI, Basel, Switzerland. This article is an open access article distributed under the terms and conditions of the Creative Commons Attribution (CC BY) license (https://creativecommons.org/licenses/by/4.0/).


