1. Introduction
Complex systems are referred to as systems that are composed of many independent system elements playing a key role in the whole system’s behavior. Although the independent system elements follow their own logic and behavior, and interact among themselves, such elements define the dynamic behavior observed in a collectively complex system. Based on the principles of complexity science, the complexity of any system can be characterized by understanding the relations, interactions, and behavior of the constituent system elements. Systems can be formalized by two distinctions, disorganized complexity, and organized complexity [
1]. Disorganized complexity is a result of many constituent independent system elements. In such a case, the system elements interact among several others, contributing to random system behavior. To understand such a system, statistical and probabilistic methods are usually used. By comparison, organized complexity comprises non-random behavior of the system elements where the number of parts need not be large for the system to be knowledge emergent. Properties of such a system can be understood with the help of simulations and various modeling techniques. It is to be noted that the whole idea of a complex system is still uncertain, based on the fact that it differs in terms of its definition, understanding, and concept between authors according to their perspectives [
2]. To provide a few frequently contested definitions [
3] of complex systems over the years:
“
Complex systems are those with many strongly interdependent variables. This excludes systems with only a few effective variables, the kind we meet in elementary dynamics. It also excludes systems with many independent variables; we learn how to deal with them in elementary statistical mechanics. Complexity appears where coupling is important but doesn’t freeze out most degrees of freedom” [
4].
“
Complex system can be defined as a system with large number of components, often called agents or constituent system elements, that interact, adapt and learn” [
5].
“
Complex systems exhibit several defining characteristics, including feedback, strongly interdependent variables, extreme sensitivity to initial conditions, fractal geometry, and self-organized criticality, multiple metastable states, and a non-gaussian distribution of outputs” [
6].
“
Systems that tend to be robust and at the same time capable of producing large events. They can attain equilibria, both fixed pints and simple patterns, as well as produce long random sequence” [
7].
“
Complex Systems are composed out of interdependent parts and violate the ergodic theorem. They have many degrees of freedom whose time dependence is very slow on a microscopic scale” [
8].
The varying perspectives on complex systems are spearheading the development of several metrics in the literature to measure systems complexity. These include identifying system complexity based on requirements difficulty, stakeholder relationships, and several similar other measures. However, these measures are not exhaustive, considering the difficulty in accurately measuring systems complexity [
3]. As an attempt to contribute to the scientific body of knowledge that addresses understanding systems complexity, this paper illustrates a framework to characterize complex systems based on the concept of Information Entropy, using a two-stage examination method.
The novelty of the proposed approach lies in establishing a translatable framework across complex system domains to use information entropy. This includes incorporating a well-established and validated statistical foundation that shall be able to assess the relationships between sub-systems/components of a complex system, provide information to understand a system, assess and identify the interaction patterns of components/sub-systems in a system, and be able to differentiate between the input and output information of a system. Further, the approach illustrated enables the identification of driving and reacting components/sub-systems of a complex system.
A parallel can be drawn between information entropy and system complexity, where, as a system evolves or changes its state, the entropy will also change. This helps to identify entropy in a complex system as a function of the systems components, and their interactions. Supporting this relationship is the theorization that entropy is a special case applicable to system of systems based on combination of change in information and system disorder, where the increase in information leads to an increase in disorder, also known as entropy [
9]. Further, information in a system can be contemplated as an enabler for sub-systems to interact among themselves [
9]. System components (in this case, sub-systems of a complex system) and their interactions take information as an anchor that drives a change in a system, thus supporting the statement “Entropy in a complex system is a function of the system components and their interactions”.
To test the applicability of the parallel drawn to information entropy, in this paper a research question is formulated:
Q1. Can information entropy help in quantitatively characterizing a complex system?
To address this question, first a two-stage examination method is identified to introduce a structured thought regarding the application of information theory to different systems. Then, a simulation-based case study is introduced with tailored information entropy-based metrics developed to aid in portraying the application of information entropy in complex networks, systems with low structural rigidity (i.e., unpredictable sub-system interactions), and high information gain.
The reminder of this paper is structured as follows.
Section 2 expands on the agnostic two-stage examination framework used.
Section 3 provides a background on the concept of entropy and its interpretations, along with the foundation of entropy from information theory justifying the approach adopted in answering the research question.
Section 4 provides an overview and definition of complex networks, followed by the case study illustrating entropy-based metric development and its application to complex networks in
Section 5. Finally, the discussion and conclusions on the applicability of information theory to understand and characterize complex systems are identified in
Section 6.
2. Agnostic Two-Stage Examination Structure for Complex Systems
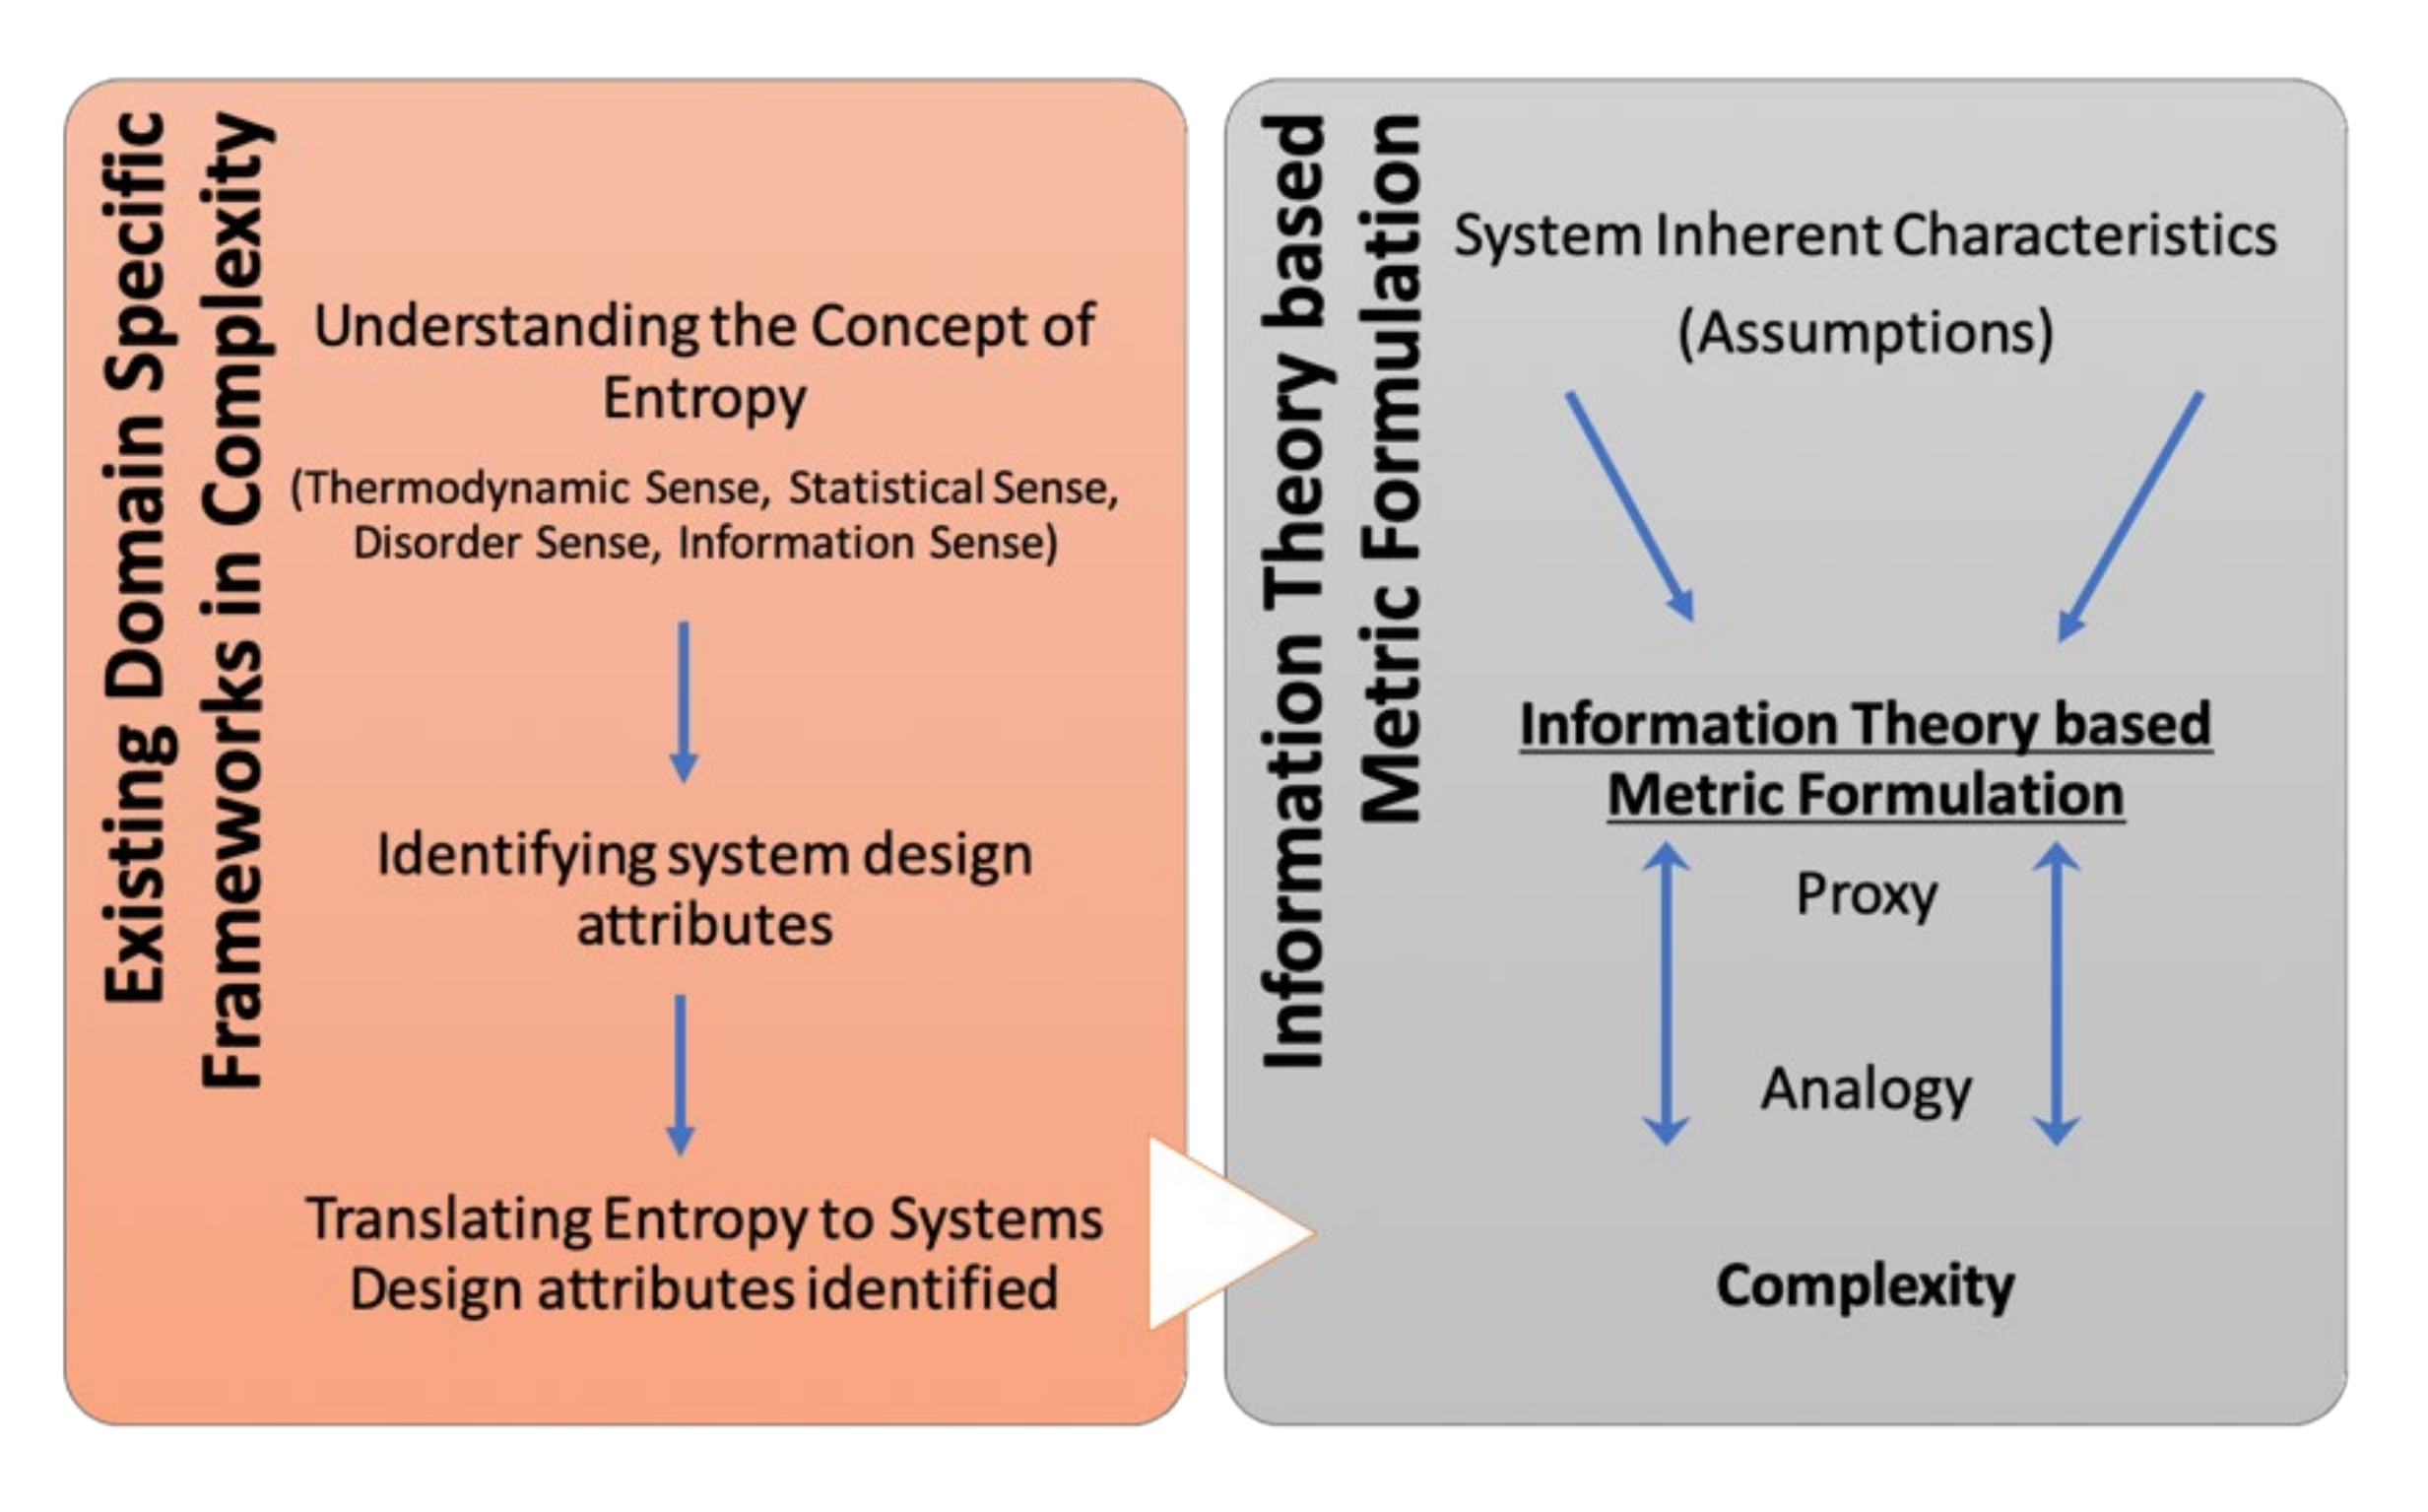
The two-stage system examination strategy used is illustrated in
Figure 1. First, the concepts of entropy were explored in terms of thermodynamic sense, statistical sense, disorder sense, information sense, and homogeneity sense. Second, domain-specific methodologies of complexity in complex systems, for the considered case study, were studied. This involves understanding what complexity is, and later identifying intra- and inter-system dependencies.
With a thorough understanding of system characteristics, exploring the benefits and drawbacks of the entropy-based complexity measures helped confirm the need for exploiting various characteristics of a system to establish new techniques to measure and understand the system. This followed engineering entropy-based metrics specific to the case study aimed at providing a proxy that reflects an analogy of what complexity is. To expand, an overview of entropy is first provided, and a foundation for the case study on complex networks, i.e., systems with low structural rigidity (unpredictable sub-system interactions) and high information gain is then built.
3. Understanding Entropy—An Overview
The concept of entropy is often thought of as abstract and, at the same time, difficult to present because of its different applications by various authors in many research fields. Throughout the literature, it is observed that many authors mostly seem to consider entropy to be either a state of disorder or a loss of information. To better understand the distinct sense of the term entropy, a principled polysemy approach [
10] adapted from the field of linguistics will help the readers to understand the basic co-existence of many meanings of the word entropy. Five distinct meanings of the word entropy were identified by Haglund et al. [
10], viz., thermodynamic sense, statistical sense, disorder sense, information sense, and homogeneity sense. In the thermodynamic sense, entropy can be interpreted as a state of a system that tends to increase towards a maximum value. The statistical sense of entropy presumes a probabilistic approach of identifying, counting, and monitoring the transitions between the microstates of the system. In contrast to the statistical sense, the disorder sense does not use a probabilistic approach but rather considers the snapshot of a given situation by representing spatial configurations and messiness.
Entropy in terms of information theory can be seen as the average rate of information added by the next element, calculated by considering the complete set of symbols and their probabilities. The information sense of entropy, according to Haglund et al., relates to the information needed to produce or interpret a message using its elements, such as digits, symbols, letters, and words. This entropy model shares the relationship between a message and its constituent elements. To better understand the information sense of entropy, refer to the following text extracted from Shannon’s work on mathematical theory of communication [
10]:
“
If a source can produce only one particular message its entropy is zero, and no channel is required. For example, a computing machine set up to calculate the successive digits of π produces a definite sequence with no chance element” [
11,
12].
Contrary to the statistical sense, where characteristics are shared by microstates, entropy in the information sense can be used to predict the next or an upcoming message or a symbol in a message based on conditional probabilities, thereby stressing the probabilistic prediction of the next symbol of a message. The main difference emphasized here is the characteristic of entropy according to the statistical sense based upon a system’s description through its constituent elements’ relationships. The information sense and the disorder sense share this property, whereas the thermodynamic sense does not. Entropy in thermodynamics represents the inherent disorder in a system over a period of time as the system heads towards thermodynamic equilibrium.
In information theory, entropy helps to quantify the information [
11]. Quantifying information implies analyzing the information present and measuring its associated uncertainty. Higher values of entropy signify lesser order in a system and lower values of entropy signify a more ordered system. Shannon entropy
is given as:
where
K = 1,
is the probability of a symbol appearing in a given stream of symbols, and the use of the logarithm base two corresponds to expressing information entropy in terms of bits.
This paper takes its foundation for entropy from information theory, as given by Shannon. Information theory plays an important role in understanding the meaning of entropy. This is because it is preferable to consider information that can be defined both quantitatively and subjectively. Moreover, information can be used as an anchor to understand what is changing in a spontaneous process. It is to be noted that information theory helps to precisely establish a measure of information defined in terms of probabilities based on some given evidence [
13].
Several attempts in the literature are observed on the use of entropy as a tool in understanding uncertainty in domain specific complex systems. To name a few, examples include: in the biological domain, the use of entropy for predicting diverse states of kidney failure disease considering the effects of hypertension and stress [
14], and assessing causal relationships between pairs in gene regulatory networks [
15]; in image segmentation, a generalized application of entropy in continuous and discrete variables [
16]; analysis of financial markets by analyzing the relationship between nine different stock indices from U.S, Europe, and China using entropy measures [
17]; detecting fatigue cracks in aluminum alloys [
18]; fabric defect detection [
19]; and, more interestingly, the quantification of information in cosmological probes of large scale structures [
20]. A lack of a unifying approach for characterizing complex systems across domains justifies the framework used to characterize complex systems based on the concept of information entropy, underlying the assumption that entropy of a complex system is a function of its components and their interactions.
4. Complex Networks—An Overview and Definition
A network, as derived from graph theory, is a simplest form representing a collection of points that are joined together in pairs by lines. In every such representation, the set of points are referred to as nodes or vertices, and the lines used to connect the points together are referred as edges. Networks can be mapped from contexts across several domains, such as physical sciences, biological sciences, and social sciences, that consist of several components linked together. It is observed in the literature that physical, biological, and social systems, when mapped as networks, often provide new insights into the behavior and structure of the system in question [
21]. The question of when a considered network is said to be complex can be addressed using the principles of complexity science. Several contrasting views [
22,
23,
24,
25,
26] on complex and complicated systems have been defined throughout the literature from the lens of complexity science. Drawing upon the views of various researchers on characteristics of complicated and complex systems and, looking back into networks topologies and their characteristics [
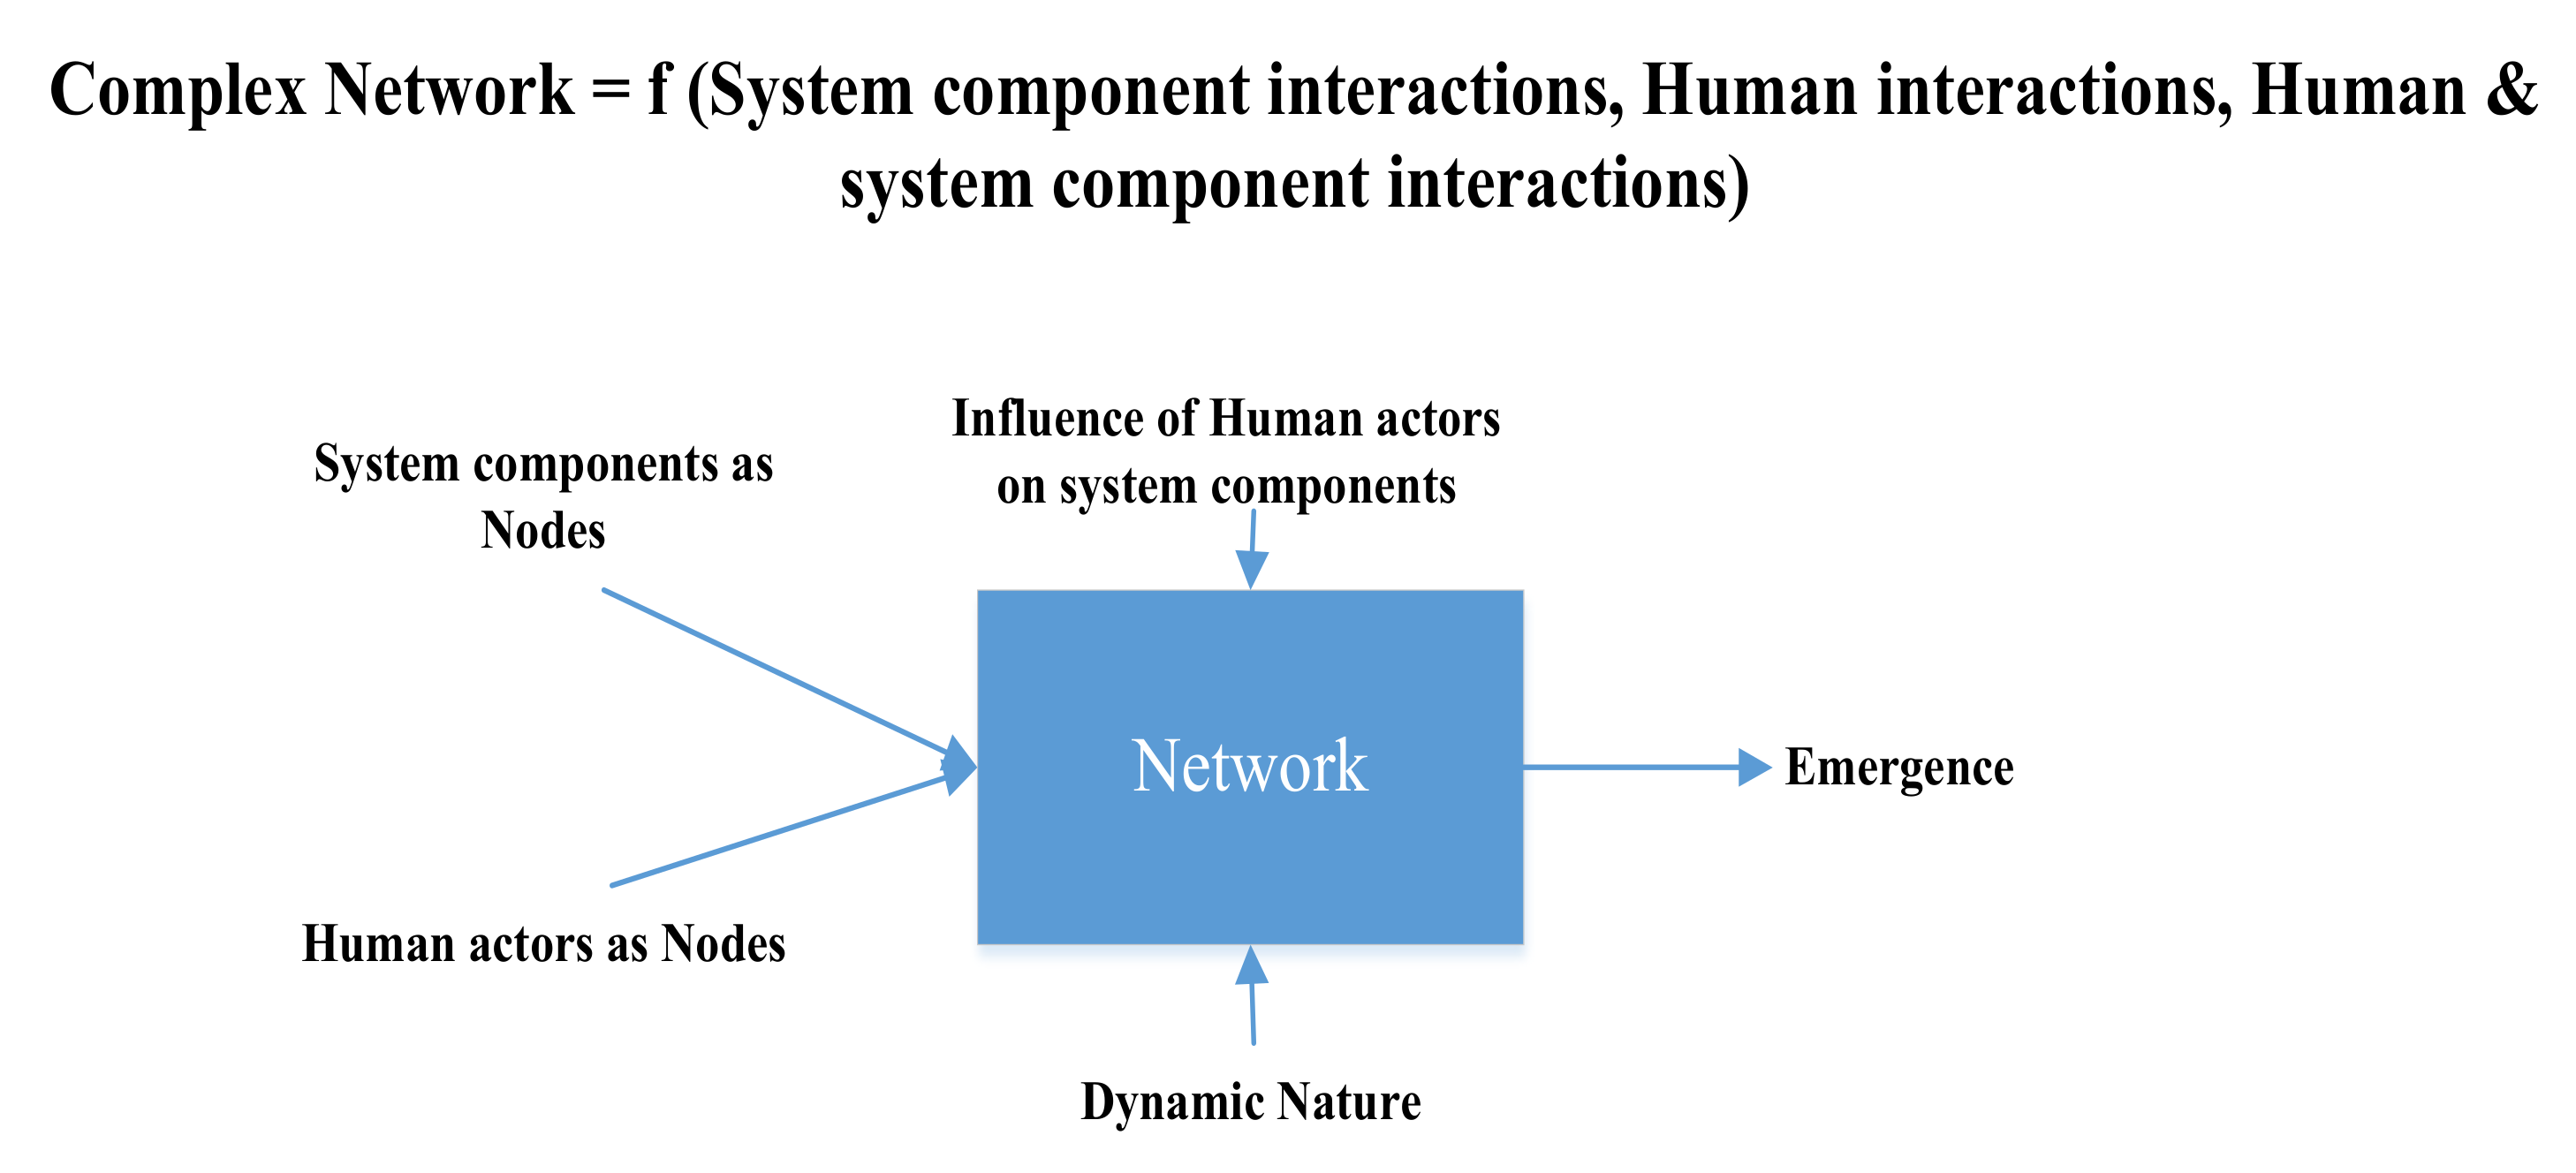
21], in this study a complex network is defined as a network mapped from a system that primarily constitutes interactions observed among systems components, interactions of human actors in the system, and the influence of human interaction on system components. Continual human interactions in such networks play a primary role in influencing the network structure and its evolution. The inherent ambiguity of human interactions and their individual perceptions introduce non-linear behavior, emergence, and self-organization in networks, thereby introducing complexity.
Table 1 illustrates the distinguishing characteristics of complicated and complex networks.
Figure 2 summarizes an abstract fundamental representation of how we define a complex network. Complexity in a network is illustrated as result of the continual relationship between an actor (human) and the components (sub-systems) of a system; that is, complexity in a network depends upon the extent of interactions a human actor has in a system and the cascading influence human interactions initiate throughout that lead to network emergence.
To some extent, complex networks can be characterized by the interactions among its constituent nodes. These interactions evolving together result in the dynamic nature of the network. Many complex networks have a number of properties that are common in nature, leaving aside their domain specific characteristics. Displaying small world phenomena is one such characteristic, and the other is the highly heterogeneous nature of interaction patterns in many cases [
27]. Heterogeneity in complex networks can be characterized by observing the degree distribution based on the node interaction dynamics. Many observed networks are reported to be scale-free networks, in which the degree distributions are observed to follow a power law. Examples of such networks are electronic circuits, cellular metabolism networks, research collaboration networks, and connectivity in the World Wide Web [
28].
5. Case Study—Entropy Metric Formulation and Analysis of Simulated Complex Networks
5.1. Entropy to Understand Interaction Dynamics
To understand the dynamic structure of a given complex network as a whole, it is important to analyze and explore the main conceptual underpinnings of a network, which are the nodes and their interactions. Because complex networks are continually emergent and non-linear in nature, exploring the dynamics of constituent nodes and their interaction patterns helps in providing insight about how a network structure evolves. Considering the degree distribution of every individual node in a network, let be the dynamic degree of a node where it gives the probability of a particular node having k links at a given time-step i. An entropy measure for a static network is first defined, which then is expanded to consider the dynamic nature of complex networks.
Suppose there are
n nodes in a network space
N,
. Now let
K be a class of
N where it defines the number of links of each observed node
n of a network.
. Let
I be the proportion of interactions that are represented by the number of links associated with each node
n:
Entropy is mathematically represented as:
where
and
. It is to be noted that the value of
when
.
Applying this measure to the number of nodes constituent in the network space we obtain:
Now, considering the dynamic nature of a complex network, let
j be the number of time-steps over which a network is observed. At every time-step
j, each and every node
n of the network will have a degree
k. Now, considering the degree of nodes at individual time-steps of a network, entropy is given by:
Here, a complex network is quantified to be a function of the number of nodes present (Nn) and the number of links (In) associated with the nodes. The uncertainty based on the distribution of the node degrees over a time period is used as a base indicator to calculate network entropy. This also takes into consideration the diversity in network interactions. When calculated, this index represents absolute order in the network when it takes a value of 0, and represents disorder and absolute diversity when it takes a maximum value (the maximum value depends upon the type of complex network being considered).
5.2. Transfer Entropy to Understand the Transfer of Information in Network over Time
The use of entropy in the field of networks is a well-studied area. Entropy has been identified as a possible metric for playing a crucial role in analyzing the complexity of a network [
29]. To further extend entropy towards measuring uncertainty between two random variables
X and
Y, a measure of mutual information is used. Mutual information is based only on the present state/symbol of each variable; considering all such present states, mutual information,
I (
X,
Y), is defined by:
However, the fact that the measure of mutual information is symmetrical, i.e.,
I(
X,
Y) =
I(
Y,
X), implies that the future state of a random variable has a casual effect on the past state. In the case of complex networks, where a network consisting of several nodes evolves over a period of time, the structure of a network at a time
t depends upon the evolution of the network until time
t−1, not the other way around. Thus, in order to address the symmetrical limitation of the mutual information measure, the concept of transfer entropy was proposed [
30].
Transfer entropy (TE) was coined [
31] to address the time symmetric limitation of a mutual information measure. Considering two sample spaces of information represented in time by X = {x
1, x
2, x
3,….., x
t} and Y = {y
1, y
2, y
3,….., y
t}, transfer entropy is defined as the additional amount of information gained for the next observation of one of the two processes being considered, given the past observation of the other process.
Following Murcio et al. [
30], considering two systems
X and
Y, we first define the entropy rate (i.e., entropy based on time
t) assuming that
yt+1 depends upon both
xt and
yt as:
We now define the entropy rate in which
yt+1 depends only on
yt:
Hence, the transfer of information from X to Y is defined as TE (X, Y) i.e., transfer of information from X to Y: TE (X, Y) = HB − HA.
TE, the transfer of information between two random variables
X and
Y, is given by [
30,
31]:
Moreover, the transfer entropy from Y to X can be inferred similarly based on the above as:
To analyze the flow of information generated from one node to the other of a considered network based on the observed individual node degree evolution over several time-steps of network formation, the concept of transfer entropy is used. When applied to a network evolution scenario, TE helps in understanding how much of the information generated at one node is responsible for the information obtained by the other node.
5.3. Simulation Models Used to Apply the Metrics
To calculate entropy and TE values based on individual node degree evolution, data was generated using the NetLogo agent-based simulation platform. The advances observed in the use of agent-based modeling (ABM) to represent social systems compared to traditional equation-based models, and their ability to mimic heterogenous subsystems, autonomous entities, and nonlinear relationships, affirmed the use of ABM [
32]. Tracing back to the principles of complexity science, a system is a sum of its parts as a whole but not the other way around. Two random networks i.e., preferential attachment and small world networks, were generated. Data was captured individually for each network based on the number of nodes present along with the individual node degrees (number of connections) over several time-steps. ABM helps to model and represent individual components of a system considering all the possible attributes and their behavior instead of representing the state of a whole system. ABM models were used to generate network models where individual agents (in this case network nodes) are describes as individual entities that interact with each other locally in their environment [
33]. The characteristics of the networks generated, and the calculations of transfer entropy values, are discussed below. The focus is to model network dynamics of the system that arises when individual nodes interact with each other, and on how such individual nodes affect the overall network. This simulates a few characteristics of complex systems and their independent sub-systems, such as degrees of freedom, emergence, and adaptability.
5.3.1. Preferential Attachment Networks
Generated networks using the NetLogo software (version 5.3.1) illustrate the behavior of real-world networks (such as connection from and to a website, social networks, and collaboration networks), where few nodes have a large number of connections, whereas all the other nodes have only a few. This phenomenon in which network nodes prefer to connect to the popular existing nodes is called preferential attachment. This model starts with two nodes connected initially, and thereby every new originating node randomly picks an existing node with which to connect, with some inherent bias, i.e., the chance of a node being chosen to be connected to by another node is directly proportional to the number of connections (degree) it already has. The networks that arise from this phenomenon often follow a power law distribution, i.e., the distribution of the number of connections of each node is not normal [
34]. Barabasi and Albert originally coined this mechanism for creating scale-free networks, so the networks created by this mechanism are called Barabasi scale-free networks.
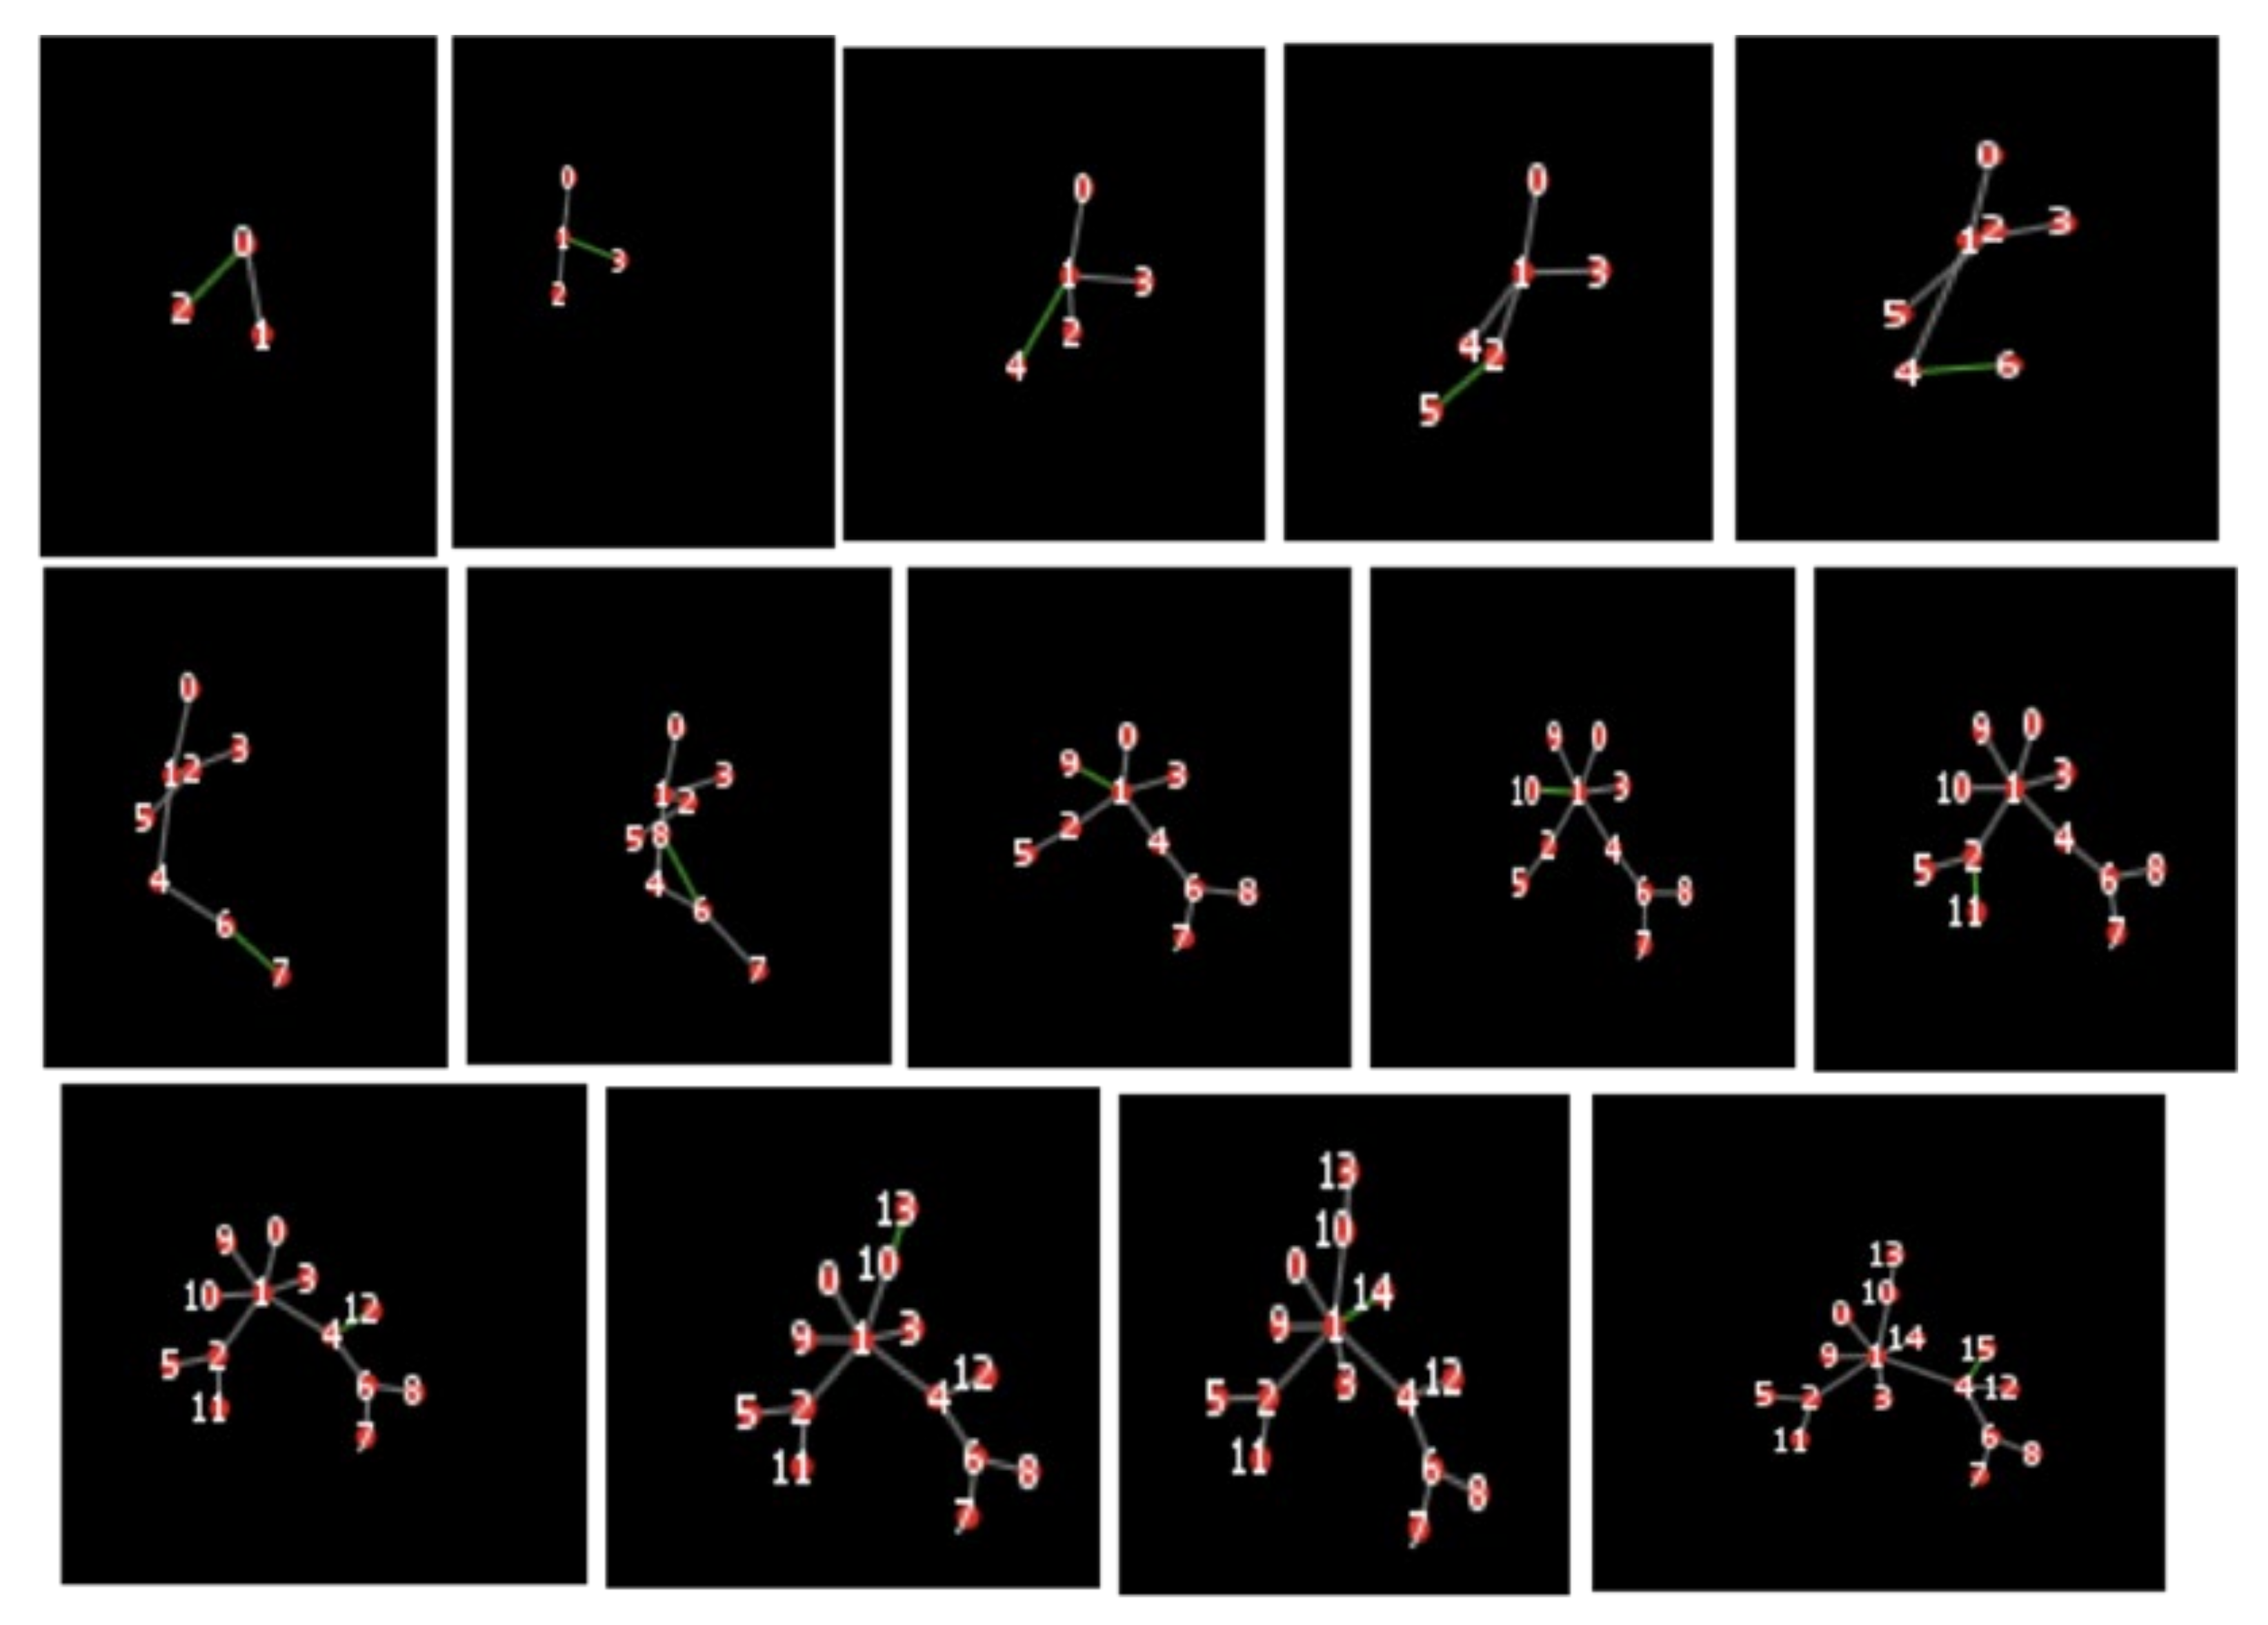
Figure 3 illustrates the evolution of interactions in the network over fifteen different snapshots.
To analyze the flow of information generated from one node to another of the network based on the individual node degree evolution over several time-steps of network formation, the concept of transfer entropy (TE) is used. To generate TE values based on individual node degree evolution, data on the number of nodes present along with the individual node degrees over 15 different time-steps were captured using NetLogo [
35].
Table 2 illustrates the degree evolution of nodes portrayed in
Figure 3.
To calculate the TE values (see
Table 3), joint probabilities are calculated for the emerging node degrees of
Table 2. Thus, to calculate the TE from node 0 to node 1 at time-step t1, we need to find the probability
p (y2, y1, x1) as required for calculating TE, where y2 corresponds to the value located in the second column, second row; y1 corresponds to the value in the first column, second row; and x1 corresponds to the value in the first column, first row; i.e.,
p (1,1,1). We now count the number of matching combinations of these values that exist in the two rows corresponding to node 0 and node 1. In the graph (
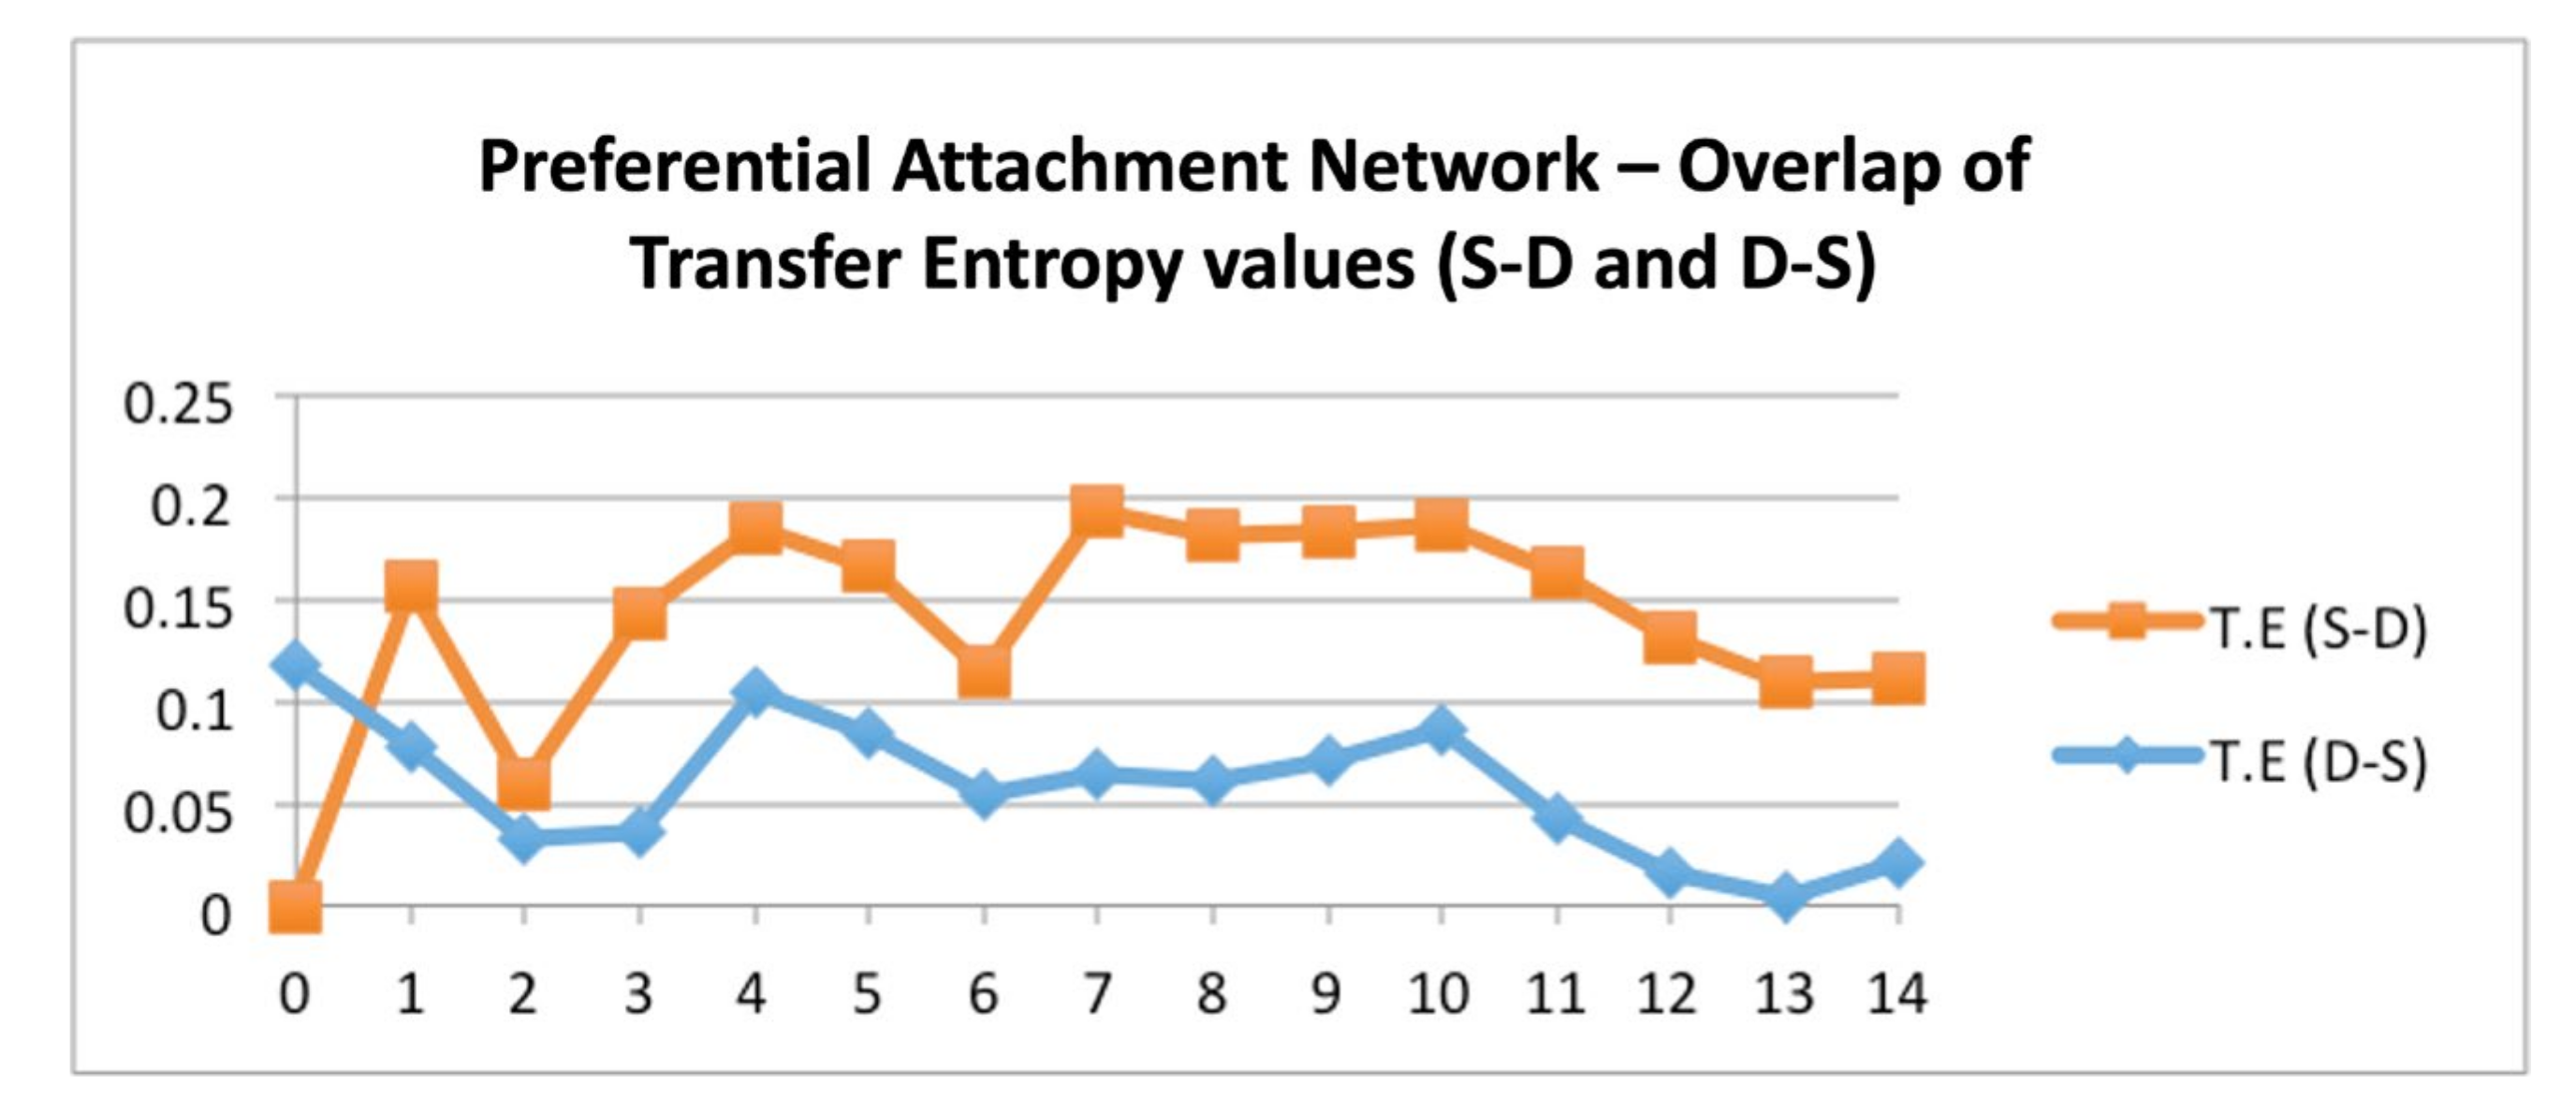
Figure 4), the X-axis represents the node numbers and the Y-axis represents the corresponding TE values. It is read as: for the red line, Mark 0 is the TE value from node 0 to node 1, Mark 1 is the TE value from node 1 to node 2, and so on. For the blue line, mark 0 is the TE value from node 1 to node 0, mark 1 is the TE value from node 2 to node 1, and so on.
It is seen that, in general (see
Figure 4), information flow from the source nodes to the destination nodes initially rises and then dominates information flow from destination nodes to source nodes. At the early stages of the graph, the trend line of S-D, when observed, shows that TE between node 0 and 1 is zero with node 0 as the source and node 1 as the destination.
This simply suggests to the initial network structural formation where at the initial time-step nodes 0 and 1 are connected, on which the simulated network builds over the considered time series. Before calculating the network entropy measure, we introduce a measure of connectedness, also called the reproductive number in complex networks. The reproductive number, R
0, helps to understand the context of information spread in a network [
36]. R
0, also known as the connectedness of a network, can be calculated as follows.
Consider a node
n with degree
k to communicate an idea or spread information to its neighbors with a probability
r. The expected number of nodes it will pass the information to will be
, by excluding the nodes it previously communicated the information to. Taking a weighted average over all the nodes we obtain:
If the value of R0 is greater than 1, it implies that the number of nodes receiving the information grows exponentially; if R0 is less than 1 it implies that the information will dissipate rapidly over a network.
Table 4 and
Figure 5 portray that, as the network evolves, entropy increases, implying that in a preferential attachment network with more nodes evolving over a period of time, the network as a whole tries to reach a disordered/more diverse state from an ordered state initially. As entropy (diversity) increases, the reproduction number initially increases and then decreases. This implies that when the network starts to evolve, there is a greater chance of information spread, and when the network starts evolving to more than four nodes at time-step 3, the information spread slowly decreases.
5.3.2. Small World Networks
The network generated here using NetLogo simulation software is based on the phenomenon of small word networks. This phenomenon implies that a given person is only a small number of (a few) connections away from any other person in the world. A popular example of this phenomenon is the famous Kevin Bacon network (also known as a six-degree separation network), which relates to a network generated based on actors appearing in the same movie. However, small world networks are not only limited to networks of people, but also apply to several other real-time networks such as power grids. The network model generated here is based on a few assumptions and conditions under which a small world network is formed. It is developed based on the model suggested by Duncan Watts and Steve Strogatz [
37]. The model starts by initially generating a network in which each node is connected to its two neighbors on either of its sides [
35].
After this initial random network is generated, at each and every time-step, a random connection is picked and then rewired i.e., a random end of a connected pair of nodes is changed. The probability that a random edge is chosen and rewired is based on the rewiring probability value assigned to the network generation model.
Figure 6 illustrates the evolution of interactions in the network over fifteen different snapshots.
Table 5 and
Table 6 illustrate the node degree evolution observed for the generated small world network and their respective transfer entropy values.
As observed in
Figure 7, Node 0 has no information originating from it. This simply reflects the rigidity of the node, which does not change the degree over the network emergence (the node is connected to the same neighbors throughout), and thereby does not generate any new information.
Figure 8 and
Table 7 illustrate the entropy measure and R
0 calculated at every time-step of the dynamic network. It is observed that, as the network evolves, entropy decreases, implying that the small world network tries to reach an ordered state from a highly disordered initial state. As entropy (diversity) reduces the reproduction rate R
0 increases. This implies that when this network tends to reach absolute order (i.e., less entropy) the spread of information increases over the network.
The framework of information theory used has no restrictions on the type of complex system it is applied to because the interactions among the components/subsystems of a complex system can be viewed as information transfer. Perceived applications of the proposed framework across various operational domains can include addressing time critical system of systems (SoS), such as testing autonomous system adaptation platforms for understanding and assessing the impact of adding additional system functionalities [
38], mission critical weapon SoS [
39], assessing complexity in manufacturing systems [
40], identifying software code complexities [
41], and assessing commercial off the shelf products [
42]. However, the use of TE may lead to the curse of dimensionality [
43] with an exponential increase in the number of nodes and connections, thus limiting the scope of the proposed method. This may be plausibly addressed using decomposed transfer entropy [
44], thus providing the opportunity for further investigation of the proposed approach and its limitations.
6. Discussion and Conclusions
The simulated case study considered in this paper considers complex networks. To examine the use the information theoretic approach, we mapped the similarity of a complex network to a general communication channel. A typical communication channel consists of a source that sends information, a channel that acts as a medium to transmit the information, and a destination that receives the transmitted information. In terms of complex networks, network nodes and actors behave as both source and destination, constantly transmitting and receiving information, whereas the edges connecting the nodes of a complex network act as the medium of information transfer. The application of the concepts from information theory helped in understanding, at a system and sub-system level, the interdependencies among the considered system constituents. This provided system analysis insights which led to the development of specific metrics for the tailored entropy-based case study.
Table 8 illustrates a summarized representation of how information theoretic concepts and their applications were relevant in understanding the case study used. This paper presenting the case study is framed according to the application of information theory concepts with a goal to better understand and assess complex systems. We present the insight drawn from the case study in answering the research question identified i.e., Can information entropy help in quantitatively characterizing a complex system?
Because not all complex systems have the same characteristics and behave in a similar fashion, it is indeed not possible to provide a generalized metric to quantitatively characterize a complex system. However, using information theory concepts tailored to the specific system being considered helps to answer and quantify the complexity, based on a set of assumptions. In such a case, a thorough understanding of the considered systems, sub-systems, and their interactions is required. Using the concept of entropy, complex systems can be mapped as a network of interactions, and the characteristics of the complex system can be quantified, thereby setting a foundation for understanding a complex system. The complexity can then be quantified based on a set of assumptions. For example, when a complex system is mapped as a network, information entropy can be used to quantify the network at a given snapshot based on the observed sub-systems’ interaction patterns. Considering the network dynamics, at every instant the network emerges with either new nodes introduced into the network or rewiring of the connections among the nodes of the networks. Provided that the data on system interaction patterns at every instance of the system evolution is available, entropy-based measures can detect the precise time instance at which the system is exposed to external stimuli. This is because entropy can be seen as a measure of surprise in which, following sudden external stimuli to the network, a rapid change in the tailored entropy-based measure can be detected when observed over the system dynamics
The insight drawn is strictly based on the observations from the case study presented in this paper. Although the insights gained directly may not address complex system characteristics of every possible scenario, they set a foundation for a fact-based theoretical framework for explaining, understanding, and analyzing complex systems using information theory concepts. A more realistic application of the proposed framework to time-series evolution data of real-world complex systems would validate the use of entropy as a generalized measure to characterize complex systems. However, this may also lead to a need for identifying the influence of dimensionality, i.e., the role played by the increase in nodes and connections in a complex system’s evolution, which needs to be further studied.


