1. Introduction
As the three-dimensional (3D) product model functionality has moved beyond its original purpose for use in the design phase to being able to be more broadly applied through production and business processes, the opportunity exists to develop a quantitative model for the value that the use of 3D product models brings to those processes. In review of the current literature, including journal papers, articles, and conference papers sourced using Compendex and Scopus databases, there is a great deal of research on 3D product models as well as significant research on assembly and production processes, but relatively little research has been performed on the overlap of the two and the corresponding value that has been created as a result of that combination [
1]. This void in the body of literature could be in large part due to the unavailability of software that linked the 3D product model to the production and assembly processes [
2,
3]. As both research and industry has advanced in knowledge and expertise, this capability to link and deploy the engineering bill of materials and 3D product models to the manufacturing bill of materials and use of the 3D product model in the production processes has become more prevalent [
4,
5,
6,
7,
8,
9,
10,
11,
12,
13,
14,
15,
16]. Academic research has been exploring the link between the value of the 3D product model and its use in assembly and production processes, however, thus far the results have been largely qualitative versus quantitative [
1,
17,
18,
19,
20,
21,
22,
23,
24]. The objective of this research is to develop, propose, and demonstrate the results of a quantitative model for the deployment of the 3D product model in production and assembly processes.
The authors note that the 3D product model can have a large array of meanings from the virtual computer-aided design (CAD) model, to a digital mock-up, to a digital twin, or even a physical 3D model. As noted in the authors’ prior work, the 3D product model application focused on in this paper is the value of bringing the virtual CAD model and digital 3D assembly mock-up to the assembly and production process beyond the engineering design. The example below was provided previously in the authors’ published work, “
Value of the 3D Product Model Use in Assembly Processes: Process Planning, Design, and Shop Floor Execution” and is included here again to give the reader a sense for an example of the type of application of the 3D product model the research is targeting [
1].
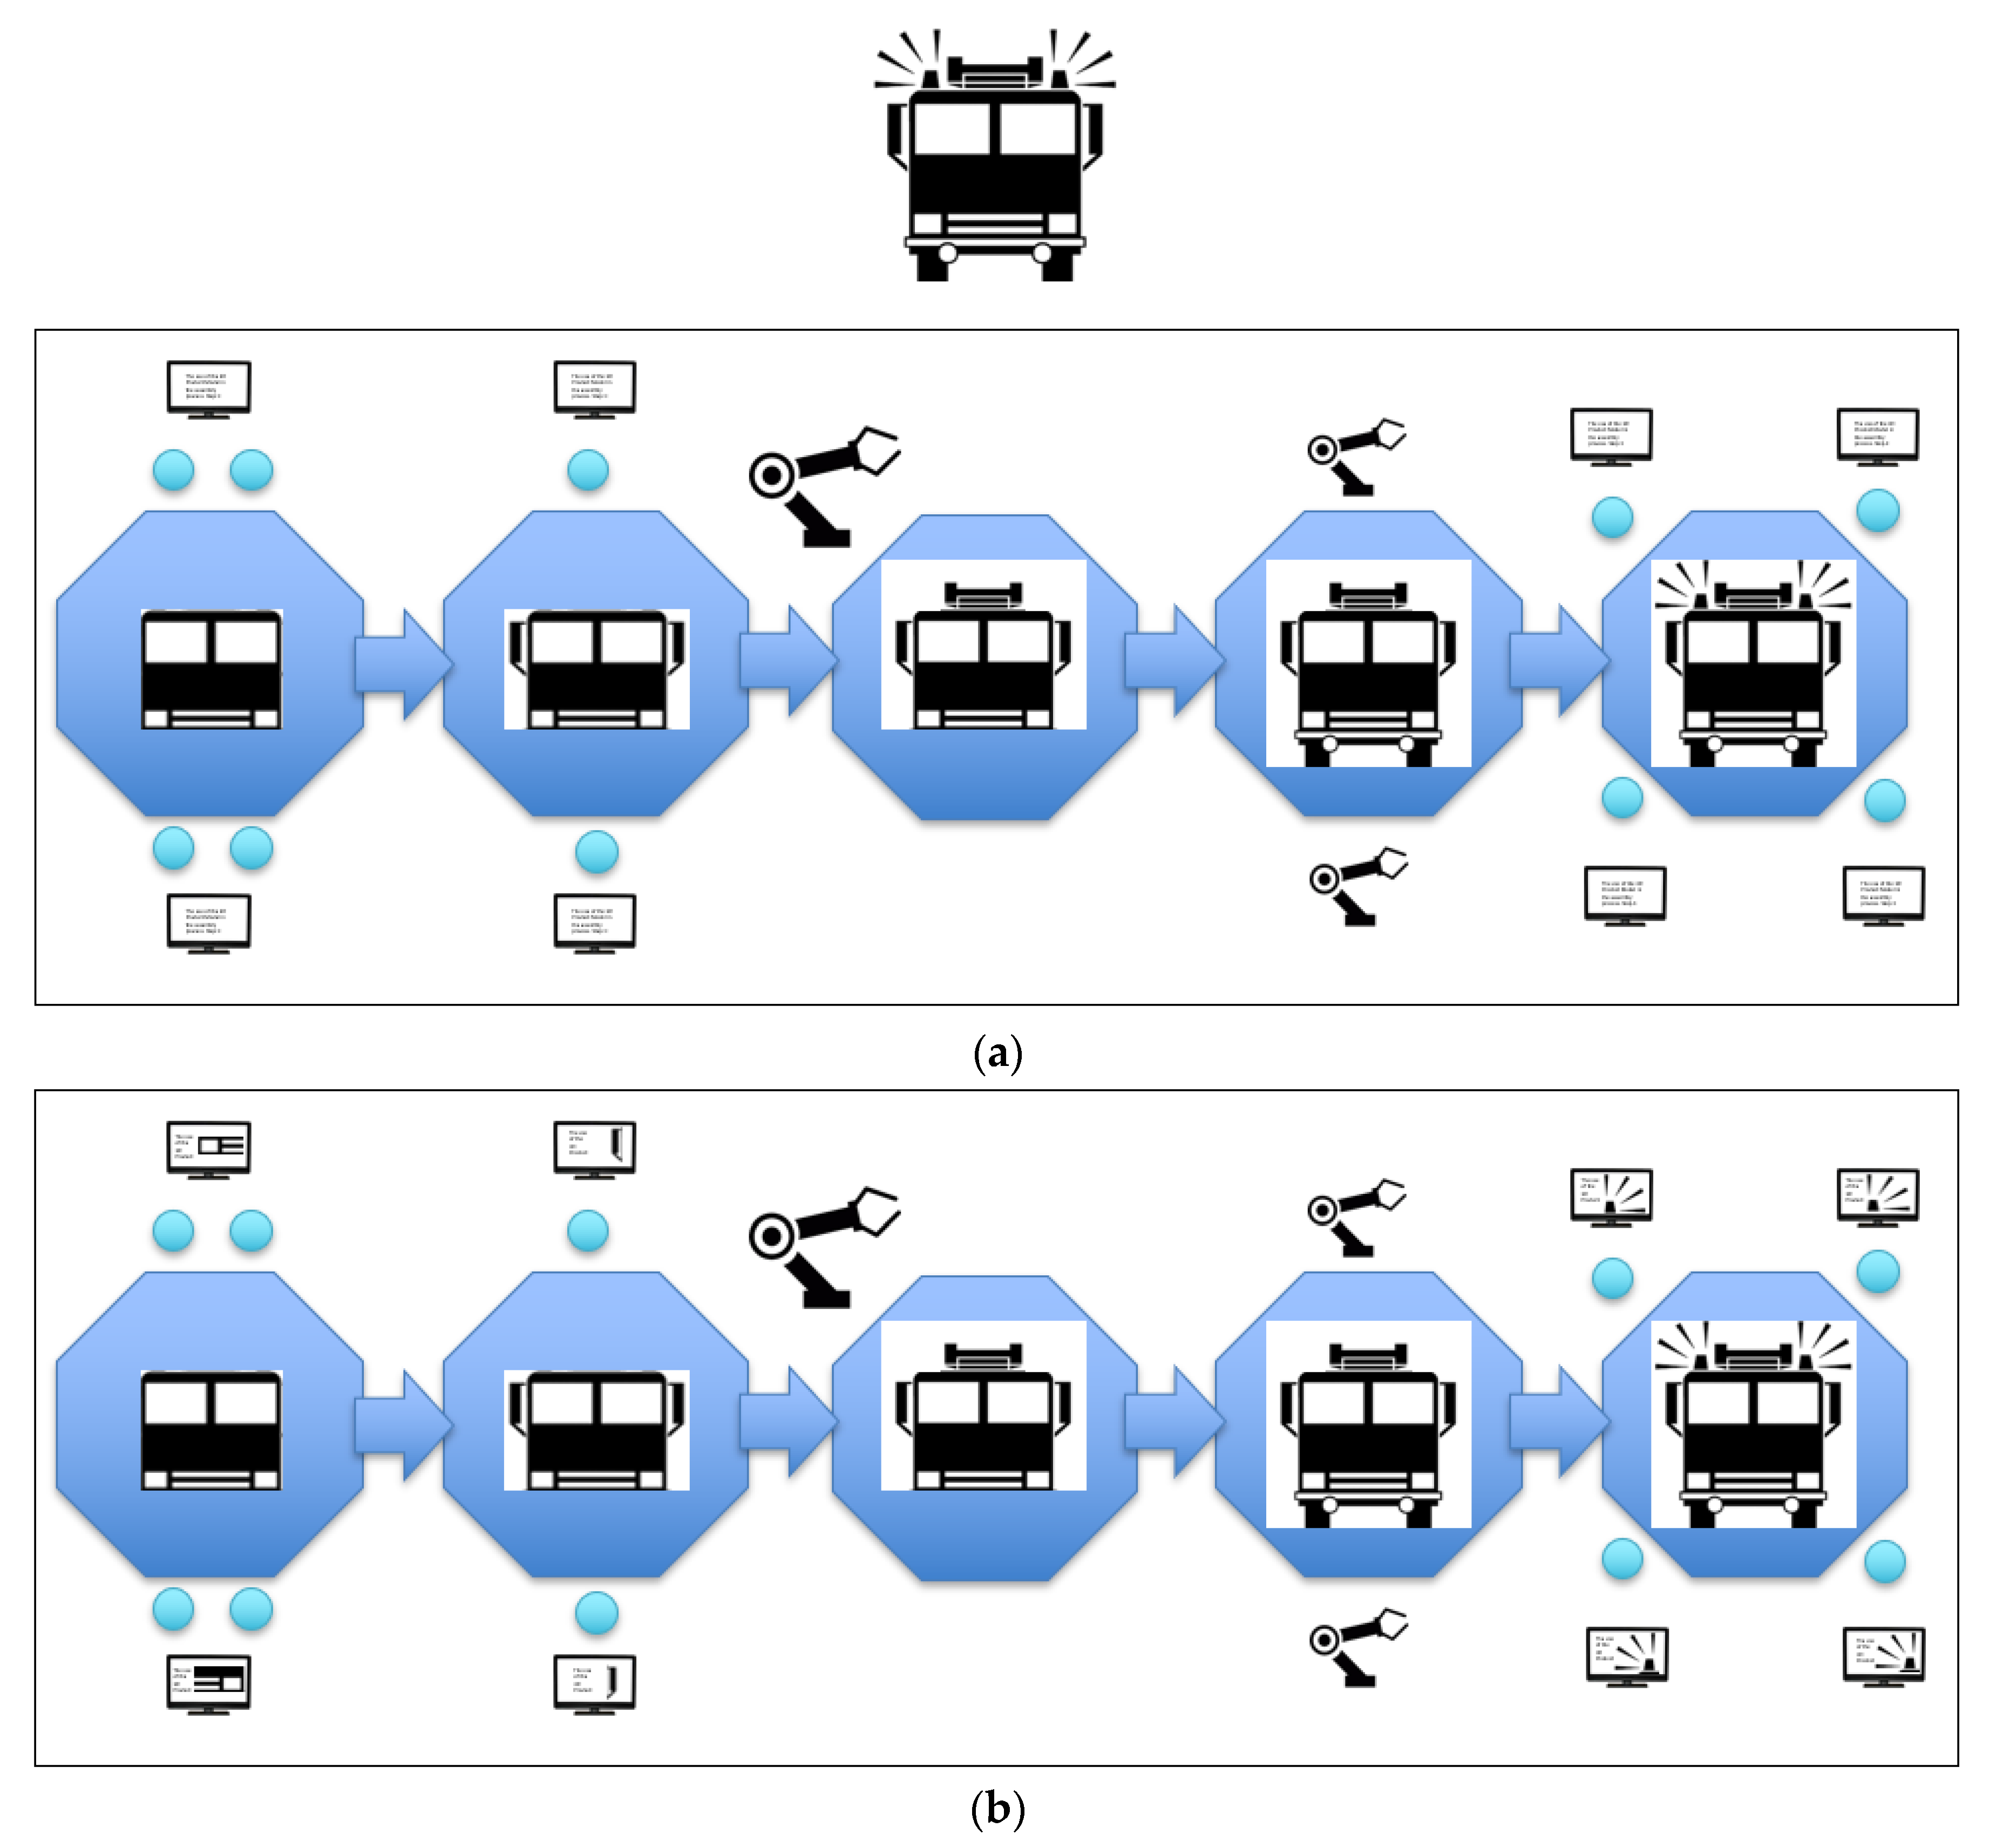
Figure 1 shows an assembly process where a fire truck is being built. Each octagon represents a station on the assembly line; some operations are completed by operators (the blue dots in the figure), and others are completed by robots. In
Figure 1a the operators have written work instructions which they use to know what parts to assemble and where to assemble those parts as different models and options of the fire truck progress down the assembly line.
Figure 1b shows this same assembly line, but the written work instructions are replaced with 3D product models (virtual CAD models) of the part with visual assembly guidance. This is an example application of the 3D product model in the assembly process [
1].
While deploying the 3D product model to the shop floor via visual work instructions is not the only way in which the 3D product model can be used in the production and assembly processes, it does demonstrate one example that creates value in some of the areas discussed in this paper, such as quicker operator training and less time updating work instructions. Other examples of the 3D product model applications in assembly and production processes include linking the 3D product model to the precedence diagram and checking for part interferences following engineering change orders, using the combination of the 3D product model and the precedence diagram to visualize how the assembly changes through the production process, and seeing the impact of changes made during the line balancing process represented by visual changes to 3D product model assembly [
24]. The different ways in which the 3D product model is used in production and assembly processes creates different value, and the quantitative value models developed in this research aim to create a framework through which the value of using the 3D product model in the assembly process can be captured, across multiple application scenarios. This paper expands on the prior research which developed key areas where manufacturers see qualitative value in deploying the 3D product model in the production process and proposes a quantitative value model based on those results.
2. Materials and Methods
In this study, we develop a quantitative value model for the deployment of the 3D product model in production and assembly processes. This model is based off prior research in which the authors found that the areas of value in implementing the 3D product model in the production and assembly process are as follows (listed in order of greatest to least qualitative value):
Accuracy of assignment of the right parts, tools, work allocation, and work instructions;
Faster new product/model roll out to production;
Less time updating work instructions;
Quicker operator training;
Smoother transition for field use.
Thus, the quantitative value model has been developed around these key areas. Given the way in which the 3D product model is used to qualitatively create value in each of these areas is discussed in prior research, this article will not focus on how the 3D product model is used in those applications but rather focus on the determination of the quantitative value of deploying the 3D product model in these five value areas. The remainder of this section proposes a quantitative model for determining the value of 3D product model use in production and assembly processes.
2.1. Accuracy of Assignment of the Right Parts, Tools, Work Allocation, and Work Instructions Value Model
The accuracy of assignment of the right parts, tools, work allocation, and work instructions is the area that industry respondents indicated they found the most value in implementing the 3D product model in assembly processes, at a level over 50% greater than any other value area [
1]. When the right parts, tools, work allocation, and work instructions are assigned to the right production line stations, it enables employees to reduce variation in the production time per station. Reduction in variability of production time per station leads to the capability to reduce the takt time, and thus generates a greater throughput on the production line. Assuming a normal distribution in takt time variation by station, the model demonstrating this value is illustrated as follows:
M = Number of production/assembly lines in a manufacturing plant
m = A given production line in a manufacturing plant (1–M)
Nm = Number of stations on production line m
n = A given station on production line m (1–N)
Om,n = Number of operators at station n on production line m
o = A given operator at station n on production line m (1–O)
Tm,n = Target takt time of station n on production line m
= Standard deviation of takt time at station n on production line m
βm,n = Probability of ≤ Tm
= Z value of βm,n
= Actual takt time of station
n on production line
m for a given production instance
Tm = Takt time of production line
m
Thus, if the Target takt time of station n on production line m (Tm,n) and the desired probability of the actual takt time of station n on production line m being less than or equal to the takt time of production line m (βm,n) remain the same across all stations on the production line m, then if the standard deviation can be decreased for each station n on line m () the takt time of production line m can also be decreased (Tm). Note that this reduction in takt time of the production line m translates to a reduction in takt time of entire production process if the given production line is the bottleneck of the full manufacturing facility, otherwise speeding up the production line will not generate additional throughput through the production facility.
Presuming the production line is the bottleneck of the manufacturing process, here is what the model looks like in terms translating that takt time reduction to quantifiable dollars:
Ωm = Total number of weeks production line m is in production per year
ω = A given week production line m is in production (1–Ωm)
δω = Total number of days production line m is in production in week ω
= Average number of days production line
m is in production per week
Dm = Total number of days production line
m is in production per year
d = A given day of the year of production line m production (1–Dm)
Hm,d = Total time of production operation on production line m on day d
= Average time of production operation on production line
m per day
a = A given production produced on production line m
α
m = Average number of products produced on production line
m per day
Am = Products produced on production line
m per year
Pm,a = Profit generated by product a on line m
= Average profit per product on production line
m per year
= Average profitability per day of production line
m = Profitability per year per production line
mPWithout3D,m = Profitability per year for production line m () prior to 3D product model implementation in production processes
PWith3D,m = Profitability to per year for production line m () after 3D product model implementation in production processes
= Incremental profitability via reduction in Takt Time
2.2. Faster New Product/Model Roll out to Production
A number of industry respondents, including a large agriculture equipment manufacture and a large automotive manufacturer indicated that the area which they have found a great deal of value in implementing the 3D product model is in faster new product/model roll out. The model for the value created through the time saved in production start-up by implementing the 3D product model in the production process is demonstrated below:
2.3. Less Time Updating Work Instructions
When an engineering change order (ECO) is released, it creates an update to the product model and often requires an update to the associated work instruction for the production station effected by that ECO. When the 3D product model is linked to the production and assembly precedence diagram, a change to either the 3D product model or the precedence generates an update to the visual work instructions automatically when the ECO is processed. This then saves the engineer time they would have spent manually updating written work instructions. The model for the value created through less time updating work instructions by using 3D product model production process software is demonstrated as:
Wm,n,k = Time to update work instruction k for station n on production line m
Km,n = Number of work instructions updated per year per station n on production line m
k = A given work instruction update on station n on production line m (1–Km,n)
Km = Number of work instructions updated per year on production line
m = Average time to update a work instruction for production line
m = Average cost of labor per hour to update work instructions
Cm = Cost to update work instructions on production line
m CWithout3D,m = Cost to update work instructions (Cm) for production line m prior to 3D product model implementation in production processes
CWith3D,m = Cost to update work instructions (Cm) for production line m after 3D product model implementation in production processes
= Incremental profitability via reduction in time to update work instructions
2.4. Quicker Operator Training
The fourth of five categories, as seen in the first paragraph of the Materials and Methods section, in which industry respondents indicated they created value by implementing the use of the 3D product model in the production process is in quicker operator training. By having the 3D product model use in the production process, employees that need to be trained on a new or updated production process can see the 3D model of the product and gain a visual representation for the objective to be achieved, increasing the speed at which they learn to perform the operation within the target takt time for station
n on production line
m (
Tm,n). Here we apply the learning curve theory [
25] to model the value that the 3D product model use in the production process creates via quicker operator training:
Ψm,n,o,1 = Time to produce the 1st unit by operator o at station n on production line m
Lm,n,o = Learning curve rate for operator o at station n on production line m
δ = Production unit number
b = Learning curve factor
Ψ
m,n,o,δ = Amount of time to produce unit δ by operator
o at station
n on production line
mΨ
m,o = Time operator
o spends training at station
n on production line
mxm,n,o = Number of required trainings per operator o at station n on production line m per year (due to turnover, minor work instruction/product model updates, etc.)
Xm,n = Number of employees trainings at station
n on production line
m per year
Ψ
m = Total time spent training on station
n on production line
mγm,n,o = Hours worked by operator o at station n on production line m
ζm,n,o = Cost of labor per hour for operator o at station n on production line m
ζ
m = Average cost of labor per hour for operators at station
n on production line
mΦ
m = Cost of training for production line
mΦWithout3D,m = Cost of training for production line m (Φm) prior to 3D product model implementation in production processes
ΦWith3D,m = Cost of training for production line m (Φm) after 3D product model implementation in production processes
= Incremental profitability via reduction in time to update work instructions
2.5. Smoother Transition to Field Use by Identifying Clashes Ahead of Install
In another application of the 3D product model in the production process, a large automotive manufacturer uses the 3D product model to verify production and assembly interferences before launching a product model change. The automotive manufacturer has a virtual assembly lab that allows them to complete such studies and check how a 3D product model change will work in the context of how it will integrate with tooling and the existing products already assembled onto the vehicle on the production line. The manager of the digital manufacturing group at this organization stated that the application of the 3D product model through the virtual production lab provides the company with a key competitive advantage over other automakers. Such an improvement can lead to the reliability of the work being performed at the production and assembly stations as a result of a product and work station design that was developed with ease of manufacturing and assembly as a core intent which was enabled by the implementation of the 3D product model in the production planning and design processes. The model for the quantitative dollar value of this increase in reliability creates, as a result of the design for assembly enabled by using the 3D product model in the production planning and design process, is as follows:
Rm,n = Reliability of station n on production line m
Rm = Reliability of production line
m Note that if the reliability of all stations on production line
m are the same then
η = Number of assembled units reworked
ξm,a = Cost of rework for product a on production line m
= Average cost of rework for a unit that requires rework on production line
mQm = Cost of rework on production line
m QWithout3D,m = Cost of rework for production line m (Qm) prior to 3D product model implementation in production processes
QWith3D,m = Cost of rework for production line m (Qm) after 3D product model implementation in production processes
= Incremental profitability via reduction rework
2.6. Total Value of Implementing the 3D Product Model in Production and Assembly Processes
The industry respondents who have implemented the 3D product model in their production and assembly processes indicated five categories in which they were gaining value through that implementation. The total quantitative value gained on a given production line by implementing the 3D product model into a production process can then be shown as:
Vm = total value gained for production line
m by using 3D product models in the production process:
These equations that the research team developed and applied for determining the quantitative value of implementing the 3D product model in the production and assembly processes were then translated into a graphical user interface that allows for industry and academia alike to input the key independent variables and calculates the results that implementing the 3D product model will create. This user interface is shown in
Figure 2.
The research team used the quantitative model equations outlined in the Materials and Methods section of this paper to develop the associated graphical user interface tool (shown in
Figure 2) to simplify the translations of the data inputs to the quantitative value outputs. The research team then used the graphical user interface in a series of interviews with industry experts engaged in industrial and systems engineering leadership in for-profit manufacturing enterprises. The cells in the graphical user interface in
Figure 2 that are gray are generated based on numerical calculations developed in this paper. The cells that are blank and highlighted in color are where inputs that are gathered through interviews with industry experts are entered. The purpose of the interviews were for the companies to provide the inputs to the model, which would then generate the representative output of the value that deploying the 3D product model in the production process would/did create. These results were then calibrated against the industry experts understanding of the value the 3D product model created or would create when deployed to the production and assembly processes. Note that the nature of the organizations surveyed are such that all other variables were not able to be held constant when deploying the 3D product model to the production and assembly process. The objective was to complete applied research in which the quantitative model was utilized in a production setting. As indicated in the conclusion, further research in this area can be conducted that further isolates variables that impact value generated for an organization so that additional certainty can be gained around the correlation of the implementation of the 3D product model in assembly and production processes and the associated financial benefit the company realizes.
Prior to analyzing the survey results, the research team’s hypothesis was that the quantitative model would show the greatest value generation in each identified area (accuracy of assignment of the right parts, tools, work allocation, and work instructions; faster new product/model roll out to production; less time updating work instructions; quicker operator training; smoother transition for field use) to a similar magnitude as the qualitative results had showed in the prior research. Thus, as an example, accuracy of assignment of the right parts, tools, work allocation, and work instructions would show value that was 50% greater than the quantitative value generated in any of the four other value areas.
3. Results
3.1. Accuracy of Assignment of the Right Parts, Tools, Work Allocation, and Work Instructions Value Model
An aggregation of data collected from interviews with industry experts in industrial and systems engineering leadership roles will be used to demonstrate the application of the model developed in the Materials and Methods section of this paper. One large automotive manufacture makes vehicles on a production line with a production line takt time of 60 s (Tm). Although each station along a production line will have its own inherent variability, in this aggregate analysis all production stations have the same target station takt time of 54 s (Tm,n) with a standard deviation of 3 s (). This results in a probability that each station will be able to keep up with the production line takt time of 60 s 97.7% of the time. Now, if that automotive manufacturer introduces the 3D product model into the production process, the company can reduce the variability of the time to complete an operation at a station given all of the right parts, tools, work allocation, and work instructions have been implemented. By reducing the standard deviation from 3 to 2 s as a result, reducing the standard deviation by 1 s while retaining the 54 s average takt time and retaining the 97.7% probability of completing the task within the production line task time, the takt time can be reduced by 2 s to approximately 58 s. This is a 3.3% reduction in production line takt time, allowing the company to produce approximately 3.3% more products per year (if production is the bottleneck in the overall manufacturing facility).
In this aggregate example, prior to the 3D product model use in the production process, the average takt time of the line (Tm) is 60 s, the production line operates 24 h per day (), so the assemblies produced on the line per day (αm) is 1440. The automotive manufacturer makes an average profit () on cars of approximately USD 5000 per vehicle (note that profit on trucks and sports utility vehicles [SUVs] is significantly more at closer to USD 20,000–25,000 per vehicle, and thus the value demonstrated throughout this paper would be much greater in dollar volume if applied to an SUV or truck production line). This results in an average daily profit () of USD 7.2 million. This automotive plant runs their production lines 5 days a week ( for 50 weeks per year (Ωm). The production line is down for maintenance work on weekends and over the fourth of July and Christmas holidays for a week each, resulting in 250 days of operation per year (Dm). This generates a yearly profitability for that production line () of USD 1.8 billion. Now when the 3D product model is introduced in the production process and reduces the standard deviation of the takt time at the stations, the products produced on the line per day (αm) increase to 1490 based on the 58 s takt time, or 50 more assembled units per day. This increase in production generates a daily profit () of USD 7.45 million, or an increase of USD 0.25 million per day. The yearly profit () increases as a result, to USD 1.86 billion, or an increase of approximately USD 62 million per year for that production line (). Note that if multiple production lines were improved via reduced variation from the implementation of the 3D product model in the production process, the value could be summed across these multiple production lines to capture the profitability benefit per year for a given plant. The profitability increases across all plants could then be summed to capture the total value for the increase in value generated by the implementation of the 3D product model in the production process. This aggregation within a production plant and an entire organization is a topic for future research, as other interaction effects and lurking variables may exist when evaluating the system at this level.
3.2. Faster New Product/Model Roll out to Production
In order to have cohesiveness between the varying sections of this paper, the average profitability per day () calculated in the prior section, at the 60 s takt time, will be used throughout the paper. Note, that although the prior section demonstrated a decrease in takt time by implementing the 3D product model in the production process and such an effect would increase the incremental profitability demonstrated here, that is not being taken into account. Such effects are called interaction factors between variables and can be considered in future research.
By having the 3D product model used in production processes, an automotive manufacturer was able to reduce the time before the production line was fully operational after introducing a new product/model from what had traditionally been 4 weeks of equivalent lost production time down to 2 weeks of equivalent lost production time, ultimately increasing the uptime of the line by 10 days. With the increase in uptime following the new product/model roll out (Um) of 10 days, and with 0.2 new product/model roll outs per year (Ε) (or in other words, a new product/model roll out once every five years) then the incremental profitability on the line is USD 14.4 million per year (). Using the 3D product model in the production process to generate faster new product/model roll outs results in an increase in profitability of 0.8%.
3.3. Less Time Updating Work Instructions
In another application of the 3D product model in the production process, an agricultural equipment manufacturer transitioned from using Microsoft Excel to reconcile engineering change orders with work instructions to using the 3D product model in combination with Proplanner’s Assembly Planner. In the original process using an Excel sheet, the company spent almost seven hours updating work instructions () following an engineering change order. In the new process, the company could complete the same update, with the 3D product model included in the production process work instructions, in just over two hours. This resulted in a savings of over four and a half hours per engineering change order and with around 245 engineering change orders per line processed each year (Km) that is over 1000 man-hours saved per year per production line. The company has industrial engineers with an average fully loaded cost of USD 60 per labor hour () updating the work instructions manually. By integrating the 3D product model into the production process, and automating that through Proplanner’s Assembly Planner, the organization is able to save USD 60,000 per year per line () as a result, reducing the cost associated with updating wok instructions by over 67%.
3.4. Quicker Operator Training
In an automotive manufacturer, the target takt time at station n on production line m (Tm,n) is 54 s, and a new operator takes three times as long, i.e., 162 s, to complete the new production task on their first attempt (Ψm,n,o,1). Prior to the implementation of 3D product model software in the shop floor training, the learning rate for this operator (Lm,n,o) is 86%. This means that each time the operator performs the task, on average, the operator will perform the same task 14% faster than the time before. This then creates a learning curve through which we can model the total time training before the operator reaches a time (Ψm,n,o,δ) that is as good as or better than the target takt time for that station n on production line m (Tm,n). The total time training between the initial attempt and when the target takt time is reached is the total time that operator spends training (), which using the initial production time, learning curve percent, and target takt time above equates to three hours of training per operator. To capture the total time spent training at station n on production line m the sum of all operators who were trained on the update at station n on production line m is calculated (). For this manufacturer, on average there are two operators per station per shift, two shifts, 350 stations per production line, and one production line. To translate the training time to quantitative cost of training dollars for production line m (Φm) the average cost of operators at station n on production line m (), a good approximation is USD 30/h fully loaded (including burden rate) multiplied by the total time spent training at station n on production line m across all stations on line m. This results in a training cost (Φm) of close to USD 400,000 per year, under the approximation that all operators have the same learning curve rate of 86% and their first attempt at the new production process was three times longer than the target takt time. However, the implementation of the 3D product model in the production process creates an opportunity for operators to understand and visualize the production process before performing it. This knowledge enables the operator to reduce the time required in their first attempt to conduct the production process to two times the target tact time while the learning curve rate remains the same at 86% (meaning the operator still performs the task 14% better each time). This reduces the operators total training time to 0.5 h, and the operator is able to achieve the target takt time in 25 training attempts, as opposed to 155 prior to the implementation of the 3D product model in the production process. This significantly reduces the training cost for the operators to learn the new production processes as the product model changes, saving hundreds of thousands of dollars per year () and reducing training costs by 84% while still maintaining the operators’ ability to meet the target takt time.
3.5. Smoother Transition to Field Use
In alignment with the prior operator training example, there are 350 stations per production line (Nm). Prior to implementing the 3D product model, the automotive manufacture discussed in this example has a reliability of each station on a given line (Rm,n) producing a quality product of 99.97% per station. This results in an overall reliability of the production line (Rm) producing quality products 90% of the time, meaning 10% of the products need to be re-worked. The average price to re-work a product () is USD 60 (two operator labor hours) on this production line, which with the production throughput and profitability rates noted earlier in the paper, result in a rework cost of over USD 2 million per year on one line (Qm). With the implementation of the 3D product model in the production planning and design process, the product is designed such that it improves the ease of manufacturability and removes possibilities for incorrect assembly (poka-yoke). This increases the probability of each station on the line producing quality products at their station by two hundredths of a percent to 99.99%. The result is rework costs reducing to less than USD 0.74 million per year on that production line, saving the company over USD 1.4 million each year in rework on that assembly line () via a 65% decrease in re-work costs.
3.6. Total Value of Implementing the 3D Product Model in Production and Assembly Processes
Each value area noted above provides an example applied to the quantitative model that can be used by companies and researchers alike to better understand the value that 3D product models can create when used in production processes. With the combination of the value creation across the demonstrated value areas, the total value generated is over USD 78 million in profit per production line (
Vm), an increase of over 4.3% in profitability in this model composed of aggregated data. The resulting data shown in the graphical user interface in
Figure 3 are an aggregate of the information from interviews with industry experts discussed throughout the Results section.
Future research can be undertaken to better understand the interaction effects between these areas of value, seeing if perhaps some value is being dual counted between areas, or if some additional value is generated by the interaction of varying areas of value which is greater than the sum of the individual value calculations. In addition, we note that the value described here is incremental profit without accounting for the costs of implementing the 3D product model software in production processes. In further research, these implementation and maintenance costs of the software that enables the use of the 3D product model in production processes can be described and articulated in terms of a cost benefit analysis. This research also does not take into account any tradeoffs that might occur in terms of loss of value when replacing legacy processes with the implementation of the 3D product model in production and assembly processes, and thus there is an opportunity for future research in that arena. In addition, the data extracted from the examples included above are the result of a sample size of six companies, so further research can be performed to incrementally validate the quantitative models developed in this research.
4. Discussion
Much of the prior research undertaken on the value of the 3D product model in assembly and production processes has either been qualitative in nature or limited to an individual company in scope, whereas this research aims to generate a quantitative model and quantitative value for the deployment of the 3D product model in production and assembly processes. The example below was provided previously in the authors’ published work, “
Value of the 3D Product Model Use in Assembly Processes: Process Planning, Design, and Shop Floor Execution,” and is included here to give the reader a sense for how this research compares to existing published research [
1].
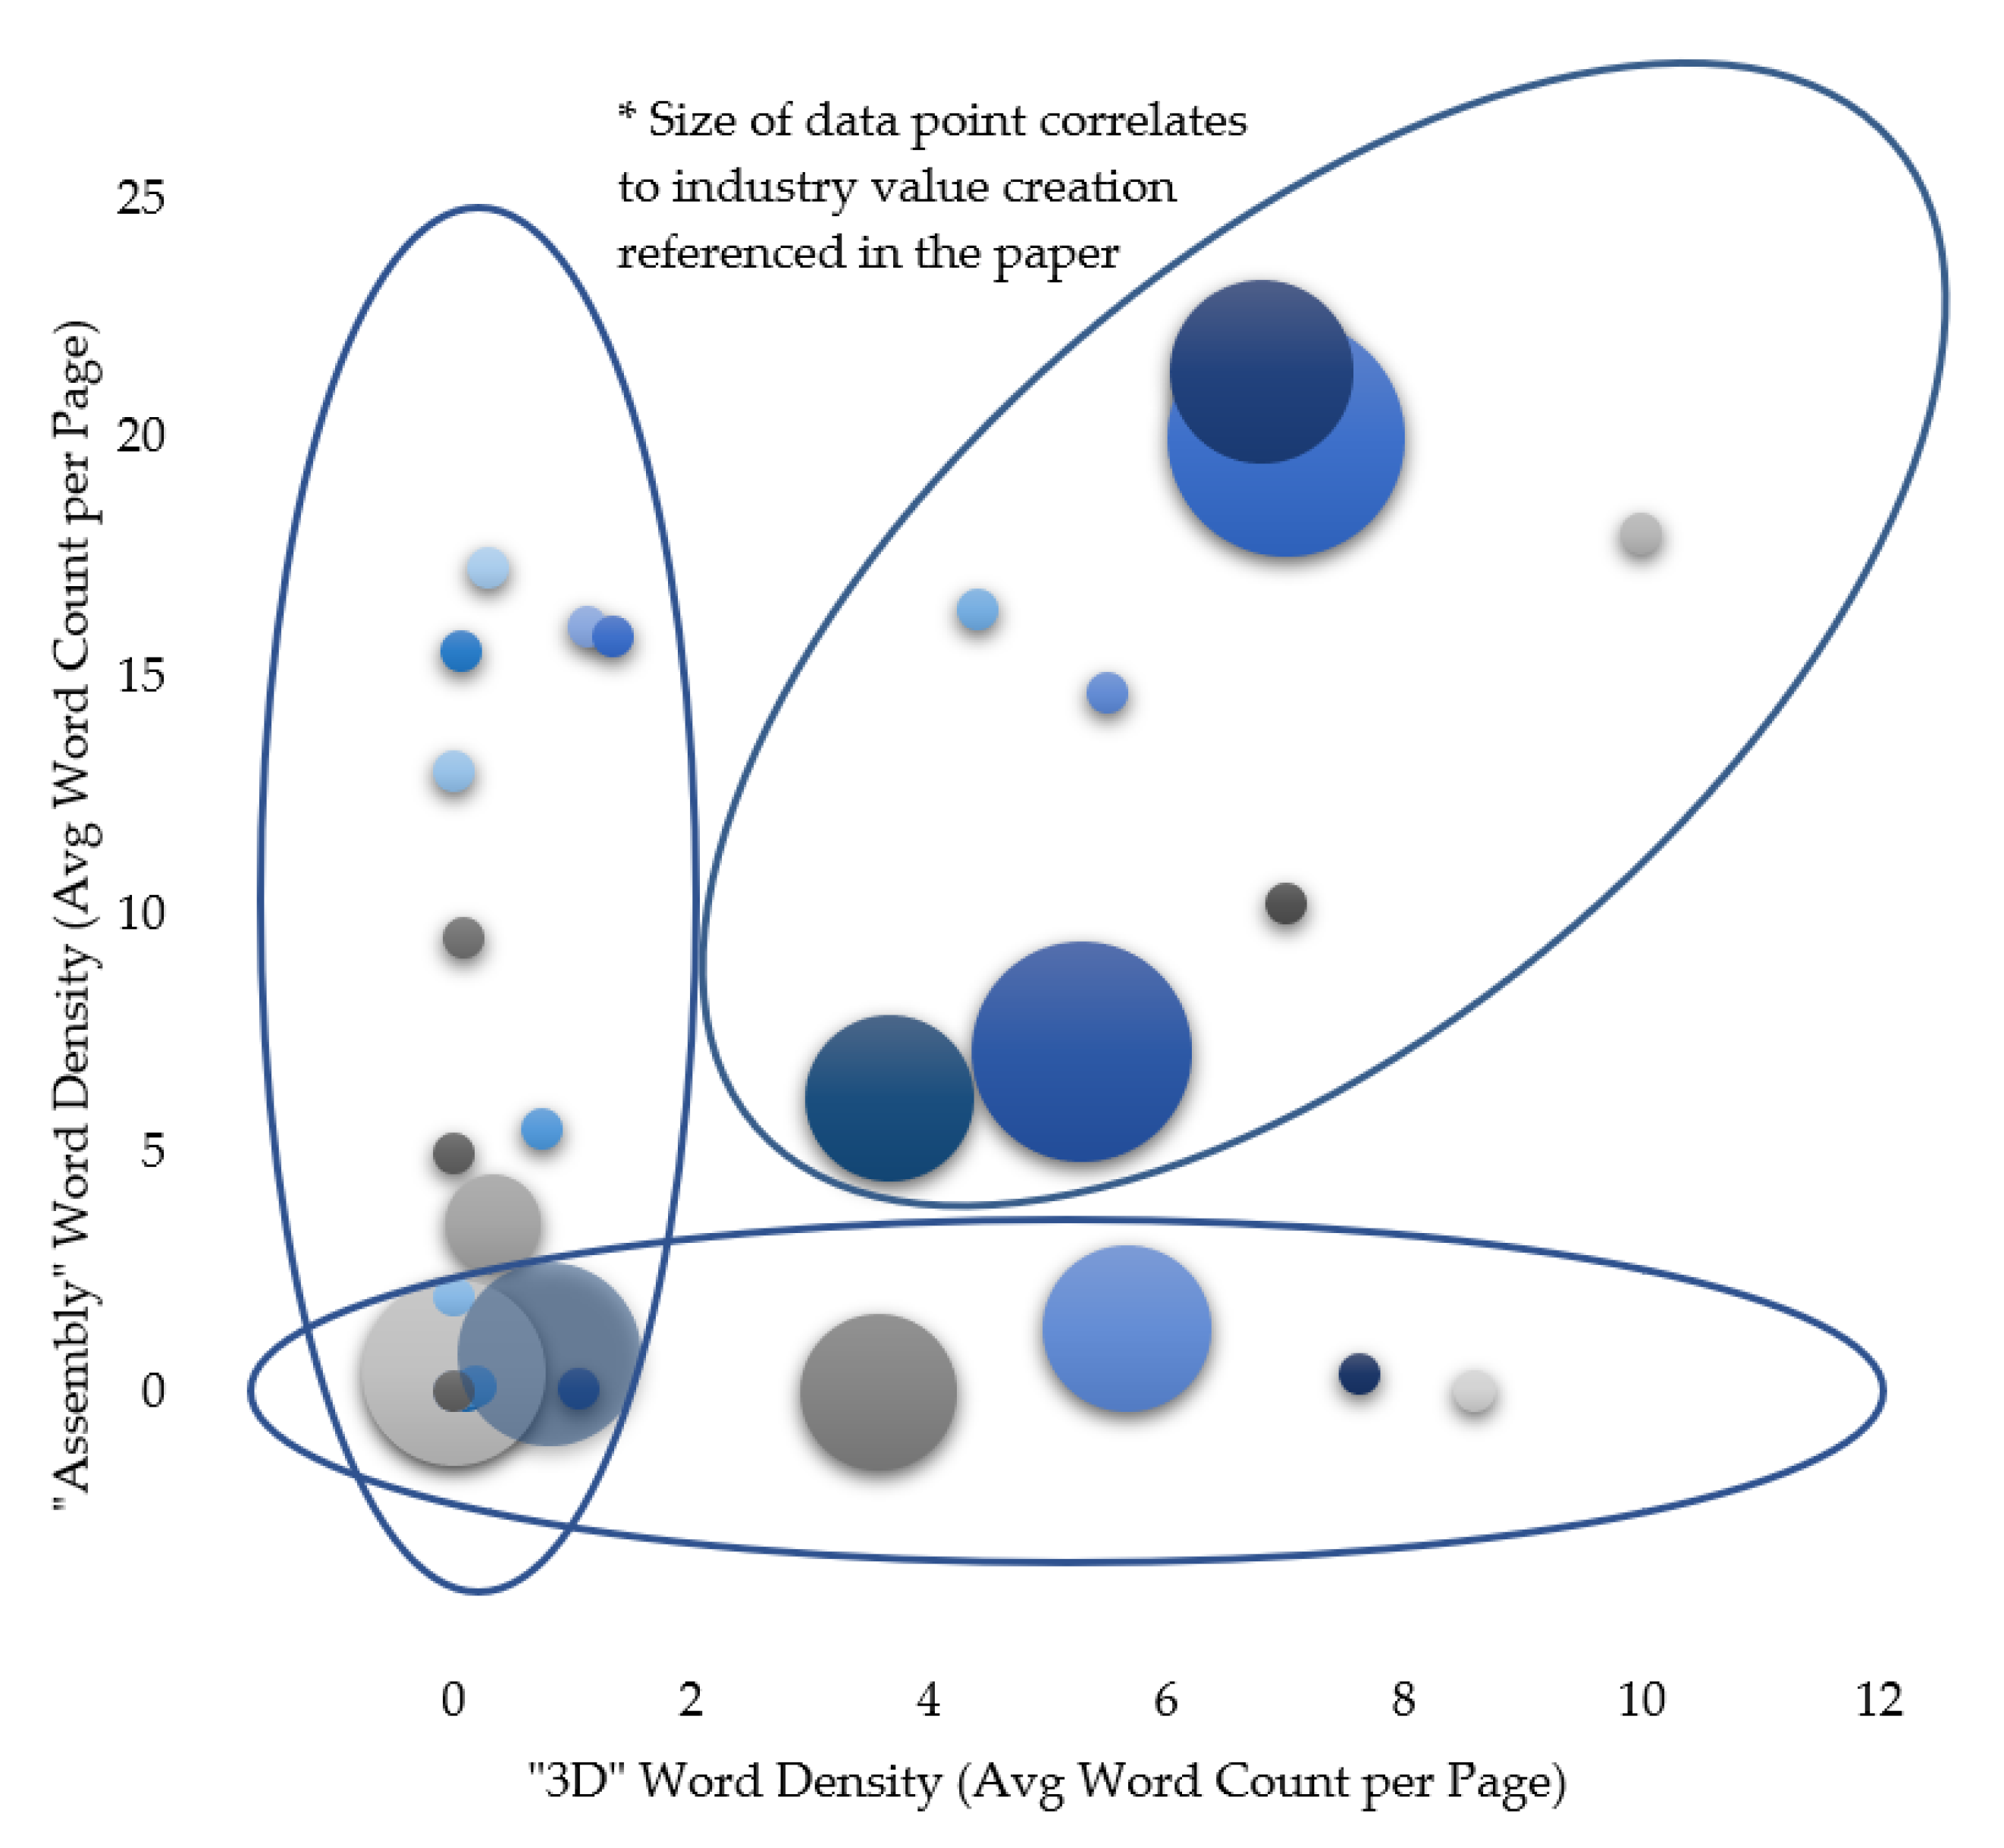
The plot of the relative densities of “3D” to “assembly” [average word count per page], where “value creation” is the size of each bubble, is shown in
Figure 4, where each different colored bubble represents a different journal paper, article, or conference paper.
Figure 4 demonstrates that while there was a lot of research published on 3D product models, and an equivalent amount published on assembly processes, less literature had been published on the use of 3D product models in assembly. This was especially evident in the lack of data points in the upper right corner of
Figure 4 and the fact that of those papers that do have a high density of “3D” and “assembly”, there is still a gap in the literature in terms of the value that the use of 3D product models creates in assembly processes.
The principal contributions of this paper are development of the quantitative model and determination of quantitative value for the five areas of value creation when implementing the 3D product model in the assembly and production processes. As demonstrated by a review of the prior research literature, this research fills a gap in terms of creating a model for and associating a quantitative value with the deployment of the 3D product model in the production and assembly processes. While some research discusses how applying a 3D product model improves the efficiency and reliability of process planning [
22], no quantitative data are given to support these findings. Thus, this paper looks to fill that gap by providing a quantitative analysis. Other papers do demonstrate quantitative value for implementing the 3D product model in the production process [
18,
23], but do so in the context of one company. Whereas this paper gathered input from and provides guidance to a quantitative value model applicable across manufacturing companies and industries. This research fills the gaps in existing research by developing a quantitative model for the value of deploying the 3D product model in the production and assembly process and delivers quantitative results. By delivering the quantitative model and quantitative results, this research then sets the foundation and focus for future work by academia and industry alike when researching and deploying the 3D product model to assembly and production processes.
5. Conclusions
While companies recognize that there is inherent value in applying the 3D product models beyond just product design, up to this point much of that value is still described in ways that were very qualitative in nature. This paper provides quantitative models to translate the qualitative value into numeric value. The quantitative value of implementing the 3D product model in assembly and production processes aligns with the qualitative value areas of focus in that all qualitative areas do in fact generate quantitative value. However, the magnitude of the value creation is different among the qualitative and quantitative results. Where the qualitative results showed the value generation to be in the following order (from the greatest value category to the least):
Accuracy of assignment of the right parts, tools, work allocation, and work instructions;
Faster new product/model roll out to production;
Less time updating work instructions;
Quicker operator training;
Smoother transition for field use.
The quantitative results showed the value generation of implementing the 3D product model in the assembly and production process to be as follows:
Accuracy of assignment of the right parts, tools, work allocation, and work instructions;
Faster new product/model roll out to production;
Smoother transition for field use;
Quicker operator training;
Less time updating work instructions.
The comparison of these results demonstrates that in both the qualitative and quantitative analysis the top two areas of implementing the 3D product model in production and assembly processes remained the same. This provides guidance for industry and academic practitioners alike in terms of a recommendation to focus future efforts in deploying and researching the implementation of the 3D product model use in production and assembly processes to the categories of: (1) Accuracy of assignment of the right parts, tools, work allocation, and work instructions, and (2) faster new product/model roll out to production. The discrepancy of the order of magnitude of value creation between the qualitative and quantitative model in Categories 3 through 5 also provide an area for future clarification and research. This additional research could include further validating the quantitative models by applying them against additional companies who have implemented the 3D product model in their production processes, to further to calibrate the models accordingly. In addition, other considerations to be taken into account in future research include interactions between variables in the quantitative value calculation, aggregation of the value at the manufacturing plant and organization levels, loss of value created due to tradeoffs of retiring legacy processes while implementing the 3D product model in production and assembly processes, and further development of the cost of implementing and maintaining the 3D product model in the manufacturing process solution.


