Article

Investigation of Different Storage Systems for Solar-Driven Organic Rankine Cycle

by
Evangelos Bellos
*,
Ioannis Sarakatsanis
and
Christos Tzivanidis
Thermal Department, School of Mechanical Engineering, National Technical University of Athens, Zografou, Heroon Polytechniou 9, 15780 Athens, Greece
*
Author to whom correspondence should be addressed.
Appl. Syst. Innov. 2020, 3(4), 52; https://doi.org/10.3390/asi3040052
Submission received: 26 October 2020 / Revised: 22 November 2020 / Accepted: 23 November 2020 / Published: 26 November 2020
(This article belongs to the Special Issue Solar Energy Systems and Applications)

Abstract

:
The objective of the present work is the study of different thermal storage systems for a solar-fed organic Rankine cycle (ORC) system that operates with parabolic trough collectors. The conventional design with sensible thermal oil storage is compared with a storage configuration with thermal oil and ceramic rocks, as well as the use of latent storage with phase change materials (PCMs) is investigated. The initial system is studied parametrically, and it is properly designed to order for the cycle to have high performance. Different organic fluids are studied in the organic Rankine cycle and different rocks are investigated as storage materials. Toluene is found to be the best candidate in the cycle and ceramic rocks are found to be the best candidate energetically and financially. The final results proved that both the thermal oil–ceramic rocks and the PCM are better technologies than the simple sensible thermal oil storage. For the design with a 180 m2 collecting area and 8 m3 storage tank volume, the thermal oil–ceramic rocks design leads to 13.89% system efficiency and net present value (NPV) to 129.73 k€, the PCM storage to 13.97% and 128.66 k€, respectively, while the pure thermal oil case leads to 12.48% and 105.32 k€, respectively. Moreover, it is useful to state that when the collecting area is varied from 160 m2 to 200 m2 with the tank volume at 8 m3, the efficiency enhancement with ceramic rocks compared to pure oil ranges from 8.99% up to 12.39%, while the enhancement with PCM ranges from 7.96% to 13.26%. For the same conditions, the NPV is improved with ceramic rocks from 18.35% to 25.79%, while with PCM from 14.17% to 25.29%.

1. Introduction

Solar concentrating power is an alternative way in order to produce clean electricity production at a reasonable cost and to face critical problems such as the increasing energy demand [1] and the global warming issue [2]. There are different solar concentrating systems that can be used in the solar thermal power units, such as parabolic trough collector (PTC), linear Fresnel reflector, solar dish concentrator, and solar central system (tower) [3]. Among them, PTC seems to be the most developed and mature technology for various scale applications [4]. The most common power block that is combined with PTC is the organic Rankine cycle (ORC) [5] because this cycle uses organic fluid with critical temperatures up to 300 °C, and so these fluids are ideal candidates for oil-based PTC, which operates up to 400 °C [6].
The solar-driven ORCs are common in the literature. Quoilin et al. [7] optimized a PTC-based ORC and they put the emphasis on the working fluid investigation, as well as on the proper design of the separate components. Finally, they found that the system efficiency can be 8%. Ashouri et al. [8] optimized a double-stage ORC driven by PTC with a sensible storage tank included in the system, and they found approximately 23% exergy efficiency. In another work, Tzivanidis et al. [9] optimized a regenerative ORC, which is fed by PTC and a sensible storage tank with thermal oil. They found that cyclohexane is the best working fluid, which leads to a yearly efficiency of 15% and a payback period of around nine years. Another dynamic approach with TRNSYS software was conducted by He et al. [10] and also an overall 15% efficiency was found. In a comparative study between solar–ORC and photovoltaic, Patil et al. [11] found that the solar–ORC leads to a lower levelized cost of electricity (LCOE) compared to photovoltaics, which is 0.19 USD/kWh. Another comparative study by Al-Nimr et al. [12] showed that the combination of a concentrating thermal photovoltaic with ORC is about 18% more efficient than the use of a single concentrating thermal photovoltaic.
An important advantage of the solar thermal ORC is the storage of thermal energy and not the storage of electricity as in photovoltaic systems, something that offers the possibility of not using batteries, which are associated with the high cost and environmental issues. In the literature, there are various storage techniques. The most usual is the use of a sensible storage tank that can store sensible heat by increasing the temperature of the stored thermal oil [6,9]. An alternative choice is the use of two tanks with molten salts in order to store thermal energy in an efficient way. Bassetti et al. [13] found that this technique enhances the yearly performance by about 19%. In another approach, Rodriguez et al. [14] found that the use of a single thermocline tank has a similar performance to a two-tank design but it has a 30% lower investment cost.
The use of latent heat storage systems is also common in the literature in order to keep the system temperature at lower levels and to reduce the system’s thermal losses. Manfrida et al. [15] found that the use of phase change material (PCM) for storage in a solar–ORC system is able to make the system operate for 80% of the day. Lakhani et al. [16] found that the discharging efficiency of a solar PCM–PTC system is about 83%. In another work, Alvi et al. [17] stated that the use of a direct system is more efficient than an indirect system in a solar PCM–PTC unit. Moreover, Lizana et al. [18] calculated that the use of latent storage in a system with the ORC for heat and power production can lead to an 18% performance enhancement compared to other conventional systems. Freeman et al. [19] compared the use of PCM and water storage tank for an ORC, and they found a 20% performance improvement with PCM design.
Another interesting idea is the use of pumped thermal energy storage, which was studied by Eppinger et al. [20]. They found that the power to power storage system has a conversion efficiency of 80%, while the respective sensible storage leads to 62% storage efficiency. The concept of chemical storage is a new one in solar-driven power systems, and it was studied by Gambini et al. [21]. They compared different metal hybrids for storage in low and high temperatures, and they found that this idea is promising energetically and financially. Furthermore, Scapino et al. [22] found that the sorption thermal storage system in an ORC is able to increase the investment profit by up to 41%.
The aforementioned literature review indicates that there is a lot of interest in the solar-driven ORC and in the storage configurations in order to enhance efficiency and to reduce cost. The storage issue is very important because the solar potential is stochastic and the proper storage system is able to provide continuous supply in the grid, something extremely important for grid stability. However, the storage system adds an extra cost in the total configuration and there is a need for a proper and careful design in order to optimize the system financially and to make it viable and competitive. In this direction, this work compares three different storage configurations of a solar-fed ORC. The examined storage techniques are the conventional sensible storage with thermal oil, the sensible storage system with thermal oil and rocks inside the tank, while the last examined storage system is the use of a tank with phase change materials inside it. These three storage systems are usual and promising choices and their comparison has high importance for the science and the future design of solar-driven power systems. To our knowledge, there is a lack of detailed comparative studies in the literature, and so this work comes to fill a scientific gap. The thermodynamic analysis of the ORC was conducted with a created mathematical thermodynamic model in Engineering Equation Solver (EES) [23], while the dynamic investigation was done with a homemade program developed in MATLAB. The analysis was conducted in energy and financial terms for different storage tank scales and different collecting areas. Moreover, different working fluids in the ORC were studied and different rock types. The results of this work can be used in order to estimate the system performance and to determine the most effective storage techniques in energy and economic terms. The knowledge of the most effective storage techniques is a key parameter for the suitable design and evaluation of future renewable thermal energy systems.

2. Material and Methods

2.1. The Basic Examined Unit

In this work, the basic examined unit is depicted in Figure 1. It was a solar-driven ORC with PTC and a storage tank. Three different storage systems were examined in this work, while the other parameters remained the same. The working fluid in the solar field was Therminol VP-1 [24], which can operate in the range of 12 to 400 °C without any issues. The ORC was a regenerative cycle and the main parameters of the basic unit are summarized in Table 1.
The heat recovery system (HRS) was modeled by using the pinch point analysis and the minimum pinch point was set at 5 K. The recuperator was modeled in order to have a minimum temperature difference at 10 K, while there was superheating in the turbine inlet at 20 K. The isentropic efficiency of the turbine was 85% and the pump was 70%, while the electromechanical generator efficiency was 98% and the motor efficiency that moves the pump was 80%. Moreover, it is important to state that electricity production was set at 10 kW.
The nominal selected solar beam irradiation was at 700 W/m2 and the respective equivalent solar angle was 20°. These were representative values for estimating the yearly system performance for the climate conditions of Athens (Greece) [25,26]. The condenser temperature of the system was selected at 40 °C and the default ambient temperature at 25 °C, which are reasonable values. In the preliminary studies of the system, the solar collecting area was 160 m2 and the storage tank volume was 10 m3. These values were selected after some tests in the created program in order to provide a proper operation with a reasonable yearly operating capacity factor.

2.2. Mathematical Formulation Part

In Section 2.2, the basic equations that describe the present problem are given and they are the basic core of the developed program.

2.2.1. Solar Collector Modeling

The thermal efficiency of the solar collector (ηcol) is described by the next equation [27]:
η c o l = 0.7408 · K ( θ ) 0.0432 ( T c , i n T a m b G b ) 0.000503 ( T c , i n T a m b ) 2 G b .
The incident modifier (K) of the system is given below [26]:
K ( θ ) = c o s ( θ ) 5.25097 · 10 4 θ 2.859621 · 10 5 θ 2 .
The solar angle (θ) is calculated for a single-axis tracking mechanism with the collector axis in the south-north direction.
The thermal properties of the Therminol VP-1 are given below. More specifically, the density (ρ) and the specific heat capacity (cp) are given [24]:
ρ = 1083.25 0.90797 · T + 0.00078116 · T 2 2367 · 10 6 T 3 ,
c p = 1.498 + 0.002414 · T + 5.9591 · 10 6 · T 2 2.9879 · 10 8 · T 3 + 4.4172 · 10 11 · T 4 .
The useful heat production of the solar collector (Qu) can be calculated as:
Q u = Q s o l · η c o l ,
where the solar irradiation is calculated according to the next equation:
Q s o l = A c · G b .
Moreover, the thermal oil outlet temperature from the collector (Tc,out) is found as follows:
T c , o u t = T c , i n + Q u m c o l · c p .

2.2.2. ORC Modeling

The efficiency of the ORC (ηorc) is defined as the ratio of the net electricity production (Pel) to the heat input in the heat recovery system (Qhrs):
η o r c = P e l Q h r s .
The heat input in the heat recovery system is written according to the next equation:
Q h r s = m h r s · ( T s , i n T s , o u t ) .
Moreover, the energy balance in the heat recovery input by the organic fluid side gives the next formula:
Q h r s = m O R C · ( h 4 h 3 ) .
More details about the mathematical modeling of the HRS can be found in Ref. [28].
The ORC net power production (Pel) is calculated by reducing the pump work by the turbine production:
P e l = η m g · m O R C · ( h 4 h 5 ) m O R C · h 2 h 1 η m o t o r .
The turbines’ isentropic efficiency (ηis,T) is defined according to the next equation:
η i s , T = h 4 h 5 h 4 h 5 , i s .
The pumps’ isentropic efficiency (ηis,P) is defined according to the next equation:
η i s , P = h 2 , i s h 1 h 2 h 1 .
The minimum temperature difference in the recuperator can be written as:
Δ T r e c = T 6 T 2 .

2.2.3. Storage Modeling

In this work, three different storage systems were investigated as they are presented in Figure 2. Figure 2a shows a typical storage system with thermal oil as the sensible heat storage material. Figure 2b shows a system with thermal oil and rocks inside the tank in order to increase the tank’s thermal capacity. The last examined system (Figure 2c) is the one with phase change material (PCM) inside the tank. There are tubes in the storage tank where the thermal oil flows and exchanges heat with the filling material, which is the PCM. These tubes have fins in order to increase the heat transfer rates between oil and PCM. It is also useful to state that there are different tubes for charging and discharging processes.
The system with pure thermal oil (Figure 2a) is modeled by using the following formulas. The general energy balance can be written as:
Q s t = Q u Q h r s Q l o s s ,
where the stored heat (Qstor) can be written by the energy balance in the fluid-volume:
Q s t o r = ρ s t · c p , s t · V · d T s t d t .
The storage tanks’ thermal losses (Qloss) are estimated as follows:
Q l o s s = A T · U T · ( T s t T a m b ) .
For a cubical tank, its outer area (AT) is calculated as:
A T = 6 · V 2 3 .
The system with the thermal oil–rocks can be modeled by using the Equations (15)–(18) but by modifying the density and the specific heat capacity as follows [29,30]:
ρ s t = ε · ρ o i l + ( 1 ε ) · ρ s o l i d ,
c p , s t = ε · ρ o i l · c p , o i l + ( 1 ε ) · ρ s o l i d · c p , s o l i d ε · ρ o i l + ( 1 ε ) · ρ s o l i d ,
where the subscript “solid” indicates the rock and the “oil” the thermal oil, while the “st” is the total system. Moreover, the void fraction (ε) is defined as follows:
ε = V o i l V o i l + V s o l i d = V o i l V s t .
In this work, the void fraction was selected at 40%, which is a usual value in the literature [31,32]. In this work, different materials were studied as possible rocks of the storage system. Table 2 includes the examined materials and their properties (density and specific heat capacity) [33]. More specifically, the studied materials were quartzite, basalt, concrete, bricks, and ceramic.
The last examined storage system is the use of phase change materials. In this work, a proper material with a high melting temperature was selected in order to operate the ORC in high temperatures and to give the possibility for high exergetic performance. For this reason, the NaNO3 material was selected with melting temperature at 308 °C and latent heat at 174 kJ/kg [34]. In this work, the PCM was assumed to have its melting temperature and its exchanges heating with the thermal oil by using the following equations [35]:
n h e x , c h a r g e = T c , o u t T c , i n T c , o u t T p c m ,
n h e x , c h a r g e = T c , o u t T c , i n T c , o u t T p c m .
This work used a finned configuration and so a high efficiency of 90% was assumed for both charging and discharging efficiencies.

2.2.4. Financial Investigation

The financial analysis of the present system was conducted by using various indexes in order to perform a multilateral analysis. Table 3 includes the general input of the financial analysis and Table 4 includes especially the costs for the different examined storage cases.
The yearly electricity production (Eel) is calculated as follows:
E e l = 0 8760 P e l · d t .
The yearly solar beam energy input in the solar field (Esol) is given as:
E s o l = 0 8760 Q s o l · d t .
The system capital cost (C0) is calculated as:
C 0 = K o r c · P e l + K c o l · A c + K t a n k · V .
The yearly cash flow (CF) is presented by the next equation [6]:
C F = K e l · E e l K O & M .
The yearly operating and maintenance cost (KO&M) is selected to be the 1% of the investment capital cost [6]:
K O & M = 0.01 · C 0 .
The investment simple payback period (SPP) can be found with the next equation [6]:
S P P = C 0 C F .
The investment payback period (PP) can be found according to the next equation [6]:
P P = ln [ C F C F C 0 · r ] ln ( 1 + r ) .
The investment net present value (NPV) can be found by using the next formula [6]:
N P V = C 0 + R · C F ,
where the parameter (R) is the equivalent project life [6]:
R = ( 1 + r ) N 1 r · ( 1 + r ) N .
The levelized cost of electricity (LCOE) is calculated by using the following expression [6]:
L C O E = C 0 + N · K O & M N · E e l .

2.3. Modeled Methodology

In this work, a thermodynamic model in EES was developed in order to simulate the organic Rankine cycle. The basic analysis was conducted for the configuration of Figure 1 for sensible storage with pure oil. The data of Table 1 were used in this initial analysis. Different organic fluids were studied such as toluene, cyclohexane, isohexane, MDM, n-pentane and isopentane. The best candidate was determined by a simple parametric analysis that used the dimensionless pressure parameter (α). This parameter is defined as the ratio of the high pressure in the turbine inlet (Phigh) to the critical pressure of every working fluid (Pcrit):
α = P h i g h P c r i t .
The results proved that toluene was the most appropriate candidate and thus this fluid was examined in the remaining analysis. Different saturation temperatures in the HRS were studied with toluene and the optimum value that maximized the yearly system efficiency was selected as the best one. At this point, it has to be said that the yearly analysis was conducted for the weather of Athens (Greece). For every month, the mean monthly day was used and the respective weather data can be found in Ref. [40]. The proper number of sunny days for Athens [6] was used for every month in order to simulate only the days with the potential of adequate solar direct beam irradiation. The dynamic investigation was done with a homemade model in MATLAB.
The next step was the investigation of different rocks in the storage system and different materials were studied. The material that led to higher system efficiency was selected to be evaluated as the proper one. The last stage was the investigation of different collecting areas and two storage tank volumes (8 and 10 m3) with the three studied storage systems. The results were evaluated financially and economically.

3. Results and Discussion

3.1. Initial Analysis of the Organic Rankine Cycle

The first part of the results section is a parametric investigation of the basic system with sensible storage with pure oil and the ORC. Figure 3 illustrates a comparison of different working fluids in the ORC. The analysis was performed for different values of the pressure parameter, which was a dimensionless parameter associated with the pressure in the turbine inlet. The results showed that the toluene was the best candidate with MDM, cyclohexane, isohexane, n-pentane, and isopentane to follow, respectively. So, toluene was selected as the most appropriate organic fluid in the ORC and this fluid was used in the following analysis.
Figure 4 shows the yearly system efficiency with toluene for different saturation temperature levels in the HRS. The results showed that the maximum system efficiency was found for saturation temperature at 279 °C where the yearly system efficiency was 14.36% and the ORC efficiency at 31.02%. These results were found for collecting area at 160 m2 and sensible storage tank volume with pure thermal oil at 10 m3. Practically, the increase of the saturation temperature increased the ORC efficiency, as it is also given in Figure 4, but the very high temperatures in the system increased the thermal losses in the PTC and in the tank. Therefore, after a limit, the increase of the saturation temperature was not beneficial for the system, the fact that led to system efficiency maximization at an intermediate temperature level. Figure 5 is the temperature–specific entropy depiction of the optimized system for a saturation temperature of toluene at 279 °C in the HRS. It is interesting to see that the temperature (T6) was significantly lower than the temperature (T5), something that indicated the high importance of using a recuperator in order to have a high ORC efficiency.

3.2. Parametric Investigations of the Storage with Pure Thermal Oil and with Thermal Oil–Rocks

Firstly, the storage system with thermal oil-rocks is studied in this section. For the optimized system with toluene, different rocks were examined for the configuration with a collecting area at 160 m2 and storage tank volume at 10 m3. In all the examined rocks, the void fraction was 40%. Figure 6 shows that the highest system efficiency was found for ceramic material with 14.63%, while basalt and bricks were the next candidates with 14.59%, quartzite with 14.56%, and concrete with 14.36%. So, energetically the ceramic rocks were the best materials for the storage system. Figure 7 illustrates the NPV of these cases. The ceramic material led to 119.17 k€, the bricks to 118.57 k€, the quartzite to 118.16 k€, the basalt to 118.04 k€ and to 115.86 k€. So, the financial analysis indicated that the ceramic rocks led to the maximum NPV. The financial and economic results made clear that the ceramic rocks have to be selected as the most appropriate candidate.
The next part regarded a parametric analysis for different collecting areas and storage tank volume at 10 m3 with pure thermal oil. Figure 8 shows that the optimum system efficiency was close to 140–160 m2. High collecting areas reduced the ability of the system to exploit efficiently all the useful heat product because the electricity production was set at 10 kW. Moreover, the low values of the collecting area made the system not able to reach easily the proper temperature limits in order to start the ORC operation, and so the efficiency was not maximized in the smallest examined collecting areas. Moreover, Figure 8 shows that the system with thermal oil–ceramic rocks presented higher system efficiency than the respective cases of the pure thermal oil for all the collecting areas. The efficiency enhancement was higher in higher collecting areas and it ranged from 0.28% at 100 m2 to 5.86% at 300 m2.
Figure 9 exhibits the electricity product for different collecting areas with pure thermal oil. It is clear that a higher collecting area led to greater electricity yield, but the increasing rate had a reducing trend. This fact was justified by the reduction in the system efficiency after the 160 m2. Moreover, the yearly operating time is depicted in the same figure and its curve has the same trend as electricity production. The yearly operating time ranged from 2693 h up to 5226 h, which meant that the system operating capacity also ranged from 30.7% up to 59.7%.
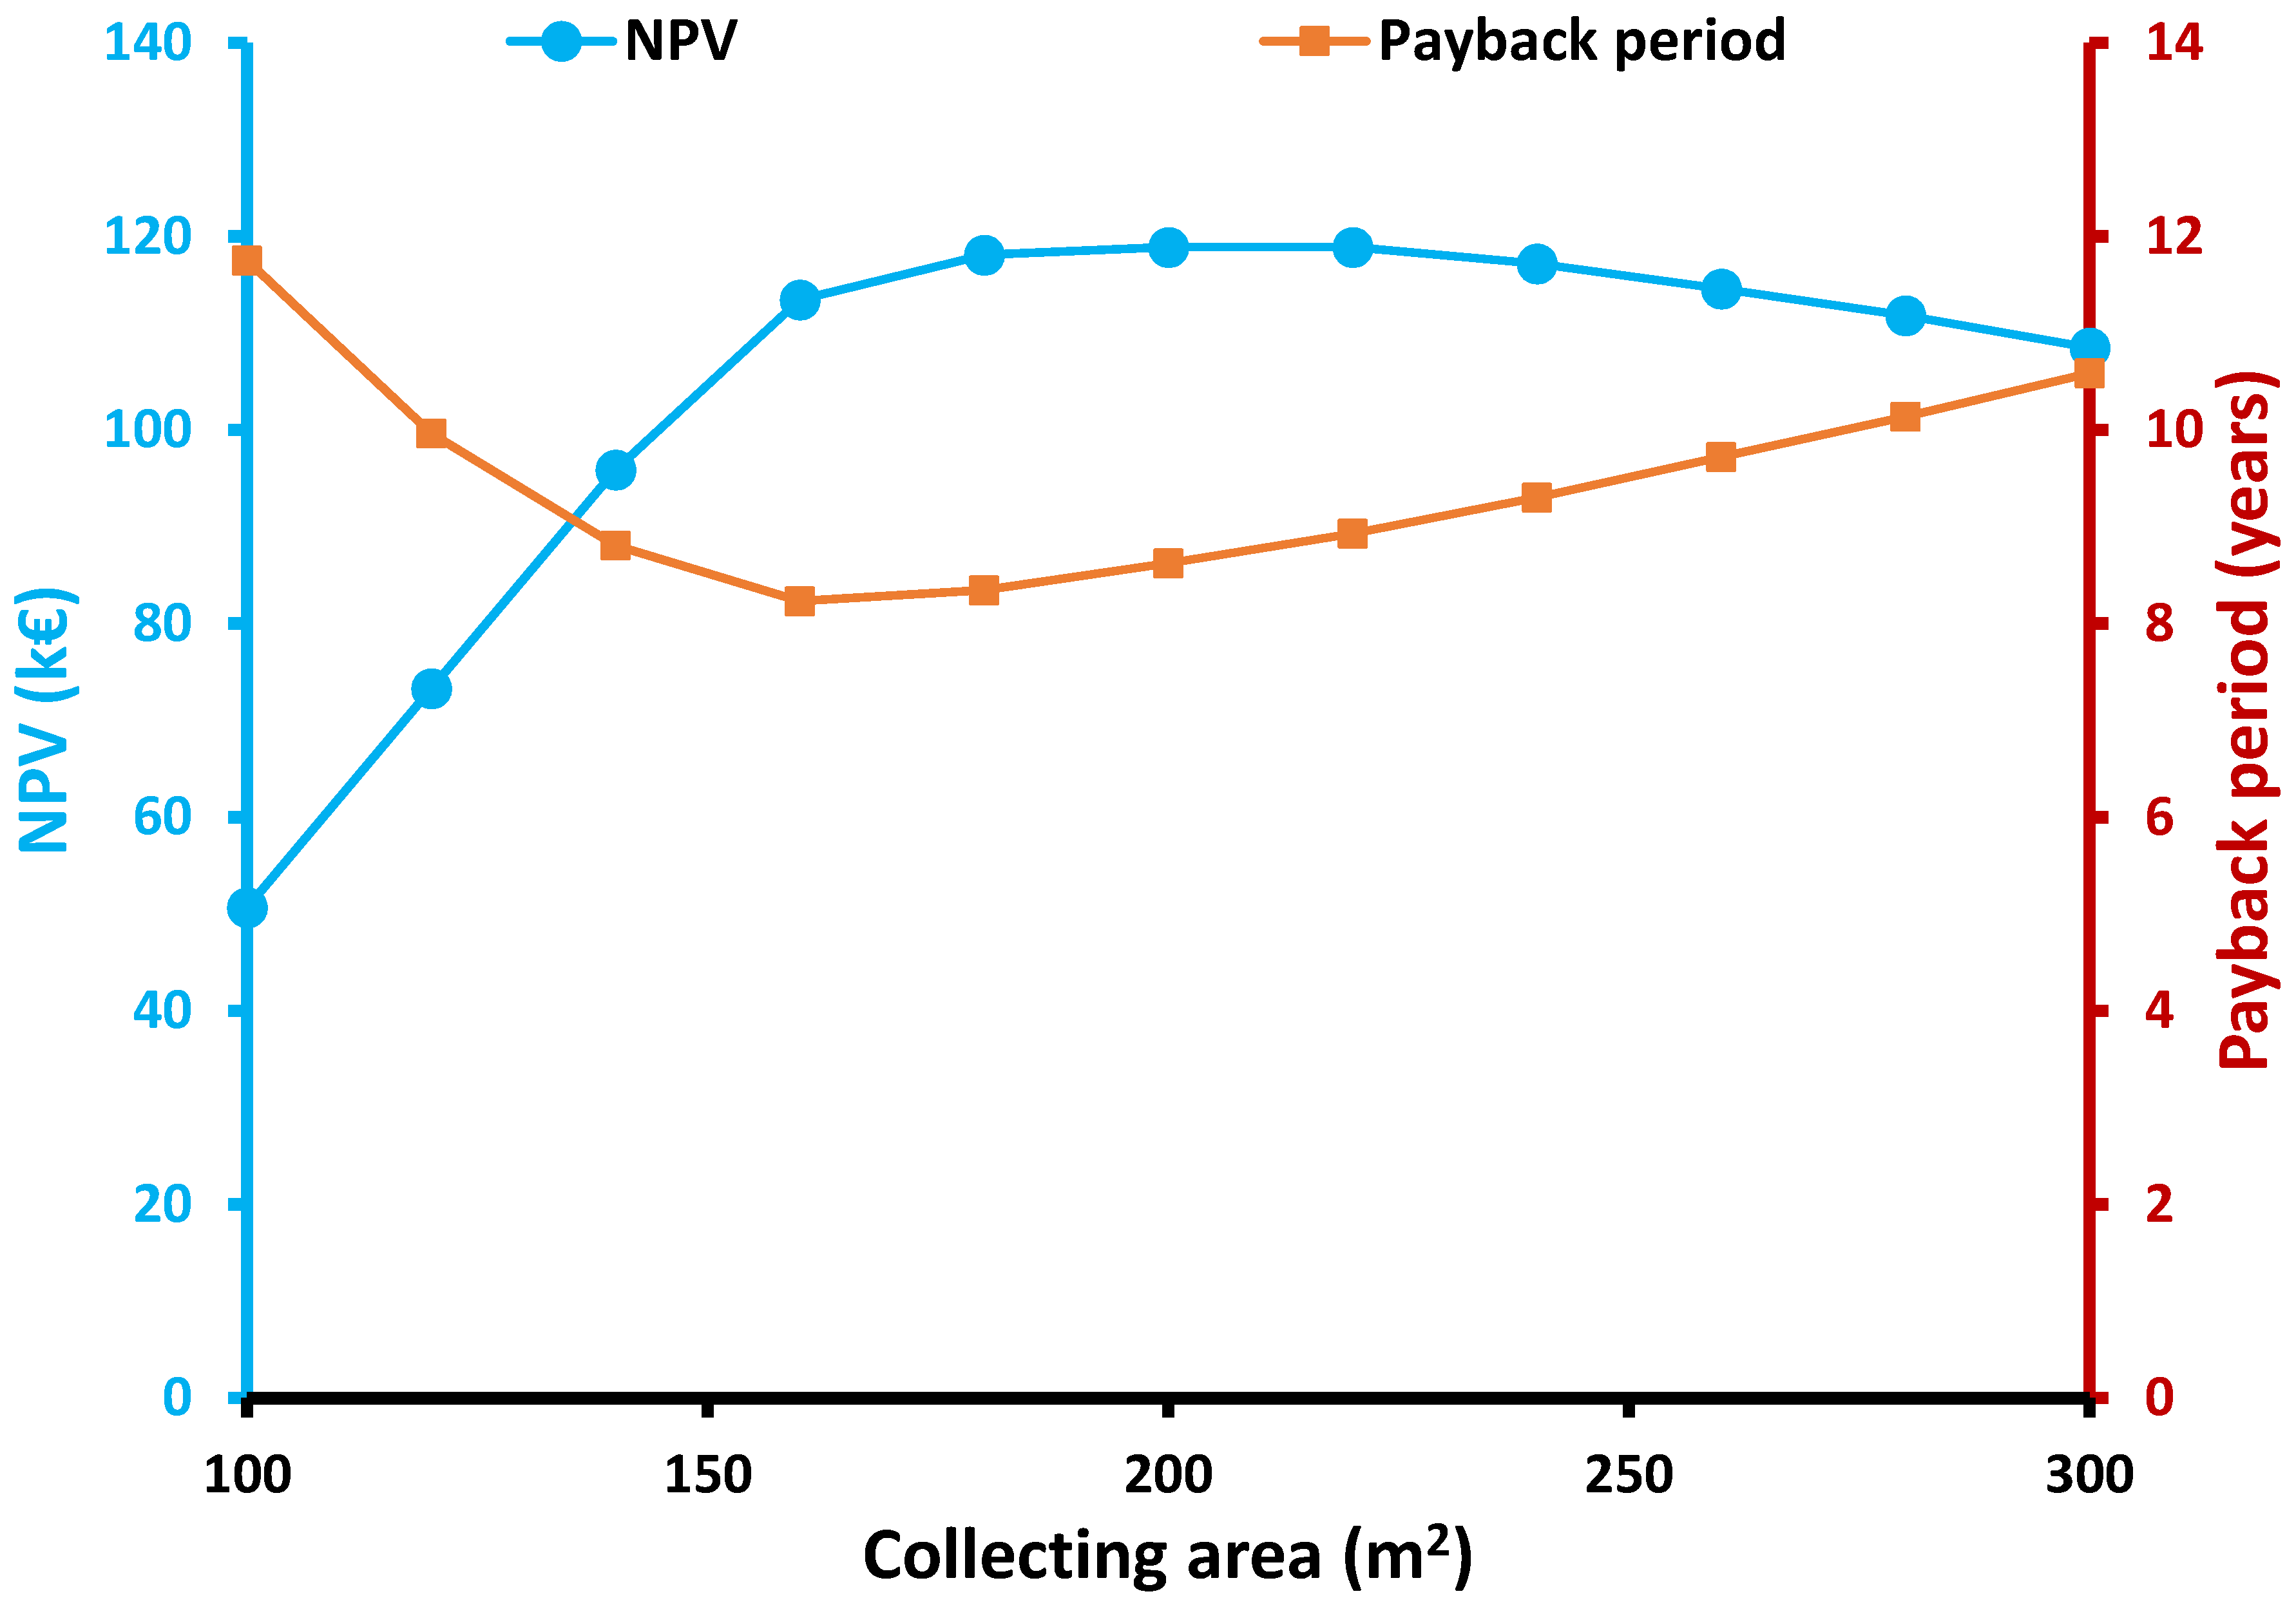
Lastly, Figure 10 shows the NPV and the payback period for different collecting areas. The NPV I maximized in the range of 180 to 220 m2, while the payback period was minimized close to 160 m2. The maximum NPV was about 120 k€, while the minimum payback period was about eight years.

3.3. Final Comparison of the Three Examined Storage Systems

The last part of the results section is devoted to the direct comparison of the three examined storage systems. The previous results in Section 3.1 and Section 3.2 were important in order to select the proper organic fluid, the proper rock material, and the proper ORC saturation temperature and to determine the most interesting collecting areas. According to the results of Section 3.2, the collecting area has to be in the range of 160 to 200 m2 in order to have both high system efficiency and high NPV. Two storage tank volumes were examined and they were 8 m3 and 10 m3. It has to be said that this volume was the total volume of the device, which included inside the tubing and all the stored materials.
Figure 11 shows the system efficiency for the six examined designs and the three different storage systems (total of 18 scenarios). It has to be said that in all the examined cases, the pure thermal oil case was less efficient than the PCM and the thermal oil–ceramic rock cases. The use of ceramic rocks was found to be the best of the three cases and the PCM for the other three cases, so it is obvious that both these techniques can enhance efficiently the system performance compared to the operation with pure thermal oil storage. The maximum system efficiency was found for the designs with 160 m2 (with 8 or 10 m3) and in these cases, the thermal oil–ceramic rock was the best design. The global maximum system efficiency was found to be 14.79% for the cases [Ac = 160 m2V = 8 m3], while the case with the PCM was 14.65% and with pure thermal oil was 13.57%.
Figure 12, Figure 13 and Figure 14 present the financial indexes of the examined system for all the scenarios. Figure 12 shows the results of the NPV, Figure 13 the payback period, and Figure 14 the LCOE. 
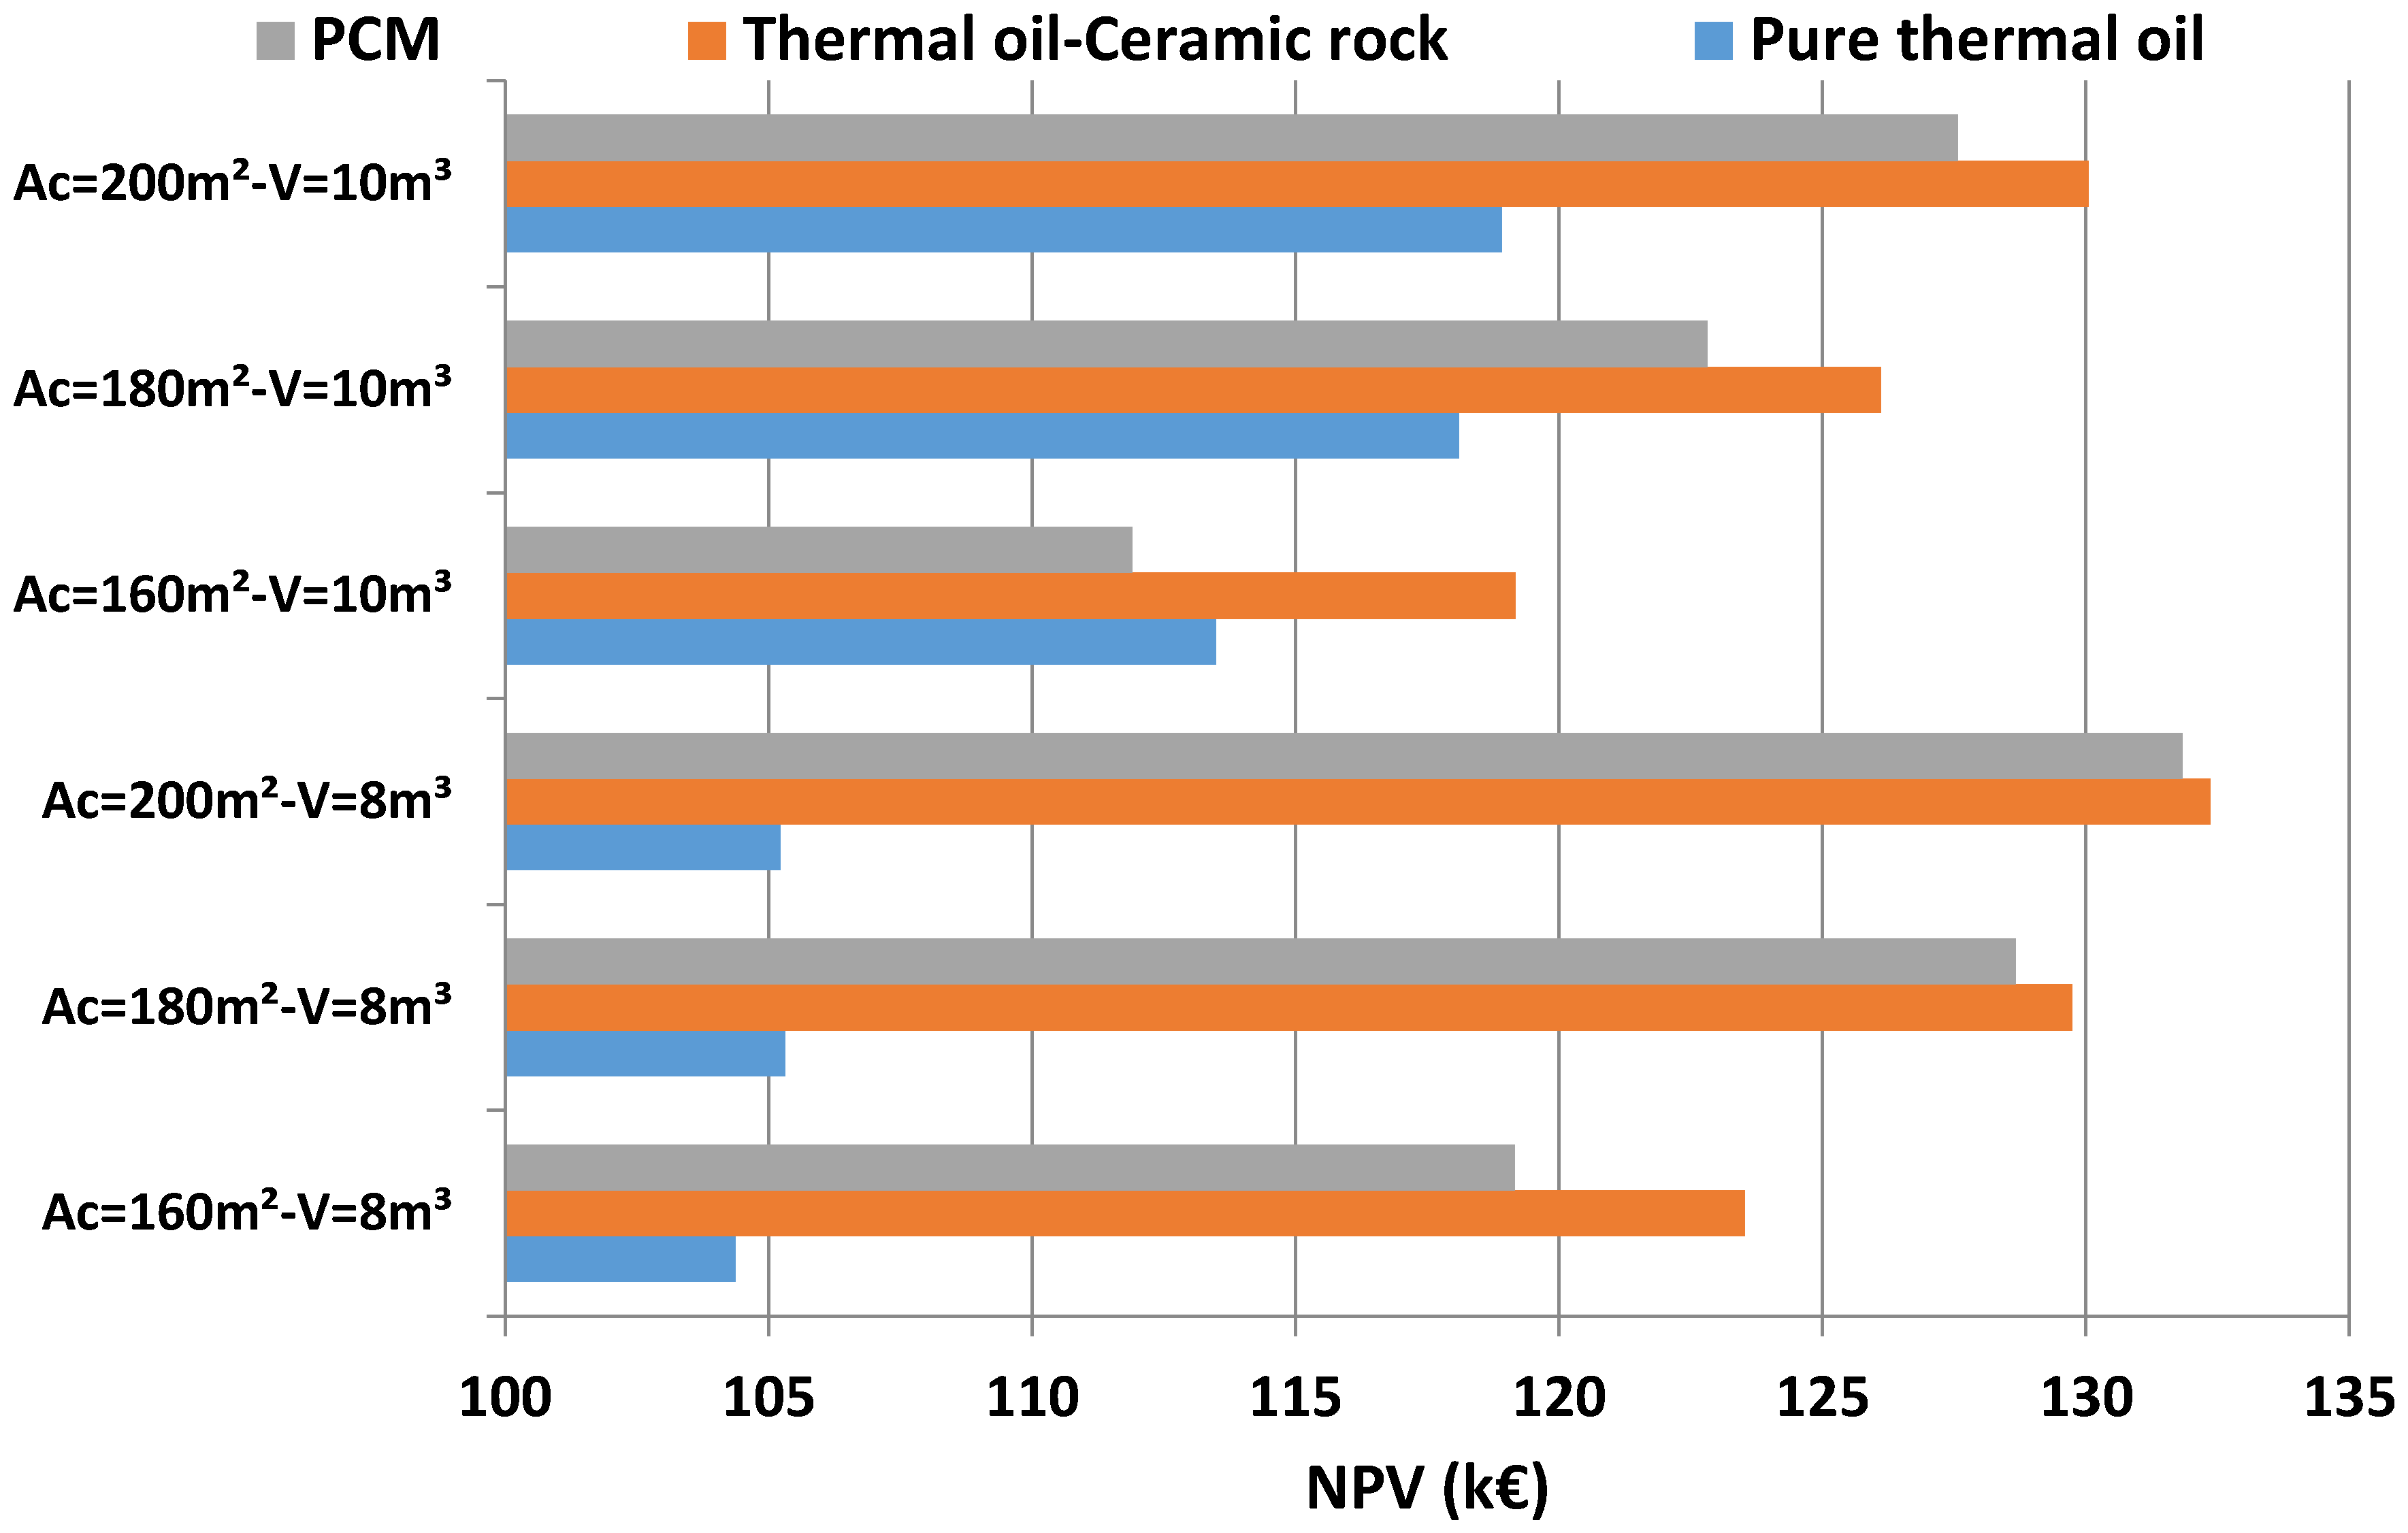
Figure 12 indicates that the overall maximum NPV was found for [Ac = 200 m2V = 8 m3] with thermal oil–ceramic rocks and it was 132.36 k€. It is important to state that the pure thermal oil led to the minimum NPV in all the cases, and thus it was not a financially attractive choice.
Figure 13 indicates that the overall minimum payback period was found for [Ac = 160 m2V = 8 m3] with thermal oil–ceramic rocks, and it was 7.56 years. Moreover, Figure 13 indicates that the overall minimum LCOE was found for [Ac = 160 m2V = 8 m3] with thermal oil–ceramic rocks and it was 0.0891 EUR/kWh. Table 5, Table 6 and Table 7 include the aforementioned data in order to be clear. Table 5 includes results for the case of pure thermal oil, Table 6 for the case of thermal oil–ceramic rocks, and Table 7 for PCM.
The previous analysis proved that only the single-optimization criteria indicated the use of the thermal oil–ceramic rock as the most suitable design, while the use of the pure thermal oil was the less efficient choice. However, it is important to state that the optimum designs (Ac, V) were different among the examined criteria, and so there was not a global maximum choice that was the best one with all the criteria. Therefore, there was a need to conduct a more detailed analysis with a multi-objective depiction of energy and financial criteria together. The system efficiency and the NPV were selected to be used in a two-dimensional depiction, which is given in Figure 15. The goal was to determine the choices that maximized both these criteria. So, a Pareto front was created with five design points: three points with thermal oil–ceramic rock and two points with PCM. Table 8 summarizes the optimum points of the Pareto front and also includes the symbols of these cases that correspond to the depiction of Figure 15. It can be said that every point in the Pareto front had a better index than the others; so there was not any point among them that had the same two indexes as the other point. So, all these five designs were optimum and the selection of one of them was based on extra criteria, such as the availability and the long-term reliability of every technology. It can be said that the use of ceramic rocks presented more optimum points in the Pareto front, and also it was the best design according to the single-criterion, and therefore it seemed to have precedence in the final selection. Generally, the results were better for the cases with 8 m3, and thus these results are explained in detail below.
For the design with the 160 m2 collecting area and 8 m3 storage tank volume, the thermal oil–ceramic rocks design led to 14.79% system efficiency and net present value to 123.52 k€, the phase change material storage to 14.65% and 119.16 k€, respectively, while the pure thermal oil case led to 13.57% and 104.37 k€, respectively. So, in this case, the electricity production enhancement with ceramic rocks compared to the pure thermal oil was 8.99%, while the enhancement with PCM compared to the pure oil was 7.95%.
For the design with a 180 m2 collecting area and 8 m3 storage tank volume, the thermal oil–ceramic rocks design led to 13.89% system efficiency and net present value to 129.73 k€, the phase change material storage to 13.97% and 128.66 k€, respectively, while the pure thermal oil case led to 12.48% and 105.32 k€, respectively. So, in this case, the electricity production enhancement with ceramic rocks compared to the pure thermal oil was 11.3%, while the enhancement with PCM compared to the pure oil was 11.9%.
For the design with a 200 m2 collecting area and 8 m3 storage tank volume, the thermal oil–ceramic rocks design led to 12.97% system efficiency and net present value to 132.36 k€, the phase change material storage to 13.07% and 131.83 k€, respectively, while the pure thermal oil case led to 11.54% and 118.91, k€ respectively. In this case, the electricity production enhancement with ceramic rocks compared to the pure thermal oil was 12.4%, while the enhancement with PCM compared to the pure oil was 13.3%.
Furthermore, it is important to note that when the collecting area was varied from 160 m2 to 200 m2 with the tank volume at 8 m3, the efficiency enhancement with ceramic rocks compared to pure oil ranged from 8.99% up to 12.39%, while the enhancement with PCM ranged from 7.96% to 13.26%. For the same conditions, the NPV was improved with ceramic rocks from 18.35% to 25.79%, while with PCM from 14.17% to 25.29%.
About the payback period, for the case [Ac = 160 m2V = 8 m3] it was 7.56 years for ceramics, 7.89 for PCM, and 8.55 for pure oil; for the case [Ac = 180 m2V = 8 m3] it was 7.63 years for ceramics, 7.81 for PCM, and 8.85 for pure oil; and for the case [Ac = 200 m2V = 8 m3] it was 7.84 years for ceramics, 7.99 for PCM, and 9.19 for pure oil.
Finally, it can be said that the use of PCM can enhance more electricity production than the use of ceramics, but the use of ceramics is more beneficial financially, according to all the criteria. Generally, both PCM and ceramic rocks have similar behavior, and they are clearly better choices than the use of pure thermal oil. Another point that has to be stated regards the relatively small differences between the efficiency and the financial parameter values. These small differences indicated the trends among the examined cases, and they were able to show the most effective techniques in every case.
Comparing the found results with others from the literature, it can be said that the found results accorded with other studies. For example, the use of rocks inside the tank was found to lead to a 30% improvement in the financial indicators of the system, according to Rodriguez et al. [14]. The present work found around a 25% improvement, which is a similar result. Moreover, the studies [18,19] found performance enhancement at 18% and 20%, while this work indicated 13%. The other studies [18,19] had a bit higher enhancement because they regarded small-scale systems where there were higher enhancement margins due to the non-optimized design. On the other hand, the baseline case of this work was an already optimized scenario so the 13% enhancement (maximum value) was an acceptable and promising one.

4. Conclusions

The objective of this work is the energy and financial comparison of three different storage systems in a solar-driven ORC. Parabolic trough collectors coupled to a storage system fed the ORC, which operated with toluene and was a regenerative cycle. The examined storage systems were of sensible and latent heat storage ways. More specifically, the conventional sensible tank with pure thermal oil was compared with the use of thermal oil–rocks and the use of PCM inside the tank. An analysis was conducted for the weather data of Athens with a developed dynamic model. The most important conclusions of the present study are summarized in the following bullets:
  • Among the examined working fluids for the ORC, toluene was found to be the best candidate. The saturation working fluid temperature in the heat recovery system that optimizes the system efficiency was found to be at 279 °C. Moreover, the investigation of different rock types for the storage system proved that the use of ceramic rocks was the best choice, according to both energy efficiency and net present value criteria.
  • The parametric analysis for different collecting areas proved that the use of rocks inside the tank was always energetically beneficial, compared to the pure thermal oil design.
  • The single-objective optimization proved that the optimum storage technique was with thermal oil–ceramic rocks, according to all the examined criteria. The PCM storage was the second-best technique, while pure thermal oil storage was the less attractive choice.
  • The multi-objective evaluation methodology proved that there were five Pareto front points that were optimum cases (see Table 8). These cases regarded three designs with ceramic rocks and two designs with PCM. Generally, the use of ceramic rocks was a better choice financially, while the PCM was a more efficient choice, especially for higher collecting areas.
  • For the design [Ac = 180 m2V = 8 m3], the ceramic rock design led to 13.89% system efficiency and NPV to 129.73 k€; the PCM to 13.97% and 128.66 k€, respectively, while the pure thermal oil led to 12.48% and 105.32 k€, respectively. The efficiency enhancement was found to be 11.3% with ceramic rocks and 11.9% with PCM, compared to the pure thermal oil case.
In the future, there is a need for investigating extra storage techniques such as chemical storage and storage with molten salt in order to perform a deeper and more detailed analysis. About the chemical storage, there are options for sorption processes and processes with reactions. The energy and financial indicators will have to be calculated in every case in order to find the best global storage scenario.

Author Contributions

Conceptualization, methodology, writing—review and editing, writing—original draft preparation, E.B.; conceptualization, methodology, investigation. I.S.; supervision, writing—review and editing, writing—original draft preparation, C.T. All authors have read and agreed to the published version of the manuscript.

Funding

This research received no external funding.

Conflicts of Interest

The authors declare no conflict of interest.

Nomenclature

AcArea of the solar field, m2
ATOuter area of the tank, m3
cpSpecific heat capacity, kJ/kg K
C0Investment capital cost, EUR
CFYearly cash flow, EUR/h
EYearly energy yield, kWh
GbSolar direct beam irradiation, W/m2
hSpecific enthalpy, kJ/kg
KIncident angle modifier, -
KcolSpecific cost of the collector, EUR/m2
KelCost of electrical energy, EUR/kWhel
KorcOrganic Rankine cycle-specific cost, EUR/kWel
KO&MOperating and maintenance cost for one year period, EUR
KtankStorage tank specific cost, EUR/m3
LCOELevelized cost of electricity, EUR/kWel
mMass flow rate, kg/s
NProject life, years
NPVNet present value, EUR
PPressure level, bar
PelNet electricity production, kW
PPPayback Period, years
PP0Pinch point in the heat recovery system, °C
QHeat rate, kW
QlossTank thermal loss rate, kW
QstorStored heat rate, kW
rDiscount factor, %
REquivalent investment lifetime, years
SDSunny days, days
SPPSimple payback period, years
tTime, hours
TTemperature, °C
TamAmbient temperature, °C
UTThermal loss coefficient of the tank, W/m2 K
VStorage tank volume, m3
Greek Symbols
ΔPPressure difference, bar
ΔTshSuperheating degree in the turbine inlet, °C
ΔTrecTemperature difference in the recuperator, °C
εVoid fraction, %
ηcolCollector thermal efficiency, -
ηis,TIsentropic efficiency of the turbine, -
ηgGenerator efficiency, -
ηhex,chargePCM tank charge efficiency, -
ηhex,dischargePCM tank discharge efficiency, -
ηmMechanical efficiency, -
ηmotorMotor efficiency, -
ηorcEfficiency of the power block, -
ηsysSystem efficiency, -
θIncident solar angle, °
ρFluid density, kg/m3
Subscripts and Superscripts
colCollector
c,inInlet
c,outOutlet
conCondenser
isIsentropic
inInlet
hrsHeat recovery system
oilThermal oil
orcOrganic Rankine cycle
outOutlet
PPump
sHeat source
s,inHeat source inlet
s,outHeat source outlet
satSaturation in the heat recovery system
solSolar
solidSolid part in the tank (rocks)
stStorage tank
TTurbine
uUseful
Abbreviations
EESEngineering Equation Solver
HRSHeat Recovery System
ORCOrganic Rankine Cycle
PCMPhase Change Material
PTCParabolic Trough Collector

References

  1. Rafique, M.M. Evaluation of Metal–Organic Frameworks as Potential Adsorbents for Solar Cooling Applications. Appl. Syst. Innov. 2020, 3, 26. [Google Scholar] [CrossRef]
  2. Eshraghi, A.; Salehi, G.; Heibati, S.; Lari, K. An assessment of the effect of different energy storage technologies on solar power generators for different power sale scenarios: The case of Iran. Sustain. Energy Technol. Assess. 2019, 34, 62–67. [Google Scholar] [CrossRef]
  3. Bellos, E.; Said, Z.; Tzivanidis, C. The use of nanofluids in solar concentrating technologies: A comprehensive review. J. Clean. Prod. 2018, 196, 84–99. [Google Scholar] [CrossRef]
  4. Bellos, E.; Tzivanidis, C. Alternative designs of parabolic trough solar collectors. Prog. Energy Combust. Sci. 2019, 71, 81–117. [Google Scholar] [CrossRef]
  5. Sami, S. Analysis of Nanofluids Behavior in Concentrated Solar Power Collectors with Organic Rankine Cycle. Appl. Syst. Innov. 2019, 2, 22. [Google Scholar] [CrossRef] [Green Version]
  6. Bellos, Ε.; Tzivanidis, C. Financial Optimization of a Solar-Driven Organic Rankine Cycle. Appl. Syst. Innov. 2020, 3, 23. [Google Scholar] [CrossRef] [Green Version]
  7. Quoilin, S.; Orosz, M.; Hemond, H.; Lemort, V. Performance and design optimization of a low-cost solar organic Rankine cycle for remote power generation. Sol. Energy 2011, 85, 955–966. [Google Scholar] [CrossRef] [Green Version]
  8. Ashouri, M.; Ahmadi, M.H.; Pourkiaei, S.M.; Astaraei, F.R.; Ghasempour, R.; Ming, T.; Hemati, J.H. Exergy and exergo-economic analysis and optimization of a solar double pressure organic Rankine cycle. Therm. Sci. Eng. Prog. 2018, 6, 72–86. [Google Scholar] [CrossRef]
  9. Tzivanidis, C.; Bellos, E.; Antonopoulos, K.A. Energetic and financial investigation of a stand-alone solar-thermal Organic Rankine Cycle power plant. Energy Convers. Manag. 2016, 126, 421–433. [Google Scholar] [CrossRef]
  10. He, Y.-L.; Mei, D.-H.; Tao, W.-Q.; Yang, W.-W.; Liu, H.-L. Simulation of the parabolic trough solar energy generation system with Organic Rankine Cycle. Appl. Energy 2012, 97, 630–641. [Google Scholar] [CrossRef]
  11. Patil, V.R.; Biradar, V.I.; Shreyas, R.; Garg, P.; Orosz, M.S.; Thirumalai, N. Techno-economic comparison of solar organic Rankine cycle (ORC) and photovoltaic (PV) systems with energy storage. Renew. Energy 2017, 113, 1250–1260. [Google Scholar] [CrossRef]
  12. Al-Nimr, M.d.A.; Bukhari, M.; Mansour, M. A combined CPV/T and ORC solar power generation system integrated with geothermal cooling and electrolyser/fuel cell storage unit. Energy 2017, 133, 513–524. [Google Scholar] [CrossRef]
  13. Bassetti, M.C.; Consoli, D.; Manente, G.; Lazzaretto, A. Design and off-design models of a hybrid geothermal-solar power plant enhanced by a thermal storage. Renew. Energy 2018, 128, 460–472. [Google Scholar] [CrossRef]
  14. Rodríguez, J.M.; Sánchez, D.; Martínez, G.S.; Ikken, B. Techno-economic assessment of thermal energy storage solutions for a 1 MWe CSP-ORC power plant. Sol. Energy 2016, 140, 206–218. [Google Scholar] [CrossRef]
  15. Manfrida, G.; Secchi, R.; Stańczyk, K. Modelling and simulation of phase change material latent heat storages applied to a solar-powered Organic Rankine Cycle. Appl. Energy 2016, 179, 378–388. [Google Scholar] [CrossRef] [Green Version]
  16. Lakhani, S.; Raul, A.; Saha, S.K. Dynamic modelling of ORC-based solar thermal power plant integrated with multitube shell and tube latent heat thermal storage system. Appl. Therm. Eng. 2017, 123, 458–470. [Google Scholar] [CrossRef]
  17. Alvi, J.Z.; Imran, M.; Pei, G.; Li, J.; Gao, G.; Alvi, J. Thermodynamic comparison and dynamic simulation of direct and indirect solar organic Rankine cycle systems with PCM storage. Energy Procedia 2017, 129, 716–723. [Google Scholar] [CrossRef]
  18. Lizana, J.; Bordin, C.; Rajabloo, T. Integration of solar latent heat storage towards optimal small-scale combined heat and power generation by Organic Rankine Cycle. J. Energy Storage 2020, 29, 101367. [Google Scholar] [CrossRef]
  19. Freeman, J.; Guarracino, I.; Kalogirou, S.A.; Markides, C.N. A small-scale solar organic Rankine cycle combined heat and power system with integrated thermal energy storage. Appl. Therm. Eng. 2017, 127, 1543–1554. [Google Scholar] [CrossRef]
  20. Eppinger, B.; Zigan, L.; Karl, J.; Will, S. Pumped thermal energy storage with heat pump-ORC-systems: Comparison of latent and sensible thermal storages for various fluids. Appl. Energy 2020, 280, 115940. [Google Scholar] [CrossRef]
  21. Gambini, M.; Stilo, T.; Vellini, M. Selection of metal hydrides for a thermal energy storage device to support low-temperature concentrating solar power plants. Int. J. Hydrog. Energy 2020, 45, 28404–28425. [Google Scholar] [CrossRef]
  22. Scapino, L.; de Servi, C.; Zondag, H.A.; Diriken, J.; Rindt, C.C.M.; Sciacovelli, A. Techno-economic optimization of an energy system with sorption thermal energy storage in different energy markets. Appl. Energy 2020, 258, 114063. [Google Scholar] [CrossRef]
  23. F-Chart Software. Engineering Equation Solver (EES). 2015. Available online: http://www.fchart.com/ees (accessed on 15 September 2020).
  24. Available online: https://www.therminol.com/products/Therminol-VP1 (accessed on 15 September 2020).
  25. Tzivanidis, C.; Bellos, E. A Comparative Study of Solar-Driven Trigeneration Systems for the Building Sector. Energies 2020, 13, 2074. [Google Scholar] [CrossRef] [Green Version]
  26. Bellos, E.; Tzivanidis, C. Parametric Investigation of a Trigeneration System with an Organic Rankine Cycle and Absorption Heat Pump Driven by Parabolic Trough Collectors for the Building Sector. Energies 2020, 13, 1800. [Google Scholar] [CrossRef] [Green Version]
  27. EuroTrough II: Extension, Test and Qualification of EUROTROUGH from 4 to 6 Segments at Plataforma Solar de Almeria. Project Cooordinator: Instalaciones Inabensa, S.A. April 2003. Available online: https://cordis.europa.eu/docs/projects/files/ERK6/ERK6-CT-1999-00018/66682891-6_en.pdf (accessed on 1 September 2020).
  28. Bellos, E.; Tzivanidis, C. Parametric analysis and optimization of a solar driven trigeneration system based on ORC and absorption heat pump. J. Clean. Prod. 2017, 161, 493–509. [Google Scholar] [CrossRef]
  29. Pacheco, J.E.; Showalter, S.K.; Kolb, W.J. Development of a Molten-Salt Thermocline Thermal Storage System for Parabolic Trough Plants. ASME J. Sol. Energy Eng. 2002, 124, 153–159. [Google Scholar] [CrossRef]
  30. Lugolole, R.; Mawire, A.; Okello, D.; Lentswe, K.A.; Nyeinga, K.; Shobo, A.B. Experimental analyses of sensible heat thermal energy storage systems during discharging. Sustain. Energy Technol. Assess. 2019, 35, 117–130. [Google Scholar] [CrossRef]
  31. Klein, P.; Roos, T.H.; Sheer, T.J. Experimental Investigation into a Packed Bed Thermal Storage Solution for Solar Gas Turbine Systems. Energy Procedia 2014, 49, 840–849. [Google Scholar] [CrossRef] [Green Version]
  32. Meier, A.; Winkler, C.; Wuillemin, D. Experiment for modelling high temperature rock bed storage. Sol. Energy Mater. 1991, 24, 255–264. [Google Scholar] [CrossRef]
  33. Esence, T.; Bruch, A.; Molina, S.; Stutz, B.; Fourmigué, J.F. A review on experience feedback and numerical modeling of packed-bed thermal energy storage systems. Solar Energy 2017, 153, 628–654. [Google Scholar] [CrossRef]
  34. Zalba, B.; Marín, J.M.; Cabeza, L.F.; Mehling, H. Review on thermal energy storage with phase change: Materials, heat transfer analysis and applications. Appl. Therm. Eng. 2003, 23, 251–283. [Google Scholar] [CrossRef]
  35. Mawire, A.; Taole, S.H. A comparison of experimental thermal stratification parameters for an oil/pebble-bed thermal energy storage (TES) system during charging. Appl. Energy 2011, 88, 4766–4778. [Google Scholar] [CrossRef]
  36. Tang, D.; Zhang, X.; Hu, S.; Liu, X.; Ren, X.; Hu, J.; Feng, Y. The reuse of red brick powder as a filler in styrene-butadiene rubber. J. Clean. Prod. 2020, 261, 120966. [Google Scholar] [CrossRef]
  37. Martin, C.; Bonk, A.; Braun, M.; Odenthal, C.; Bauer, T. Investigation of the long-term stability of quartzite and basalt for a potential use as filler materials for a molten-salt based thermocline storage concept. Sol. Energy 2018, 171, 827–840. [Google Scholar] [CrossRef]
  38. Jacob, R.; Saman, W.; Bruno, F. Capital cost expenditure of high temperature latent and sensible thermal energy storage systems. AIP Conf. Proc. 2017, 1850, 080012. [Google Scholar]
  39. Liu, M.; Saman, W.; Bruno, F. Review on storage materials and thermal performance enhancement techniques for high temperature phase change thermal storage systems. Renew. Sustain. Energy Rev. 2012, 16, 2118–2132. [Google Scholar] [CrossRef]
  40. Bellos, E.; Tzivanidis, C.; Belessiotis, V. Daily performance of parabolic trough solar collectors. Sol. Energy 2017, 158, 663–678. [Google Scholar] [CrossRef]
Figure 1. The examined system with parabolic trough collector (PTC), storage system and the organic Rankine cycle (ORC).
Asi 03 00052 g001
Figure 2. Storage tank technologies (a) Storage tank with pure thermal oil (b) Storage tank with rocks and thermal oil (c) Storage tank with PCM and finned tubes with thermal oil.
Asi 03 00052 g002
Figure 3. Investigation of different organic fluids for the ORC as a function of different pressure levels in the turbine inlet.
Asi 03 00052 g003
Figure 4. Investigation of the ORC and the system efficiency with pure thermal oil [Ac = 160 m2 and V = 10 m3] for different toluene saturation temperatures.
Asi 03 00052 g004
Figure 5. Temperature–specific entropy depiction of the optimum design for the ORC.
Asi 03 00052 g005
Figure 6. System efficiency for different rocks in the storage tank for Ac = 160 m2 and V = 10 m3.
Asi 03 00052 g006
Figure 7. Net present value for different rocks in the storage tank for Ac = 160 m2 and V = 10 m3.
Asi 03 00052 g007
Figure 8. System efficiency with pure thermal oil for different collecting areas and the respective enhancement in the thermal oil–rocks case.
Asi 03 00052 g008
Figure 9. Electricity production and yearly operating time for different collecting areas with pure thermal oil.
Asi 03 00052 g009
Figure 10. Net present value and payback period for different collecting areas with pure thermal oil.
Asi 03 00052 g010
Figure 11. System efficiency for different collecting area values and storage tanks with the three examined storage systems.
Asi 03 00052 g011
Figure 12. Net present value for different collecting area values and storage tanks with the three examined storage systems.
Asi 03 00052 g012
Figure 13. Payback period for different collecting area values and storage tanks with the three examined storage systems.
Asi 03 00052 g013
Figure 14. Levelized cost of electricity (LCOE) for different collecting area values and storage tanks with the three examined storage systems.
Asi 03 00052 g014
Figure 15. Depiction of the examined systems in terms of system efficiency vs. net present value for the 18 studied scenarios.
Asi 03 00052 g015
Table 1. Basic parameters of the solar-driven ORC unit.
ParameterSymbolValue
Nominal electricity productionPel10 kW
Turbine isentropic efficiencyηis,T85%
Electromechanical efficiency in the generatorηmg98%
Pump isentropic efficiencyηis,P70%
Motor-pump efficiencyηmotor80%
Pinch point in the heat recovery system (HRS)PP05 K
Default collecting areaAc160 m2
Default storage tank volumeV10 m3
Default solar irradiationGb700 W/m2
Default solar angleθ20°
Storage tank thermal loss coefficientUT0.5 W/m2K
Default ambient temperatureTamb25 °C
Superheating degree in the turbine inletΔTsh20 °C
Minimum temperature difference in the recuperatorΔTrec10 °C
Condenser temperatureTcon40 °C
Table 2. The examined storage materials as the solid material (rocks) [33].
Materialρ (kg/m3)cp (J/kg K)
Quartzite2600850
Basalt2900900
Concrete2200850
Bricks3200800
Ceramic3550900
Table 3. Basic financial parameters of this work [6].
ParameterSymbolValue
Collector specific costKcol250 EUR/m2
ORC specific costKORC3000 EUR/kWel
Electricity costKel0.285 EUR/kWhel
Yearly operation and maintenance costsKO&M1% of capital cost
Project life timeN25 years
Discount factorr3%
Table 4. Specific cost of the storage cases.
Storage CaseKtank (EUR/m3)Reference
Pure thermal oil1000[25,26]
Thermal oil–Quartzite850[36,37,38]
Thermal oil–Basalt900[36,37,38]
Thermal oil–Concrete800[36,37,38]
Thermal oil–Bricks850[36,37,38]
Thermal oil–Ceramic850[36,37,38]
Tank with PCM1100[36,37,38,39]
Table 5. Summary of the results for storage with pure thermal oil.
V (m3)Ac (m2)ηsysNet Present Value (NPV) (k€)LCOE (EUR/kWh)Payback Period (PP) (Years)
816013.57%104.370.09878.55
818012.48%105.320.10158.85
820011.54%105.220.10479.19
1016014.36%113.480.09578.23
1018013.41%118.100.09678.35
1020012.44%118.910.09948.63
Table 6. Summary of the results for storage with thermal oil–ceramic rocks.
V (m3)Ac (m2)ηsysNPV (k€)LCOE (EUR/kWh)PP (Years)
816014.79%123.520.08917.56
818013.89%129.730.09007.63
820012.97%132.360.09197.84
1016014.63%119.170.09217.87
1018013.79%126.100.09237.89
1020012.95%130.050.09388.04
Table 7. Summary of the results for storage with PCM.
V (m3)Ac (m2)ηsysNPV (k€)LCOE (EUR/kWh)PP (Years)
816014.65%119.160.09237.89
818013.97%128.660.09157.81
820013.07%131.830.09327.99
1016014.32%111.890.09708.38
1018013.77%122.810.09538.20
1020012.98%127.560.09638.30
Table 8. Summary of the Pareto front points of Figure 15.
Storage TypeV (m3)Ac (m2)SymbolηsysNPV (k€)
Ceramic8200 Asi 03 00052 i00112.97%132.36
PCM8200 Asi 03 00052 i00213.07%131.83
Ceramic8180 Asi 03 00052 i00313.89%129.73
PCM8180 Asi 03 00052 i00413.97%128.66
Ceramic8160 Asi 03 00052 i00514.79%123.52
Publisher’s Note: MDPI stays neutral with regard to jurisdictional claims in published maps and institutional affiliations.

