1. Introduction
Thermal spectroscopy lies in the heart of the radiation science [
1]. In particular, the thermal radiation arises as the propagation of the energy [
2]. In general, it travels in the form of the electromagnetic radiation, which is emitted by a hot surface that spreads heat waves in all possible directions [
3]. Such waves travel from the source to the points of absorption with the speed of light. Hereby, the thermal radiation does not require an intervening medium for its propagation. In this regard, infrared techniques play an important role [
4,
5,
6]. At a given length scale, infrared radiation takes place in a definite portion of the electromagnetic spectrum, where the radiation wavelengths lie in the range of about 700 nm to 1 mm. From the physical viewpoint, it is worth emphasizing that infrared waves have a longer wavelength than that of the visible light as perceived by our naked eyes [
7,
8]. However, it has a shorter wavelength than that of the radio waves.
Notice that the frequencies falling in the range of the infrared radiation are larger than the frequencies of the microwaves. Indeed, these frequencies are lower than those of the visible light that lie in the frequency band of about 300 GHz to 400 THz, see [
9] and [
6] concerning the passive infrared detection techniques. As far as the radiation effects over human bodies are considered, the IR portion of the electromagnetic spectrum is harmful in general. Fundamentals behind an optimized instrumental designing lie in the properties of emission spectra of black bodies [
10,
11]. Ideally, an object is termed as a black body when it absorbs all radiation that falls on it. That is, it absorbs all wavelengths of the electromagnetic radiation [
3]. Black bodies are the simplest object for testing our analysis in order to have an optimized electromagnetic radiation. In order to have an apt thermal coating [
12], we address the issue of optimization of the radiation energy function with respect to the surface temperature of the body and wavelength of the radiation.
It is worth mentioning that the emission of such radiations possesses a characteristic wavelength distribution that depends on the temperature of the black body [
13]. In the vicinity of a given equilibrium, the radiation distribution can be viewed as a function of the wavelength of the radiation and temperature of the radiating body. An optimization of the energy is further supported because the body emitting the radiation attains a uniform temperature distribution in a few milliseconds to a few microseconds [
14,
15]. Regarding an apt design of thermal instruments, the black body radiation serves as the standard basis to explore radiation properties of real surfaces [
7]. We consider optimization of the radiation distribution of a black body [
13] because it is fully absorptive and acts as a complete diffuser.
Herewith, the purpose of thermal detectors is achieved via the radiant energy that is radiated from a given body due to its temperature gradient. At temperatures above the absolute zero, all bodies emit thermal radiation [
1,
2]. On the other hand, a physical body reaches a hotter state by absorbing certain number of electromagnetic quanta [
3]. Apart from the visible spectrum, it is worth mentioning that we have low and high energy radiation zones [
7,
9,
10]. Namely, the infrared portion of the electromagnetic radiation is emitted naturally by a heated object that possesses wavelengths greater than the red end of the visible light, but less than that of the microwaves, viz. the range of 800 nm to 1 mm.
Notice that there exist other radiations in the electromagnetic spectrum such as ultraviolet radiation,
X-rays, and microwaves [
3]. Ultraviolet radiation is an important element of the electromagnetic radiation that is radiated from the Sun, and other artificial energy sources, e.g., solarium [
16]. Importantly, the Sun is among the main sources of the UV radiation. Specifically, ultraviolet radiation falls in a different wavelength intervals of the electromagnetic spectrum, which are shorter than ordinary visible light, but larger than those of
X-rays [
17]. Namely, the ultraviolet region covers the wavelengths from the violet edge of visible light, viz. 400 nm to 10 nm, see [
10]. Therefore, the UV zone constitutes of about
of the total electromagnetic spectrum [
3], received as the output of the Sun. Ultraviolet radiation is present in electric arc lamps and mercury vapor lamps, as well. In general, radiation out of the visible portion of the electromagnetic spectrum is harmful [
18]. For example, UV light causes sunburn, premature aging, eye damage, skin damage, and other diseases such as skin cancer [
18].
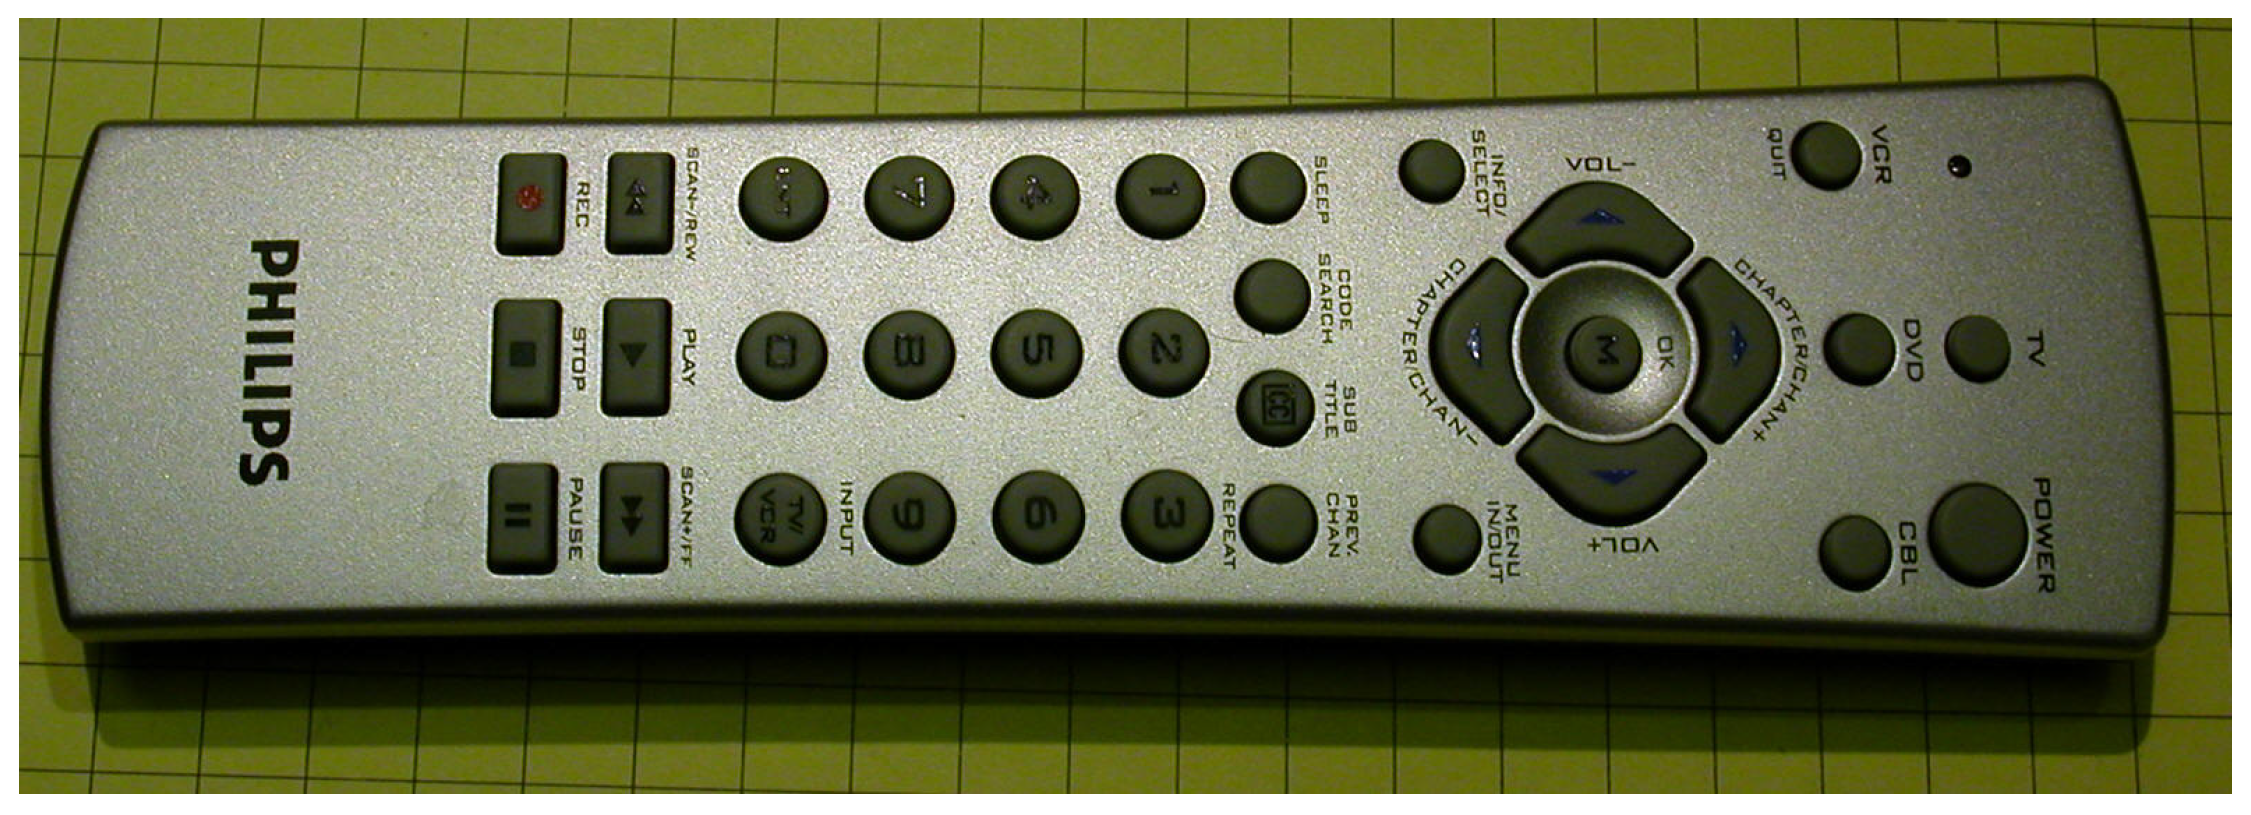
Indeed, our study finds applications in a number of common devices such as the infrared sensors, thermal detectors, audible and ultrasonic sensors, railway sensors, and visible light devices such as photo transistors, CdS cells, and others. Hereby, various utilities arise in daily-life, for instance, see
Figure 1 for an illustration of the pulsed infrared sensors as a TV remote control [
19]. This involves an application of the control theory, infrared sensors, and their pulse generations by a 555-timer or an associated microprocessor. Such sensors are in use over the last 25 years to select channels, adjust the volume and related control systems.
Concerning the thermal radiation [
2,
3], the quantization of the electromagnetic energy forms a spectrum covering the infrared, visible, ultraviolet, and other zones of the light. This is achieved by the thermal agitation of the molecules or atoms of a material. For example, a person in front of a fire can be heated because of the radiation emitted from the fire, even when the surrounding is relatively cold. In this concern, the heat can be transferred from a warmer element to the surrounding by conduction, convection, and radiation [
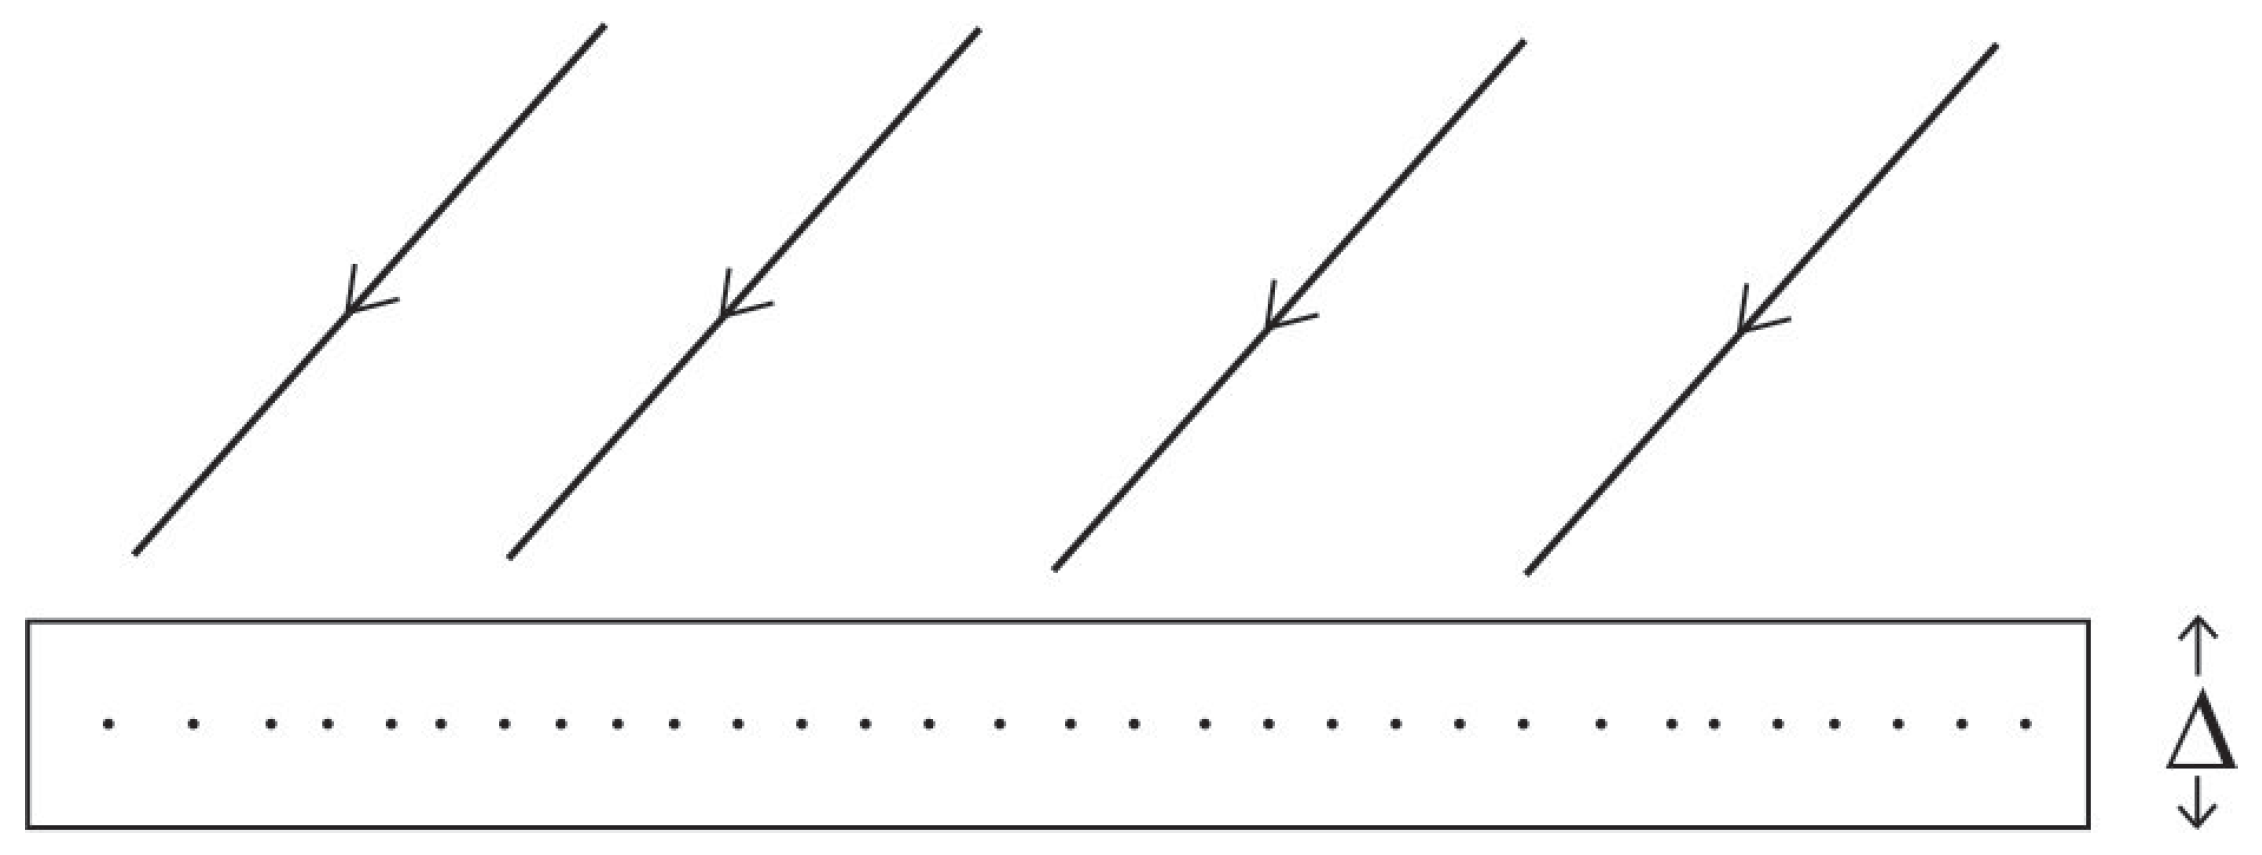
20]. In
Section 3 and
Section 4 the optimization of the radiation distribution is achieved by minimizing the associated energy with respect to the wavelength and surface temperature of the emitting body, see the schematic representation of the absorption in
Figure 2.
In this paper, we concentrate on the radiation effect of electromagnetic field [
21]. Note that the heat transfer (mediated via the above mentioned conduction and convection mechanisms) is effectuated by a definite temperature change over the surface of the material [
13,
14,
15]. However, this property may not hold for the case of the heat transfer by radiation. All such phenomena happen because of the existence of the emission spectrum of a radiating body. Emission spectra of arbitrary black bodies can be categorized in various intervals of the wavelength that encompasses all electromagnetic spectrum. As the radiation is absorbed by a black body, it correspondingly radiates heat waves as in the solar light [
13]. In this setup, we term the emission of the thermal radiation of a given black body as the black body radiation [
14,
15].
Applications of the optimized IR radiation, thermal detectors, and their apt designing techniques fall in the scope of the present research. Instrumentally, thermal detectors can be realized as the devices, which assimilate thermal radiation [
11], whereby an increment or decrement in the temperature attributes to a detectable output. The process can fundamentally be viewed as a resulting electrical signal. This is so because there are certain wavelength zones that are physically associated to an undermining energy, which corresponds to a temperature change, rendering an equivalent electrical system [
22]. It is worth noticing that there is no wavelength dependency, whereby we find an apt emergence of energy converting instruments as in infrared detectors [
23]. These are largely used with a window type material, which transmits the infrared light.
Physically, the thermal detectors [
24] can mainly be classified into four types: (i) Thermopile detectors where the temperature change takes place via an electromotive force, (ii) bolometers that change the undermining resistance, (iii) pyro-electric detectors working via a change in dielectric surface charge, and (iv) diode based detectors where the change takes place as per their voltage-current characteristics. Further applications arise in examining the geometry of Military Ship Neural [
25] whose security is characterized via basic elements of the IR radiation. Following the same, we present an intrinsic study providing the optimal design of infrared devices by allowing fluctuations in the Planck diffusion law. Namely, in this paper, we discuss the nature of fluctuations over a specified range of the emission wavelength
of an electronic device with its varying surface temperature
T. Our model finds further importance in the associated infrared remote sensing [
26].
Various dimensions of an optimized radiation distribution are anticipated further. In particular, an apt designing of thermal detectors [
24] is sought as the suit of the present analysis. Recall that a detector based on the heat transfer mechanism can be viewed as a fire alarm device that responds via the convicted thermal energy of an undermining filament. This increases the temperature beyond a given cutoff. Such a detector is a heat sensitive element that should be optimized to detect small thermal variations. This necessitates an optimization of the thermal radiation energy. In short, given such an element, the undermining thermal mass and conductivity regulate the flow rate of the heat. For a chosen element, the heat-based detectors [
27] are used in the protection of properties and monuments, as well. This happens because such detectors trigger an alarm when their surrounding temperature increases beyond a fixed threshold.
In short, it is worth emphasizing that the present analysis finds its application in various recent developments concerning the thermal images and IR technology such as the thermal imaging and three-phase induction motor [
28], infrared analysis based fault detection [
29], single-phase induction motor [
30], and infrared thermography and CFD modelling [
31]. In the light of Fourier transforms, artificial neural networks, and real-time analysis, the scope of this research continues towards the infrared spectroscopy and accelerated thermal aging [
32], aerial infrared imagery, and convolutional neural network [
33], 3D printing thermoplastics [
34] and their nonuniformity corrections, see [
35] towards the neural network regression.
Following the above observations, this research emphasizes the optimal design of thermal devices by allowing fluctuations in the Planck diffusion law. We have discussed the nature of fluctuations over a range of the emission wavelength of an electronic device with its varying surface temperature. The presented study is supported by the radiation distribution fluctuations about the Wien’s law. Namely, in the light of the fluctuation theory, we anticipate that an IR detector works well whenever the Planck diffusion law fluctuates in the vicinity of its critical points
. The descriptive analysis is relegated to
Section 2, see Equation (
3). Namely, the present study is essential for the (i) optimization over fluctuations, (ii) classification of thermal detectors, and (iii) their stability criteria towards the formation of optimized thermal images via an arbitrary radiating body with a varying surface temperature.
The rest of the paper is organized as follows. In
Section 2, we present a brief review of the model regarding the radiation distribution. In
Section 3, we offer the relevant analysis of the radiation function when the temperature and wavelength vary. The associated global analysis is given in
Section 4. In
Section 5, we give qualitative discussion of the results and their interpretations towards the designing of thermal instruments. In
Section 6, we conclude the paper with a brief discussion for future research and developments.
2. Review of the Model
Historically, IR techniques are known since Herschel’s historical experiment in the 18th century regarding refrangibility of the invisible spectrum of the Sun. Further, IR technologies are among the important controlling factors concerning night visioning. This is realized by optimizing the IR image formation over variations of the temperature and emission wavelength. Emissivity helps recognizing and surveillance of various defense instruments, such as tanks, anti-tanks and missile systems, Hull’s military ship, and air-to-air missiles. Detection and concealing of such instruments are achieved largely on the basis of IR technology.
Our proposed optimization of thermal energy radiation finds peaceful applications including industry, health, earth resource management, and energy conversation. Particular applications include a detection of cancer and other trauma, satellite IR images, global monitoring of the environment, pollution control and climate changing. Other technical aspects of this research include chemical monitoring, IR spectroscopy via frequency mode oscillations, IR astronomy, and monitoring of road accidents. As far as fluctuations in the radiative energy is concerned, the optimization analysis is equally supported at microscopic level by vibrations of atoms, their excitation to high energy states, their descending to low energy states, vibrations of charge particles, electronic vibrations, and all other instruments generating electromagnetic radiation.
In this regard, the Planck diffusion law as a real valued map from the space of the wavelength and temperature
to the set of real numbers
is defined by
Here, we consider an estimation of the presence of enemies instrument, sensors or other sources of a danger via an optimized detection of the radiation of an emitting body. Let us consider an enemy’s instrument that emits radiation with certain wavelength
in a given background temperature
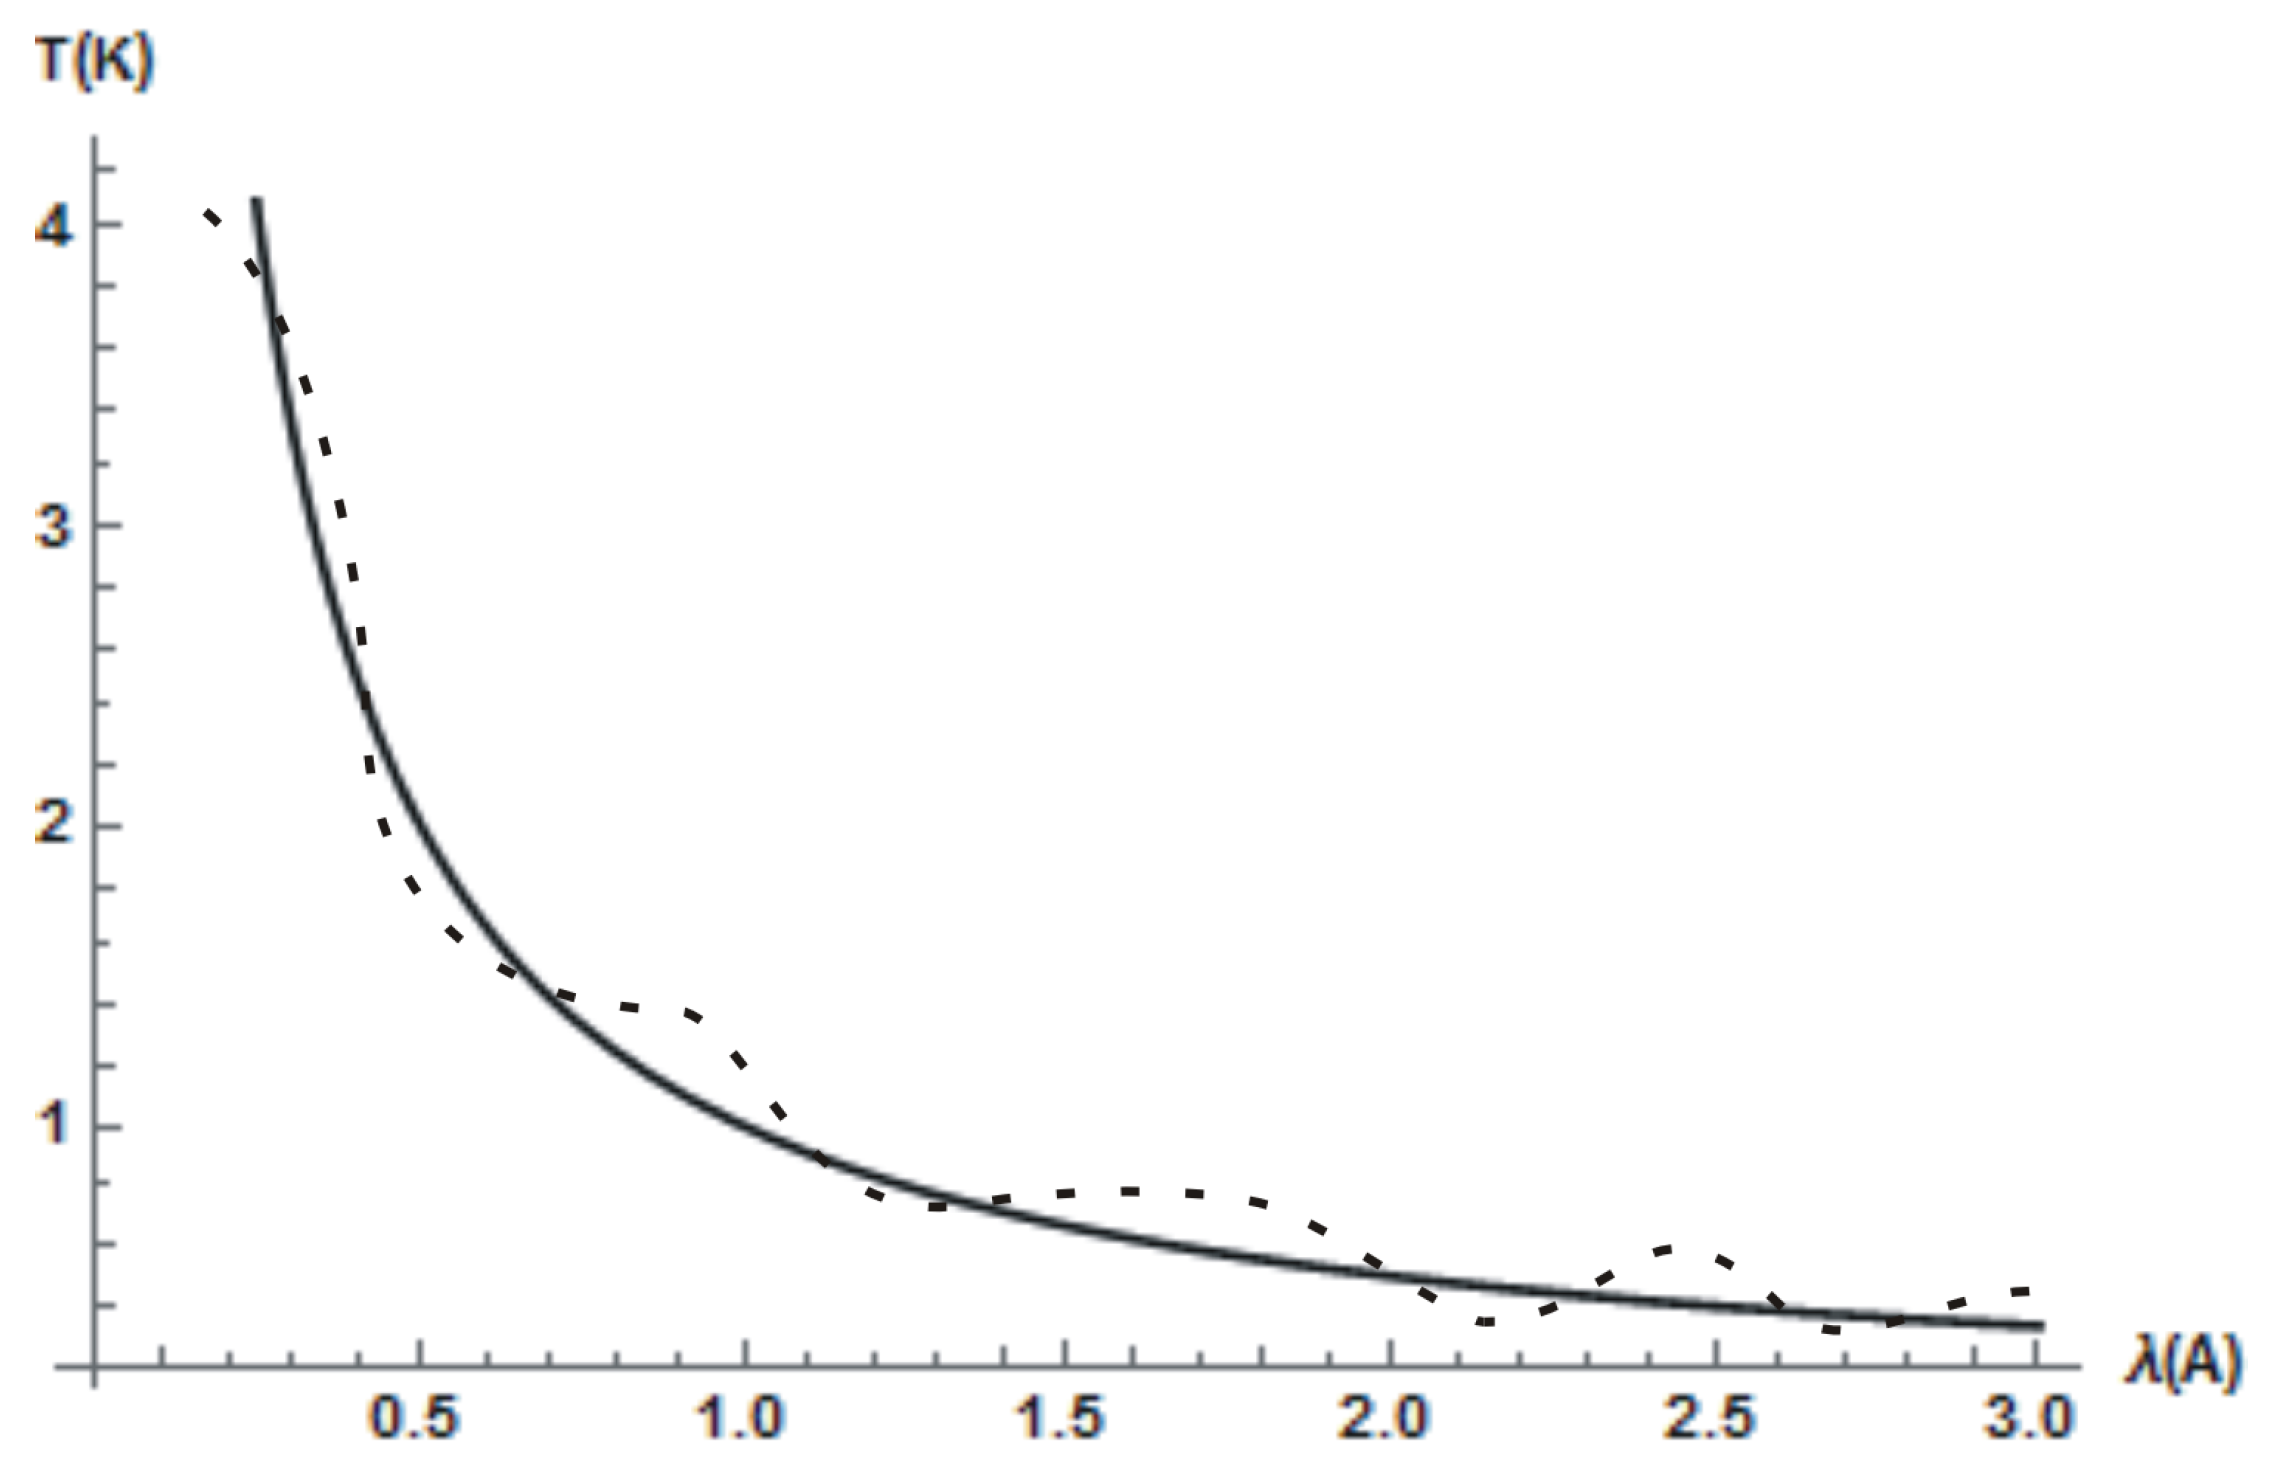
T. Our receiver detects the radiation from an existing source with a damped wavelength
as shown in
Figure 3. In the light of the fluctuation theory, we would like to emphasize that a thermal detector works well whenever we have
and
, where
is the temperature corresponding to
. Notice that the Wien’s radiation configuration is formed whenever
lie on a rectangular hyperbola
, where
b takes the value of 2808
m K [
2]. Herewith, whenever we minimize the uncertainty
in measuring the emitter’s wavelength
, the uncertainty
in the temperature measurement becomes maximized, and vice-versa.
In order to study extrema of the radiation distribution function
under variations of
and
T, we need to examine its stationary points. In particular, we are interested in variations of
and
T as schematically represented with the dashed curve in
Figure 3. This offers an intrinsic description of fluctuations of the thermal radiation distribution profile
.
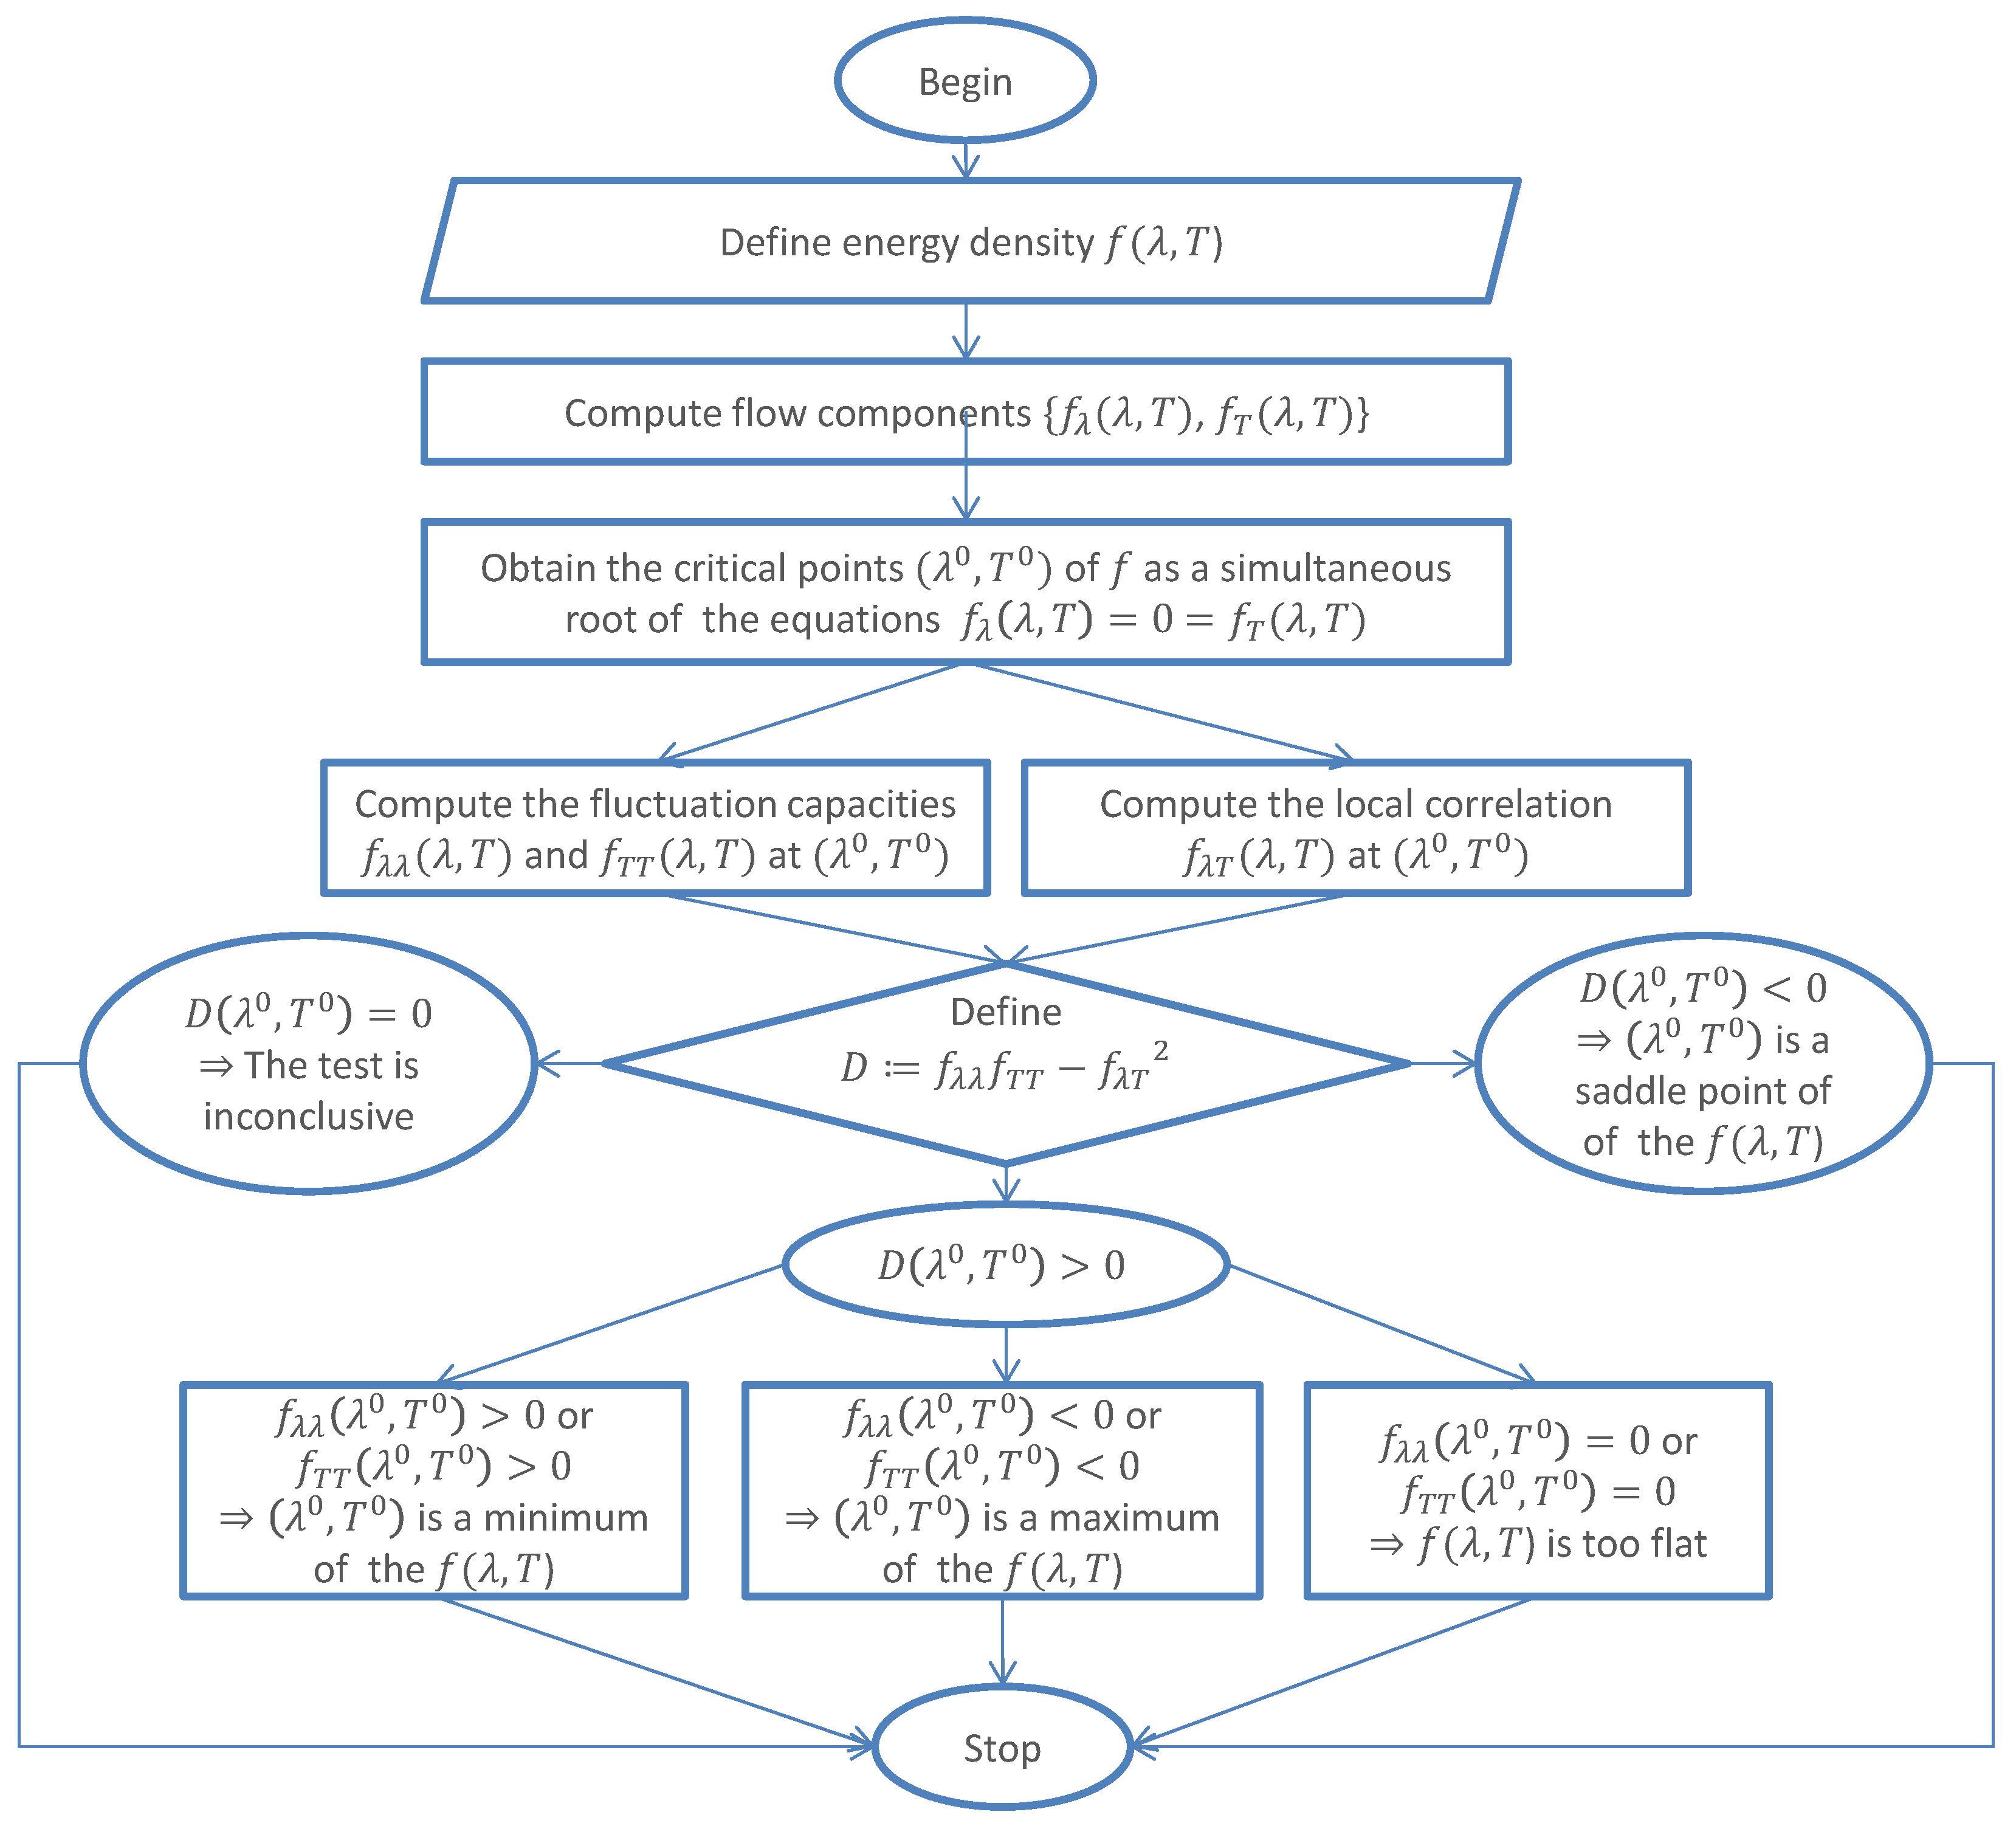
As it is known, a stationary point
is an extremum, if the fluctuation discriminant
Moreover, there is a local minimum at
whenever, in addition to the positivity of
D, one of the pure capacities
or
takes a positive value. We have a local maximum for the case of the negative sign of the either of the pure capacities at
. Additionally, at
we have a saddle point if the discriminant
D takes a negative value that holds for any sign of the pure capacities. Further, the second derivative test fails if
D vanishes at
. In the next section, we study radiation fluctuations over the surface of
that offers its best fit in a chosen discretization, viz. the least square distribution, see
Figure 3.
3. Radiation Stability Analysis
We are considering the radiation energy distribution function
as a real valued map
as defined by the Equation (
1). First of all, notice that the non-removable singularities of the function
are the points
and
, since for any given
, we have the following limiting radiating configurations
The first partial derivatives of
are as follows
The simultaneous equations
do not have a solution, i.e., the original function does not have any stationary point. On the other hand, when
T is fixed with
, the partial derivative
as in Equation (
5) has an approximate root
Further, for the same sign of A and b, the partial derivative is always positive, therefore the function f is always increasing for a fixed .
In the sequel, in order to simplify the calculations, we use the replacement
In this representation, the second partial derivatives of the radiation energy function
are as follows. The pixel capacity of the radiation energy
is given by
where the coefficients
can be expressed as
Similarly, we find that the glow capacity simplifies as
where the associated coefficients
arise linearly in
s as
The interrelation between pixel and temperature variations of the radiation energy
is designated via the mixed partial derivative
where the coefficients
can be cascaded as
Note that for
satisfying
, we have
Therefore, for a fixed , it implies that attains its local minimum at the point . Similarly, for a fixed it follows that has a local maximum at the point
Replacing all the second derivatives concerning the pixel, glow capacities and their interrelation as in the Equations (
9), (
11) and (
13), the discriminant
leads to the following representation
where the expansion coefficients
are given by
Here, the components
read as in Equations (
10), (
12) and (
14) respectively.
Following the above analysis, we provide a block diagram towards the classification of the stability ranges of the Planck’s distribution law as in
Figure 4.
4. Global Radiation Stability
In this section, we provide algebraic discussion of the stability of a radiating system. Note that the radiation is well characterized via the sign of the discriminant
D as in Equation (
17). To simplify the subsequent presentation, let us define the flow variable
and discriminant prefactor
as
Therefore, from Equation (
17), it follows that the sign of
D can be described according as the roots of the cubic equation
To determine the radiation zones, let
be the roots of the above Equation (
20). In this case, we have the following identities
Thus, from the last relation as in Equation (
21), we can characterize the signature of
D as per the relation
Hereby, when all the roots
of the Equation (
20)are positive, we have a positive discriminant
D. This happens whenever the following conditions are satisfied
Form the above Equation (
19), it follows that the parameter
has the same sign as the one of
s. Further, it is worth mentioning that we can have an optimized radiation energy whenever the Equation (
23) is satisfied in the
-plane.
On the other hand, we have a saddle point if
D takes a negative value. That is, the roots
obey the contrary requirement to the Equation (
23). Namely, we have a saddle point for a given value of
s whenever the roots
satisfy
Notice further that the graph of the above cubic radiation discriminant
as in Equation (
20) has
rotational symmetry about its points of inflection. For a given
, it is well-known that the inflection point of an arbitrary cubic polynomial
occurs [
36] at
such that we have
In this case, from the Equation (
20), it follows that the discriminant
satisfies
Thus, it follows that the inflection point of
is given by
By translating an arbitrary radiation point
and using Equation (
20), we observe that the translated discriminant
reduces as per the following datum
This shows that that radiation discriminant
is rotationally symmetric about its point of inflection as it has only odd powers of
, viz. given any radiation energy
, we have
for all
as in Equation (
19).
5. Discussion of the Results
In order to make an apt qualitative analysis of the results concerning (in)stability of the radiation distribution
, we choose the following region
for observing its behavior for the subsequent discussion. Here, we have allowed small absorptions by choosing a negative
or
T. In the subsequent figures, the wavelength
is measured in
Å on
X-axis, and the temperature
T is measured in
K on
Y-axis. Note that the range of the dependent variable on each plot is selected to present the best view of the chosen flow functions as in the foregoing section in the region
.
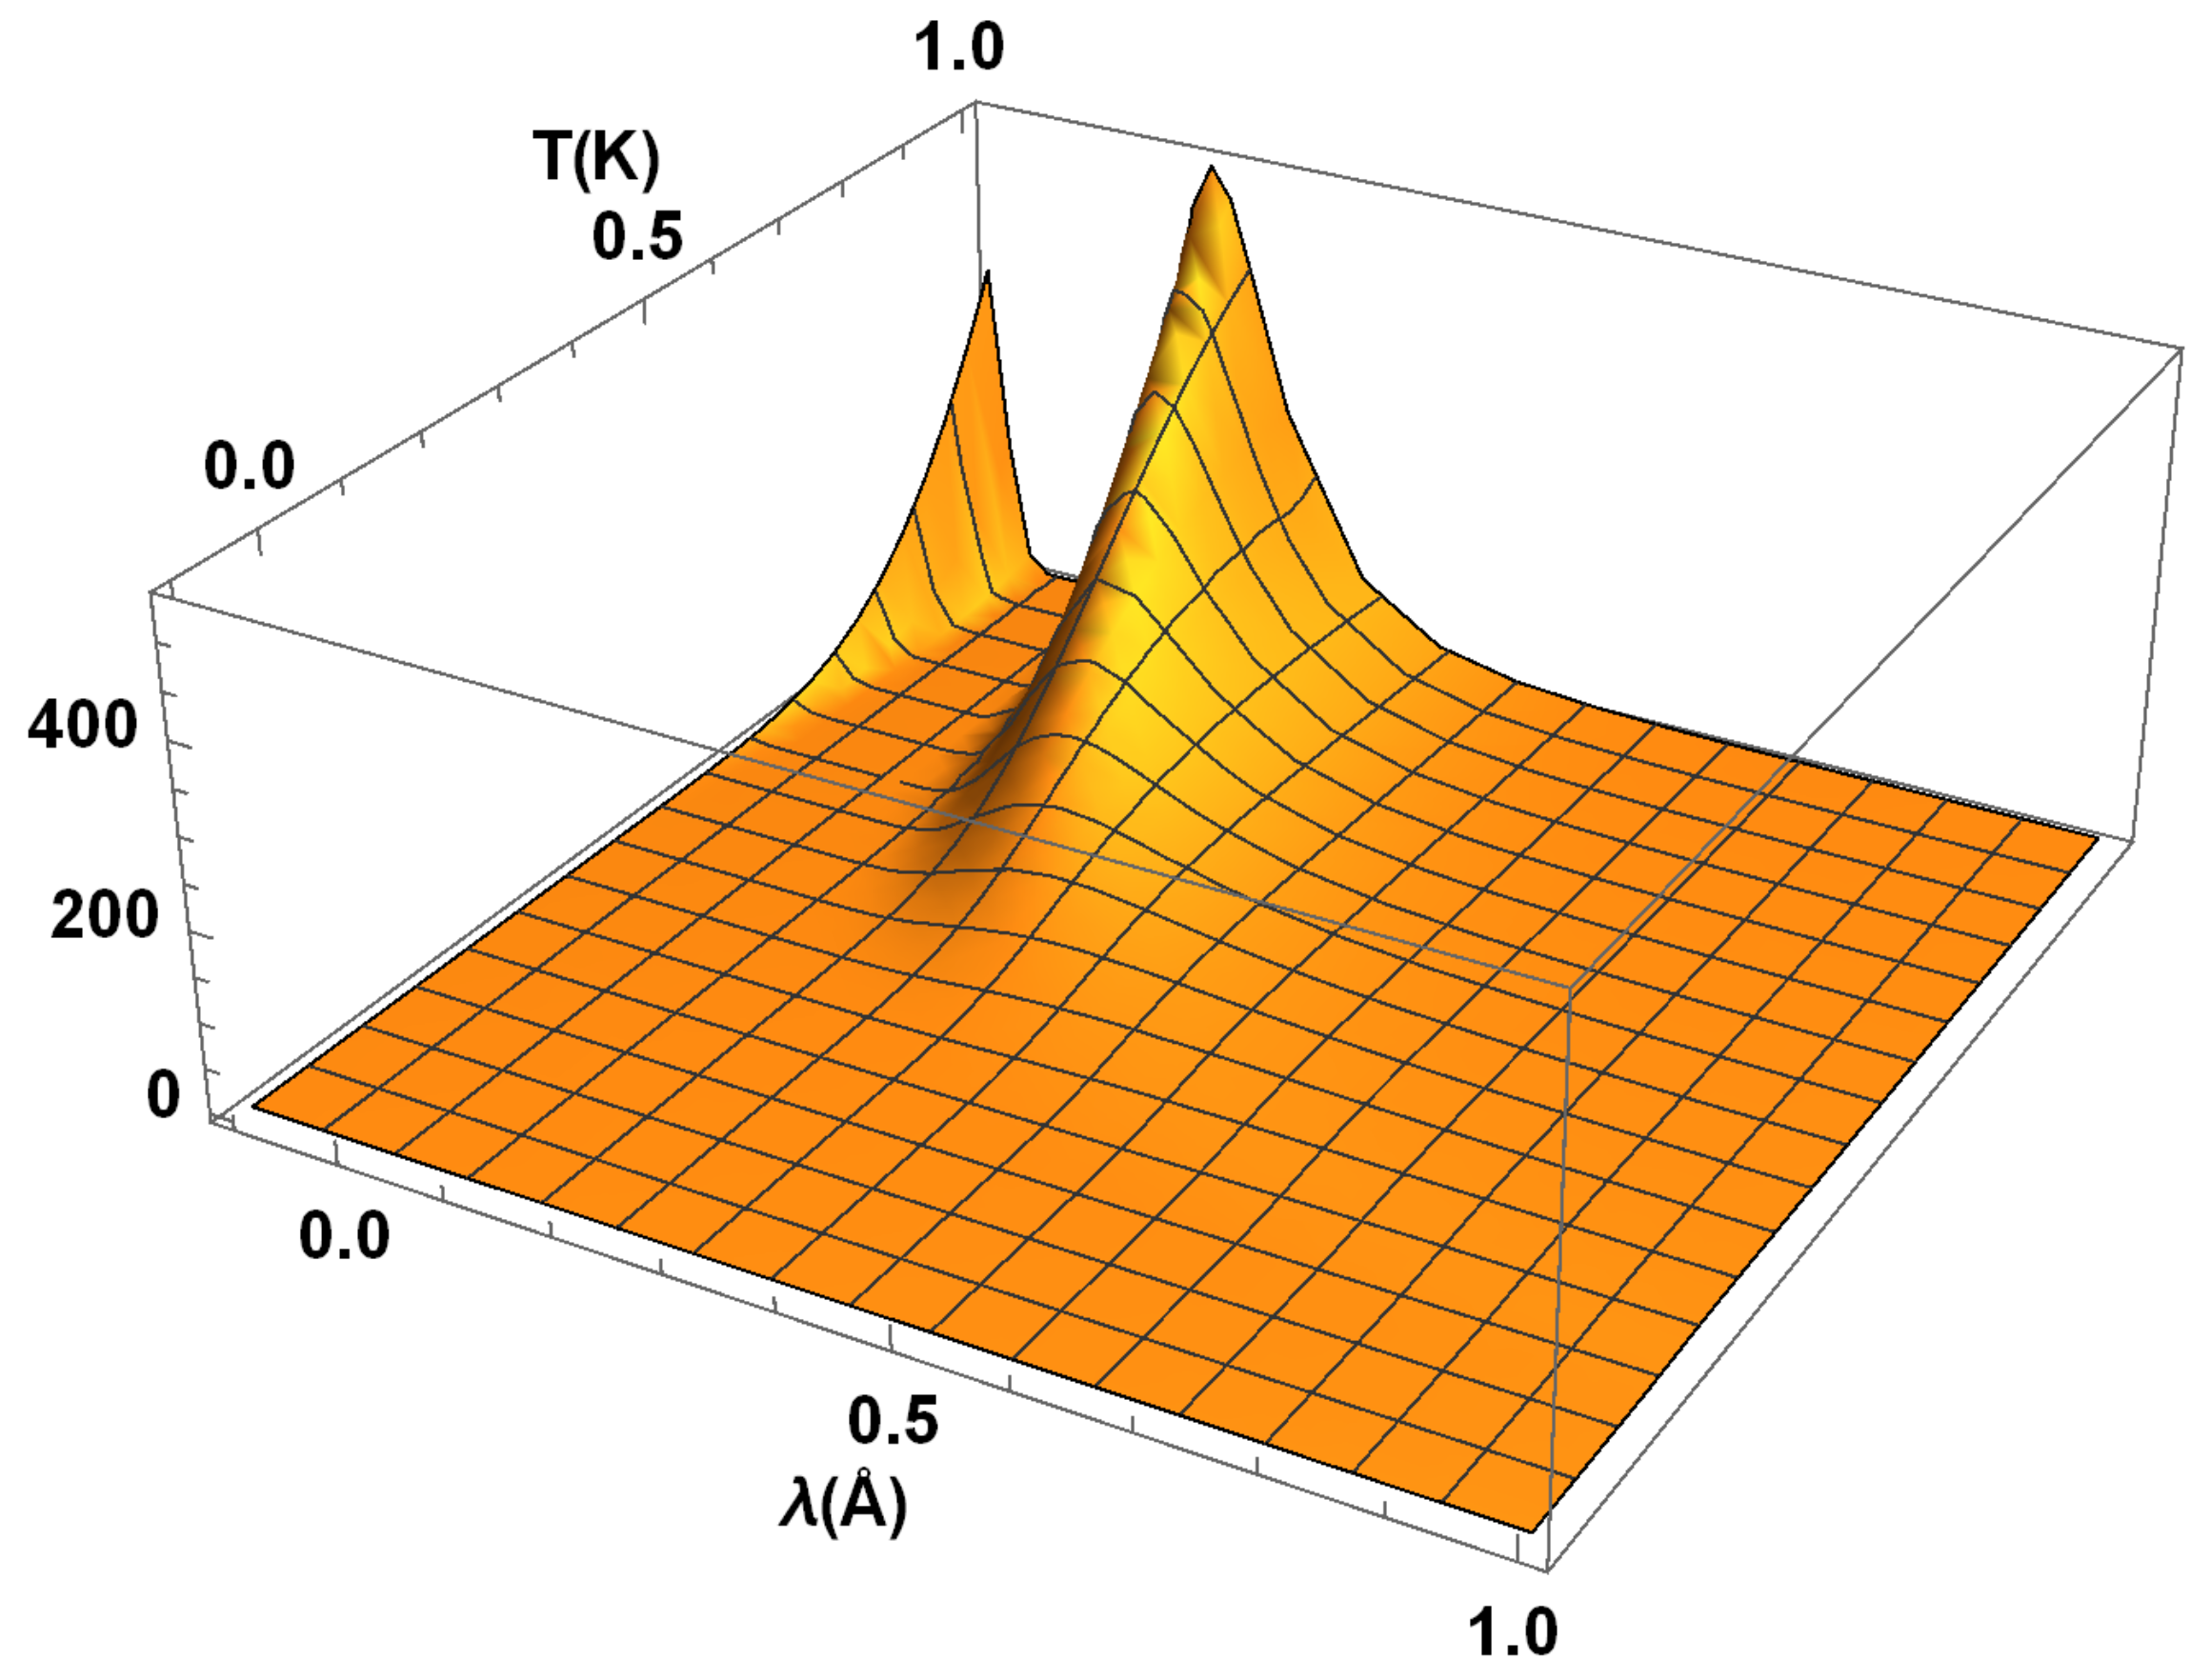
From
Figure 5, in the range
, we see that the radiation distribution function
has a peak in the region
, for a fixed
. For all
T, we observe that there are IR singularities at
(as it is analytically shown by Equation (
4). When
grows from 0 to 1 and
T approaches the origin from the left side corresponding to the absorption effects, the distribution function
f grows from
to
. Fundamentally, the singularities of
f have the quantum or statistical field theoretic type origins which lies in multi-dimension distribution theory. We leave such examinations open for a future analysis.
The distribution function
f, when plotted in the region
, shows a growing nature with respect to
T. This can be also supported by the positive sign of the component
for
. As discussed earlier, from Equation (
5), the extrema of
f when
T is fixed, are found at the points
satisfying
in the
-plane. In the special case of
, the approximate value of
is given by Equation (
7). In the regions
and
, the distribution function
takes almost a constant value.
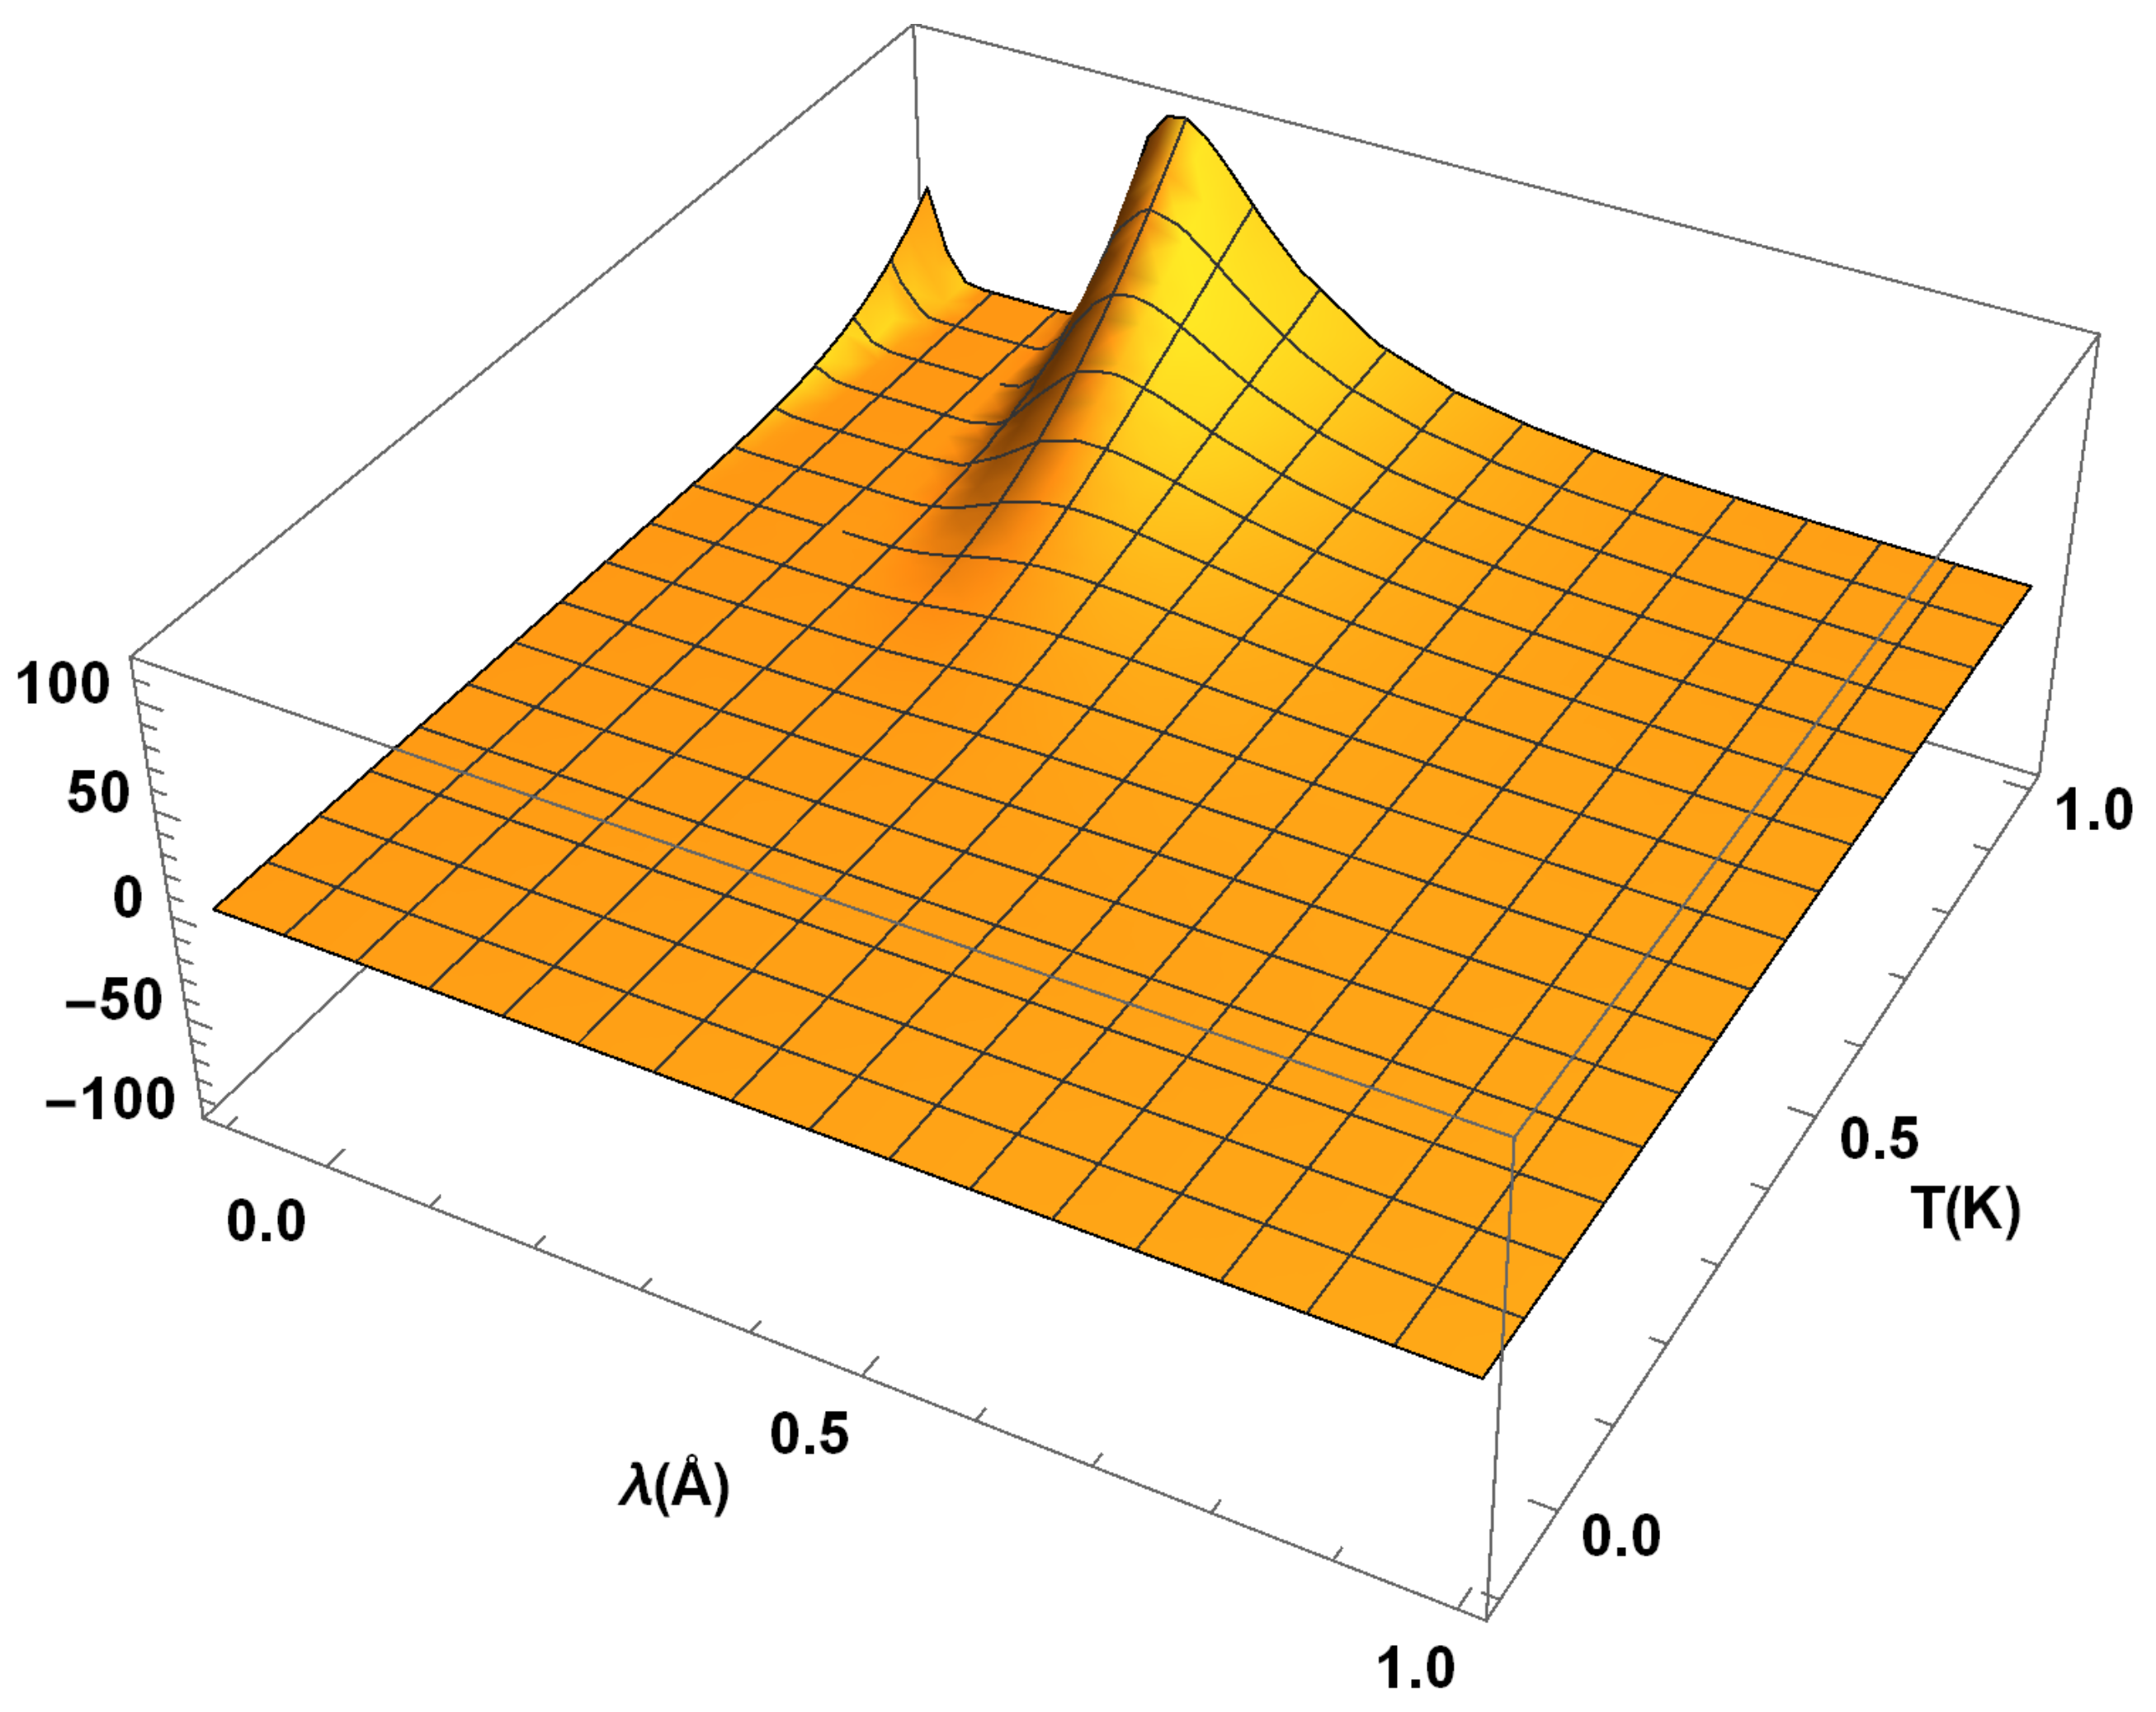
In
Figure 6, we depict qualitative features of the rate
of the radiation distribution function
in the region
. We observe that
acquires its maximum value 110 almost in the same region as the distribution function
itself. For the limiting wavelength
and temperature
, we notice another set of fluctuations of the amplitude 50 in the derivative
. As in the case of the distribution function
, we find that it’s rate with respect to the temperature
T remains nearly constant for large
, e.g.,
and any
T. Moreover, the same conclusion holds for
and any
.
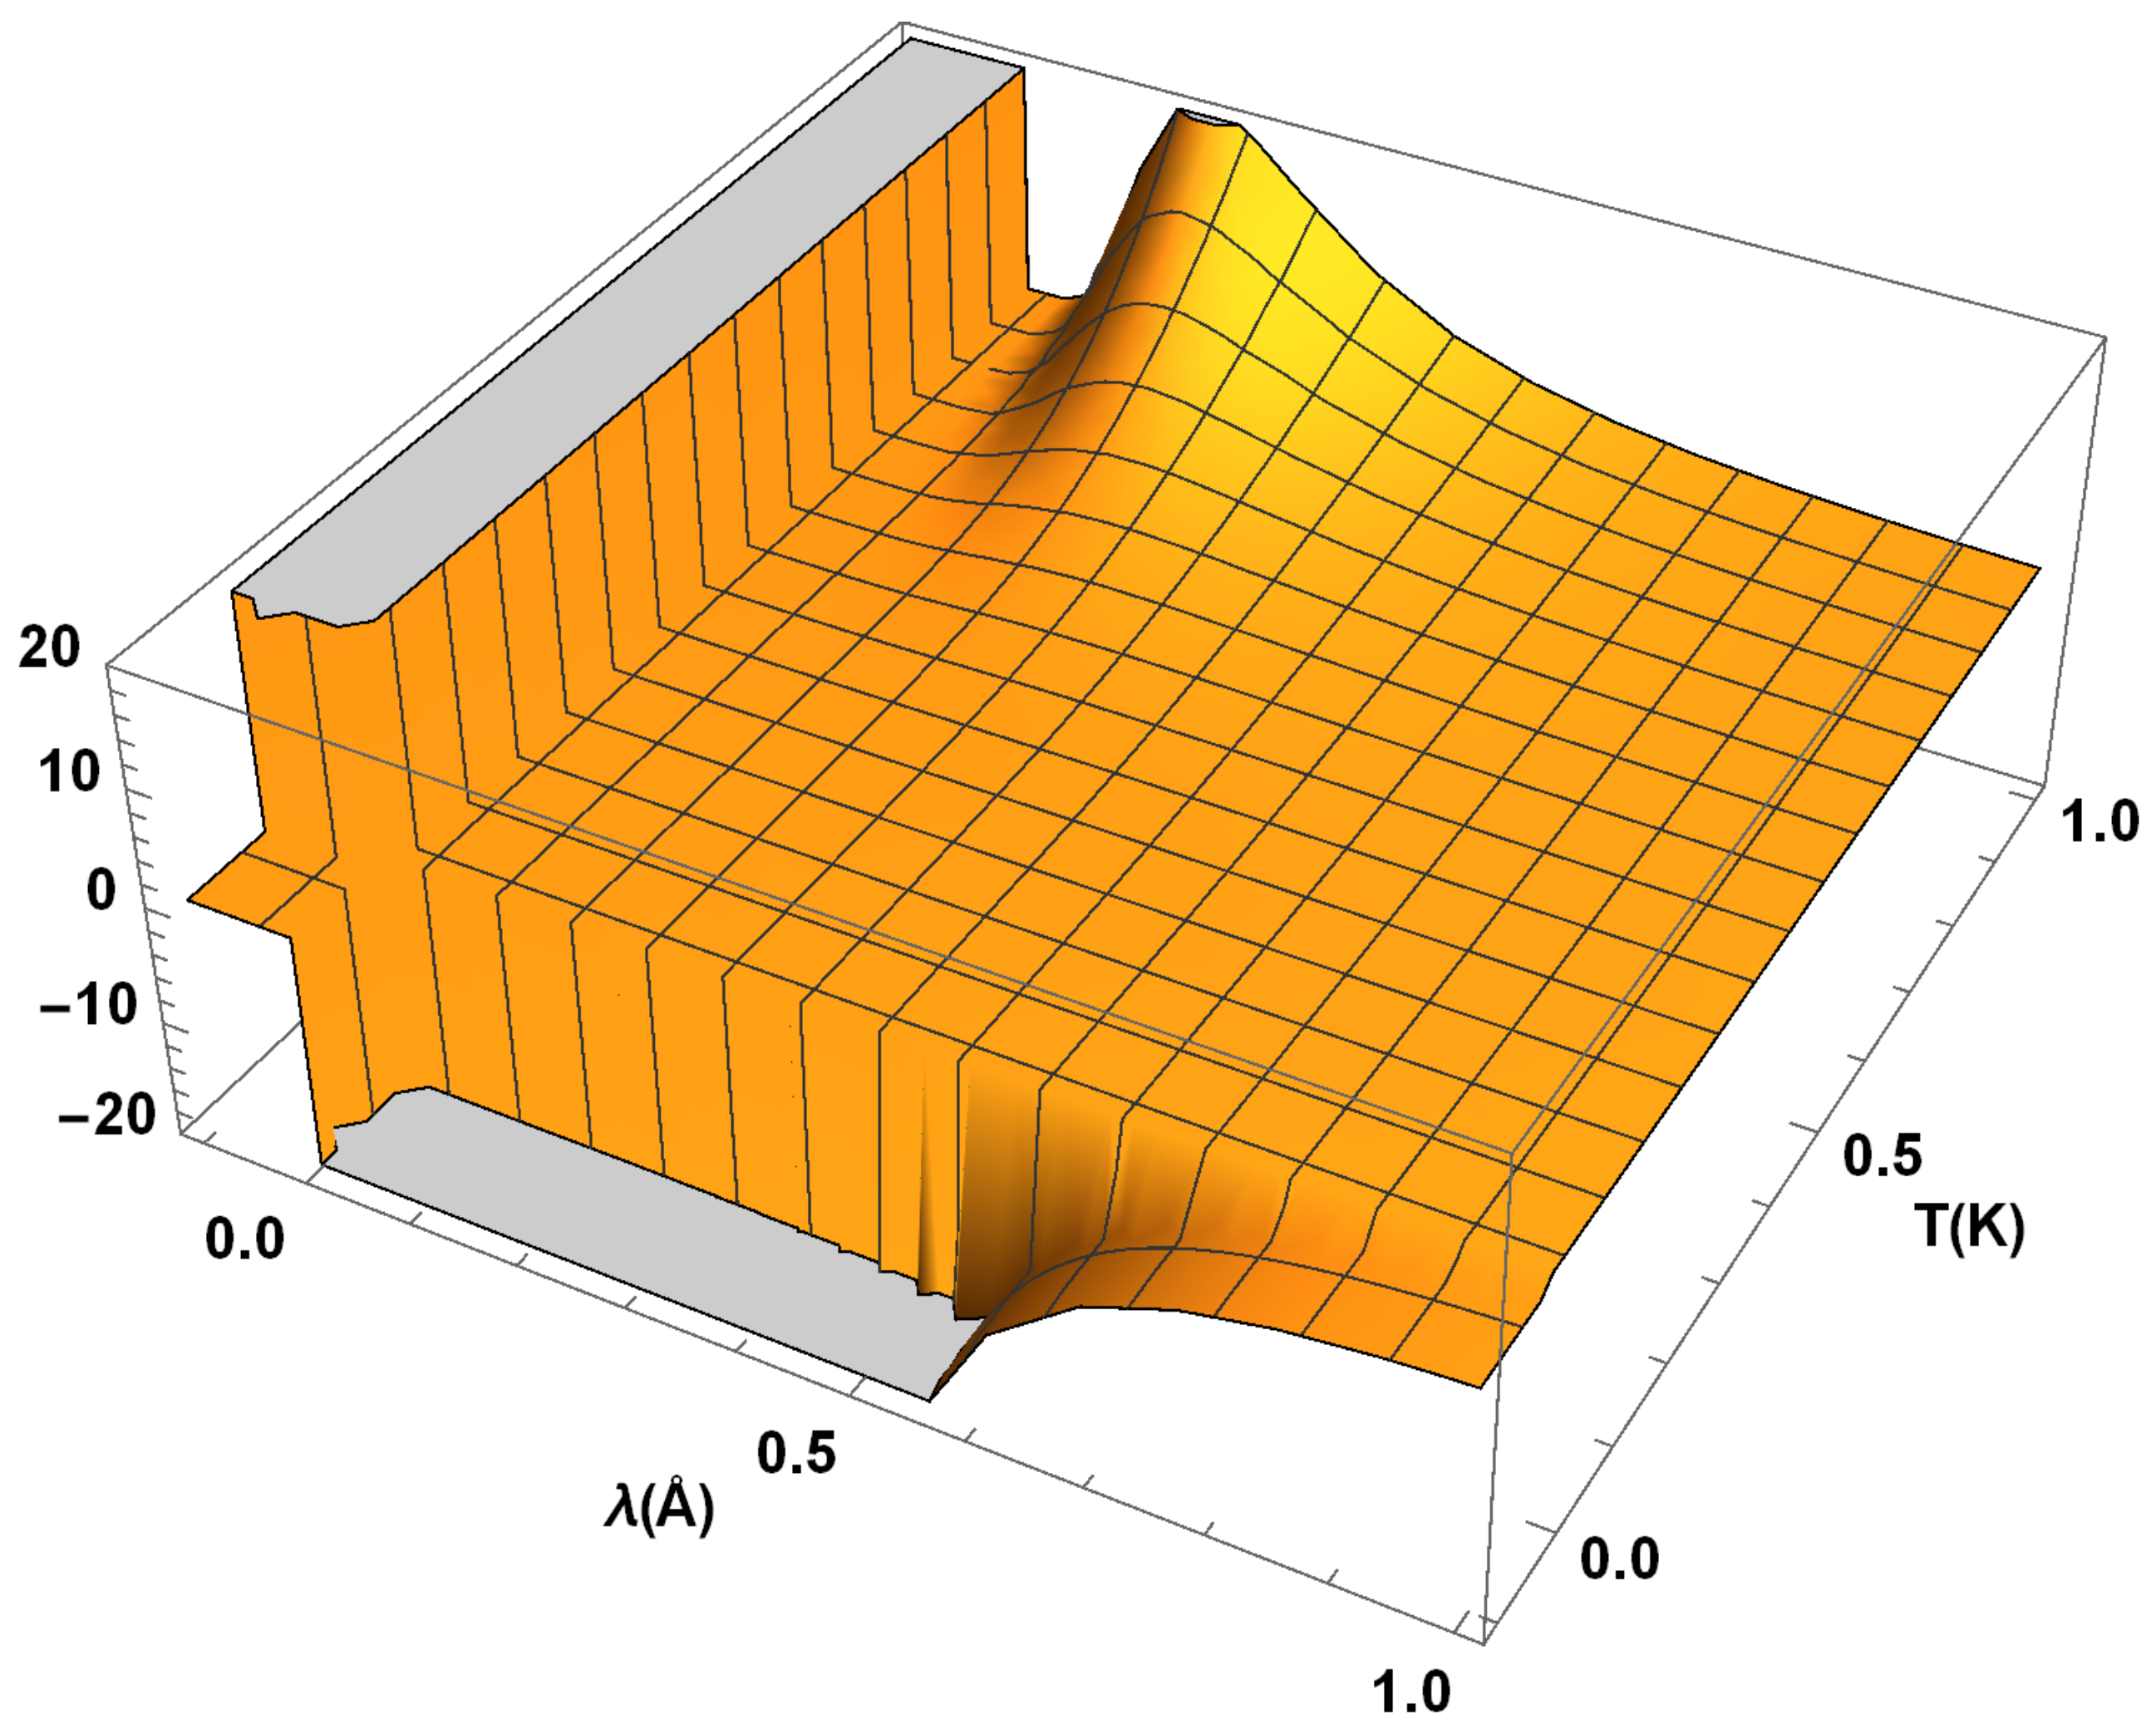
In
Figure 7, we provide variations of the radiation distribution function
with respect to the wavelength
, viz. the derivative
in the region
. Hereby, from
Figure 7, we observe that
has fluctuations with their amplitude of the order 300. On the other hand,
shows a dip of an approximate value of
in the region where the associated temperature rate possesses a peak. Namely, the dip in
is found for
and
. Notice that the peak in
arises in the same region of the temperature when the wavelength
lies in the interval
. Thus, there are fluctuations of higher amplitude in the rate
as
T grows, see
Figure 7. Apart from the above regions,
remains nearly constant almost every where, except when the
or
T approach the origin.
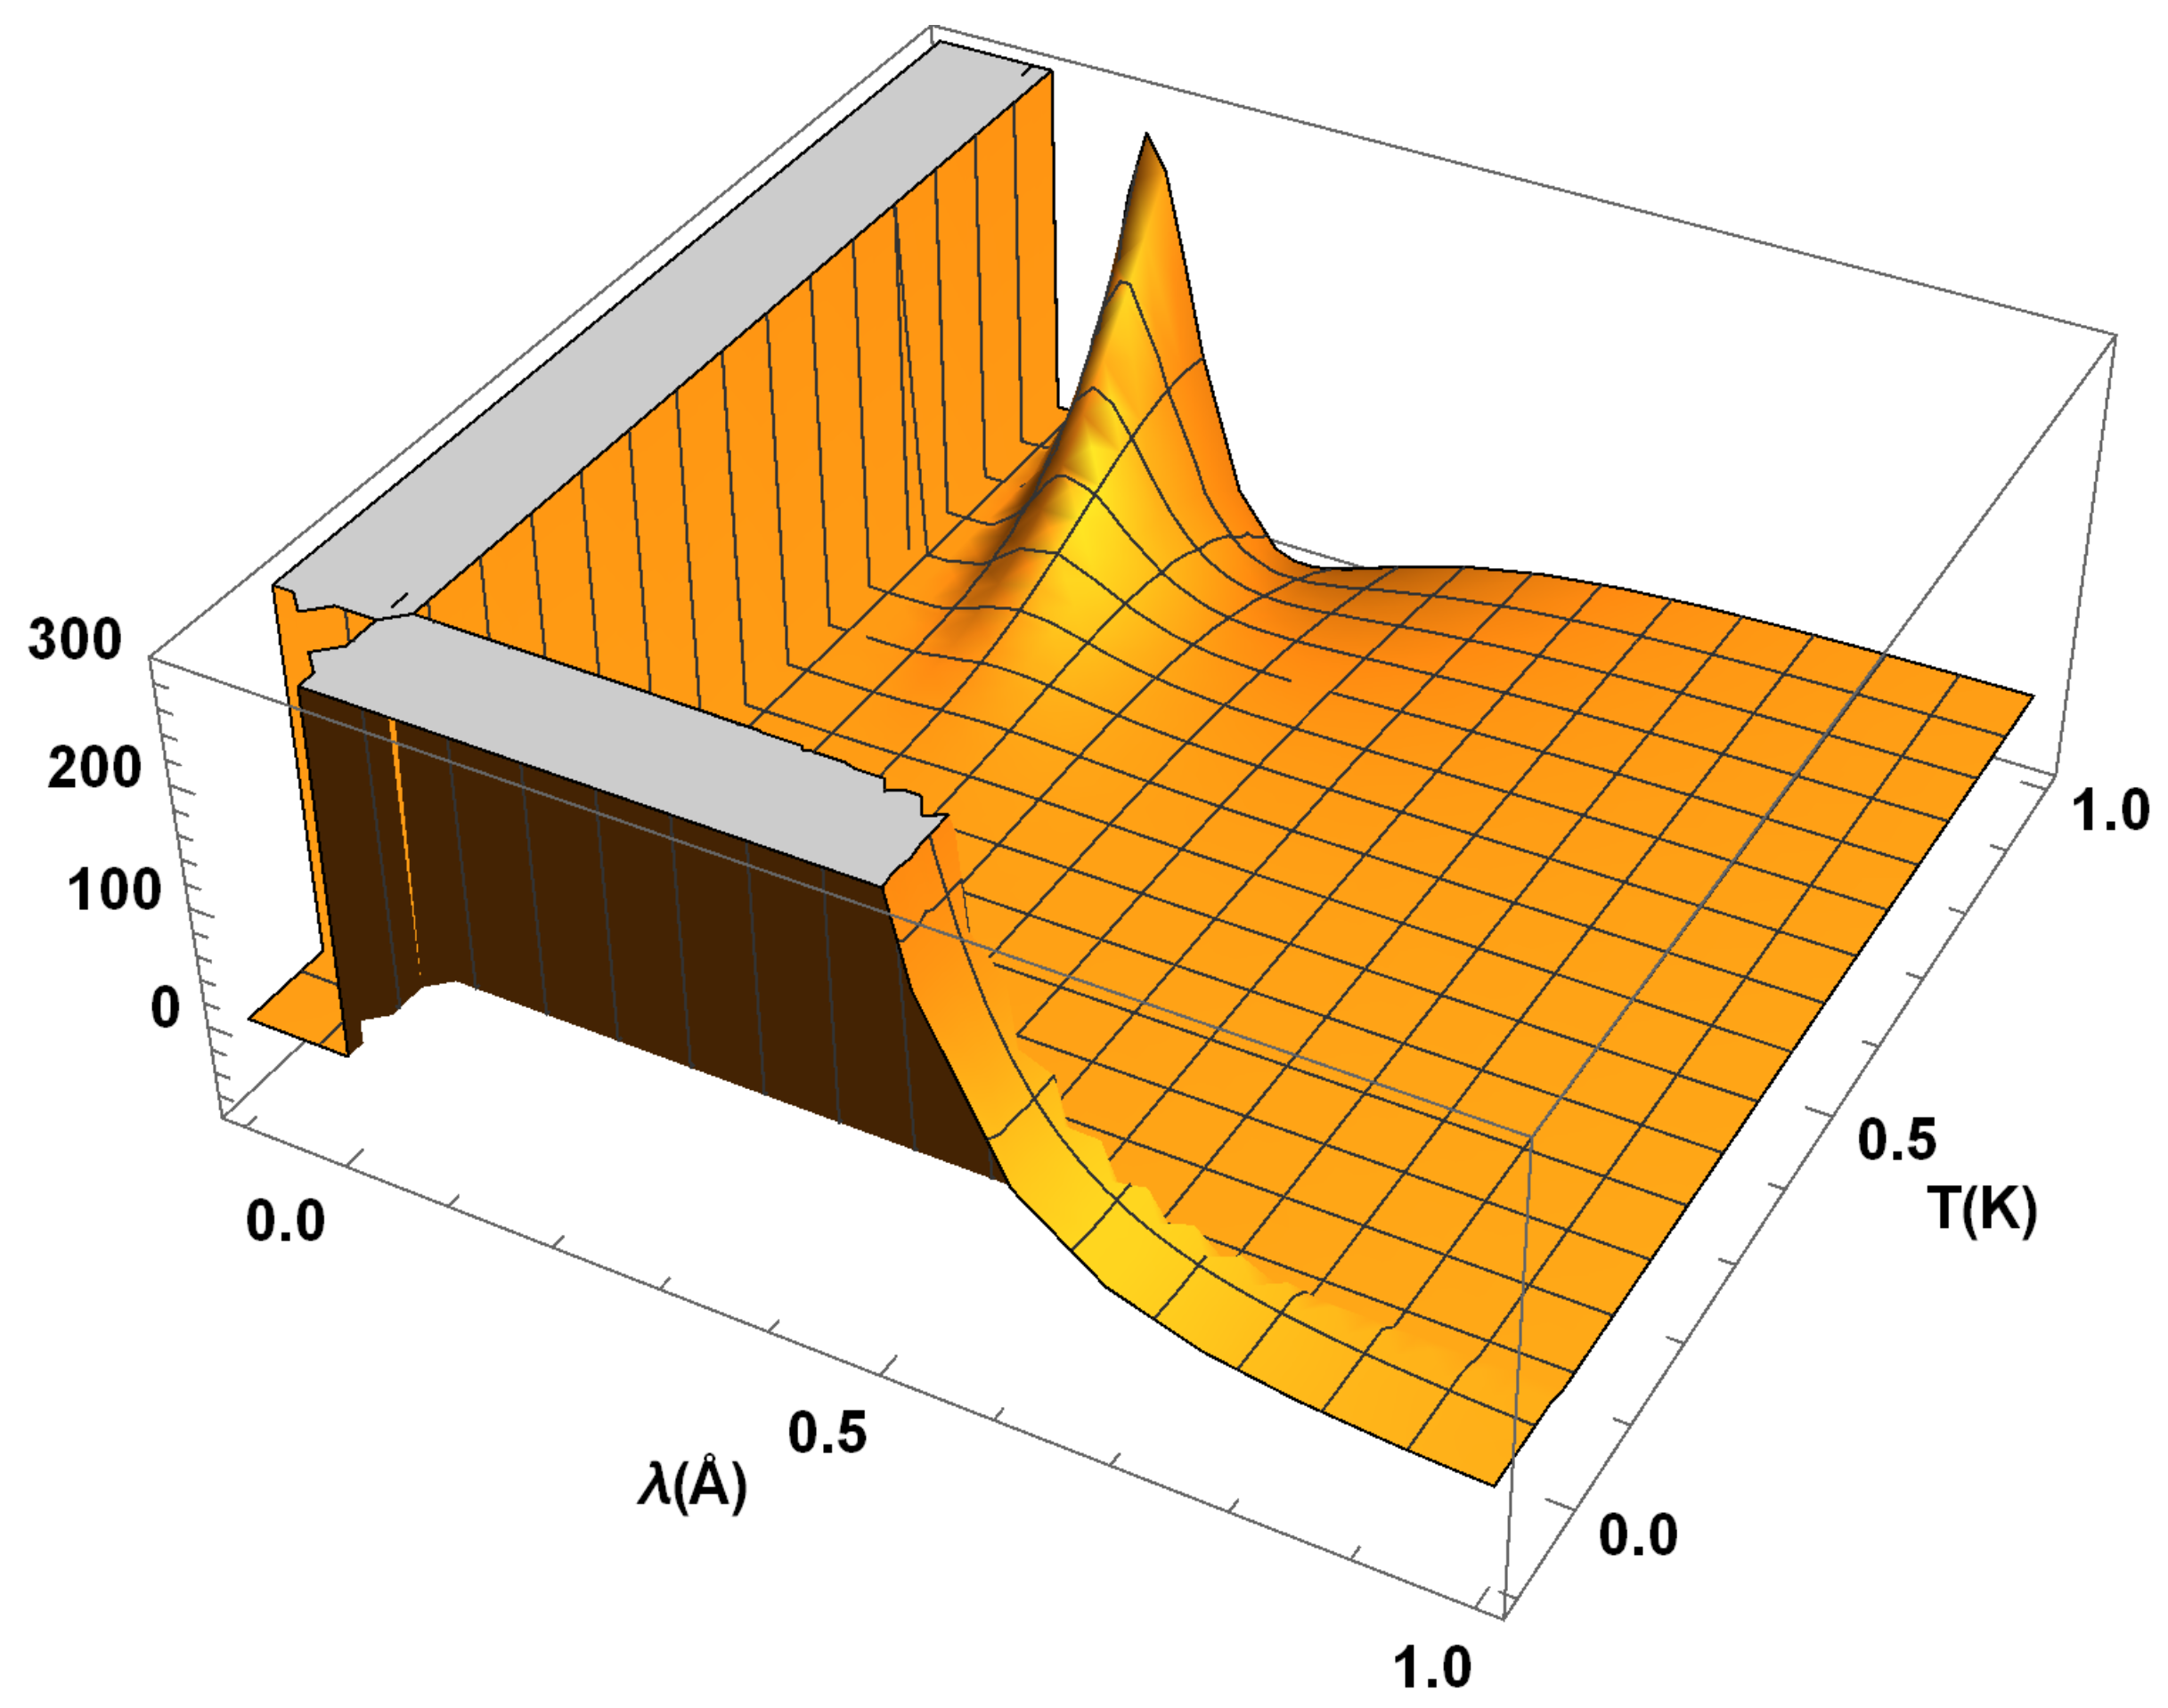
Figure 8 shows that the glow capacity
takes a positive value throughout the region
. Interestingly,
increases to the amplitude of its approximate value of 530 as the wavelength
increases from the origin to an approximate value of
and
, while it shows a sharp fall as
is increased further for any
. Moreover, when
and for large
T, there exist fluctuations in the glow capacity
with an increasing amplitude when
. Notice that there are no negative amplitude fluctuations in
.
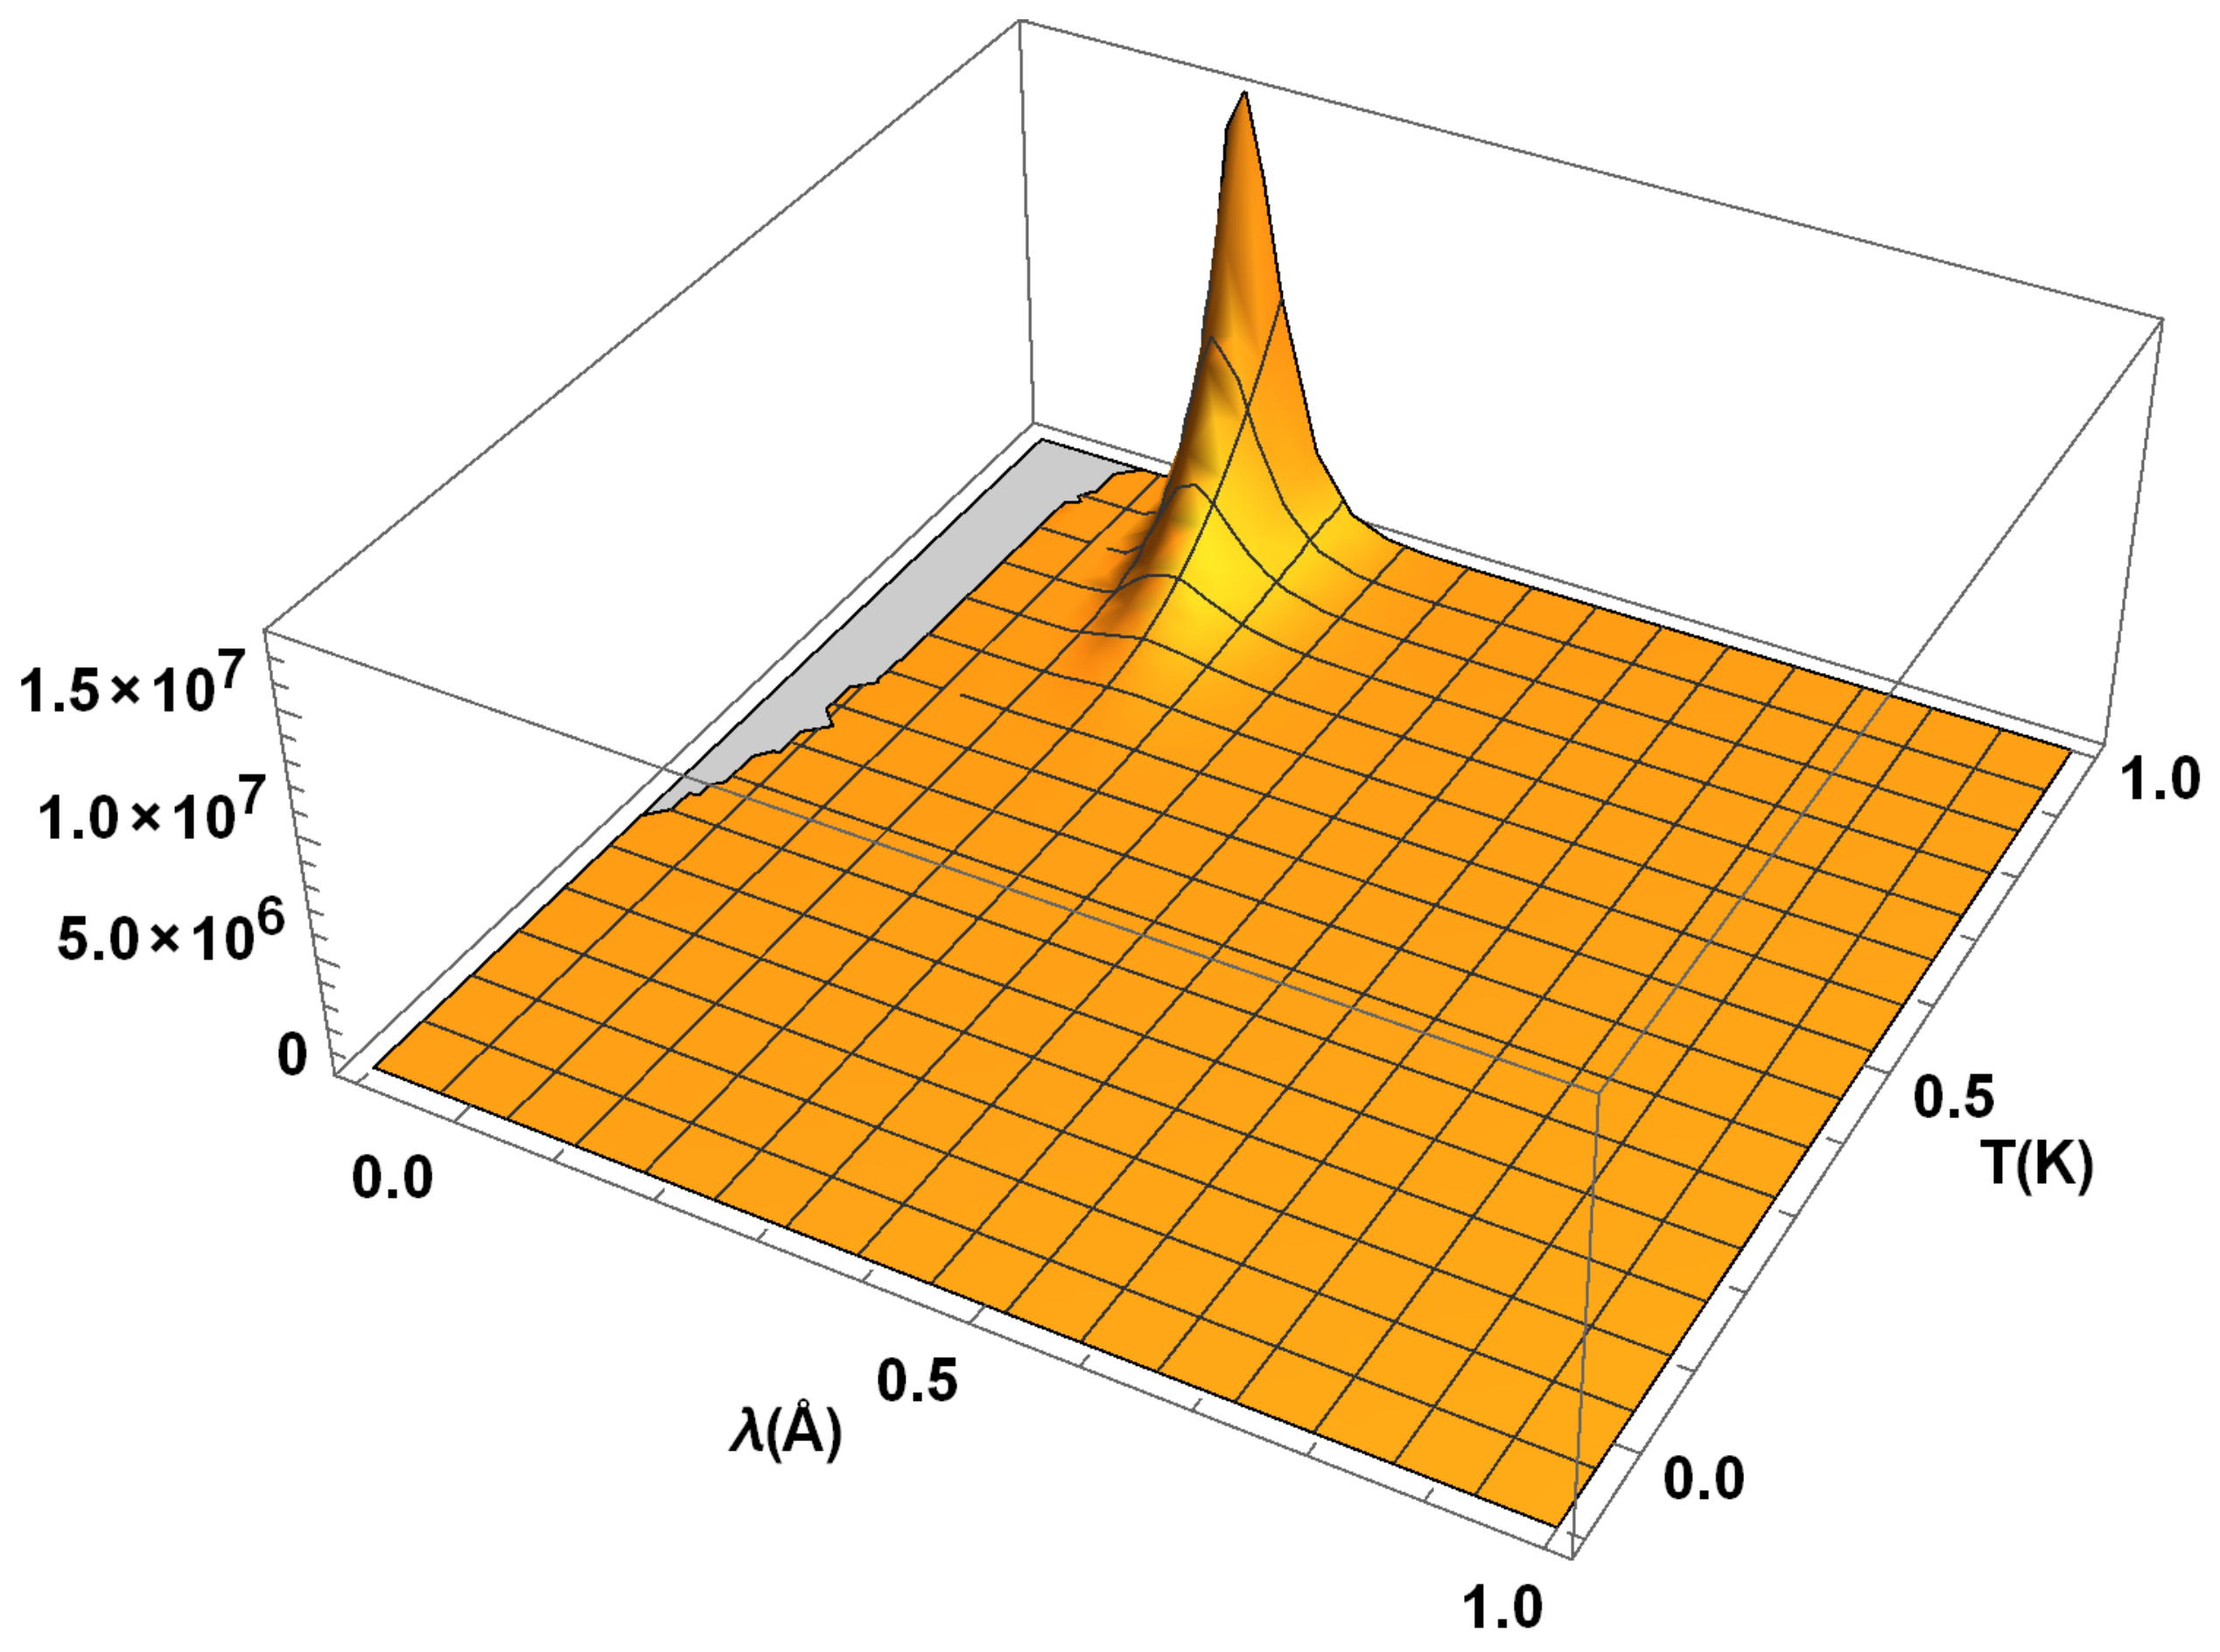
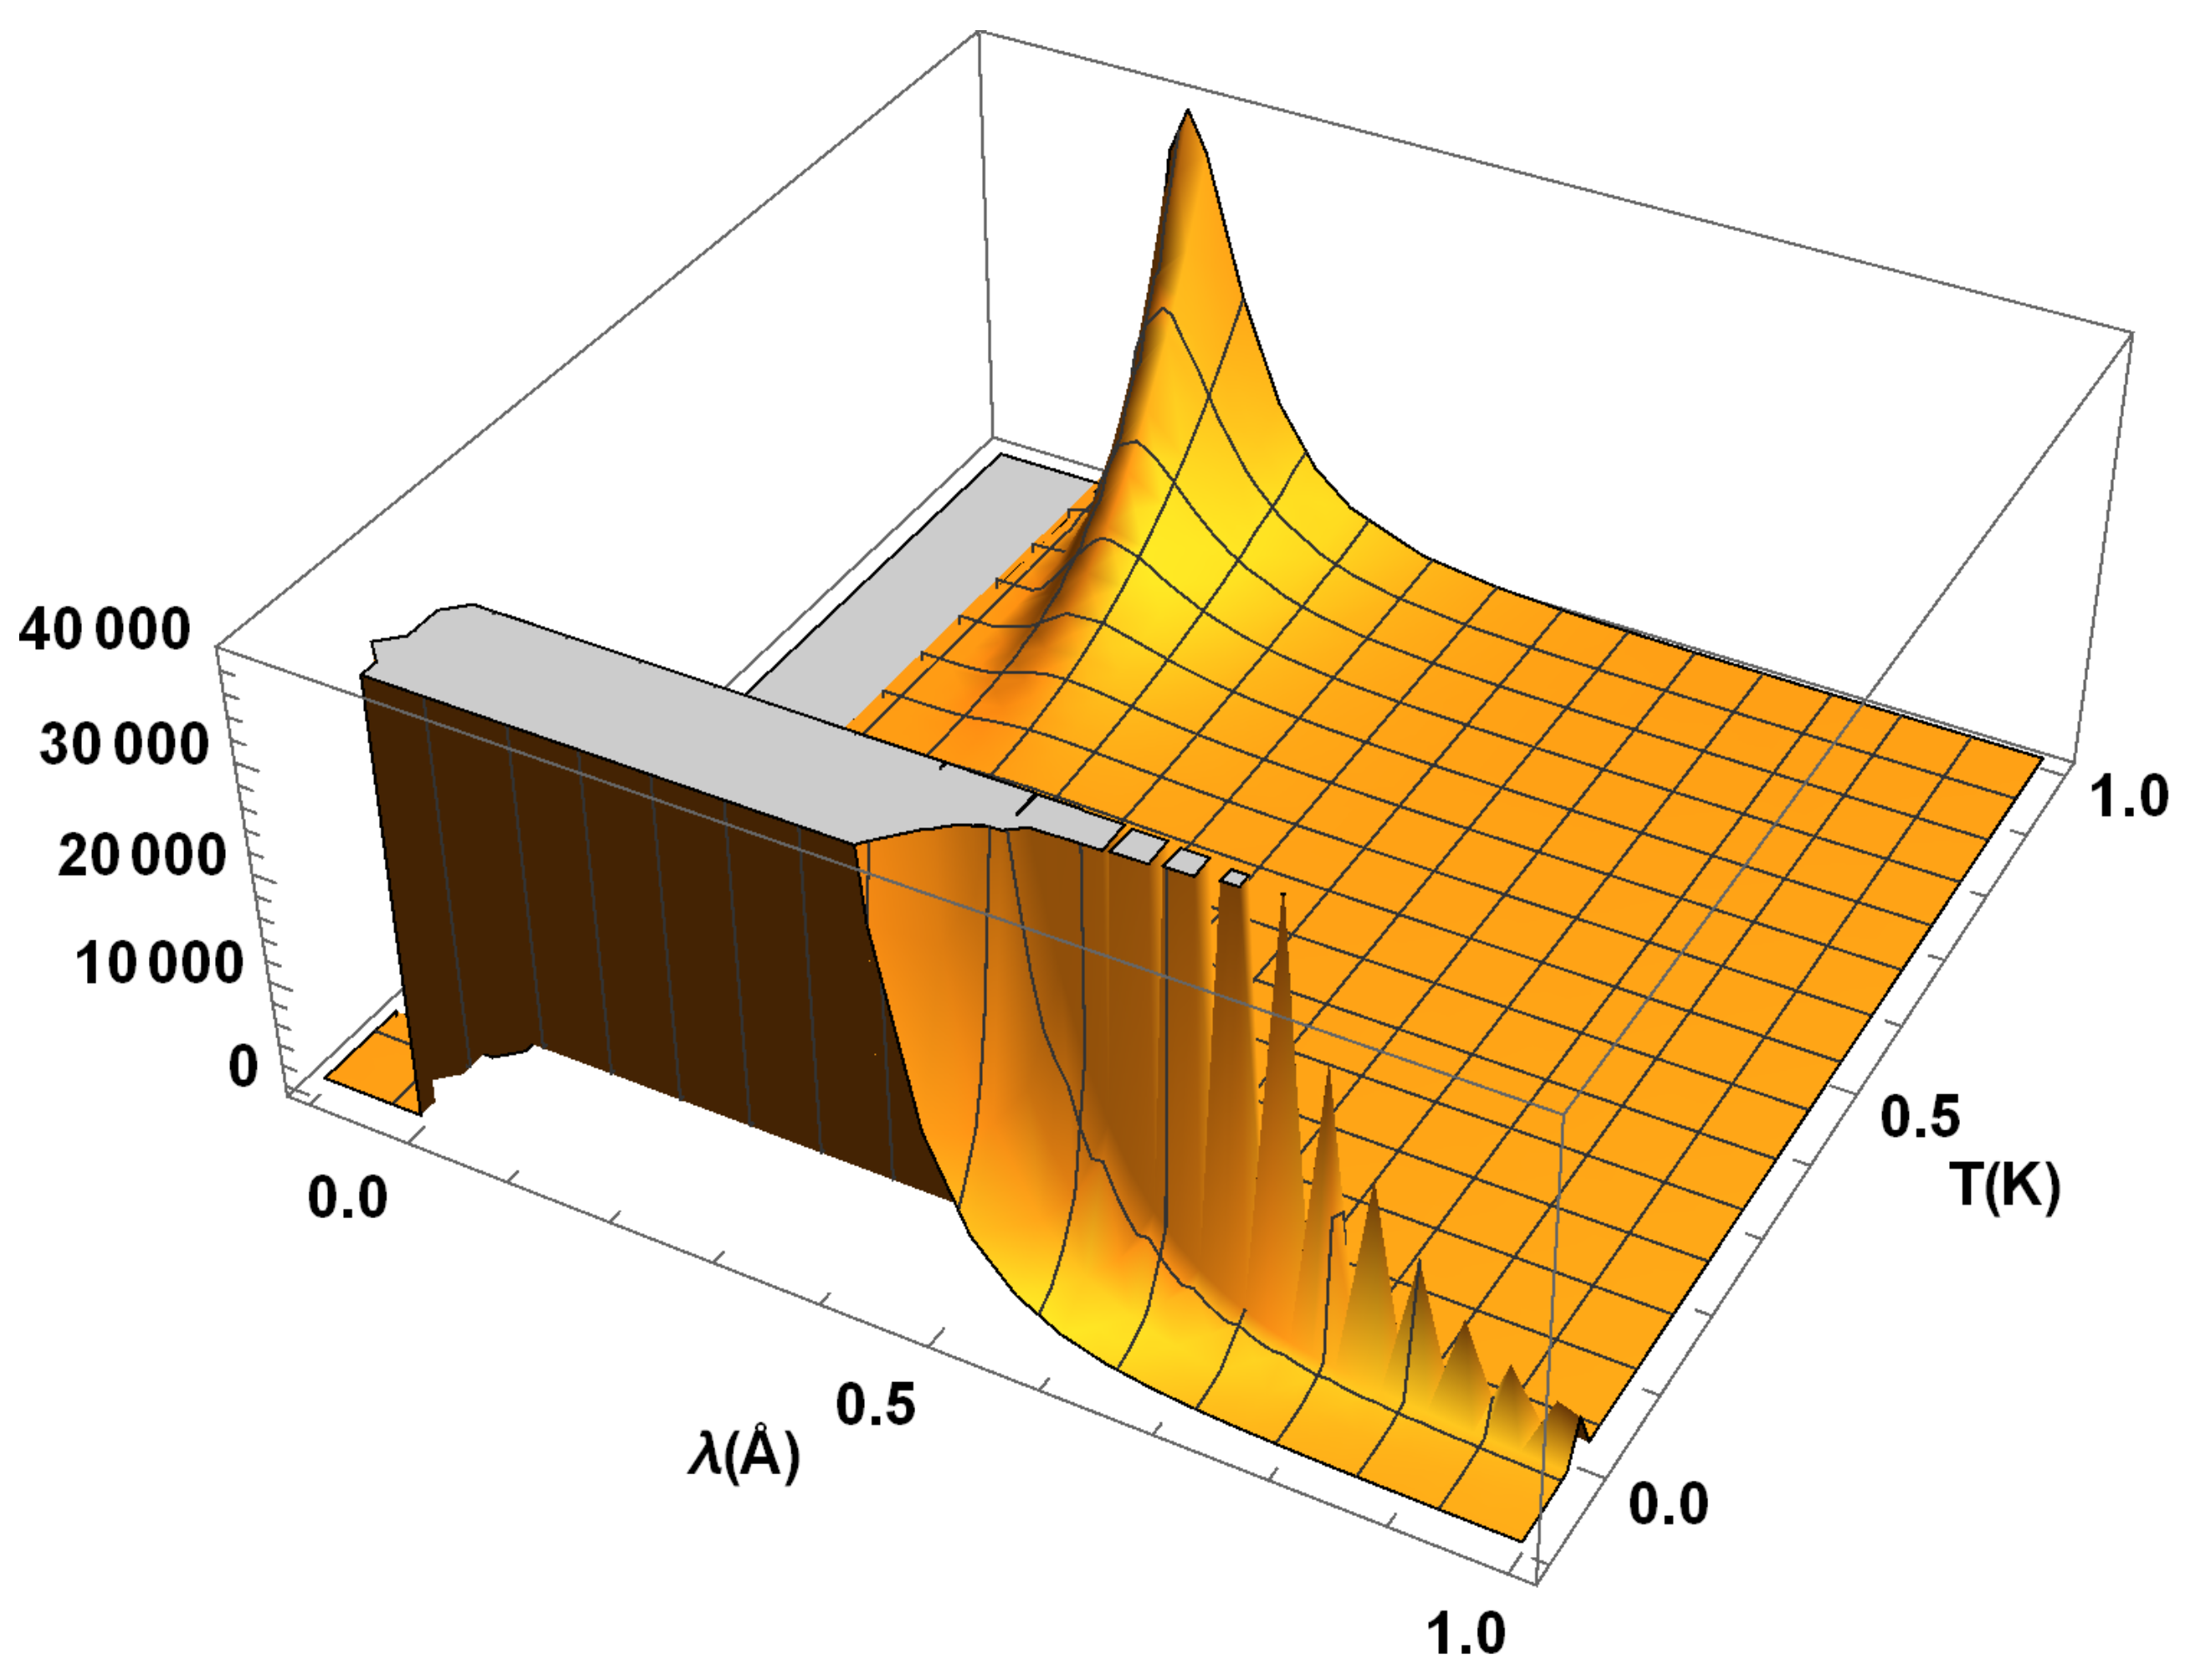
In
Figure 9, we depict the pixel capacity
against the variations of
and
T in the region
. Herewith, we find that the capacity
modulates in a similar fashion to that of the flow component
, except the fact that it has singularities when
and
T have small values. In this case, it is worth noticing that pixel capacity
arises with a large peak of its value
when
is in the interval
and
T approaches to unity. It appears that the pixel capacity
contains removable singularities for
and
. As in the other cases, there are regions with almost no variations in
as in
Figure 9.
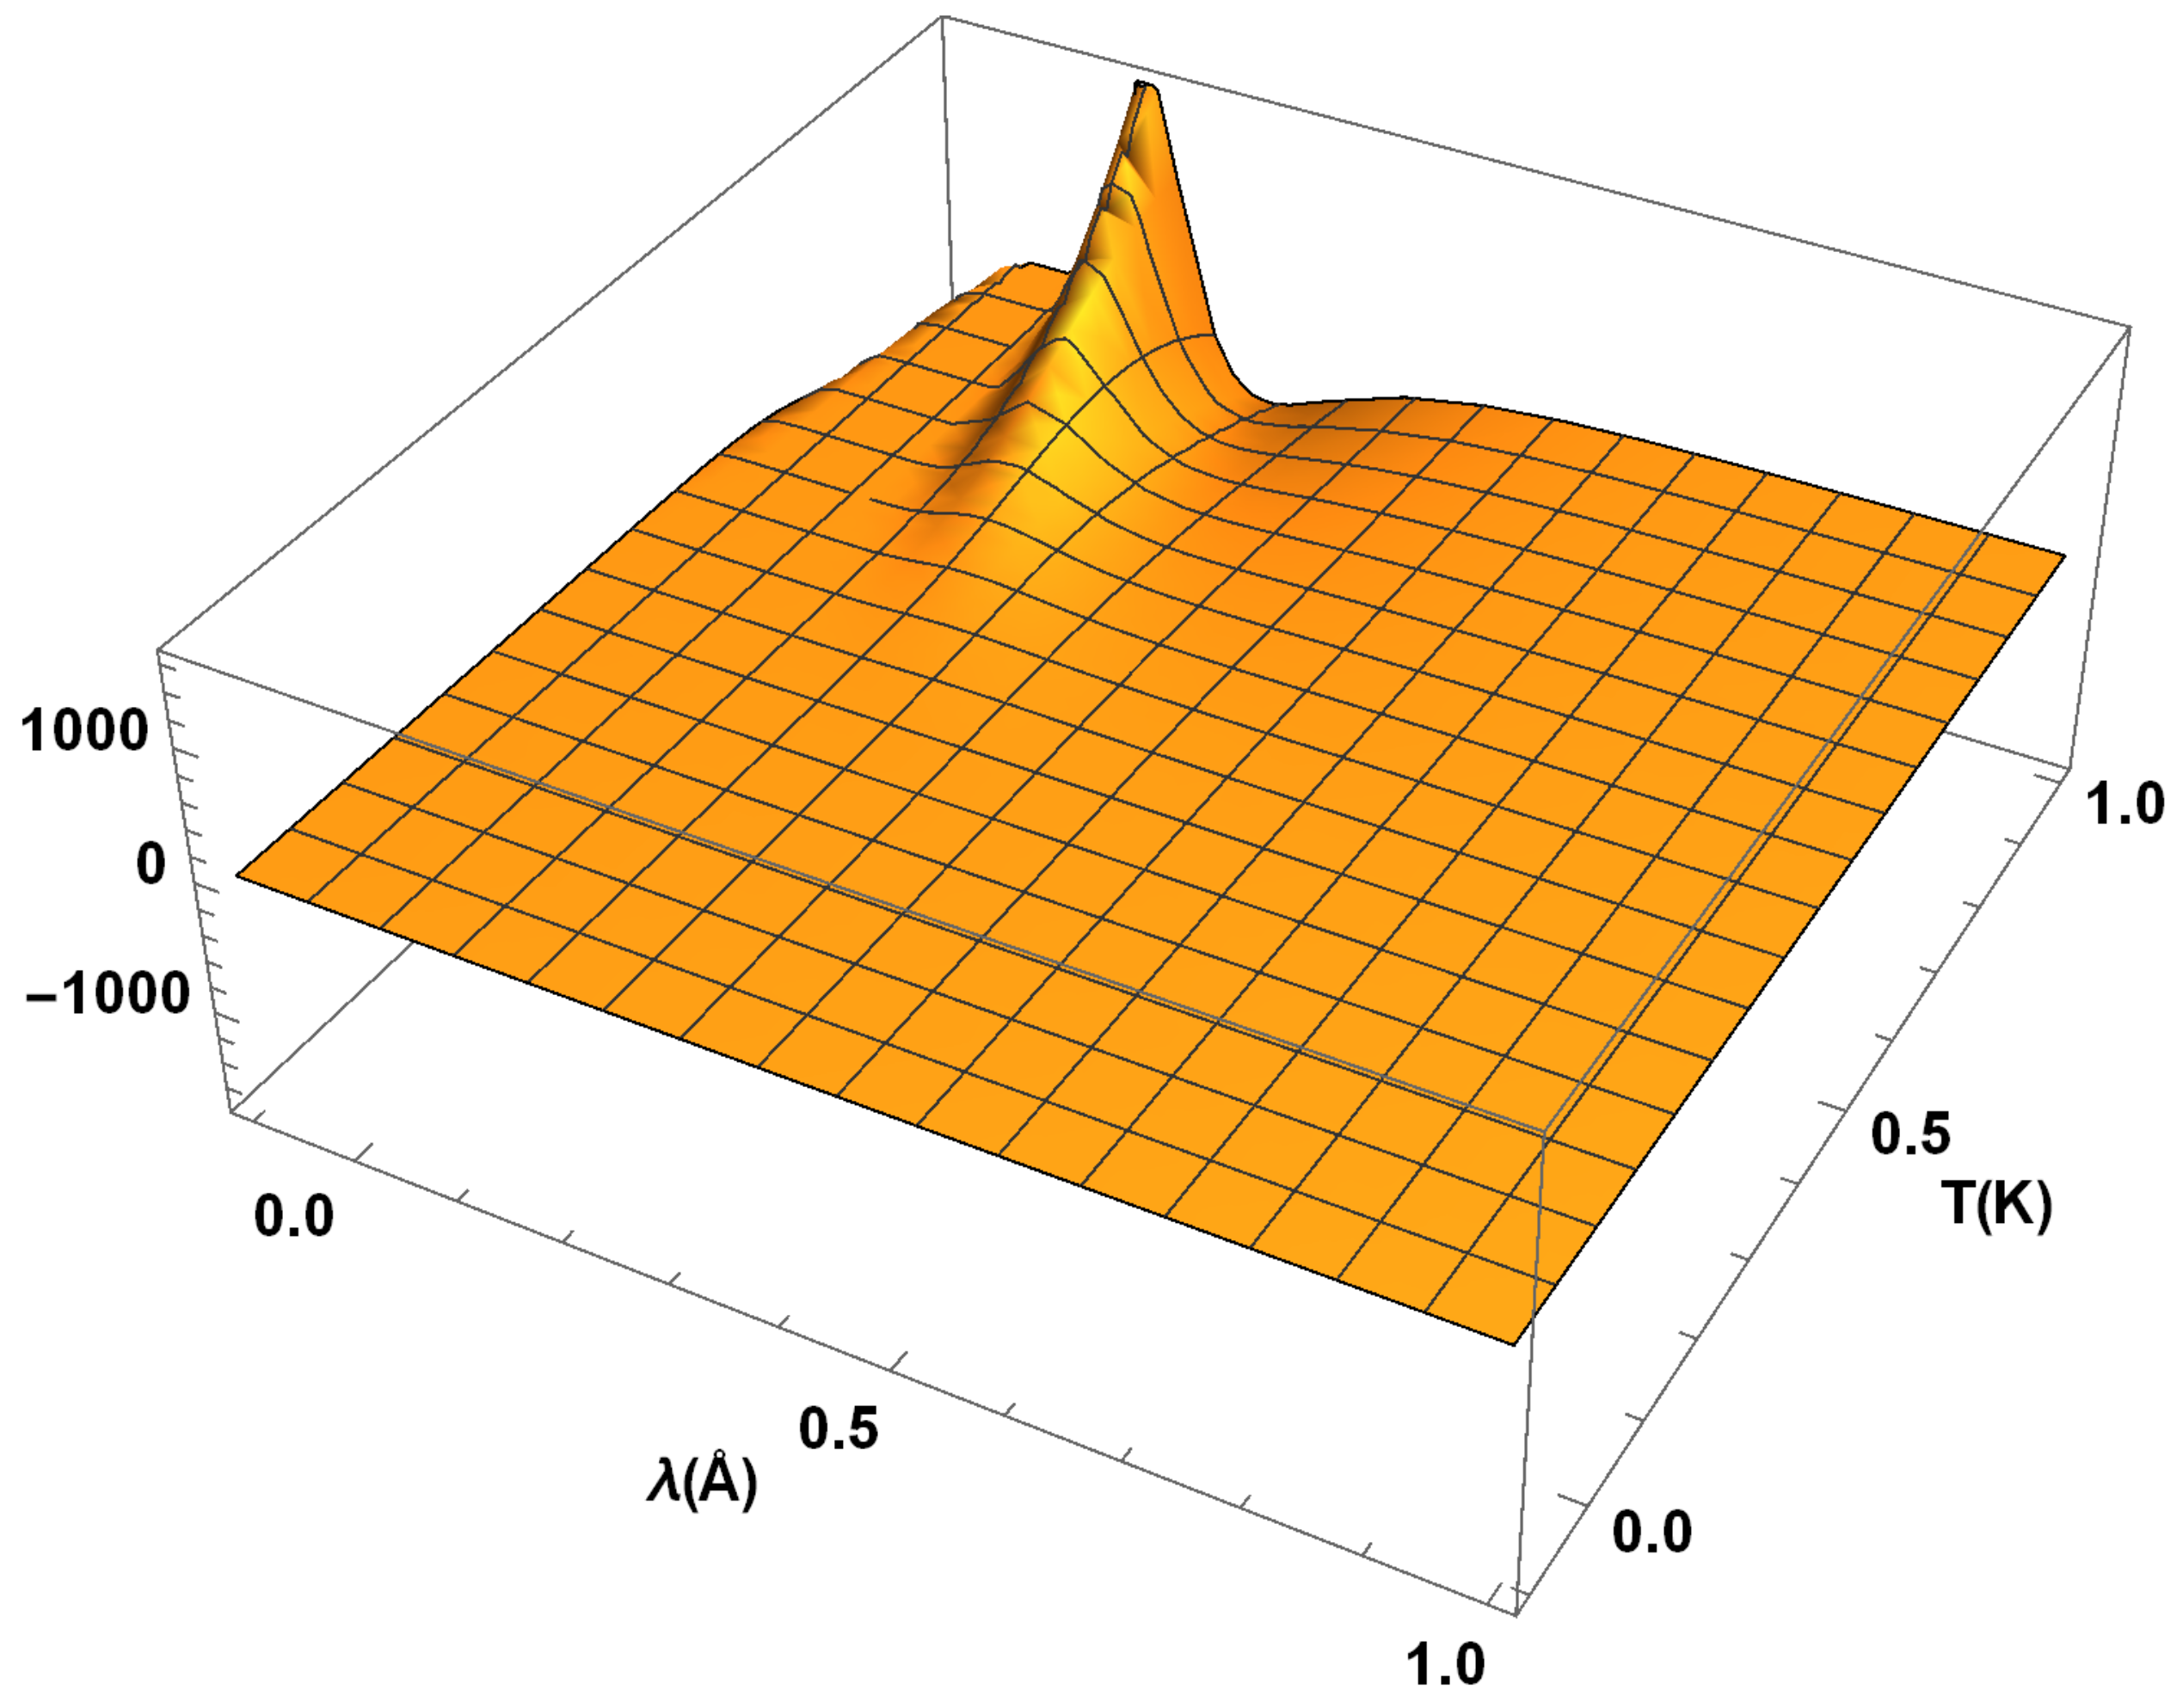
From
Figure 10, we see that the correlation
of the radiation distribution function
has maximum value in the region
of an approximate value of 1700 in the vicinity of
and
. In addition, we notice that
has a dips of the amplitude
in the interval
and
. The other correlation peak of negative fluctuations has its value around
. Moreover, there are no joint pixel glow variations in the regions of small
T or large
.
In
Figure 11, we provide qualitative behavior of the discriminant
D of fluctuations of the radiation distribution energy
against the wavelength
and temperature
T. In this case, we notice a sharp peak of the amplitude of its approximate value
in the region
and
. However, the determinant
D shows a dip of the amplitude
in the region
and
. Notice also that the determinant reaches negative values for small wavelengths and large temperatures, greater than
. Also, there are no fluctuations in the determinant
D in the regions of a small
T or large
.
6. Conclusions
In this paper, we provide an optimal design of infrared devices by allowing fluctuations in the Planck diffusion law. We discuss the nature of fluctuations over a range of the emission wavelength of an electronic device with its varying surface temperature. This gives a suitable design towards infrared detection techniques and defense measures. Herewith, we can reduce or optimize the identifiable symptoms of a military sensor such that it remains concealed from the enemy’s observations.
To be specific, we have discussed the maximum and minimum energy emission for a heated object in a selected range of the radiation variables, viz. the wavelength and temperature. Physically, the emission of such radiations happens at a particular wavelength that depends on the surface temperature of the radiating body. As far as the infrared radiation is concerned, we find that the radiation energy has the maximum radiative emission of heat in a region of small wavelengths of about a few micrometers, that is, the infrared zone of the electromagnetic radiation. Further, our modeling becomes better in the near IR region with wavelengths below one micrometer. Hereby, we take an account of the thermal imaging, attenuated scattering, and absorption of radiation beams. Note that such a beam could be formed by suspension of radiated particles, gas molecules, mist particles, and smoke, as well.
Our IR technique is supposed to optimize radiations happening in electronic instruments. In all such cases, our analysis also encompasses thermal imaging via temperature variations in the emissivity within a given scene, whereby in the lower IR band, say of its wavelength 6–15 micrometers, it could offer a higher sensitivity and thus a greater contrast. Other factors which undermine medium wavelength IR radiations include higher contrast zones, superior clear contrast zones as found in many countries of Asia and Africa, and other zones with high humidity and thermal resolution, occurring due to an optical diffraction. In the case of the designing of long wavelength IR instruments, an optimized analysis of the radiation energy is anticipated to provide a better detection performance in fog and dust conditions and winter haze that are typically found in West Europe and Northern America. This is realized via solar glints and fire players with a reduced sensitivity.
Moreover, the presented study is supported by a distribution theory depiction of the thermal radiation energy density profile. For example, see
Figure 3, where the solid curve represents the equilibrium configuration corresponding to the Wien’s law and the dashed curve as fluctuations over it. In the light of the fluctuation theory, it is worth emphasizing that the IR detectors work well over a varied range of temperature in the IR zone of the electromagnetic spectrum. In order to offer the optimal design of thermal instruments, we may concentrate near a saddle point of the radiation energy density. In this perspective, we anticipate fluctuation theory concepts to be noteworthy towards the optimal design of thermal detectors, passive defense measures, IR imaging, and their applications in the future scope of this research.
Nowadays, in the above directions, there has been an increasing interest, namely, in IR designing and instrumental techniques for medium and long wavelength IR detectors towards space applications. In the light of our proposed methodology, other directions include semiconductor detectors, photon detectors, bolometers, pyroelectric detectors, thermopiles, and various thermal detectors that can be regulated to offer an optimized output. Notice that our radiation optimization analysis could equally help designing suitable cooling tools for various detectors towards their smooth functioning, whereby it enables the greatest utility of the infrared technology. As far as the IR detectors are concerned, it is worth mentioning that their detectivity varies with respect to the detector sensitive area and electronic bandwidth [
37,
38,
39] whose numerical designing we leave open for a future research.

