Article

Micro-Tomographic Investigation of a North-Western Pacific Polymetallic Nodule

1
National Institute for Laser, Plasma and Radiation Physics, 409, Atomistilor str., Magurele, Ilfov, 077125 Bucharest, Romania
2
Department of Structure of Matter, Earth and Atmospheric Physics and Astrophysics, Faculty of Physics, Univesity of Bucharest, Magurele, Ilfov, 077125 Bucharest, Romania
3
Geological Institute of Romania, 1, Caransebes str., 012271 Bucharest, Romania
4
National Institute for R&D in Marine Geology and Geoecology, 23, Dimitrie Onciul str., 030167 Bucharest, Romania
*
Author to whom correspondence should be addressed.
Quaternary 2025, 8(4), 56; https://doi.org/10.3390/quat8040056
Submission received: 22 August 2025 / Revised: 28 September 2025 / Accepted: 13 October 2025 / Published: 17 October 2025

Abstract

Micro-computed tomography ( μ CT) and X-ray Fluorescence (XRF) were used to investigate a Polymetallic Nodule (PN) from the North-Western Pacific abyssal plain to gather more information concerning the environmental changes that could be reflected by the PN’s internal structure. Despite its small size, for example, an ovoid measured 48 × 38 mm, the μ CT revealed the presence of four concentric layers with varying thicknesses and opacities to X-rays, all developed around a fragment of a tooth, most likely belonging to a Lamniformes shark. The same micro-tomograph, functioning as an XRF spectrometer, allowed for the determination of the mass fractions of Mn and Fe in the first two external layers. To estimate the PN age, a model that considers PN growth rate proportional to the ratio of Mn to the square of Fe mass fractions was used, and, by extrapolating it to the entire PN, its age was estimated at 1.56 ± 0.22 Ma, i.e., Early Pleistocene. Therefore, the correlated use of μ CT and FRX, two noninvasive methods, allowed to highlight a shark tooth fragment as being the PN nucleus as well as determine its absolute age.

1. Introduction

Micro-computed tomography ( μ CT) represents a noninvasive method of investigation [1] which is able to perform 3D reconstructions of the Linear Attenuation Coefficient (LAC) distribution function of a great diversity of opaque objects, with a spatial resolution of less than 10 μm for items whose dimensions vary between 10 cm and a few mm [1,2,3,4,5]. For X-ray energies greater than 50 keV, tomographic images show the density distribution within the investigated object, weighted by the presence of elements with higher atomic numbers. Due to its performance, the μ CT is frequently applied in geosciences such as mineralogy [6], petrology [3,7,8,9,10,11,12], or paleontology [13,14,15,16].
Polymetallic nodules (PNs) are authigenic sedimentary structures found on the sea floor in shallow to deep marine waters of all oceans, where they develop at the interface between sediments and seawater [17]. Commonly, they show an intricate internal structure consisting of an alternation of more or less concentric layers presenting different degrees of mineralization. These layers are formed around a nucleus which could be a fragment of an older nodule [18], a piece of pumice or other rock [19], a whale otolith (Szobotka, unpublished results), a shark tooth [20,21], or any other hard body on which new mineralized layers could be added. PNs grow slowly with a rate varying between 1 and 20 mm every million years [22]. At the same time, PNs represent interesting objects of investigation, not only as archives of the marine environment over the past 10 or more million years [23,24], but also as a possible source of nonferrous Mn, Co, Ni, and Cu, of which demand has gradually increased in the past decades [25,26].
As with most sedimentary structures, determining the absolute age of PNs is a difficult task. The most common radiometric methods, such as K-Ar, Ar-Ar, U-Pb, and Th-Pb, are unsuitable for sedimentary materials or require the use of Accelerated Mass Spectroscopy (AMS), as is the case for the cosmogenic s 10 B [27,28]. In this regard, the only radiometric absolute age methods which gave confident results in the case of a PN were Th exces 240 and Pa 241 [27,29], which permitted, due to the half-life time of 75.4 ky for Th 240 and 32.8 ky for Pa 241 , the determination of the growth rate for the PN outer layers only, i.e., a maximum of 500 ky. Nevertheless, by extrapolating these values to the entire PN, it is possible to estimate its absolute age.
Based on the results obtained by these methods, as shown by Lyle [30], the growth rate of PNs was found to be proportional to the c M n / ( c F e ) 2 mass fractions ratio, such that the average age of a PN can be estimated by its chemical composition.
To investigate the elemental composition of a PN, more analytical methods can be used, such as Thermal Ionization Mass Spectrometry (TIMS) [24], Inductively Coupled Plasma Atomic Emission Spectrometry (ICP-AE) [31], Laser Ablation Inductively Coupled Plasma Time of Flight Mass Spectrometry (LA-ICP-TFMS) [32], Scanning Electron Microscope Energy-Dispersive X-ray Spectrometry (SEM-EDS) [33], or X-ray Fluorescence (XRF) [34,35,36]. Among all of them, XRF presents the advantage of direct access to a sample of great size without any preliminary preparation. Moreover, due to the closer Z of Mn (Z = 25) and Fe (Z = 26), their mass fraction can be easily determined without preliminary energy calibration.
Due to a completely cartilaginous skeleton, shark teeth, rich in hydro-xyapatite, Ca5(PO4)3(OH), are the only bone tissue that fossilizes, with their remains being highly diagnostic of Family and even Genus for both fossil and modern individuals. Moreover, in the case of sharks, the tooth presents a great diversity between Families, permitting relatively good identification. From this point of view, a confident determination of a fossil shark tooth embedded in a PN in connection with its age could be useful in assessing the environmental conditions of the past.
This short communication paper presents and discusses the results of an investigation of a North-Western Pacific PN using three-dimensional micro-computed tomography combined with X-Ray Fluorescence measurements, both combined in a single experimental setup. It is also important to note that this research was limited to noninvasive methods, as any more detailed investigations would require dismantling the nodule.

2. Materials and Methods

2.1. Samples

2.1.1. Polymetallic Nodule

The investigated PN (Figure 1A), a singular exemplar of its kind, comes from the collection of the National Institute for Marine Geology and Geoecology in Bucharest, but except for an approximate location of the collection point (North-Western Pacific basin), all other information concerning the name of the cruise ship or the date of collection is missing.

2.1.2. Shark Teeth for Identification

To identify the tooth fragment embedded in the nodule, we have examined more than 60 different shark teeth, this time collected from the Clarion–Clipperton abyssal plane of the North Pacific (12° N–13° N and 137° W–138° W) during the 1986 cruise of the Russian research vessel Akademik Alexandr Karpinski.

2.2. μ -Computed Tomography

All μ CT investigations have been performed by using a homemade computed tomograph (CT) provided with a 20 mW Phoenix—X-Ray Microfocus open-tube ray source with a maximum high voltage of 160 kVp and a SIRECON 17-2 HDR-M X-ray image intensifier (Sirecon GmbH, Aachen, Germany) coupled with a CCD-Compact-Camera. A 10 bits analog National Instruments IMAQ PCI-1409 frame grabber (National Instruments Corporation, Austin, TX, USA) was used for image acquisition. Both detector and sample orientations were adjusted by means of a Sigma-Koki computer-controlled micrometric motorized stage (Sigma Koki Co., Ltd., Saitama, Japan). The sample positioning system included two translations and one rotation axis in order to realize a 3D assembly. The reduction in distortion for the total imaging chain (image intensifier, lenses, and CCD) was, depending on the reproduction scale, in the range of 3% to 7%.
Two networked Dual CPU (2 GHz, 2 GB) workstations were used for image acquisition, 3D reconstruction, and volume visualization. Both image acquisition and motorized stage control programs were developed on the base of the National Instruments LabView Virtual Instruments library. As a rule, the PN was scanned for 360 to 720 projections that determined a final optical resolution better than 10 μm and an LAC resolution of about 0.5%, better visible on the 2D tomographic images (Figure 1B and Figure 2). By means of a proprietary highly optimized computer code based on a modified Feldkamp algorithm [2], the 3D tomographic reconstructions were performed in an interval of time varying between 2 min for a 256 × 256 × 256 line volume and 20 min for a 1024 × 1024 × 512 line volume. The 3D Studio Max 2020 program was used for further 3D images rendering (Figure 1A and Figure 3), for a voxel volume of a minimum of 40 × 80 μ .

2.3. XRF Measurements

The ratio of Mn to square Fe mass fraction, an essential index in evaluating the PN’s growth rate, was calculated starting from the XRE fluorescence spectra obtained using the same X-ray tube and an Amptek XR-100CR thermoelectrically cooled Si-PIN X-ray detector and preamplifier (Amptek Inc., Bedford, MA, USA) coupled to a multichannel analyzer card. For spectral calibration, the best results were obtained using a set of secondary reference samples enriched in Mn and Fe up to 10–15%. In areas lacking the external cortex, the investigation was extended beyond it to include the underlying second layer (Figure 1B and Figure 2A,B).

3. Results and Discussion

3.1. Polymetallic Nodule and Shark Tooth

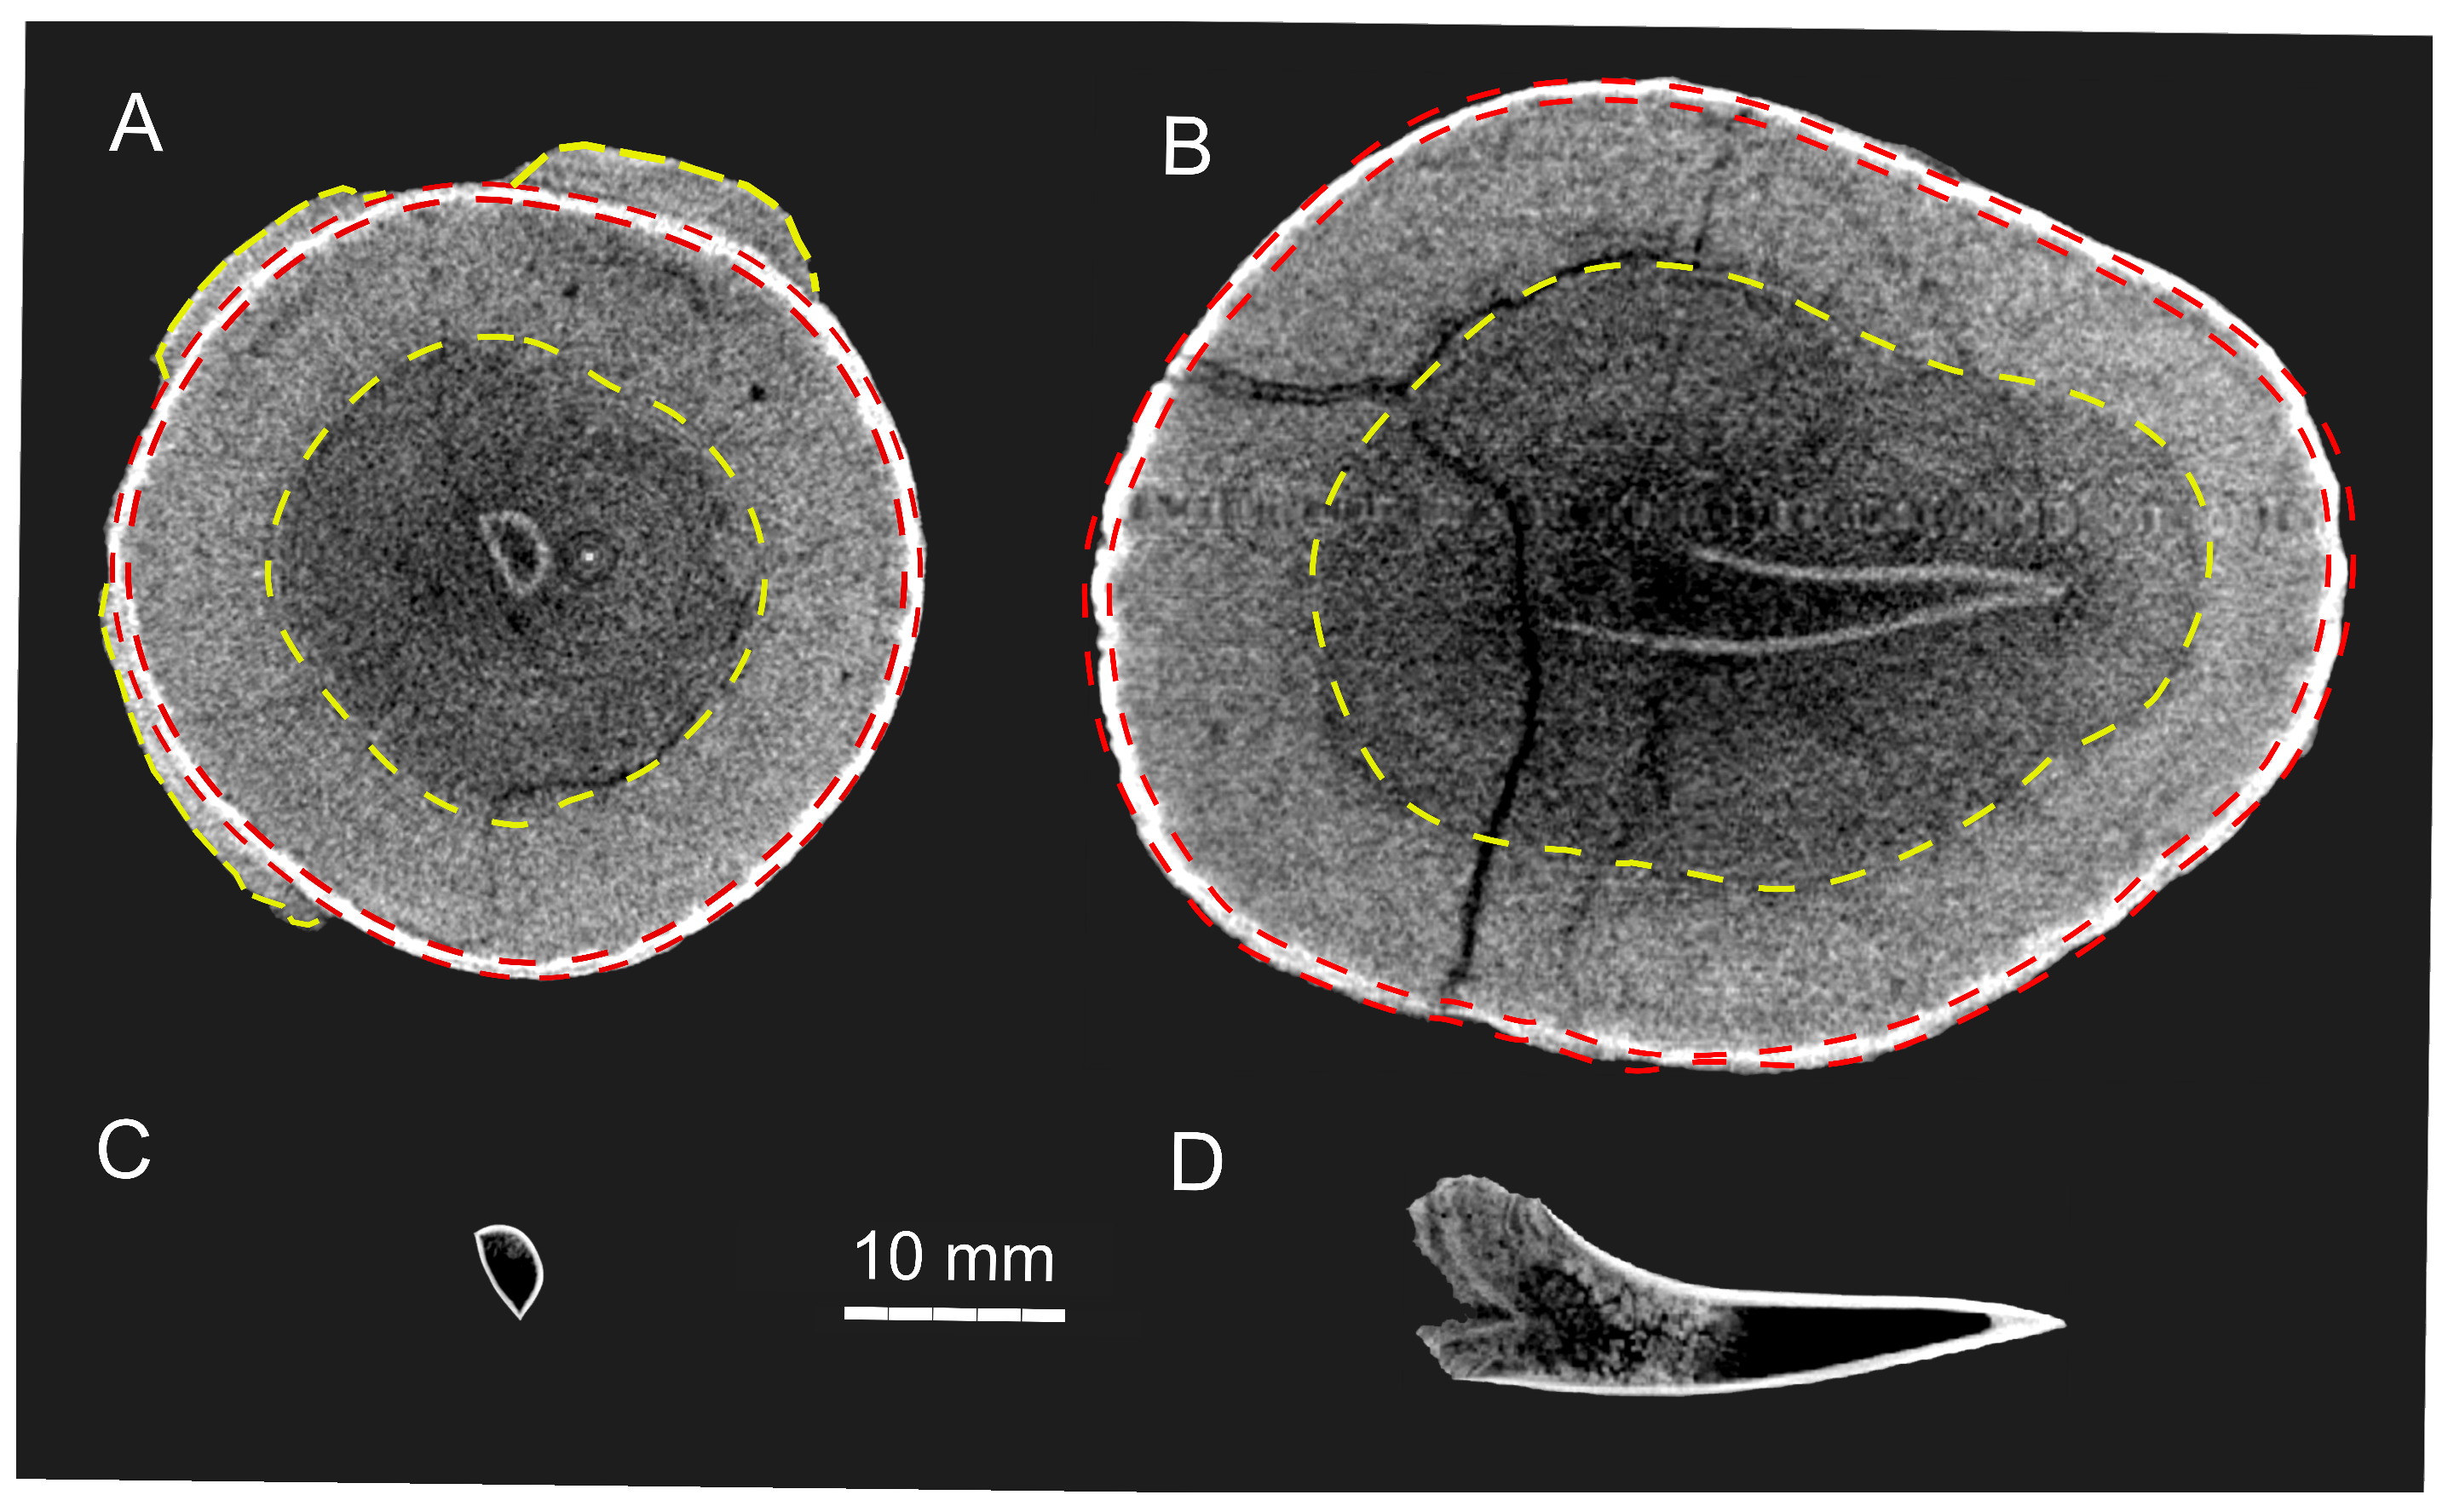
Morphologically, the investigated PN was a medium-to-small-dimension nodule with a slightly ovoid shape (48 mm long axis × 38 mm maximum diameter) and a smooth surface, presenting some traces of internal fissures but no other defects (Figure 1A). A tomographic image of a cross-section shows the presence of at least two concentric layers developed around a nucleus, and an external, partially developed layer—the cortex—all of them with various degrees of mineralization. The external partially developed cortex presents a maximum thickness of 1.5 mm. It is followed by a thin (cca 0.5–0.8 mm) continuous layer, well mineralized judging by its light color on the μ CT image, and a thicker one entirely covering the nucleus, of which the densities, by taking into account their gray tone, are found to be close to that of the cortex (Figure 1B and Figure 2A,B). Judging by its morphology, this PN is very similar to those presented and discussed in refs. [18,21]. The most remarkable feature of this nodule is represented by the second, more mineralized layer, net-delimited in respect of the cortex and the third layer, but the inner two layers are also well evidenced (Figure 1B and Figure 2A,B). Given the well-represented limits of these layers on the μ -CT images, the most probable explanation of this finding is related to the major changes in the marine environment during the nodule formation.
In the PN center, tomographic images revealed the presence of a hollow, elongated, and slightly recurved object, denser than the material around it (Figure 1B and Figure 2D). Using an appropriate 3D Studio Max image segmentation technique, it was possible to partition the PN 3D image into several constituent components and to extract the lower-density material around it. Finally it resulted in a 3D image of an object with an approximately recurved conical shape, which was empty inside with the lower part slightly eroded, and of which the surface presented a missing portion (Figure 3A). Further, the images of both transverse and longitudinal sections, evidenced in Figure 1 and Figure 2, suggest that this object appears to be the crown of an elongated, slightly recurved tooth lacking root lobes; it is most probably an upper anterior tooth belonging to a shark [37,38]. In this regard, it is worth mentioning the high-resolution 3D reconstruction of the PN tooth illustrating its internal structure (Figure 2D). To determine the Family to which this shark belongs, the PN tooth’s 3D image was carefully compared with more than 60 different shark teeth collected from the Pacific abyssal sediments, as mentioned before, until those that most resembled the tooth fragment were identified. For this, more characteristics, such as size, a recurved shape, as well as a semicircular section, were taken into account. Finally, for better identification, its 3D μ -tomographic image obtained in the same experimental conditions of magnification as that of the PN tooth fragment were compared (Figure 3B).
Therefore, given the resemblance between the shape of both teeth as well as their similar sizes, the tooth fragment found in the nodule most likely represents, as mentioned, a remnant of an upper jaw tooth, presumably belonging to an exemplar of Fam. Lamnidae, which are actually inhabitants of the Atlantic as well as Indo-Pacific Oceans, and whose fossil teeth have been found frequently in various Neogene formations [20,39]. In this regard, it should be remarked that sharks continuously replace teeth throughout their lives, and, when replaced, these teeth are almost the same age, ranging between a few days and a few months.

3.2. X-Ray Spectra and the Polymetallic Nodule Age

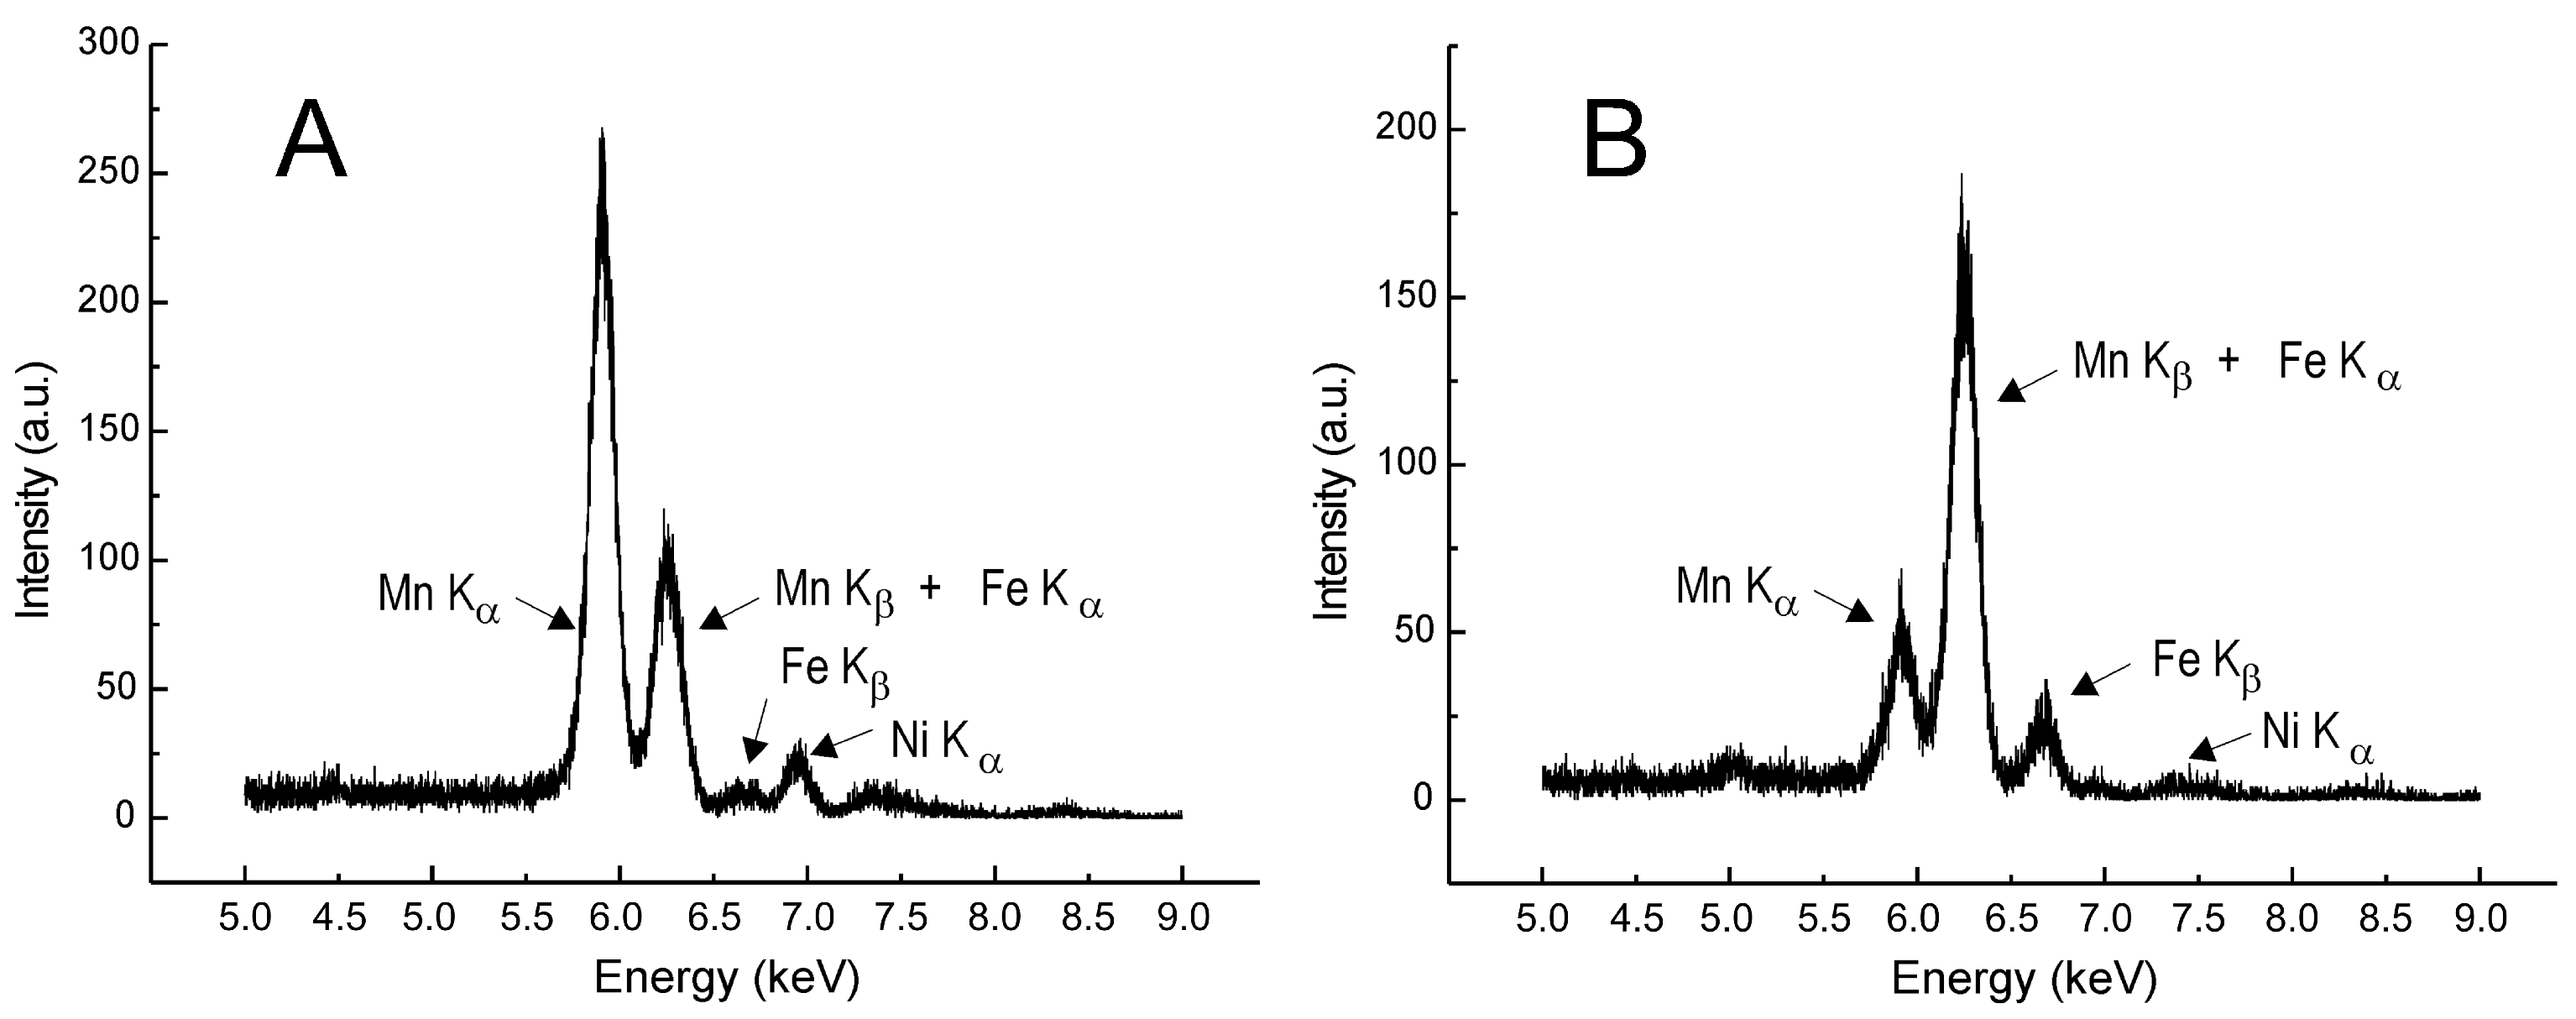
The experimental XRF spectra, averaged for a minimum of four positions on each layer, are reproduced in Figure 4. It is worth mentioning that for the same layer, XRF spectra were much closer, but between the cortex and first layer there was an important difference: the cortex was significantly enriched in Mn (Figure 4, Table 1).
As mentioned before, a direct determination of the age of a PN, a typical sedimentary formation, is almost impossible, except in an external layer with an age of less than 500 ky [27], in which case only the Th exces 240 and Pa 241 [27] can be used. Therefore, the only solution to this problem consists of using the semi-empirical relation between mass fractions of Mn and Fe and the growth rate R proposed by Lyle [30]:
R = 16.0 c M n ( c F e ) 2 + 0.448
where c M n and c F e are the mass fractions of Mn and Fe, respectively, expressed in %, and R is the growth ratio expressed in mm/Ma.
In our case, because the μ CT could be used, with small adjustments, as an XRF spectrometer, it was possible to determine the Mn and Fe mass fractions for the cortex and the second layer, the only layers that were directly accessible to the X-rays. For these layers, the XRF investigation gave for the Mn and Fe mass fractions the values reproduced in Table 1, which were further used to calculate the corresponding absolute ages (Table 1).
This permitted the calculation of c M n / ( c F e ) 2 mass fraction ratio for the cortex as 1.84 ± 0.24, while for the inner layer, this ratio was 0.13 ± 0.01. Given the strong similarity between the cortex and the third mineralized layer, we assumed the same chemical composition and thus the c M n / ( c F e ) 2 ratio for these layers.
Under this approximation, we determined the cortex and the second layer growth ratios to be 29.8 ± 3.8 mm/My and 2.5 ± 0.2 mm/ka, respectively. Further, by extrapolating the growth rate of the cortex to the third and the fourth layer, given the relative similarity of the gray tomographic image hues, we have estimated the average age of the tooth fragment at 1.56 ± 0.22 Ma, which corresponds to the Early Pleistocene, while the Lamniformes are dated back to the Cretaceous [40].
By analyzing the XRF spectra reproduced in Figure 4, the presence of nickel can be noted, of which the content, judging by the amplitude of its K α line, seems to be higher in the cortex than in the first layer, confirming once more the complexity of PN chemistry.
In this regard, it should be mentioned that c M n / ( c F e ) 2 mass fraction ratio was significantly smaller for the first mineralized layer than for the lighter cortex layer (Figure 1B and Figure 2).
More problematic was the innermost layer, whose degree of mineralization, judging by its nuance of gray, was smaller than that of the cortex and the second two layers, but to elucidate this finding, it would have been necessary to section the nodule, which exceeded the aims of this project.
As a secondary observation, both XRF spectra showed the presence of Ni, which was less abundant in the second layer, thereby confirming the existence of different environmental conditions in which PN layers were deposited.

3.3. Nodule Layers

As mentioned before, judging by the tomographic images, the investigated nodule consists of at least four layers: the cortex and the other three. This fact suggests that in its period of formation and evolution, at least three major events in the marine environment occurred, reflected by the subsequent chemical composition variations in the layers, as highlighted in the tomographic images in Figure 1B and Figure 2A,B. This assumption is also confirmed by the net changes in the Mn and Fe mass fractions between the first two external layers as the date reproduced in Table 1 suggests.
In this regard, the only way to obtain more information on the possible causes that contributed to the appearance of this type of structure involves PN sectioning, an invasive intervention.

4. Conclusions

X-ray micro-tomography was used to investigate a South Pacific Polymetallic Nodule (PN). On tomographic images illustrating both transverse and longitudinal sections, four well-delimited concentric layers were evidenced, including the external layers and the cortex. The same μ -tomographic investigation evidenced a fragment of a shark tooth, which, in spite of some degradation, retained its original shape.
The μ CT X-ray generator was used with an appropriate detection system to determine the Mn and Fe mass fractions corresponding to the first two layers, which permitted us to calculate, based on a model which considered that the PN growth rate was proportional to the ratio between the Mn mass fraction and the square of the Fe mass fraction, the corresponding growth rates. Extrapolated to the entire PN, its age was estimated at 1.56 ± 0.22 Ma, which corresponds to the Early Pleistocene.
By using appropriate software, it was possible to obtain a 3D representation of this fragment. By comparing this image with similar tomographic images of different shark teeth collected from the sediments of the Clarion–Clipperton abyssal plain, it was possible to assign with a notable degree of probability the PN tooth fragment to a Lamnidea Family shark.
Therefore, the combination of X-ray micro-tomography and XRF proved to be capable of providing more information concerning PNs’ ages as well as the marine environment where they evolved.
The well-evidenced concentric layered structure of the investigated PN suggests that, during its evolution, four major changes in the marine environment took place. However, to explain this peculiarity, it is necessary to conduct more detailed investigations that involve partitioning a significant number of similar PNs into parallel sections for individual analysis.

Author Contributions

Conceptualization, O.G.D. and S.A.S.; methodology, T.C. and I.T.; software, T.C. and I.T.; validation, T.C., O.G.D., I.T., and S.A.S.; formal analysis, T.C., O.G.D., I.T., and S.A.S.; investigation, O.G.D. and S.A.S.; resources, T.C., I.T., and S.A.S.; data curation, O.G.D., T.C., I.T., and S.A.S.; writing—original draft preparation, O.G.D.; writing—review and editing, O.G.D. and S.A.S.; visualization, O.G.D. and T.C.; supervision, O.G.D.; project administration, S.A.S. All authors have read and agreed to the published version of the manuscript.

Funding

This research received no external funding.

Data Availability Statement

No data available.

Acknowledgments

The authors thank Theodor Nalbant for his help in determining the nature of both shark teeth. This paper is dedicated to the memory of Stefan A. Szobotka, who left us during the completion of this project. We wish thank three anonymous reviewers for their useful remarks and advice.

Conflicts of Interest

The authors declare no conflicts of interest.

Abbreviations

The following abbreviations are used in this manuscript:
CTComputed Tomograph
CATComputed Axial Tomography
ICP-AEInductively Coupled Plasma Atomic Emission
ICP-MSInductively Coupled Plasma Mass Spectrometry
LACLinear Attenuation Coefficient
LA-ICP-TOFMSLaser Ablation Inductively Coupled Plasma Time of Flight Mass Spectrometry
μ CTMicro-Computed Tomography
PNPolymetallic Nodule
XRFX-Ray Fluorescence
ZAtomic Number

References

  1. Stock, R.S. MicroComputed Tomography: Methodology and Applications; CRC Press: Boca Raton, FL, USA, 2019; ISBN 978-0429186745. [Google Scholar]
  2. Feldkamp, L.A.; Davis, L.C.; Kress, J.W. Practical cone-beam algorithm. J. Opt. Soc. Amer. A 1984, 1, 612–619. [Google Scholar] [CrossRef]
  3. Van Geet, M.; Swennen, R.; Wevers, M. Towards 3-D petrography: Application of microfocus computer tomographyin geological science. Comput. Geosci. 2001, 27, 1091–1099. [Google Scholar] [CrossRef]
  4. Ou, X.; Chen, X.; Xu, X.; Xie, L.; Chen, X.; Hong, Z.; Bai, H.; Liu, X.; Chen, Q.; Li, L.; et al. Recent Development in X-Ray Imaging Technology: Future and Challenges. Research 2021, 2021, 9892152. [Google Scholar] [CrossRef] [PubMed]
  5. Hounsfield, G.N. A Method and an Apparatus for Examination of a Body by Radiation Such as X-or Gamma Radiation. British Patent No. 1283915, August 1968. [Google Scholar]
  6. Guntoro, P.I.; Ghorbani, Y.; Pierre-Henri Koch, P.-Y.; Jan Rosenkranz, J. X-ray Microcomputed Tomography (μCT) for Mineral Characterization: A Review of Data Analysis Methods. Minerals 2019, 9, 183. [Google Scholar] [CrossRef]
  7. Duliu, O.G. Computer axial tomography in geosciences: An overview. Earth-Sci. Rev. 1999, 48, 265–281. [Google Scholar] [CrossRef]
  8. Ketcham, R.A.; Carlson, W.D. Acquisition, optimization and interpretation of X-ray computed tomographic imagery: Applications to the geosciences. Comput. Geosci. 2001, 27, 381–400. [Google Scholar] [CrossRef]
  9. Alves, H.; Lima, I.; de Assis, J.T.; Nevesc, A.A.; Lopes, R.T. Mineralogy evaluation and segmentation using dual-energy microtomography. X Ray Spectr. 2014, 44, 99–104. [Google Scholar] [CrossRef]
  10. Duliu, O.G.; Ivankina, T.I.; Herman, E.; Ricman, C.; Tiseanu, I. Orientation distribution function of biotite platelets based on optical, thin sections and m-CT image analysis in an Outokumpu (Finland) biotite gneiss: Comparison with neutron diffraction texture analysis. Rus. J. Earth Sci. 2016, 16, ES3003. [Google Scholar] [CrossRef]
  11. Cornard, P.H.; Degenhart, G.; Tropper, P.; Moernaut, J.; Strasser, M. Application of micro-CT to resolve textural properties and assess primary sedimentary structures of deep-marine sandstones. Deposit. Rec. 2024, 10, 559–580. [Google Scholar] [CrossRef]
  12. Giamas, V.; Koutsovitis, P.; Sideris, A.; Turberg, P.; Grammatikopoulos, T.A.; Petrunisa, P.; Giannakopoulou, P.P.; Koukouzas, N.; Hatzipanagiotou, K. Effectiveness of X-ray micro-CT applications upon mafic and ultramafisc ophiolitic rocks. Micron 2022, 158, 103229. [Google Scholar] [CrossRef]
  13. Peris, D.; Mähler, B.; Kolibáč, J. Review of the family Thanerocleridae (Coleoptera: Cleroidea) and the description of Thanerosus gen. nov. from cretaceous amber using micro-CT Scanning. Insects 2022, 13, 438. [Google Scholar] [CrossRef]
  14. Heřmanová, Z.; Bruthansová, J.; Holcová, K.; Mikuláš, R.; Veselská, M.K.; Kočí, T.; Dudák, J.; Vohník, M. Benefits and limits of x-ray micro-computed tomography for visualization of colonization and bioerosion of shelled organism. Palaeont. Electron. 2020, 23, a23. [Google Scholar] [CrossRef]
  15. Bicknell, R.D.C.; Smith, P.M.; Birch, S.A.; Bevitt, J.J. An earliest Triassic age for Tasmaniolimulus and comments on synchrotron tomography of Gondwanan horseshoe crabs. PeerJ 2022, 10, 13326. [Google Scholar] [CrossRef] [PubMed]
  16. Xu, W.-J.; Sun, Z.-Y.; Liu, S.; Ji, C.; Lu, H.; Ma, Z.-L.; Wu, F.-Y.; Chen, S.-M.; Huang, J.-D. Multielement conodont apparatus (Cornudina) from the Lower Triassic of China, revealed by high-resolution X-ray microtomography. Palaeoworld 2025, 34, 200964. [Google Scholar] [CrossRef]
  17. Kuhn, T.; Wegorzewski, A.; Rühlemann, C.; Vink, A. Composition, Formation, and Occurrence of Polymetallic Nodules. In Deep Sea Mining; Sharma, R., Ed.; Springer: Berlin/Heidelberg, Germany, 2017; pp. 23–63. [Google Scholar] [CrossRef]
  18. Rizescu, C.T.; Georgescu, G.N.; Duliu, O.G.; Szobotka, S.A. 3-D dual gamma-ray computer axial tomography investigation of polymetallic nodules. Deep Sea Res. Part I Ocean. Res. Pap. 2001, 48, 2529–2540. [Google Scholar] [CrossRef]
  19. González, F.J.; Somoza, L.; Lunar, R.; Martínez-Frías, J.; Martín Rubí, J.A.; Torres, T.; Ortiz, J.E.; Díaz del Río, V.; Pinheiro, L.M.; Magalhães, V.H. Hydrocarbon-Derived Ferromanganese Nodules in Carbonate-Mud Mounds from the Gulf of Cadiz: Mud-Breccia Sediments and Clasts as Nucleation Sites. Mar. Geol. 2009, 261, 64–81. [Google Scholar] [CrossRef]
  20. Terauchi, D.; Shimomura, R.; Machida, S.; Yasukawa, K.; Nakamura, K.; Kato, Y. X-ray Computed Tomography Analysis of Ferromanganese Nodule Nuclei from the Western North Pacific Ocean: Insights into Their Origins. Minerals 2023, 13, 710. [Google Scholar] [CrossRef]
  21. Nakamura, K.; Terauchi, D.; Shimomura, R.; Machida, S.; Yasukawa, K.; Fujinaga, K.; Kato, Y. Three-Dimensional Structural Analysis of Ferromanganese Nodules from the Western North Pacific Ocean Using X-ray Computed Tomography. Minerals 2021, 11, 1100. [Google Scholar] [CrossRef]
  22. Heye, D. Growth conditions of manganese nodules. Comparative studies of growth rate, magnetization, chemical composition and internal structure. Progr. Ocean. 1978, 7, 163–239. [Google Scholar] [CrossRef]
  23. Eisenhauer, A.; Gögen, K.; Pernicka, E.; Mangini, A. Climatic influences on the growth rates of Mn crusts during the Late Quaternary. Earth Planet. Sci. Let. 1992, 109, 25–36. [Google Scholar] [CrossRef]
  24. Bollhöfer, A.; Eisenhauer, A.; Frank, N.; Pech, D.; Mangini, A. Th- and U-isotopes in a Mn-nodule from the Peru Basin determined by alpha spectrometry and Thermal Ionisation mass spectrometry: Are manganese supply and growth related to climate? Geolog. Rund. 1996, 85, 577–585. [Google Scholar] [CrossRef]
  25. Verlaan, P.A.; Cronan, D.S. Origin and variability of resource-grade marine ferromanganese nodules and crusts in the Pacific Ocean: A review of biogeochemical and physical controls. Geochemistry 2022, 82, 125741. [Google Scholar] [CrossRef]
  26. Hein, J.; Kira, M. Deep-ocean polymetallic nodules and cobalt-rich ferromanganese crusts in the global ocean: New sources for critical metals. In The United Nations Convention on the Law of the Sea, Part XI, Regime and the International Seabed Authority: A Twenty-Five Year Journey; Ascencio-Herrera, A., Nordquist, M.H., Eds.; Brill Nijhof: Leyden, The Netherlands; Boston, MA, USA, 2022; pp. 177–179. [Google Scholar] [CrossRef]
  27. Geyh, M.; Schleiher, H. Absolute Age Determination: Physical and Chemical Dating Methods and Their Application; Springer: Berlin/Heidelberg, Germany, 2012; ISBN 978-3-642-74826-4. [Google Scholar]
  28. Wilcken, K.M.; Codilean, A.T.; Fülöp, R.-H.; Kotevski, S.; Rood, A.H.; Rood, D.H.; Seal, A.J.; Krista Simon, K. Technical note: Accelerator mass spectrometry of 10Be and 27Al at low nuclide concentrations. Geochronology 2022, 4, 339–352. [Google Scholar] [CrossRef]
  29. Krishnaswami, S.; Cochran, J.K. Uranium and thorium series nuclides in oriented ferromanganese nodules: Growth rates, turnover times and nuclide behavior. Earth Planet. Sci. Let. 1978, 40, 45–62. [Google Scholar] [CrossRef]
  30. Lyle, M. Estimation of growth ratio of ferromanganese nodules from chemical compositios: Implication for nodule formation processes. Geochim. Cosmochim. Acta 1982, 46, 2301–2306. [Google Scholar] [CrossRef]
  31. Duliu, O.G.; Alexe, V.; Moutte, J.; Szobotca, S.A. Major and trace elements distribution in abyssal clay, micronodules and manganese nodules from Clarion-Clipperton region (North East Pacific). Geo-Mar. Let. 2009, 29, 71–83. [Google Scholar] [CrossRef]
  32. Peng, J.; Li, D.; Hollings, P.; Fu, Y.; Sun, X. Visualization of critical metals in marine nodules by rapid and high-resolution LA-ICP-TOFMS mapping. Ore Geol. Rev. 2023, 154, 105342. [Google Scholar] [CrossRef]
  33. Xu, L.; Deng, Y.; Guan, Y.; Sun, X.; Li, D.; He, W.; Ren, Y.; Xiao, Z. Nano-Mineralogy and Mineralization of the Polymetallic Nodules from the Interbasin of Seamounts, the Western Pacific Ocean. Minerals 2024, 14, 47. [Google Scholar] [CrossRef]
  34. Calvert, S.E.; Cousens, B.L.; Soon, M.Y.S. An X-ray fluorescence spectrometric method for the determination of major and minor elements in ferromanganese nodules. Chem. Geol. 1985, 51, 9–18. [Google Scholar] [CrossRef]
  35. Chubarov, V.; Amosova, A.; Finkelshtein, A. X-ray fluorescence determination of major elements in ferromanganese nodules. X-Ray Spectr. 2020, 49, 615–621. [Google Scholar] [CrossRef]
  36. Li, J.; Jin, Y.; Wang, H.; Yang, K.; Zhu, Z.; Meng, X.; Li, X. In-situ analysis of polymetallic nodules from the clarion-Clipperton zone, Pacific Ocean: Implication for controlling on chemical composition variability. Front. Mar. Sci 2024, 11, 1489184. [Google Scholar] [CrossRef]
  37. Garrick, J.A.F. Revision of sharks of genus Isurus with a description of a new species (Galeoidea, Lamnidae). Proc. United States Natl. Mus. 1967, 118, 663–690. [Google Scholar] [CrossRef]
  38. Enax, J. Structure, composition, and mechanical properties of shark teeth. J. Struct. Biol. 2012, 178, 290–299. [Google Scholar] [CrossRef] [PubMed]
  39. Purdy, R.W. A Key to the Common Genera of Neogene Shark Teeth, National Museum of Natural History, Washington D.C. Revised February. 1990. Available online: https://siris-libraries.si.edu/ipac20/ipac.jsp?&profile=liball&source=~!silibraries&uri=full=3100001~!723383~!0#focus (accessed on 10 June 2025).
  40. Nelson, J.S. Fishes of the World; John Wiley & Sons: Hoboken, NJ, USA, 2009; ISBN 978-0-471-25031-9. [Google Scholar]
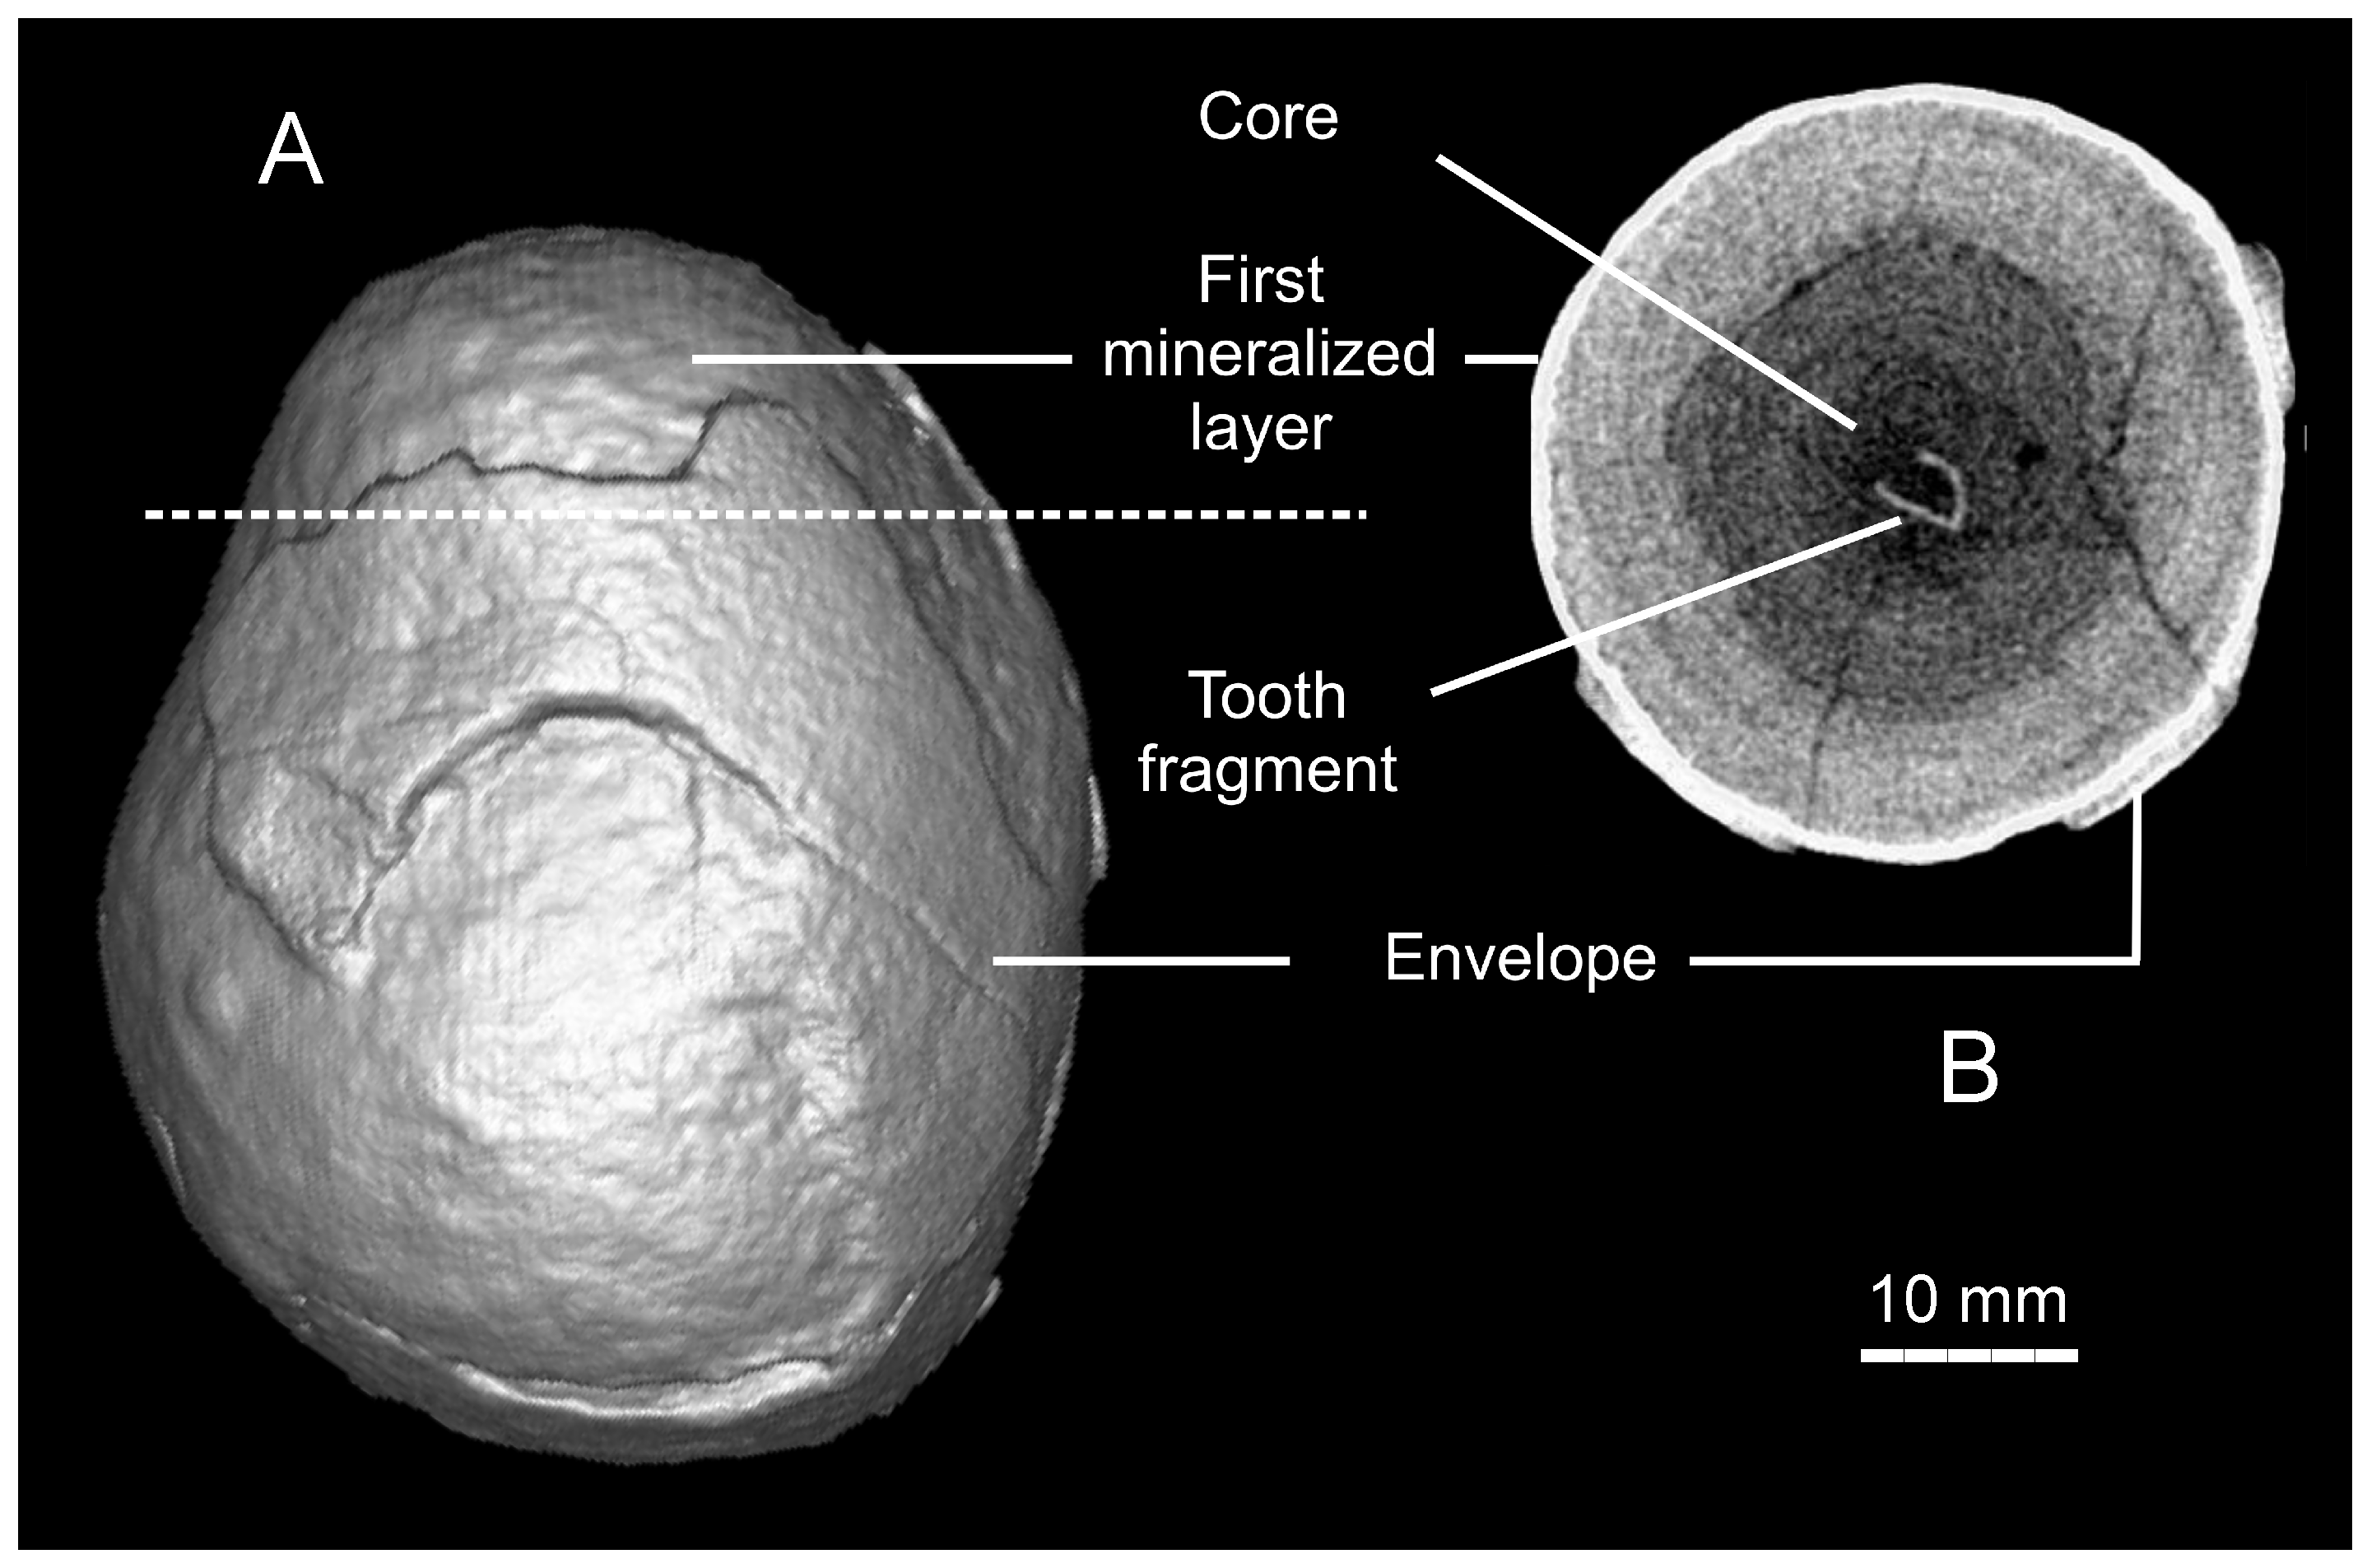
Figure 1. A 3D μ CT reconstruction of the entire PN (A) and the corresponding 2D μ CT image of a transverse section, of which the position within the PN is marked by a dashed line (B). The 2D μ CT tomographic image (B) illustrates with clarity the presence of four sections, a nucleus developed around a shark tooth fragment, two concentric layers around the nucleus, and an external cortex. On both images, the cortex appears incomplete (negative images).
Quaternary 08 00056 g001
Figure 2. Two different μ CT images of transverse (A) and longitudinal (B) sections of the nodule and corresponding CT sections through a shark tooth (C, D). In image (A), the cortex that discontinuously encircles the nodule is better evidenced. For a better illustration, the nucleus and the other layers, including the cortex, are marked by dashed coloured lines. The light dot present in the center of the tomographic image is a CT reconstruction artifact (negative images).
Quaternary 08 00056 g002
Figure 3. The 3D μ CT images of the tooth fragment virtually extracted from the PN nucleus (A) as well as images of a recent Isurus sp. shark tooth (B) (negative images). To highlight their similarity, both groups of images, i.e., the tooth fragment and the recent image, have the same orientation.
Quaternary 08 00056 g003
Figure 4. X-Ray Fluorescence (XRF) spectra of the cortex (A) and of the first mineralized layer (B).
Quaternary 08 00056 g004
Table 1. The first two PN layers’ average thickness values (in mm), the corresponding values of the Mn and Fe mass fractions (in %), the grow rates R (in mm/My) calculated according to Equation (1), as well as the estimated ages (in ky).
LayerAverage ThicknessMnFeRAge
Cortex1.525.8 ± 1.33.75 ± 0.229.8 ± 0.450.3 ± 0.9
First layer0.6515.1 ± 0.710.8 ± 0.62.5 ± 0.2260 ± 20
Disclaimer/Publisher’s Note: The statements, opinions and data contained in all publications are solely those of the individual author(s) and contributor(s) and not of MDPI and/or the editor(s). MDPI and/or the editor(s) disclaim responsibility for any injury to people or property resulting from any ideas, methods, instructions or products referred to in the content.