Article

Palaeoenvironmental Synthesis of the Eastern Ebro Basin Loess–Palaeosol Sequences (LPSs)

by
Daniela Álvarez
*,
Carlos Alberto Torres-Guerrero
,
Jaume Boixadera
,
Carles Balasch
,
José Manuel Plata
,
Rafael Rodríguez Ochoa
,
José Ramón Olarieta
and
Rosa M. Poch
Department of Chemistry, Physics, Environmental and Soil Sciences, Universitat de Lleida, Av. de l’Alcalde Rovira Roure, 191, 25198 Lleida, Spain
*
Author to whom correspondence should be addressed.
Quaternary 2025, 8(2), 25; https://doi.org/10.3390/quat8020025
Submission received: 31 December 2024 / Revised: 17 April 2025 / Accepted: 24 April 2025 / Published: 12 May 2025

Abstract

:
Loess–palaeosol sequences (LPSs) are continuous records of palaeoenvironmental and palaeoclimatic conditions during the Quaternary. This study includes 17 LPS located in the NE of the Iberian Peninsula, irregularly distributed, associated with different river basins: the Ebro Basin, the Mora Basin, and the Ter sub-basin. The soils developed on these loess deposits present a loam–sandy texture, coarser than the typical loess, ochre in colour, with variable thickness (1–12 m), calcareous composition (20–45% CaCO3 eq.), very low or null organic matter (OM), and basic pH. These deposits have been classified as desert LPS, whose pedogenesis is mainly associated with the redistribution of calcium carbonate and, in some cases, gypsum. Several methodologies have been applied to determine their mineralogical, physical, and chemical characteristics and date them by luminescence techniques. In addition, some relevant pedofeatures (porosity, CaCO3, gypsum, etc.) have been characterised in detail. The aims of the present study have been to know the pedogenic development of the LPS by defining the main soil-forming factors that have affected them in order to associate these factors with the characteristic palaeoclimatic and palaeoenvironmental conditions reported in this area over time and to improve the understanding of soil evolution.

Graphical Abstract

1. Introduction

Loess is an aeolian sediment that covers approximately 10% of the global land area [1,2]. It usually has silt or silty loam textures and is the parent material of good-quality soils; consequently, it is an object of permanent interest in sedimentology and soil science. The most extensive loess deposits in the world are linked to glacial processes or cold weathering near the main ice caps. This has led to the assumption that this type of deposit is always due to the direct action of glaciers. However, some loess outcrops are generated by dust from desert areas, forming the so-called peri-desert loess [3,4]. The idea of two distinct origins for the loess-forming material, a ‘glacial’ and a ‘desert’ origin, goes back to work published in the middle of the last century [5,6]. Later, some authors have highlighted the importance of other factors in their formation, such as environmental, tectonic, lithological, and geomorphological [7,8].
Loess–palaeosol sequences (LPSs) have been studied as a useful record of the climatic and environmental variations that occurred on the earth’s surface during the Quaternary [9]. However, classical research often oversimplifies the information obtained from LPS by considering only syn-sedimentary processes without considering some uncertainties and limitations, such as the allochthonous origin of the sediment, post-sedimentary overprinting of the analysed indicators, or the lack of proxies that are dependent on soil parent material or climate. Therefore, to interpret correctly several proxies, knowledge of the most relevant processes involved in the development of LPS and possible post-sedimentary modifications is necessary [10]. In relation to climatic variations, LPS deposits are usually divided into different stratigraphic units that represent cold and unstable stages that allow dust accumulation and warmer and stable stages that favour pedogenesis [11]. Also, the zonality associated with the location of the deposit and with different soil types, vegetation, and climatic zones at a global scale seems to be an important requirement from a pedological point of view when interpreting loess [12,13]. Thus, the study of how and when these deposits were formed, as well as how these soils have developed over time, is an interesting resource for palaeoclimatic reconstructions using global climatic models [14]. Studies on the effects of climatic variations on European continental areas [15,16,17] determine that the European loess belt constitutes the most extensive and continuous record of the Last Glacial and evidence of high rates of loess sedimentation during this period [18]. In addition to the loess belt regions in Northern, Northeastern, and Central Europe, there are deposits in the European Mediterranean area and North Africa that have given cause for some questions about their origin, as they seem to have certain differences in their development [19]. These deposits suggest the existence of a transition area between the periglacial loesses of the European belt and the peri-desert deposits found in Africa. In general, the northeastern Mediterranean loess has been associated with soft periglacial conditions [19], while the loess of North Africa has been classified as peri-desert loess, already described in other regions of the eastern Mediterranean [20]. Within this frame, the loess of the Iberian Peninsula can be considered as associated with intermediate palaeoclimatic conditions (between glacial and desert origins). They do not generally constitute deposits as large as in other parts of the planet, but their interest has increased in recent decades [21]. At present, there are investigations on loess and loess-like deposits in the southeast of the Spanish plateau [22], in the southern region of Spain [23], in the Tagus River valley [24], and in scattered deposits of the Mediterranean area [25,26].
In the Ebro River Basin, the first studies reported deposits of ‘gypsiferous silts’ [25,27,28] and, occasionally, mentioned the formation of soil on loess in areas of the Northeast of the peninsula [26,29,30]. However, they were not studied in detail until the systematic studies carried out by Boixadera et al. [31] and later by Plata [32]. Currently there are thirteen LPSs located in the Ebro basin and Cubeta de Mora and four sequences in striations of the Alemenara Range and northeast of Girona (Figure 1).
Research until now in this area includes the study of their origin and source areas [33,34] as well as the detailed description and sampling of the sequences for physico-chemical and micromorphological analyses [31,33,35,36,37]. A more detailed characterisation of some of the most relevant pedofeatures has been included, such as the description of the rubefaction processes in some profiles [35], the evolution of their structure at different scales [36], the formation of a special type of biocalcifications called ‘queras’ [37], and different types of pedogenic gypsum accumulations [38]. Moreover, for most of the sequences, luminescence dating techniques were applied (OSL and pIR250), which allow us to know the time of their deposition [31,33,34,35,36,37].
The present study enlarges the set of LPS and proposes a selection of pedofeatures based on their relevance to understanding the pedogenic development of these soils and to contributing to the understanding of the palaeoclimate and palaeoenvironment of this area during the Quaternary, linked to carbonate and gypsum dynamics, clay illuviation, and rubefaction.
In the literature, the main environmental indicators studied are pollen records and stable isotope analyses (δ13C and δ13O) of organic matter, organic compounds, secondary carbonates, magnetic parameters, and lipid molecular proxies [39]. However, classical investigations have not considered possible uncertainties and limitations such as the allochthonous origin of the palaeosol, post-sedimentary overprinting of the analysed indicators by post-formation processes, or the lack of some of these indicators, as is the case for the Ebro Valley sequences. The main objectives of this research are as follows: (1) to summarise the 17 sequences described and analysed; (2) to carry out a detailed characterisation of some of the most relevant pedofeatures in order to identify the main formation factors that have favoured the development of the sequences; (3) to determine the chronology of the depositions of the material by luminescence dating to allow us to time the pedogenic processes that have taken place and relate them to available palaeoclimatic models; (4) to evaluate the limitations of the methodologies employed and suggest future research; and (5) to develop a first hypothesis for the palaeoenvironmental reconstruction of the study area.

2. Methodology

The methodology applied in this research has been previously published [31,32,35,36,37]. Therefore, in this section we will only provide a brief description of each method and technique employed.

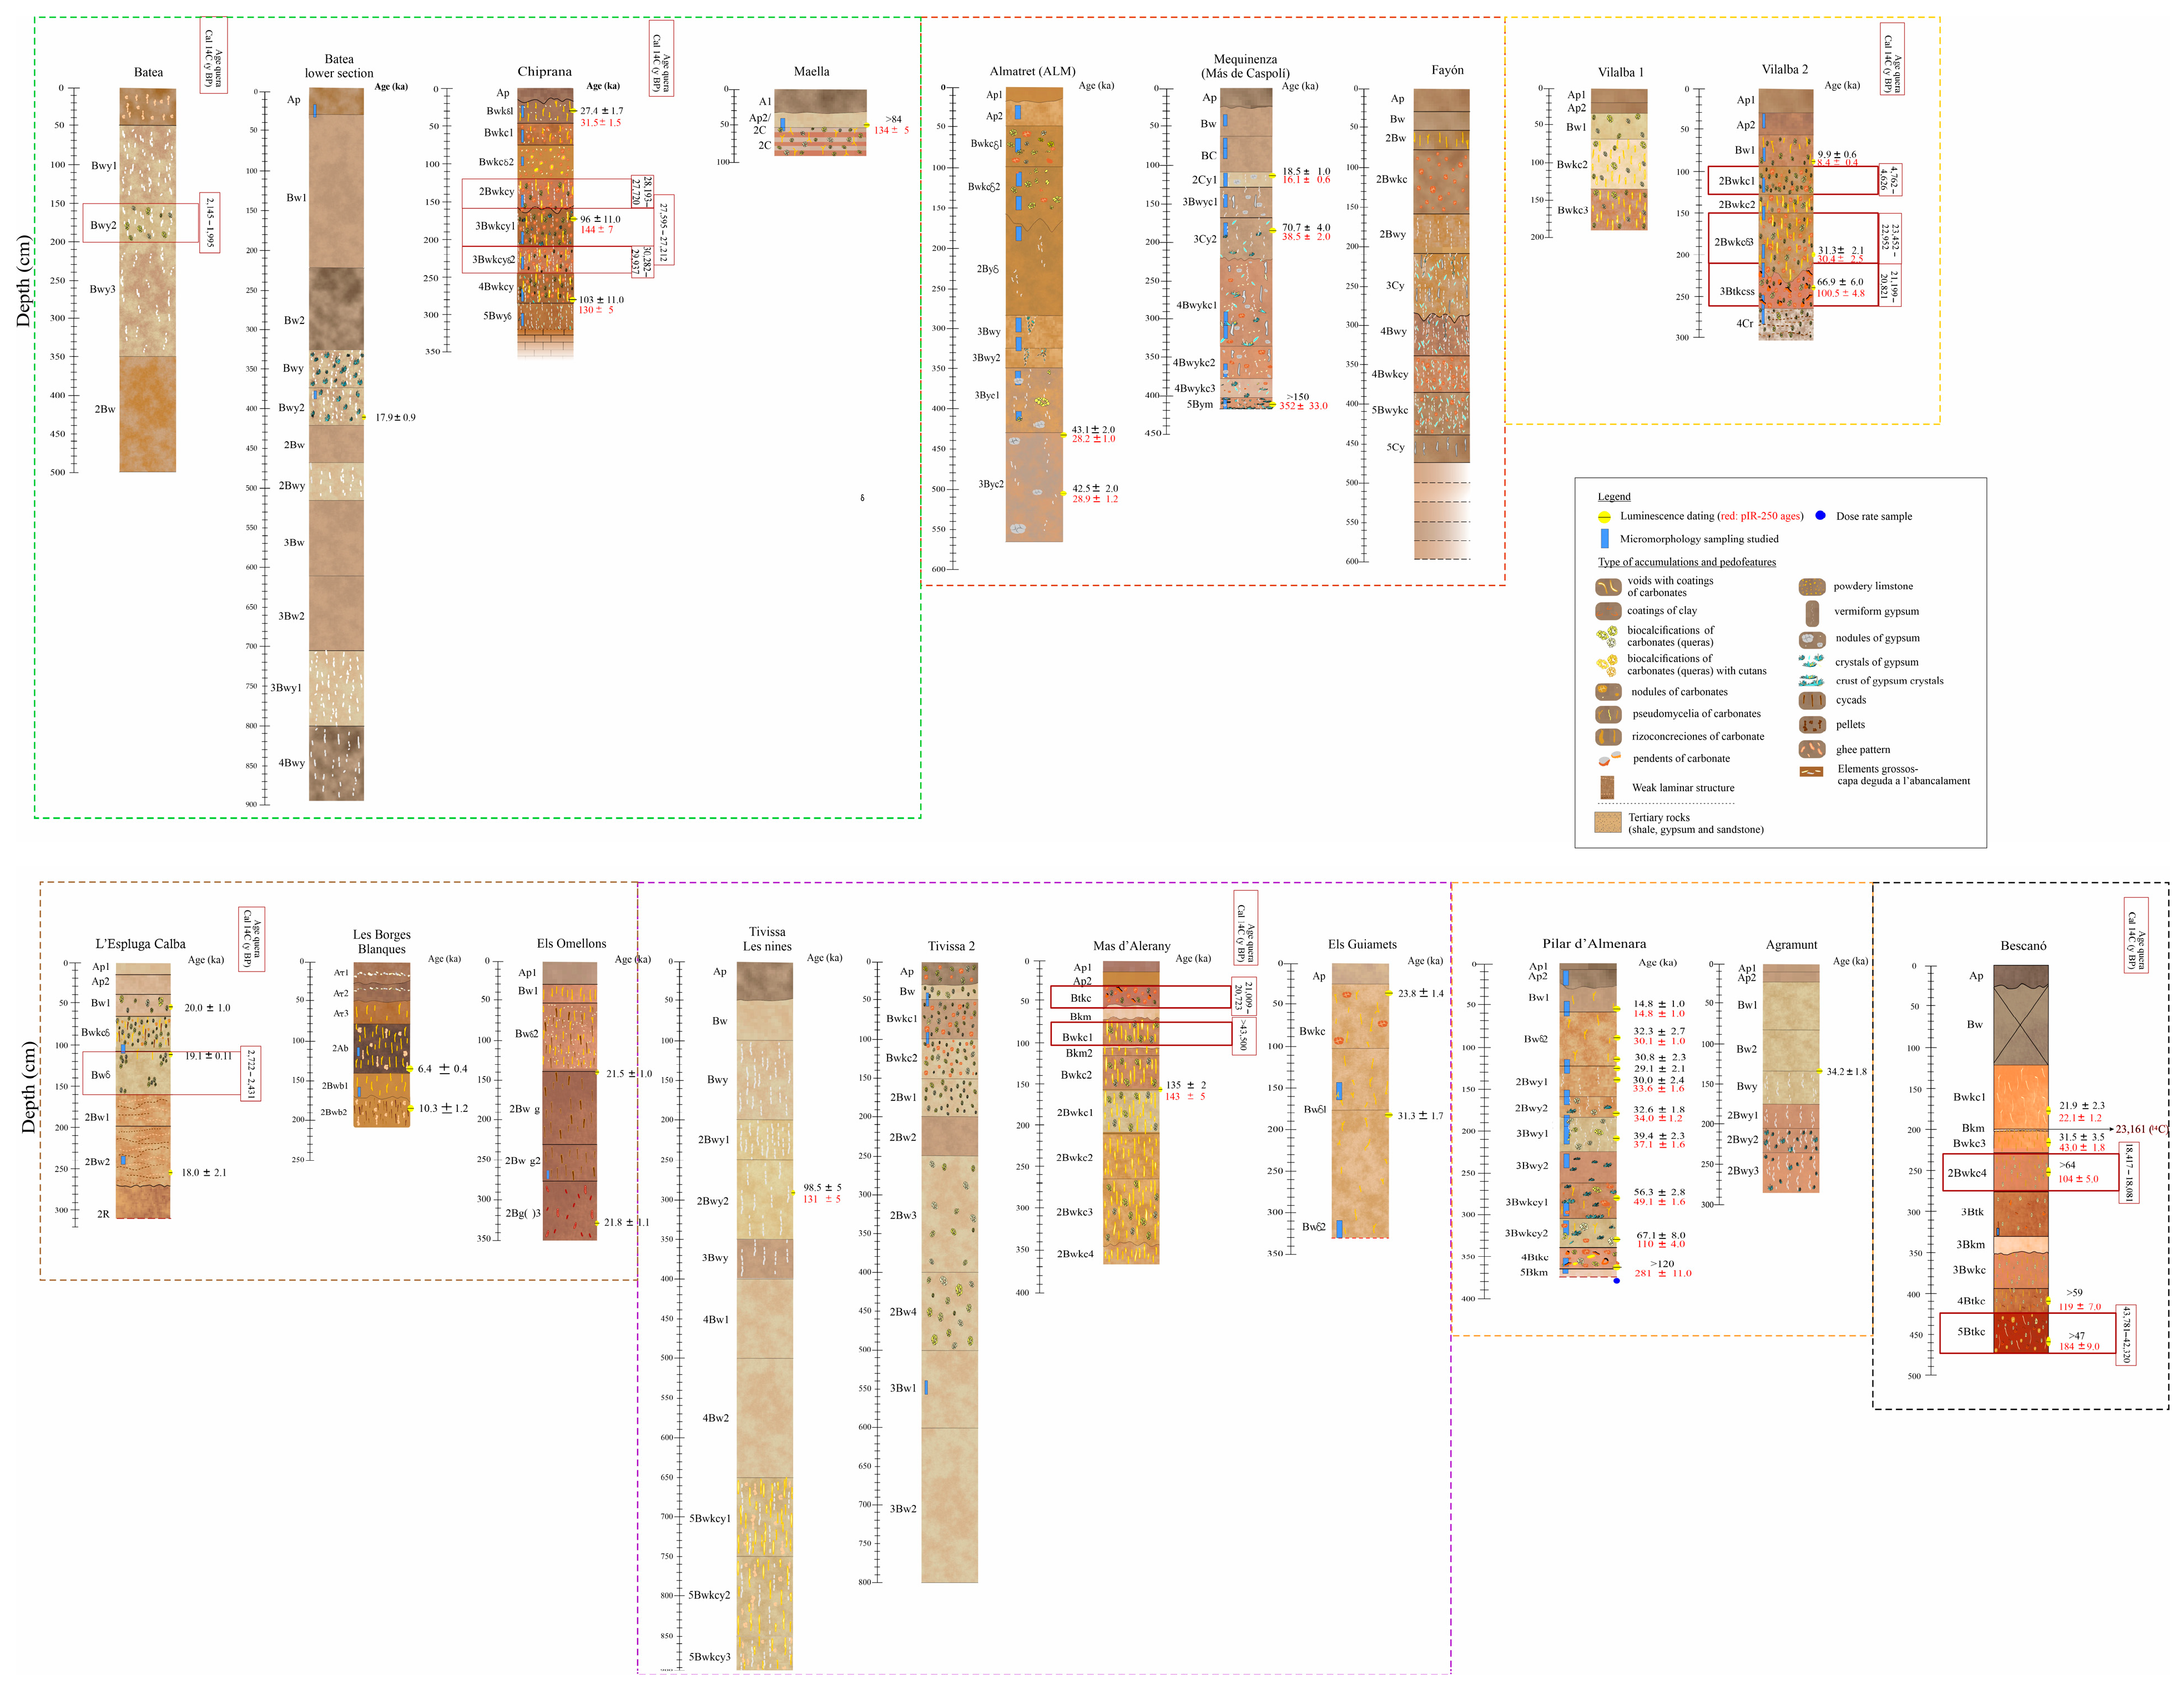
2.1. Profile Description and Sampling

The 17 LPS were described and sampled following SINEDARES guidelines [40]. The samples were air-dried, pre-treated in those cases where it was necessary, and analysed to determine their physical and chemical parameters in the soil laboratory of the University of Lleida. Moreover, luminescence dating samples were taken using metallic tubes, taking care to not expose them to sunlight.

2.2. Physical and Chemical Analyses

The laboratory analysis was performed according to the methods described by Porta et al. [41]. The particle size distribution was obtained by the American pipette method, and five fractions were obtained according to the USDA granulometric classification, which were then represented in the texture triangle.
The chemical parameters measured were calcium carbonate (calcimeter), organic carbon (Walkley–Black), pH (water, 1:2.5), and electrical conductivity (EC, 1:5). The gypsum content was determined gravimetrically by the method described in Artieda [42].
The mineralogy of the clay fraction (coarse and fine clay) was determined at the University of Geology–Complutense de Madrid. Sample preparation included a pre-treatment to remove carbonates, organic matter, and sulphates by attack with acetic acid [41]. After separation of the clays and preparation of the orientated aggregates, measurements in dry air (NT), solvation with ethylene glycol, and heat treatment at 550 °C were carried out before reflection analysis in the 060 plane. For the determination, an XR diffraction Bruker model D8 Advance powder diffractometer (USA, California) with Bragg–Brentano measurements were used. This equipment has a Cu anode and a SOL-X energy dispersive detector. Finally, the software used for data acquisition, processing, and evaluation was DIFFRACplus (Bruker, Germany).

2.3. Preparation of Thin Sections and Micromorphological Analysis

Unaltered blocks were air-dried and then impregnated with polyester resin. From these blocks, 5 × 13 cm vertical thin sections were produced according to Benyarku and Stoops [43]. The thin sections were examined and described using an Olympus BX51 petrographic microscope (Tokio, Japan) combining different magnifications and light sources (polarised plane light, PPL, and cross-polarised light, XPL), following the guidelines of Stoops [44].
Micromorphological study has allowed us to characterise the microstructure [36], groundmass, relational distribution of the particles, and their composition. In addition, it has been a critical instrument to characterise the most relevant pedofeatures, including clay coatings [35], queras [37], and pedogenic gypsum accumulations [38].

2.4. Luminescence Dating

The different horizons of the studied LPS were dated by optically stimulated luminescence (OSL) and post-stimulated infrared luminescence (pIR) on quartz and feldspar grains, respectively. The methodology followed for dating LPS has been previously published in the following way: Guiamets (GUI), Agramunt (AGR), Batea (BAT), Mas d’Alerany (MAS) [31], Chiprana (CHI) [35], Pilar d’Almenara (PIL) [34,36], Bescanó (BES), l’Espluga Calba (ESC), and Vilalba dels Arcs (VIL2) [37] (the Fayón sequence (FAY) has not yet been dated).
In this section we explain briefly the methodology used for the unpublished samples (BB and OMS), whose methodology is the same as the one published in Álvarez et al. [37].
Luminescence sampling was carried out with steel tubes, avoiding exposure to sunlight. Subsequently, under controlled lighting conditions, the samples were extracted from the tubes, and the sand size fraction (100–200 µm) was obtained by wet sieving. In addition, carbonate removal with 20% HCl and organic matter removal with 30% H2O2O2 were carried out. All measurements were performed with a Risø DA-14 reader (DTU Physics). Feldspar and quartz fractions were enriched by heavy liquid separation, and the quartz fraction was chemically attacked with 40% HF for 60 min. The dried mineral grains were fixed on stainless steel discs using silicone oil.
The OSL of quartz was measured using the single aliquot regenerative dose (SAR) protocol, with thermal pre-treatment at 240 °C for 10 s [31,35,37]. The OSL signals were quite intense and dominated by the fast component. Their growth was best described by the sum of two exponential functions. Replications were performed until a minimum of 20 aliquots satisfied the rejection criteria. The distributions of De were moderately complex (overdispersion values between 24% and 47%), with a slight positive asymmetry in many cases; therefore, different age models were tested. For most samples, the Central Age Model (CAM) was used; some required the application of the Minimum Age Model (MAM) or the Finite Mixture Model (FMM) [45]. All calculations were performed using the R scripts of Kreutzer et al. [46]. Dating with feldspar was performed using the multiple elevated temperature post-IR stimulated infrared luminescence (MET, abbreviated as pIR in the following) protocol, modified according to Li and Li [47]. This protocol included a thermal pre-treatment (270 °C for 60 s), followed by IRSL stimulation at different temperatures (50 °C, 100 °C, 150 °C, 200 °C, and 250 °C for 100 s, respectively, with BG-39 and Corning 7–59 filters). After measurement of the test dose, thermal bleaching at 320 °C for 100 s was employed. This method was also best described by the sum of two exponential functions. The number of replicate measurements was 9, and CAM was applied for the calculation of the average dose.
To determine the concentration of elements relevant for the dose rate (K, Th, and U), a low-level gamma spectrometer was used [48,49]. Due to limited or no carbonate leaching, no correction was required in this case to calculate the radiation dose [50]. Moisture values during burial were considered to range between 5% and 15%, based on measurements of current water content and values reported by Boixadera et al. [31]. Age calculations were performed with ADELEv2017 (Wilsdruff, Germany) [51].

2.5. Specific Research

In this section we describe the specific methods and techniques used to identify the source areas of LPS materials [33,34], as well as the methodology used to characterise the most relevant pedofeatures, such as microstructure [36], biocalcifications (‘queras’) [37], and pedogenic gypsum [38].

2.5.1. Identification of Source Areas

To identify the source areas of aeolian materials forming the loess deposits in the Eastern Ebro Valley and Sierra d’Almenara, grain size, sorting, and fractionation analyses were conducted [33,34], linked to aeolian deflation and transport [52,53]. Furthermore, 47 samples were analysed: 42 from Ebro, Cinca, and Segre River terraces (47–4 ka), correlated with coeval floodplain levels [30,31], and 5 from Miocene sandstone palaeochannels. Heavy mineral composition was studied using petrographic [54,55] and binocular microscopy [56,57]. Statistical analyses, including PCA and Kruskal–Wallis tests [58], confirmed particle provenance hypotheses. Results revealed significant differences in heavy mineral abundances and identified groups forming the loess deposits [33,34].

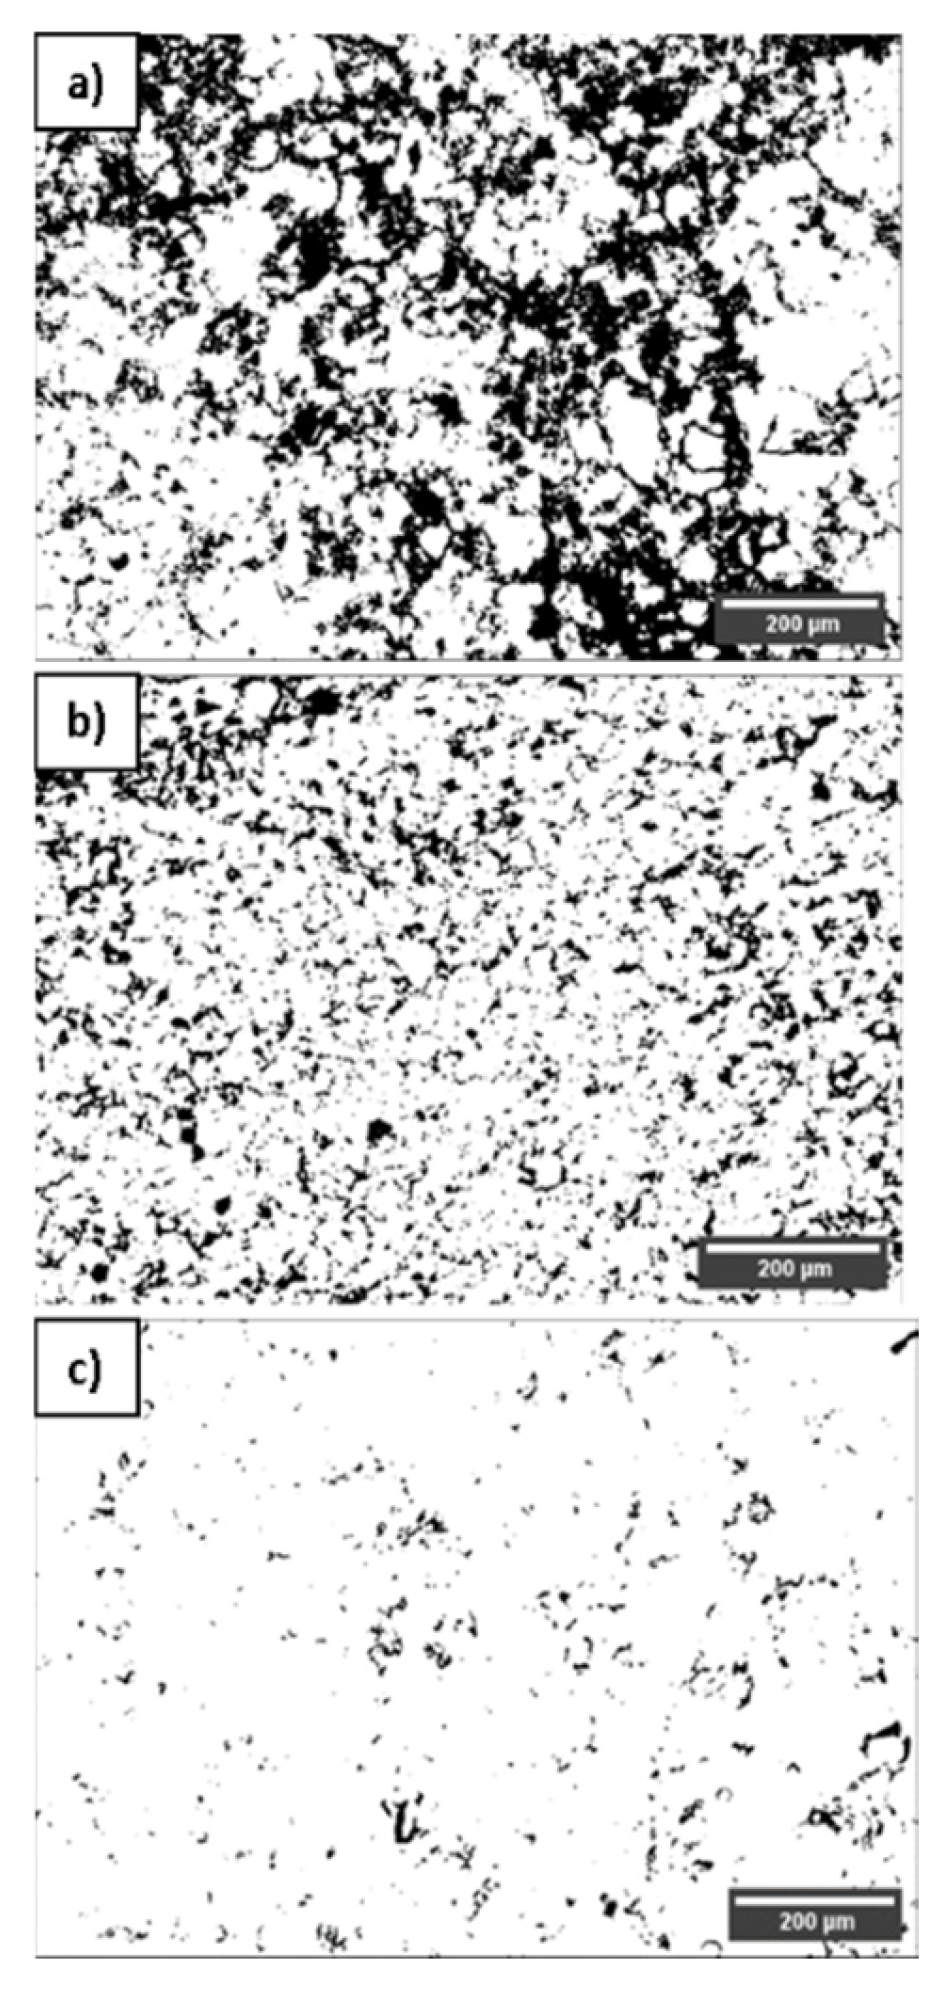
2.5.2. Structural and Textural Porosity

The methodology for obtaining detailed structural porosity is described in Torres-Guerrero et al. [36] and involved two complementary approaches. First, 28 thin sections from four sequences (ALM, PIL, GUI, and MEQ) were scanned with a high-definition Epson v750 Pro scanner using polarising filter films (ScreenTech®, Seelze, Germany) under XPL and CPL light sources. Images were captured at a resolution of 22.69 µm pixel−1 with a 24-bit RGB colour depth. Next, high-resolution mosaics (1.25 µm pixel−1) were constructed following the methodology proposed by Gutiérrez-Castonera et al. [59]. For this purpose, 77–84 sequential microphotographs with CPL were obtained in each thin section, using a Canon T3i SLR camera attached to an Olympus BX51 petrographic microscope (4× magnification objective). The mosaics were processed and aligned in ArcGIS 10.3 (ESRI, 2015) with colour and geometry enhancements in ERDAS Imagine 2014 software and were rectified with AutoCAD 2010. Porosity analysis followed the protocol described in Torres-Guerrero et al. [36], which included binarisation and enhancement of XPL and CPL images with Fiji-ImageJ software 64-bit Windows [60]. Logical operations excluded opaque grains, allowing the quantification of pores using the Quantim4 algorithm [61]. The pores (30–2000 µm) were classified by equivalent diameter [62] and origin [63], and morphological parameters (roundness and roughness) were calculated.
Supervised classification applied in ERDAS Imagine showed high accuracy as assessed by the kappa-Cohen index [64]. This microstructural analysis aided the digital analysis of pore structures in thin sections of loess [65].
The methodology for analysing textural porosity is detailed in Torres-Guerrero et al. [36]. Backscattered electron backscattered imaging (BESI) was used to obtain high-quality, high-contrast images of the sample components [66,67], which facilitated the generation of masks for porosity analysis. The obtained BESI images were cleaned, cropped, and selected features of interest (FOI: micromass, mineral grains, and pores), followed by supervised classification using the Trainable Weka Segmentation plugin in ImageJ software 64-bit Windows (created by Wayne Rasband at the US National Institutes of Health). Pore masks were subsequently refined and processed in Fiji-ImageJ to quantify parameters including area, perimeter, and roundness. Pores were classified according to their equivalent diameter into micropores (<2 µm), small (2–5 µm), medium (5–20 µm), large (20–50 µm), and extra-large (>50 µm) [62]. Finally, the number of pores and their relative percentage area were quantified.

2.5.3. Study of Secondary Carbonate Accumulations

The study of secondary carbonate accumulations was carried out by observation at different scales (macro and micro). Classifying them according to the terminology proposed by Barta [68] and Stoops [44], respectively. A special type of biocalcification called ‘quera’ [69] was studied in depth.
Radiocarbon dating of a carbonate-cemented horizon (Bkm: at approx. 200 cm in depth) in the Bescanó sequence (BSC—470 cm in thickness) was performed at the Poznań Radiocarbon Laboratory, with ages calculated at 68.3% and 95.4% probability and calibrated using OxCal v4.4.2 software, based on atmospheric data from Reimer et al. [70].

2.5.4. Study of a Type of Biocalcification, “Queras”

For the study of queras, six LPS from the Ebro Basin and one from Bescanó (Girona) were selected. The queras were separated by wet sieving (100 µm), air-dried, and cleaned with acetic acid (pH 5). Final particles (100–250 µm) were manually sorted under a magnifying glass for morphological and isotopic studies. Detailed methodology is provided in Álvarez et al. [37].

Morphological and Micromorphological Analysis of Queras

For the morphological study, 20 quera fragments from various horizons were selected and photographed at macro and micro scales using a Canon® T3i camera (Canon EOS 1100D, Tokio, Japan) and an Olympus® SZX16 stereoscope (Hachioji, Tokyo, Japan). The images were processed in Fiji-ImageJ [60] and converted to greyscale. The measured parameters included Feret’s length, perimeter, thickness, and Feret’s diameter [71], and an ANOVA (XLSTAT) statistical analysis was applied. Additionally, seven thin sections were analysed using cathodoluminescence microscopy to investigate the pedogenetic origin of calcite, because from their optical characteristics it is possible to determine if the origin of the calcite is biogenic or not [72].

Radiocarbon Dating and Isotopic Composition of Queras

The quera fractions were radiocarbon-dated using AMS on hydrogen-reduced CO2 graphite from sample combustion at 800 °C in oxygen. Results (‘BP’ or ‘pMC’) were calibrated with IntCal13 [73] and δ13C-corrected. δ13C and δ18O isotopes were measured by IRMS (Beta Analytics©, Madrid, Spain), with δ18O values processed to infer soil water temperatures [37,74,75].

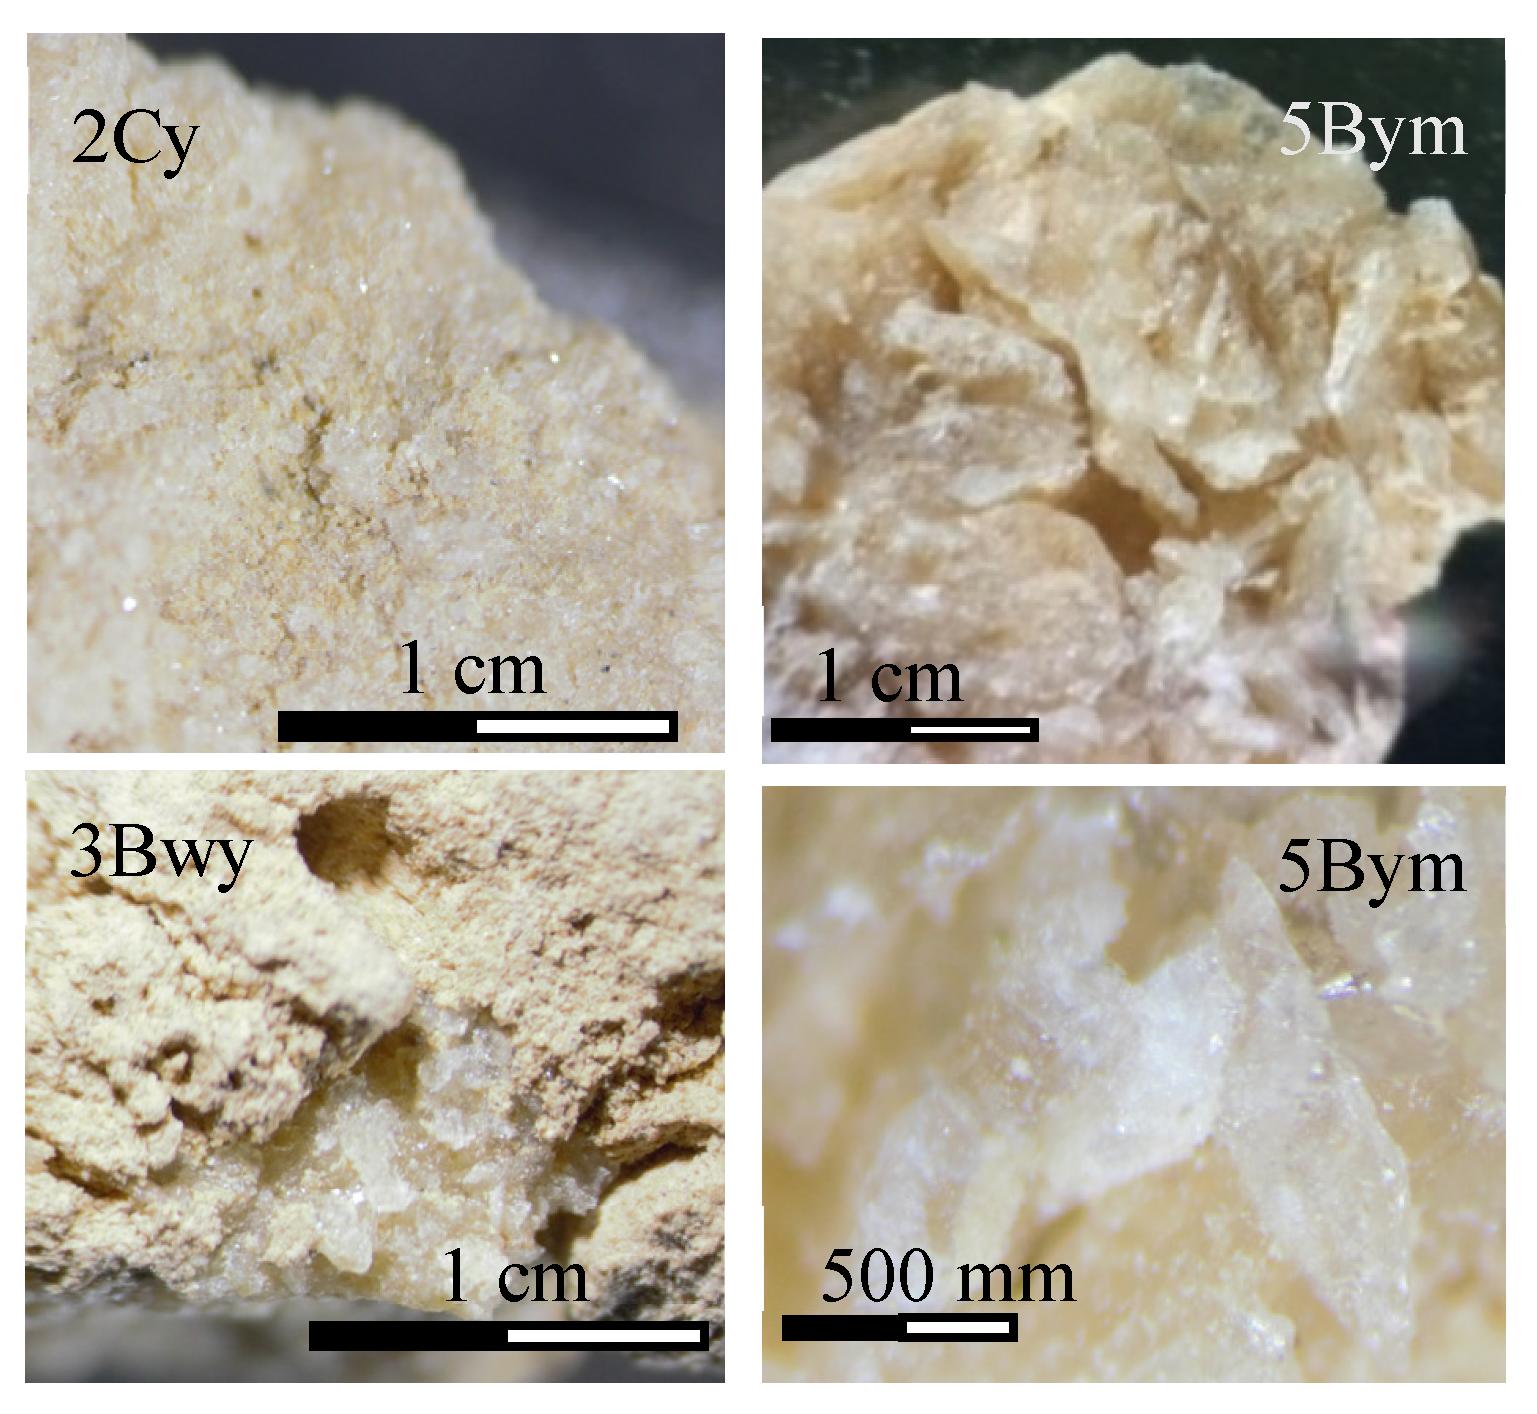
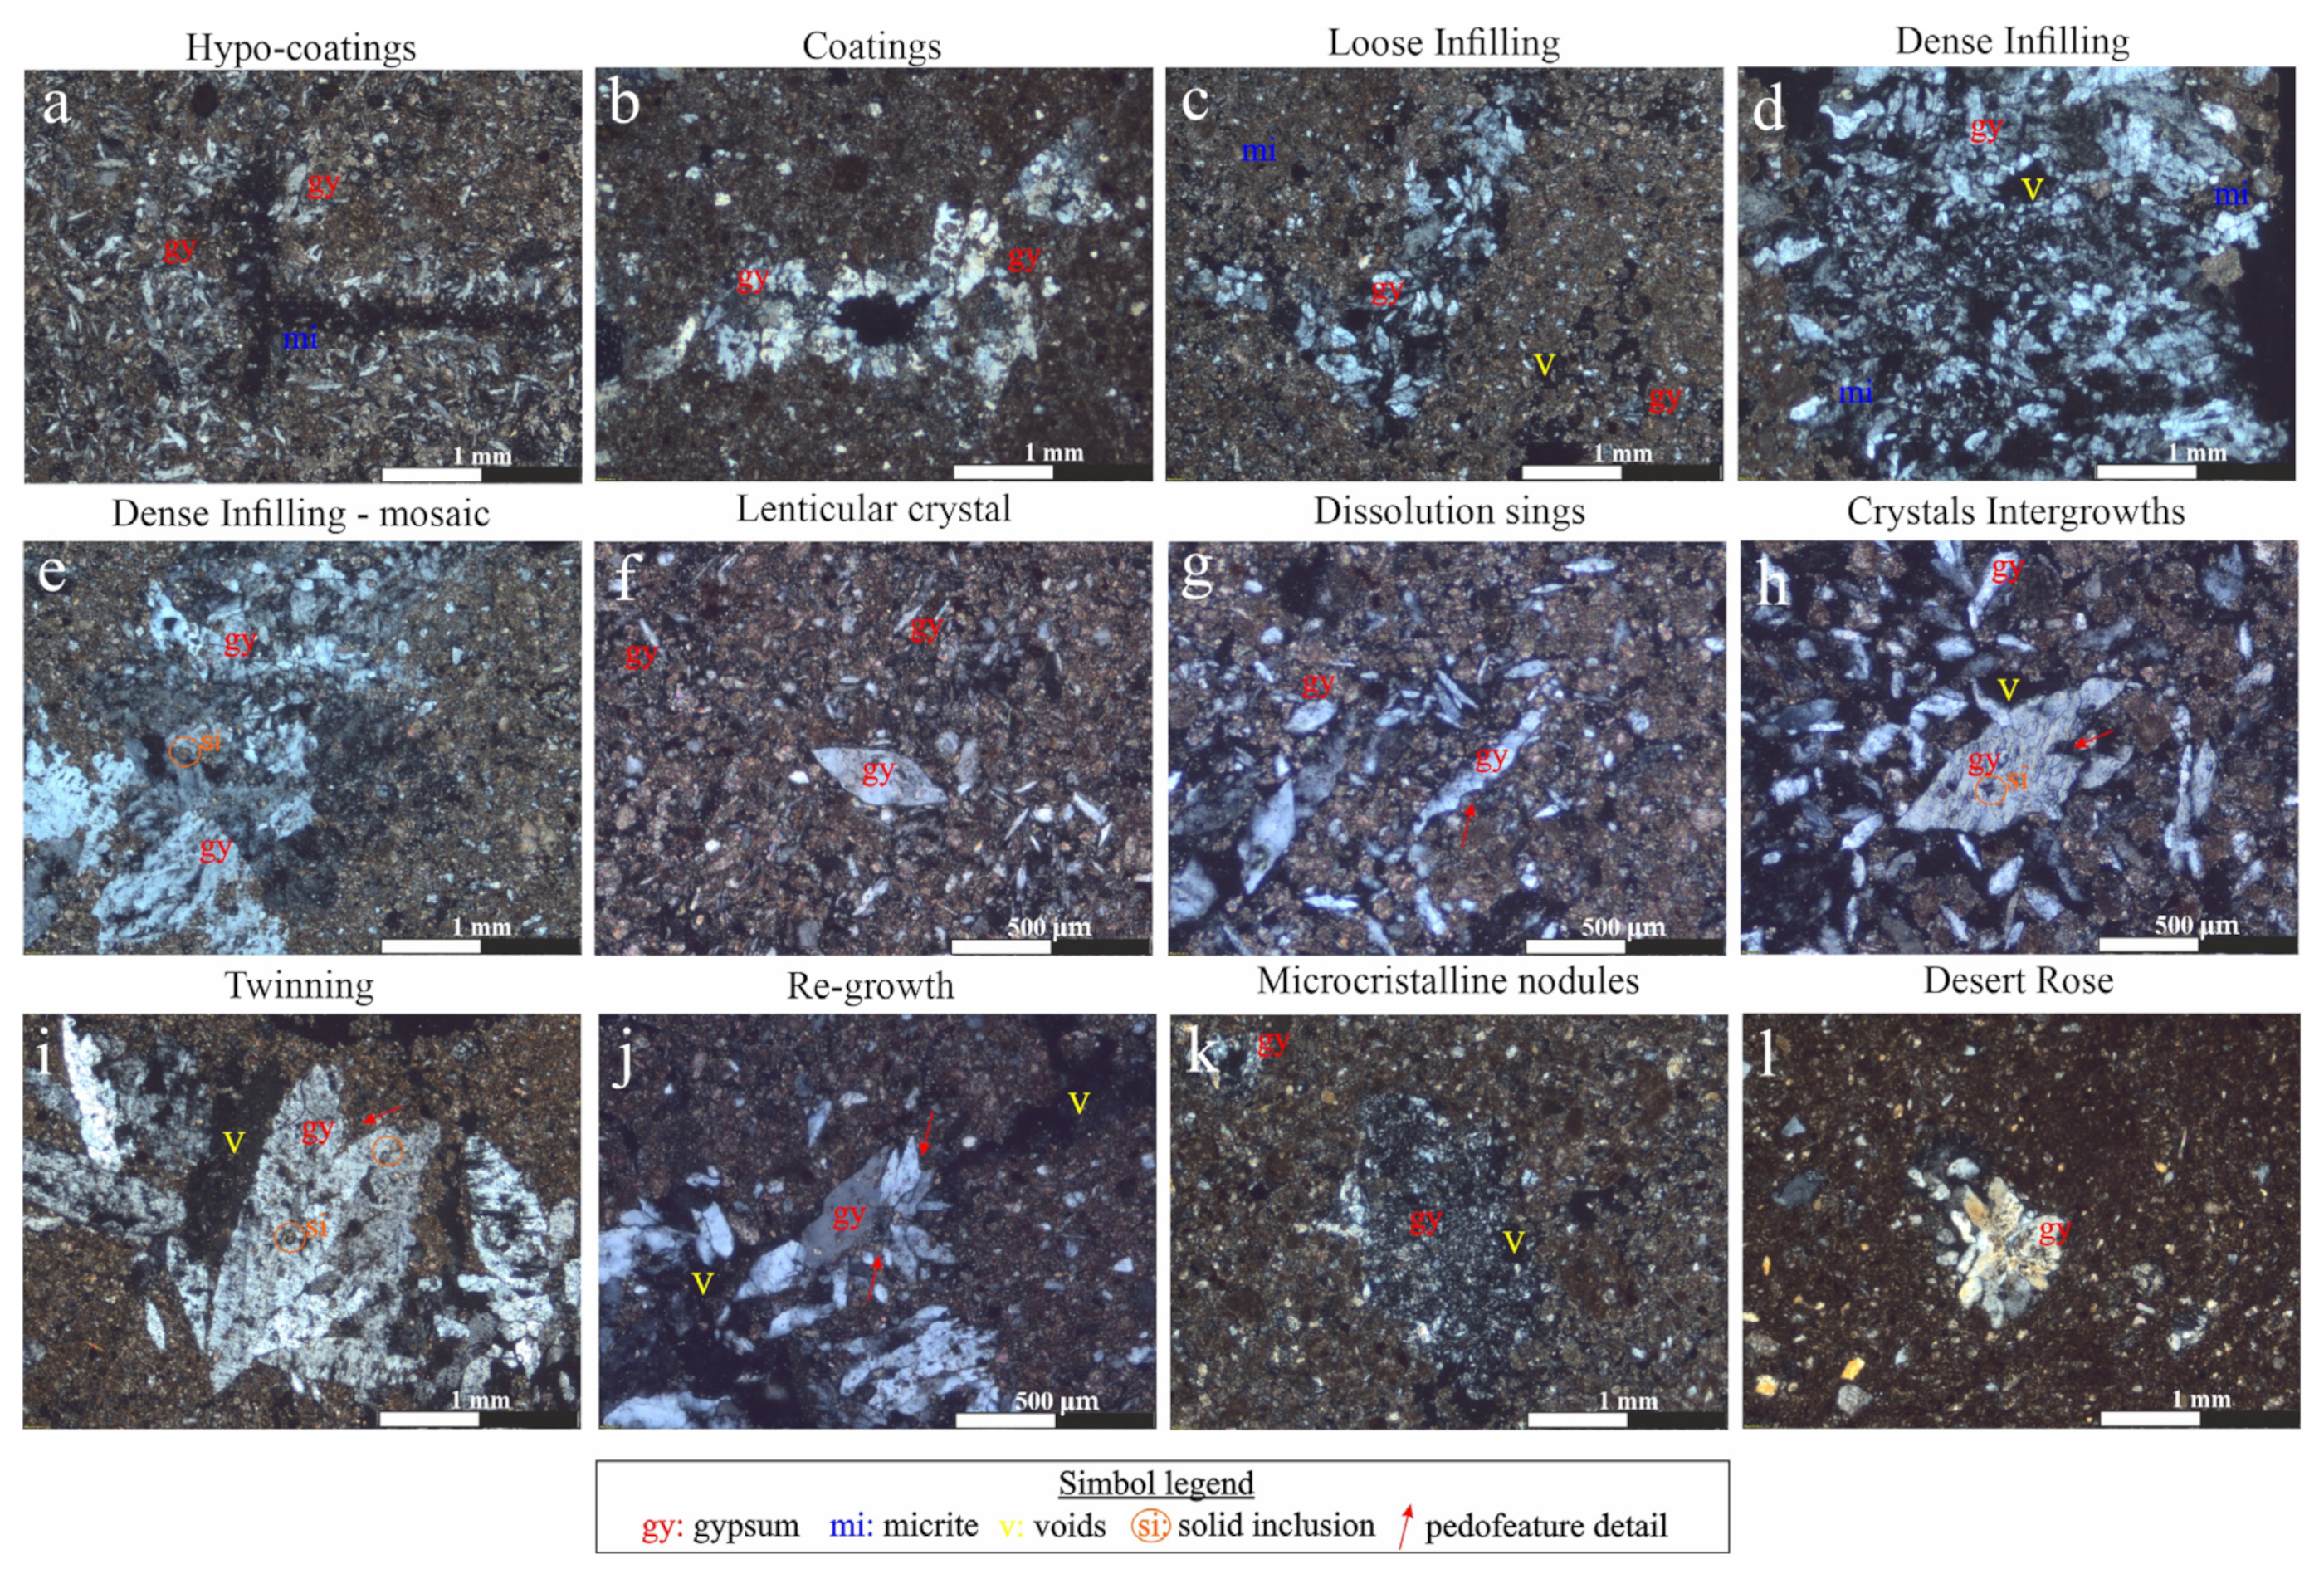
2.5.5. Pedogenic Gypsum Accumulations

Five sequences (MEQ, AGR, FAY, CHI, and BAT) located in the Ebro Basin were selected for the study of pedogenic gypsum. All sequences had been previously analysed in terms of distribution and origins of the material [31,33,35]. The LPS were described and sampled following the guidelines of SINEDARES [40]. Thin sections were analysed and described using an Olympus BX51 petrographic microscope, combining different magnifications and light sources (PPL and XPL), in accordance with the guidelines of Stoops et al. [44] and comparing observed morphologies with previous investigations [68,76].

Isotope Analysis of Sulphate (δ34S and δ18O) and of Hydration Water of Gypsum (δ2H and δ18O)

To analyse gypsum sulphate, large gypsum crystals were manually cleaned, ground, and dissolved in ultrapure water to produce BaSO4 via 5% BaCl2 precipitation, then washed and dried at 110 °C. BaSO4 isotopic compositions (δ34S and δ18O) were analysed using EA-IRMS (Delta Plus XP, Thermofisher, Barcelona, Sapin) and TC/EA-IRMS, referenced to CDT and V-SMOW, respectively. Standards calibrated against NBS-127 ensured reproducibility of 0.1‰ for δ34S and 0.2–0.4‰ for δ18O. Hydration water isotopes (δ2H and δ18O) were analysed via CT/EA-IRMS with reproducibility matching Rohrssen et al. [77]. Fractionation coefficients [78] showed gypsum water enriched in 18O (+3.4‰) and depleted in 2H (−19‰) compared to meteoric water. δ2H-δ18O was calculated relative to the Global Meteoric Water Line [79], with d-excess deviations evaluated. For further details about the methodology applied, see Álvarez et al. [38].

Minor and Trace Elements of Pedogenic Gypsum

Minor and trace elements (Na, Mg, K, Sr, and Ba) were analysed using ICP-MS (Agilent 7700X, The Woodlands, TX, USA) after microwave digestion (Ethos Up, Millestone, Sorisole, Italy) with HNO3, H2O2, and Milli-Q water. Strontium values were compared via linear regression with soil carbonate and gypsum. See detailed methodology in Álvarez et al. [38].

3. Results

The results presented in this section have mostly been previously published [31,33,34,35,36,37,38]. Therefore, only the main characteristics will be highlighted, and tables and figures with the most representative and new values will be added.

3.1. General Characterisation

3.1.1. Morphological Descriptions

To facilitate detailed descriptions of primary loess sequences, observations and sampling were conducted primarily in the summit zones of slopes or on structural platforms. The depth of the sequences varies significantly; however, most extend to at least 300 centimetres (Figure 2). In certain cases, it was not possible to describe the full depth of the sequence due to insufficient equipment to allow further excavation.
In terms of the structure observed in the field, subangular blocks of varying dimensions are the most common. However, some profiles feature horizons with a crumb structure (VIL1, VIL2, and MAE) or a granular structure (PIL, ALM, BB, EC, and BSC). Massive horizons without a defined structure are also frequently encountered (TIV2, ALM, ALE1, FAY, MAE, and MEQ). Notably, two sequences stand out for their bottom horizons with a laminar structure (VIL2 and EC), a feature uncommon in loess deposits. It is also worth noting that certain biogenic structures have been associated with the presence of cicadas (Cicadoidea), as observed in OMS, ALE1, ALE2, and EC. Most of the sequences exhibit yellowish hues (10YR and 7.5YR).
However, in some areas, redder hues are observed (5YR and 2.5YR), including deep red ones (BSC-10R), which are primarily associated with a higher iron content. Additionally, the bottom horizons of certain sequences, such as MAE, VIL2, and ALE2, display colour variations influenced by the underlying (non-loessic) material.
The pedogenic development of the LPS in the Ebro Valley has been predominantly linked to the translocation of carbonates, as noted by Boixadera et al. [31] and Álvarez et al. [37]. This process results in various types of secondary CaCO3 accumulations, including pseudomycelia, nodules, rhizocretions, and “quera”. Sequences rich in gypsum (PIL, FAY, CHI, BAT, MEQ, ALM, and AGR) exhibit diverse forms of pedogenic gypsum accumulations [38]. Lastly, features due to clay illuviation are uncommon in these loess sequences. They have only been identified in certain deep within the VIL1, VIL2, ALE1, and BSC profiles [35,37].

3.1.2. Physical and Chemical Analyses

The general physical and chemical characteristics of most of the LPS studied indicate loam, silt loam, and sandy loam textures. Exceptions include some sequences (VIL, BSC, and CHI), which exhibit clay loam textures in certain horizons [31,35,37]. The pH values are basic (7.8–8.8), and electrical conductivity varies depending on the presence of gypsum, with gypsum-rich horizons yielding higher values (EC1:5 > 2 dS/m at 25 °C). Organic carbon (OC) levels are generally low (<0.5%), showing a decreasing trend with depth and age except in the BB sequence, where a buried A horizon leads to a localised increase in OC. All the sequences are calcareous, with CaCO3 equivalent contents ranging from 21% to 60%, displaying irregular trends with depth within each sequence, except Bescanó, where variable parent materials and its association with climatic conditions that promoted a more intense carbonate leaching and clay illuviation result in a greater variability in carbonate content (3–35%). The presence of pedogenic gypsum shows a certain correlation with CaCO3 but is not ubiquitous among the studied LPS. The sequences MEQ, PIL, BAT, and AGR contain the highest gypsum levels, reflecting differences in parent material composition and proximity to the source area [31,33,34,36,37,38].

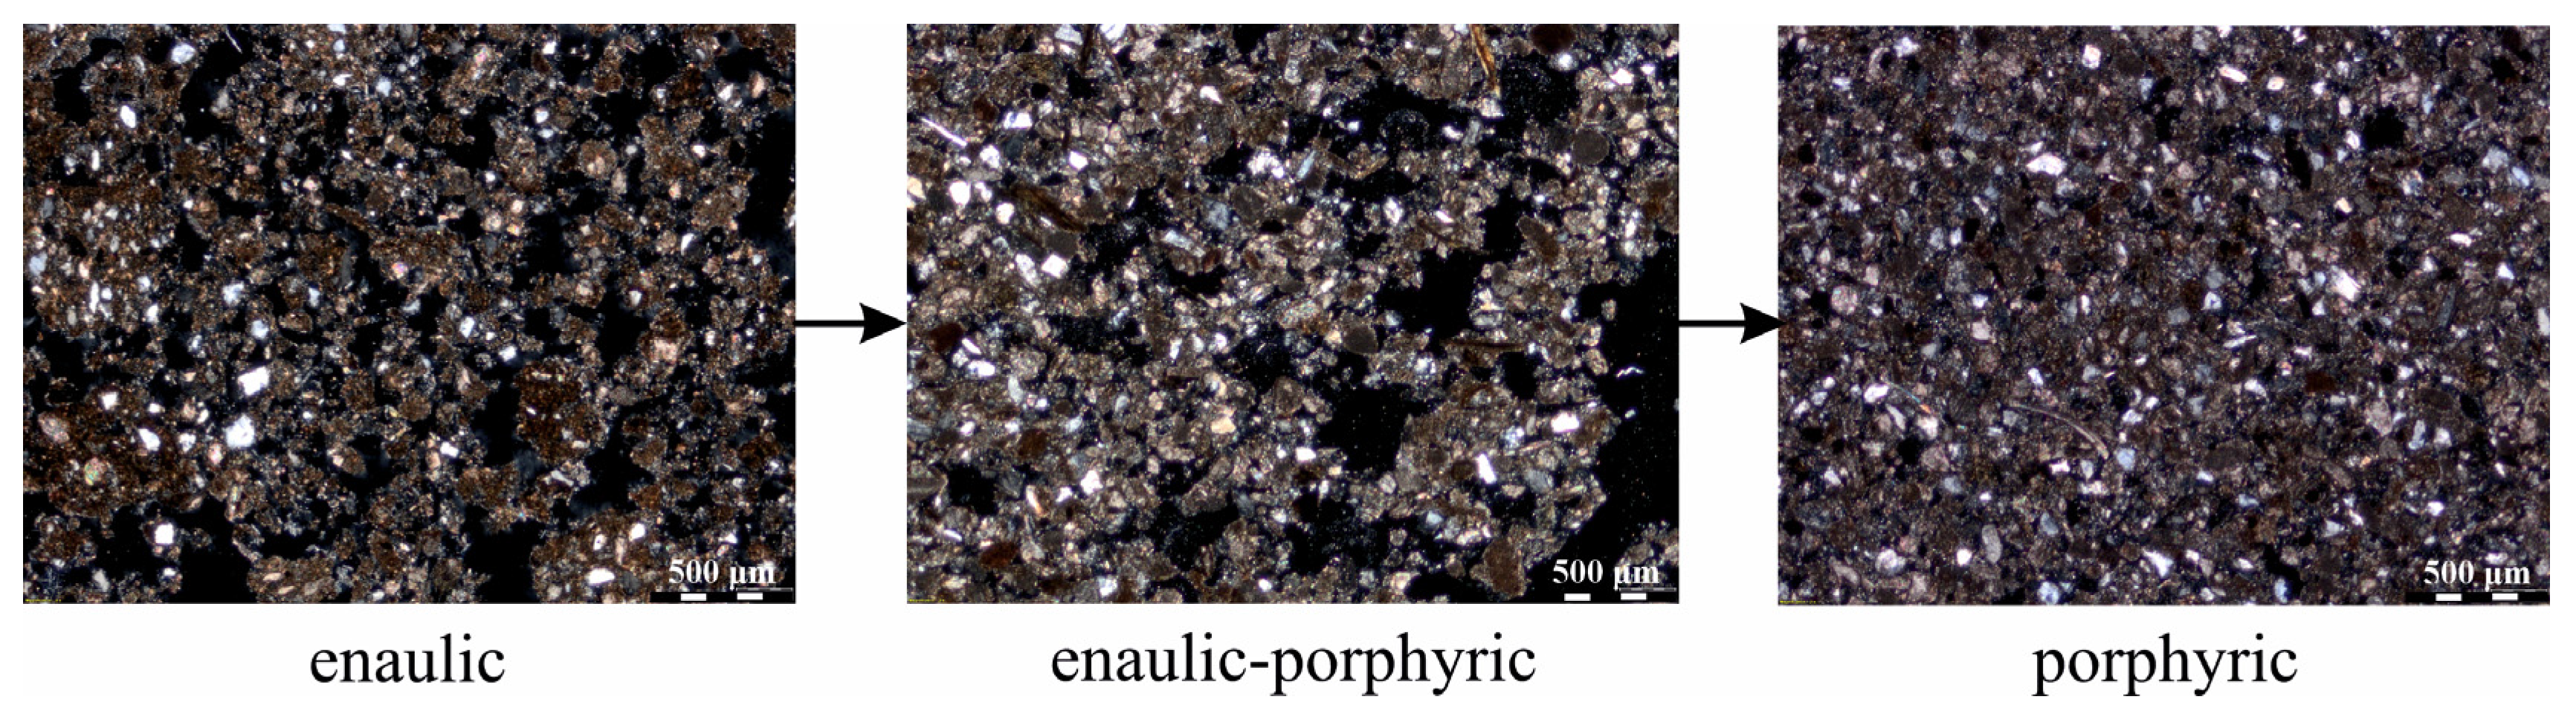
3.1.3. Micromorphological Characterisation

Micromorphological analysis reveals a predominantly apedal microstructure with 10–30% porosity, dominated by compound packing voids, channels, chambers, planar voids, vesicles, and moldic vughs, linked to biological activity and gypsum dissolution [36]. Subrounded quartz dominates the coarse fraction, alongside feldspars, micas, pyroxenes, and limestone fragments. In gypsum-rich profiles, lenticular gypsum crystals contribute mineralogically, distinct from typical European loess. The micromass is mainly calcitic with a crystallitic b-fabric; reddish hues appear in clay-rich horizons due to rubefaction and clay illuviation. Most sequences show a single-spaced enaulic to porphyric c/f distribution, reflecting loess pedogenesis and providing insights into depositional and pedogenic processes [37].

3.1.4. Dating of the Loess–Palaeosol Sequences

The ages of the deposits dated using OSL and pIR-250 methods (Figure 2) have been previously published [31,35,36,37,38]. The unpublished sequences (BB, EC, and OMS) were all dated using OSL, with ages ranging from 6 ka to 22 ka (Table 1).

3.2. Study of Porosity

3.2.1. Structural Porosity: Scanned Images and High-Resolution Mosaics

Scanned images (22.69 µm pixel−1 resolution) limited quantification to pores > 100 µm equivalent pore diameter (EPD). Porosity values from scanned images exceeded those from mosaics in 78% of cases. In the ALM profile, structural porosity decreased with depth, peaking at Bwkcδ1 (65–90 cm) and 3Byc1 (410 cm). The PIL profile showed irregular trends, with maxima of 12–14% at 150–250 cm, excluding the Ap2 horizon. The MEQ profile exhibited porosity peaks at 12% and 13% at 70–85 cm and 405–415 cm, respectively, linked to bioturbation [63]. Median porosity ranged from 5% in ALM and MEQ profiles to 8% in PIL [36].
High-resolution mosaics (1.25 µm pixel−1) yielded lower porosity values due to better pore segmentation, effectively quantifying pores with EPD > 3 µm (Figure 3). However, a wedge effect in thin sections caused underestimation of transparent components, including pore space [44]. Mosaics enabled isolation of pores, micromass, and coarse minerals, revealing relationships between porosity and gypsum infillings. Average porosity was highest in PIL (8%), followed by ALM (6%) and GUI (5%). Supervised classifications indicated higher calcitic micromass in PIL ( x ¯ = 68%) than in ALM ( x ¯ = 63%) [36]. Bioporosity, calculated following Sauzet et al. [63], was highest in PIL (roots x ¯ = 3%, earthworms x ¯ = 2%) and lower in ALM (roots x ¯ = 2%, earthworms x ¯ = 1%). Overall, bioporosity did not exceed 5%, except in the PIL Ap2 horizon. Micromorphological analysis suggested that gypsum infillings occupied pre-existing faunal pores [80].

3.2.2. Textural Porosity

Backscattered electron scanning images (BESI) of the ALM, PIL, and GUI profiles examined textural porosity in 15 horizons, showing higher porosity values than thin sections due to the surface-based measurement method [36]. BESI highlighted transitions from enaulic packing pores to porphyric structures, reflecting compaction and micritic/marly silt aggregate collapse. Intermediate stages at varying depths and ages indicated progressive porosity reduction, embedding mineral grains in a porphyric c/f-related distribution. Residual star-shaped vughs from original aggregates persisted in less porous zones, aligning with micromorphological descriptions and highlighting compaction effects on the loess–palaeosol sequences (Figure 3).

3.3. Secondary Carbonate Accumulations

All the analysed sequences exhibit evidence of carbonate translocation, manifested as secondary carbonate accumulations. Pseudomycelia, nodules, and rhizoconcretions (as loess dolls) are predominant, reaching Machette stage II [81,82]. The latter can form cemented horizons by coalescence, as seen in a Bkm horizon of the BSC sequence (Machette stage III [81,82]). The radiocarbon age of this petrocalcic horizon with a 95.4% calibration was 23,161 years (cal BC) (14C age without calibration = 20,550 ± 130), indicating a rapid evolution (Figure 4) compared with the limited carbonate mobilisation in the same period for the rest of the sequences.

3.3.1. Study of a Type of Biocalcifications, Called “Queras”

Queras are a specific type of pedofeature, resulting from the biocalcification of apical root cells. Queras are a common feature in nearly all the studied sequences. The distribution of these accumulations is heterogeneous and appears to show an inverse relationship with pedogenic gypsum accumulations in sequences where gypsum is present. However, queras occur independently of the presence of gypsum in the profile.

Morphological Analysis and Micromorphology Descriptions of Queras

Quera biocalcifications were found at varying depths in seven loess–palaeosol profiles [37]. The 64% were within the first 200 cm, 29% between 200 and 400 cm, and 7% below 400 cm. Most were visible to the naked eye, white in colour (10YR 8/1), except in the Bescanó profile, where calcite coatings caused a reddish hue. The complete quera fragments are similar in morphology and colour. They are formed by biosparite granules, of vegetal origin, with a behaviour different from non-biogenic calcite under cathodoluminescence, disposed concentrically with a central channel, similar to a small corn cob (Figure 5). ANOVA results show minor statistically significant differences between profiles [37].

Radiocarbon Dating and Isotopic Composition

Radiocarbon dating of the queras ranges from less than 2000 years to over 43,500 years old, correlating with four distinct MIS periods: MIS1 (<14 ka), MIS2 (14–29 ka), MIS2-MIS3 boundary (27–30 ka), and MIS3 (29–57 ka). Isotopic values of the carbonate components were δ13C: −12.7‰ to −5.1‰ and δ18O: −6.9‰ to −4.2‰ (± 0.3‰ uncertainty). Those of C indicate that these calcifications were achieved most probably by C3 plants. Temperatures extrapolated from Dworkin et al. [74] range from 11.7 °C to 17.2 °C. No significant correlations were found between isotopic compositions, depth, age, and temperature formation [37], which indicates a formation rather independent of environmental conditions.

3.4. Study of Pedogenic Gypsum with Different Techniques

3.4.1. Morphological and Micromorphological Description of Pedogenic Gypsum Accumulations

Gypsum crystals range in size from <50 µm to ±1 cm, with the largest found in the Mequinenza petrogypsic horizon (5Bym). Crystal morphologies are mainly lenticular, with some prismatic shapes. They are intergrown in the micromass, often showing twinning, inclusions, and dissolution signs (Figure 6).
The most common pedofeatures are loose infillings, with some dense infillings displaying xenotopic fabrics, forming mosaic-like crystal arrangements. Coatings and gypsum hypocoatings, often overlaid with micrite, are present in the Mequinenza, Fayón, and Agramunt sequences. Gypsum nodules, either microcrystalline or desert rose-shaped, are unevenly distributed and sometimes indistinguishable from dense infillings. The observed morphologies and pedofeatures do not vary by location but reflect the processes and conditions experienced during their evolution (Figure 7) (Table 1, [38]).

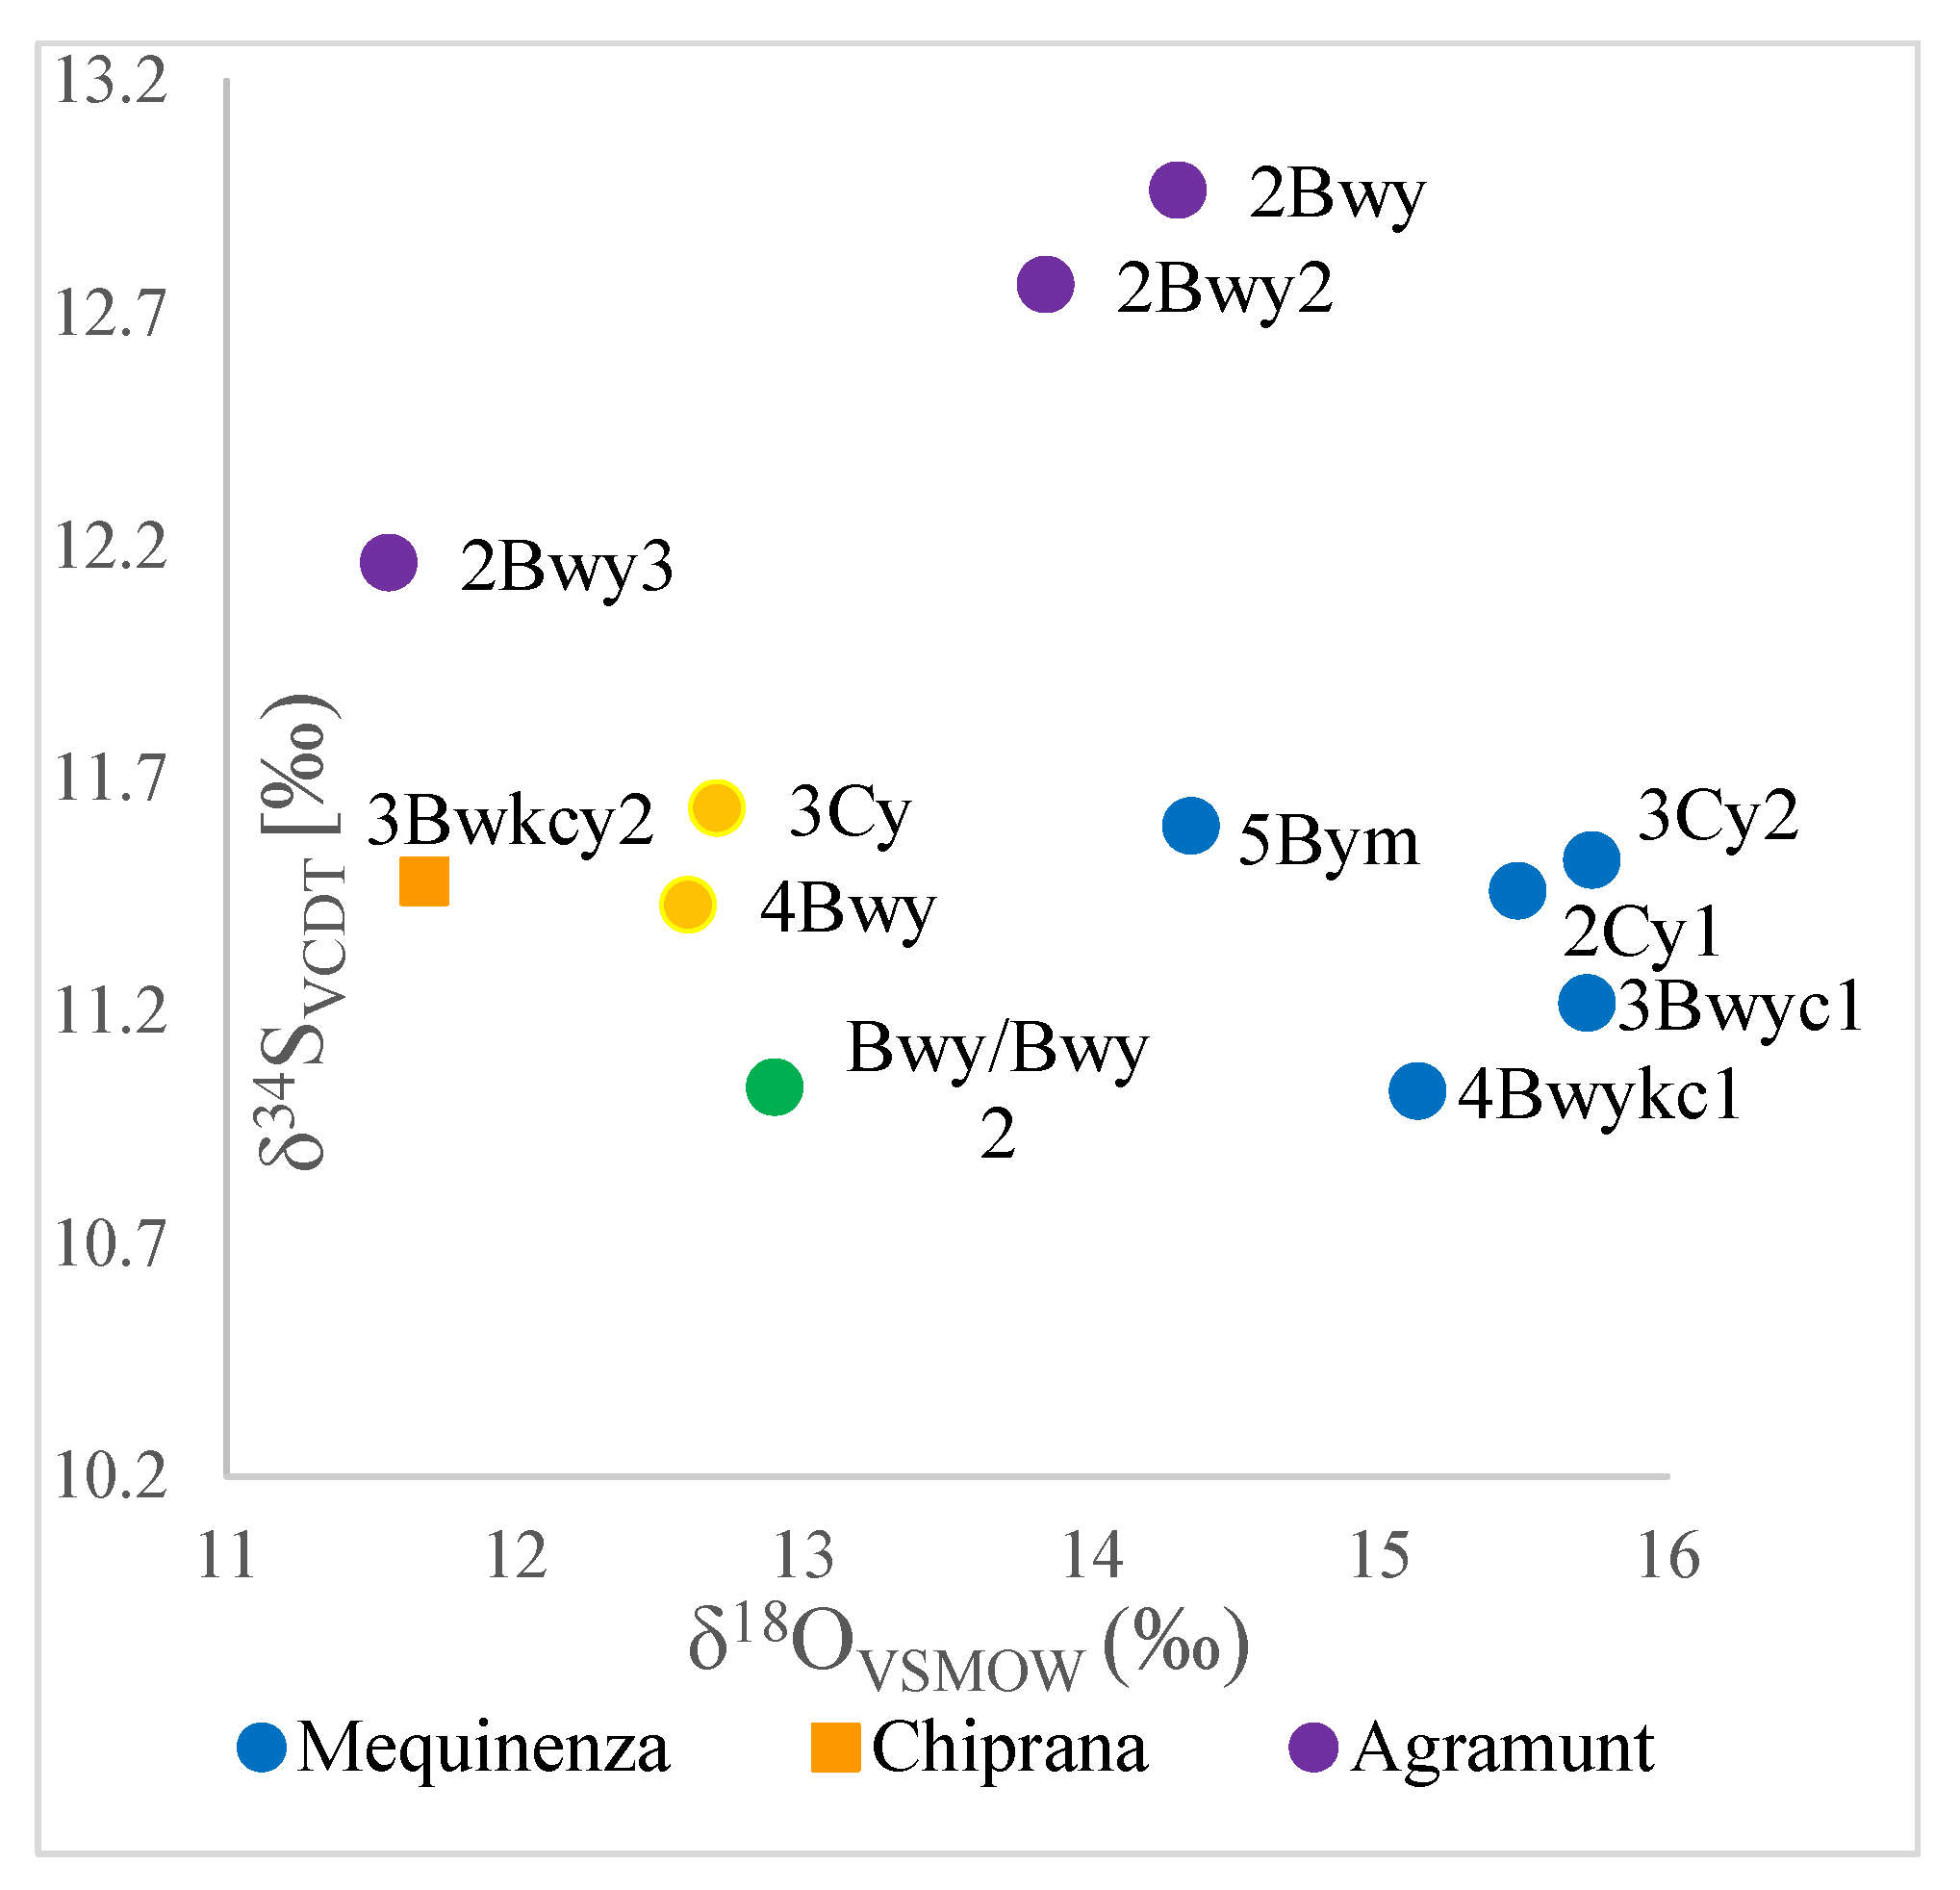
3.4.2. Sulphate Isotopic Analysis of Gypsum (δ34S and δ18O)

Gypsum sulphate isotopic values range from 11.0 to 13.0‰ for δ34S and from 11.6 to 15.7‰ for δ18O. The Agramunt profile shows higher δ34S values, while Mequinenza has higher δ18O. Isotopic signatures cluster by profile, particularly Fayón, Mequinenza, and Agramunt (Figure 8). The isotopic behaviour varies across profiles: Mequinenza shows an irregular trend with peaks linked to genetic discordances, while Agramunt displays a decreasing trend with more depleted values at greater depths.

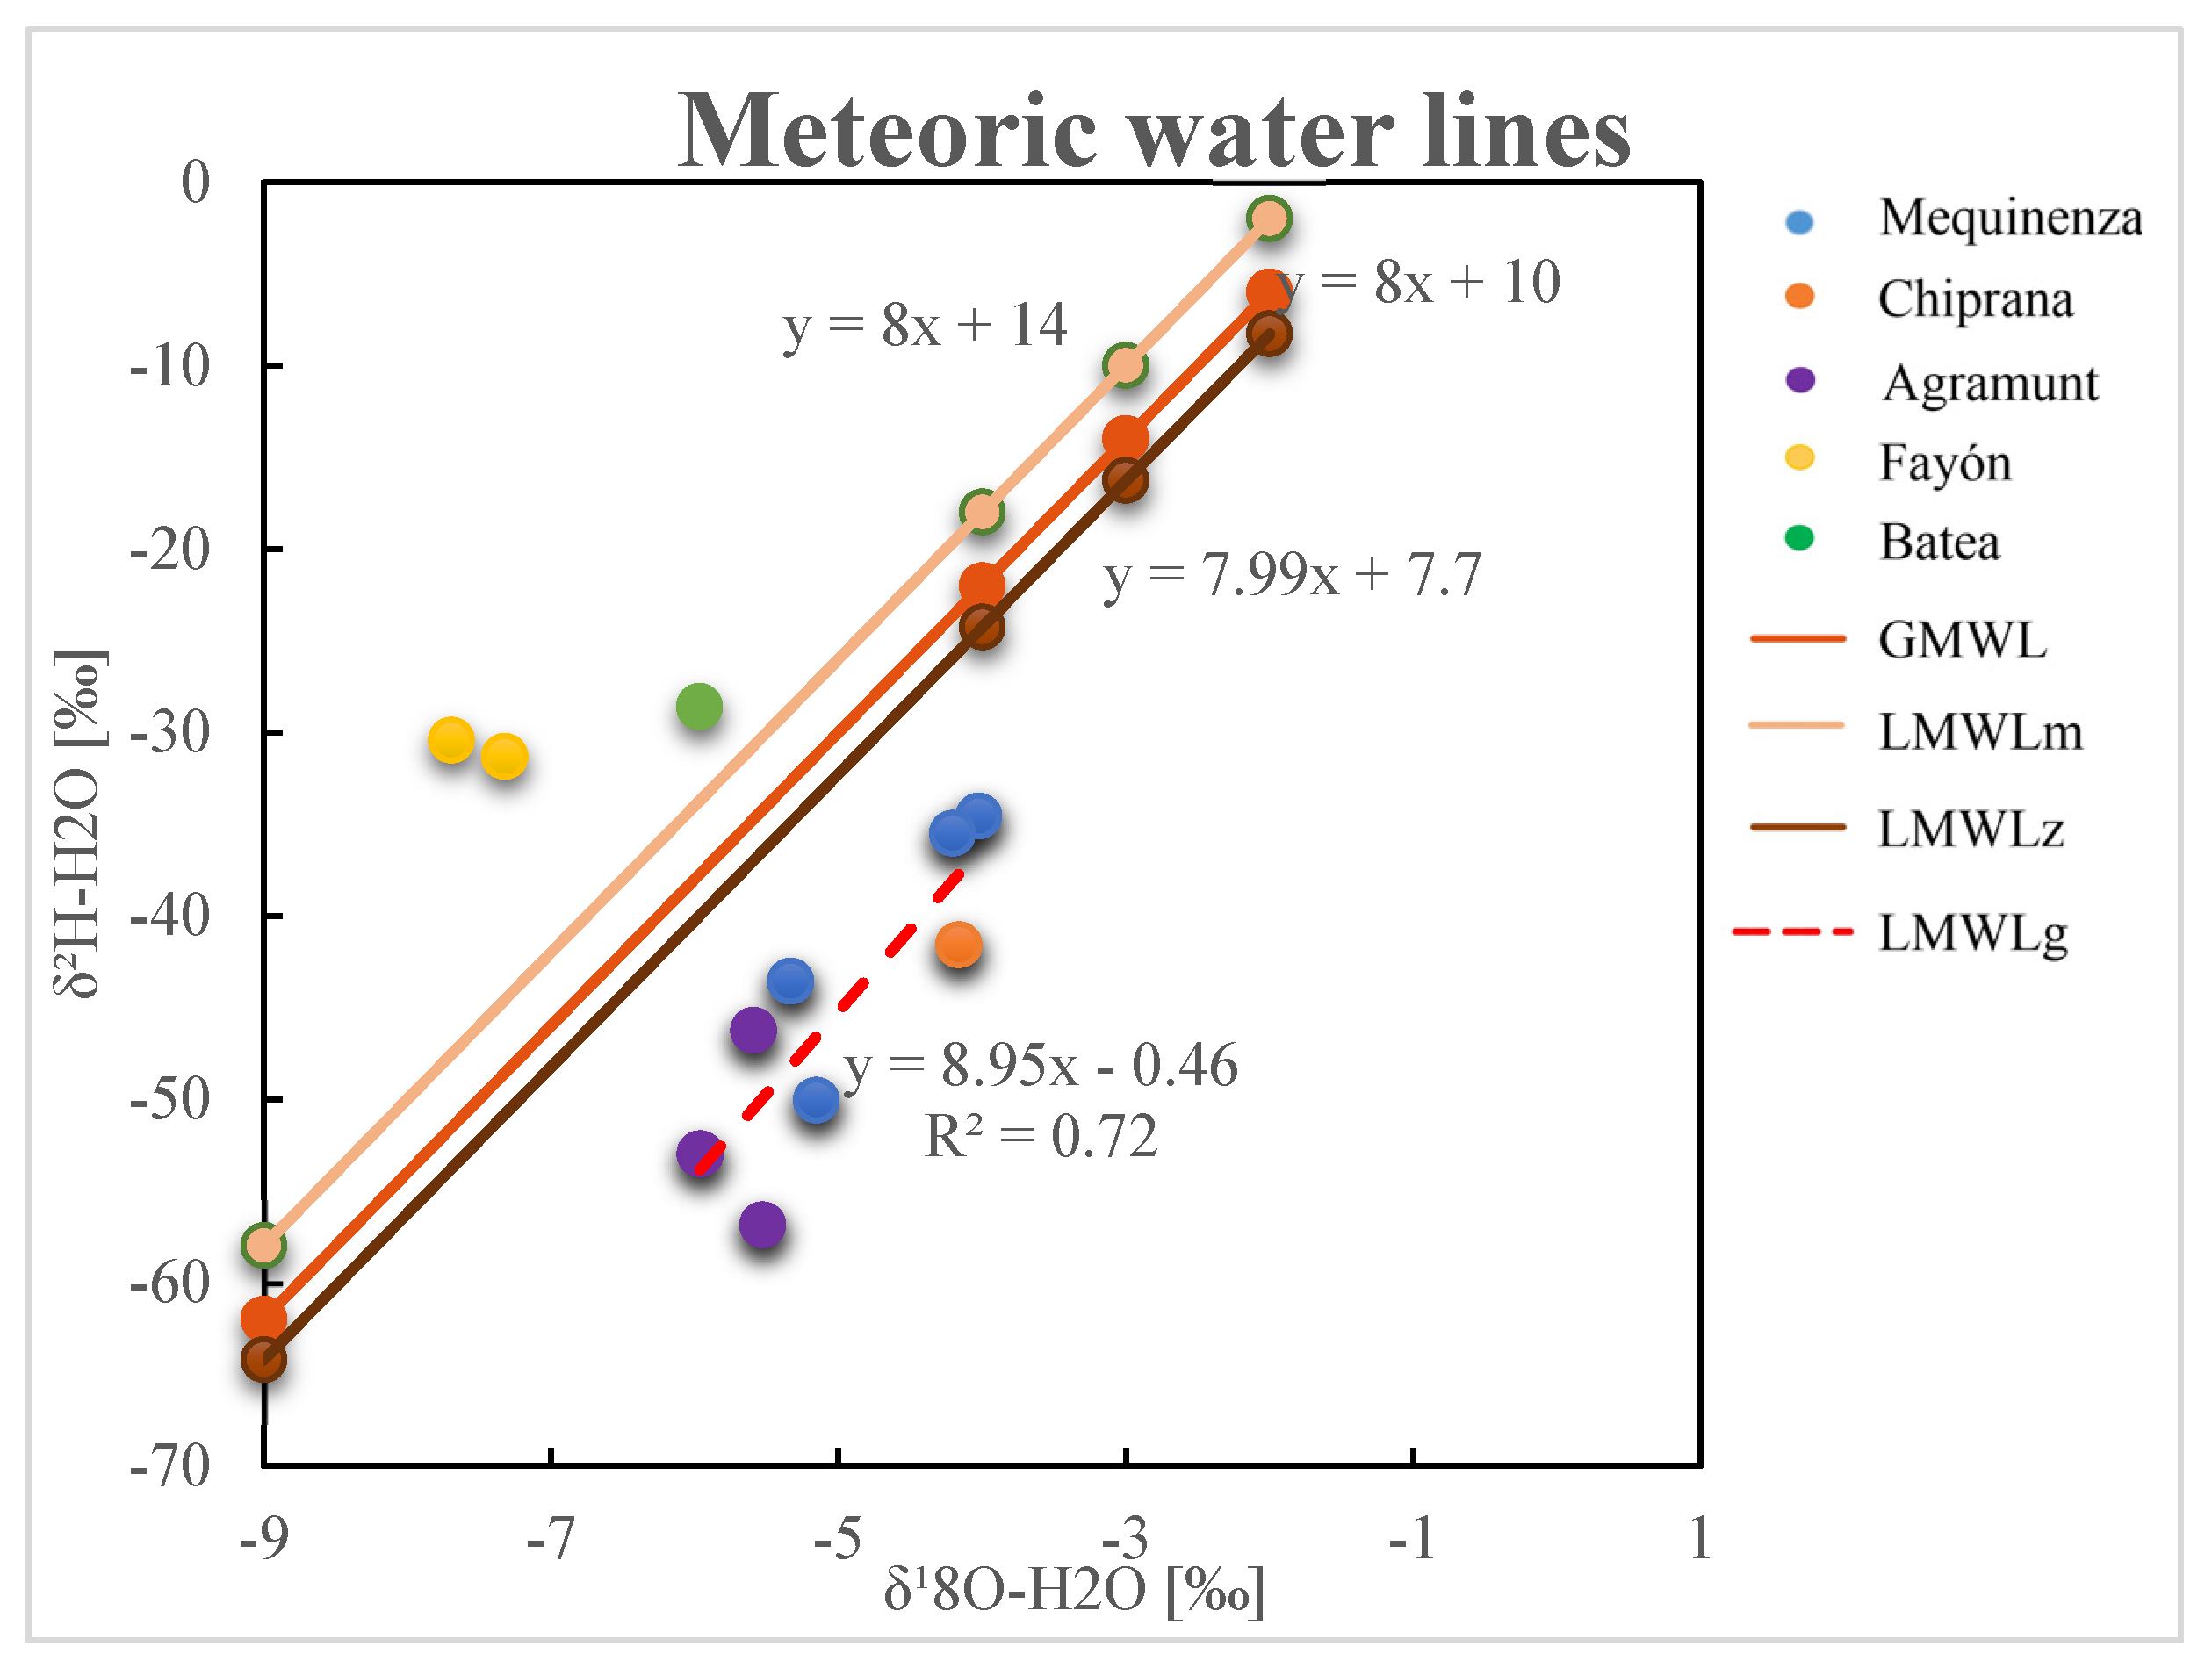
3.4.3. Isotopic Analysis of Gypsum Hydration Water (δ18O and δ2H)

The δ18O values of gypsum hydration water ranges from −4.3‰ to −0.6‰, and δ2H values range from −75.9‰ to −47.6‰ [38]. These values show greater variability than sulphate isotopes. Recalculated using fractionation coefficients of −19‰ for deuterium and +3.4‰ for oxygen [78], the original meteoric water composition was determined. The equation of the local meteoric water line for gypsum (LMWLg) was obtained as y = 8.95x − 0.46, with a confidence rate (R2) of 0.72 (Figure 9). The LMWLg shows no fractionation, as it is nearly parallel to the global meteoric water line (GMWL) and other local lines (Figure 9).

3.4.4. Analysis of Trace Elements

The values from trace element concentrations (Na, Mg, K, Sr, and Ba) in the largest gypsum crystals from selected horizons [38]. The 2Cy horizon of MEQ exhibits the highest concentrations of Na, Mg, and K, while the lowest values (below 400 ppm) are found in the 2Bwy horizon of FAY. Strontium (Sr) concentrations reach their maximum in the Bwy/Bwy2 horizon of BAT (20,295 ppm, a value associated with celestine presence), with the lowest value (389 ppm) observed in the 3Cy horizon of FAY. Barium (Ba) concentrations are generally low (<100 ppm), with the highest value (87 ppm) in the 2Bwy horizon of AGR and the lowest (7 ppm) in the 4Bwy horizon of FAY. The elevated Sr concentrations in BAT (>20,000 ppm) correlate with higher levels of Na, Mg, and K. Linear regression analysis (excluding values > 1000 ppm) reveals a negative correlation between CaCO3 eq. (%) and gypsum (%) and a weak positive correlation between Sr and gypsum content.

4. Discussion

4.1. Common Features of the Loess–Palaeosol Sequences

The loess deposits in the Ebro River Valley Basin, Plana de Lleida, Sierra d’Almenara, and Girona (Figure 1) represent an important Quaternary record in the NE of the Iberian Peninsula. These deposits were formed by wind-transported sediments, primarily during the coldest phases of the Quaternary, and are distributed in discontinuous patches [31,33,34].
Their texture is mainly dominated by fine–coarse sand and varies with the type and distance from the source area as well as with the distribution and thickness of the deposits, depending in turn on the relief (geomorphology) and wind direction (from WNW to ESE). These factors allow deposits to be divided into groups depending on the source area, which have been reported in previous studies [31,33]. The coarse elements are consistent with typical loess [14], again related to source areas.
The ochre colour of most sequences is related to calcareous parent material. The reddish colour (MAS, CHI, and BSC) is related to the processes of carbonate dissolution, rubefaction and clay illuviation followed by successive erosion and sedimentation [35,83].
The carbonate-rich composition, according to the chemical analysis and the micromorphological observations, results in a basic–alkaline pH (8–9), common to all the sequences. This composition agrees with the source material of the loess, located in the middle and low terraces of the Ebro River (with calcareous materials in the watershed) and the Miocene substrates [31,33]. Depending on the age and stability of the sequence, these carbonates can be mobilised downwards.
Pedogenic gypsum, present in several of the sequences, is also associated with gypsum-rich source material in the Ebro Valley (Miocene and Eocene sediments), together with temporal saturation conditions in the profiles with water loaded with sulphates. Due to its solubility, the permanence of gypsum in the profile is mainly determined by equilibrium conditions between precipitation and evaporation and/or by the presence of a long-lasting water table [38]. The absence of gypsum in the sequences located in the Mora Basin is linked with a geographic barrier in the Catalan pre-coastal mountain range, acting as an aeolian barrier [33]. On the other hand, the absence of gypsum in the Bescanó profile is likely due to the lack of gypsum in the source area and to the higher precipitation.
Micromorphology highlights how biological activity is important in the development of the structure of these soils, creating apedal channel and chamber microstructures associated with the activity of soil fauna. Thanks to the detailed study of this microstructure through image analysis at different scales (structural porosity), it has been possible to identify peaks of bioporosity related to conditions of climatic stability and lower sedimentation rates [31].
The c/f (coarse/fine)-related distribution shows different degrees from enaulic to porphyric distribution (Figure 10), with a consequent decrease in pore space, which is related to the age of the deposition [31]. This evolution is associated with loessification processes, which in our case can be attributed to freeze–thaw cycles, diagenesis, carbonate and gypsum redistribution, disaggregation of calcilutitic aggregates, and overloading [84,85]. This process occurs within 40–20 ka (MIS 3-2) based on the dating of the deposits.

4.2. Distinct Pedofeatures: Rubefaction, Secondary Carbonate Accumulations, and Pedogenic Gypsum

Reddish colours (rubefaction), secondary carbonate accumulations in loess–paleosol sequences, as well as the presence of pedogenic gypsum accumulations, are key components for reconstructing the palaeoenvironmental conditions of the area.
The mechanisms responsible for the reddish colours observed in some of the sequences investigated (ALE, CHI, and BSC) have been correlated with a succession of processes, although influenced by different factors depending on the sequence. On the one hand, the Mas de l’Alerany sequence (ALE) shows horizons (Btk1-3), dated at 115–140 ka [31], with evidence of initial decarbonation associated with humid climates and intense pedogenic development [83], corresponding to the final stage of the MIS5 interglacial (MIS5e). In the case of Chiprana, decarbonation is linked to biological activity that forms biocalcifications (queras) with decarbonated hypocoatings, dating to a younger age (around 26 ka), coinciding with periods of higher humidity in the NE of Iberian Peninsula, as evidenced both by the presence of large rhizocretions and pollen analyses [85,86,87]. Subsequent rubefaction processes, because of iron oxidation and haematite formation, associated with alternating dry and wet climates [88], have also been linked to the different stages of MIS5. The illuviation clays, as shown by macro- and micromorphological observations, has been linked to humid climates [83] and is located in the more humid stages of MIS5 [31,35]. Finally, signs of recarbonation, evident in all sequences, are typical features of dry climates [89] and are found during the interval between MIS5 and MIS3 [35].
The Bescanó sequence (BSC), located in the northeast of Girona, corresponds to a different climatic regime, in general much more humid than the Ebro valley, and as a result, observed processes result in a higher pedogenic development associated with these environmental conditions. Temporally, the reddish horizons can be attributed to high humidity conditions. The succession of horizons that evidence this evolution is a bottom horizon (5Btkc − 184 ± 9.0 ky) associated with the MIS7 interglacial [90], followed by humid episodes during MIS5e giving rise to the 3Bkm-3Bwkc-4Btkc succession (119 ± 7.0 ky).
Based on the ages associated with the processes that generate reddish colours in these loess sequences, wetter climatic periods can be identified, comparable to those observed in other sequences from southern Europe, which have been mainly associated with climatic conditions during the Eemian interglacial [35,91]; however, it must be noted that these events were not as long-lasting in time, and consequently, pedogenic processes are much less significant than the ones observed in more humid climates.
An analysis of carbonates provides valuable information on moisture conditions [92,93] and the interaction between external and internal factors and allows us to correlate the degree of carbonate mobilisation with age, as processes are closely linked in semi-arid Mediterranean climates [94]. The various morphologies of secondary CaCO3 accumulations allow their association with the different proposed formation mechanisms [95,96], as well as the prevalence and location of the resulting features, which may be associated with specific processes [97,98]. Moreover, their geomorphological position on stable surfaces enables correlations to be established between carbonate accumulation and soil age [99,100].
Carbonate pseudomycelium accumulations, whose presence is widespread in almost all studied sequences, are associated with a decrease in pCO2 in soil pores linked to root activity or evaporation processes [67], conditions repeatedly observed during the pedogenesis of these deposits. Pedofeatures such as needle–fibre calcite (Figure 11) is only visible in the Borges Blanques sequence (horizon Ab dated in <6.5 ka), demonstrating the incipient pedogenesis of this sequence [94].
The presence of carbonate nodules of various sizes can be related to different degrees of carbonation, with rhizoconcretions being particularly abundant in the ALE, TIV, VIL, and BSC sequences (Figure 6). Their formation is associated with carbonate leaching along active roots [101,102], suggesting more humid conditions that favour carbonate leaching and subsequent precipitation at depth. All these accumulations occur in Bk horizons dated to about 27–32 ka, except for the Bkm horizon of BSC (23 ka), whose geographical and climatic context shows different moisture conditions. The higher prevalence of rhizoconcretions, including the so-called “loess dolls”, which reach lengths of up to 10 cm and are associated with hydromorphic conditions and biogenic processes [68], during this interval (around 30 ka) can be attributed to wetter and more favourable conditions for the life and the translocation of carbonate. This has been demonstrated by several palynological and environmental studies in northeastern Iberia that correlate them with interstadial inter-pleniglacial periods [86,87,88,103]. Additionally, the geographical location of these sequences, predominantly near the Catalan pre-coastal orographic barrier (Figure 1), also influences the amount of precipitation affecting them [104]. Lastly, the presence of horizons cemented by carbonate (Bkm) in various sequences (ALE, PIL, and BSC) highlights, on one hand, the influence of calcareous parent material and, on the other, the greater pedogenetic development associated with arid and semi-arid (MAS and PIL) or sub-humid (BSC) conditions [100,105].
The detailed investigation of biocalcifications known as queras, classified as calcified root cells (CRC), has linked them to chemical exchange reactions in calcareous and gypsiferous environments [106] as a plant strategy to cope with high calcium ion concentrations [107]. Moreover, isotopic analyses conducted on CO3 in queras, combined with available palynological data [86,108], have enabled their association with vegetation types (C3 and CAM plants) [109,110,111]. Radiocarbon dating has linked this type of biocalcification with favourable seasonal conditions during MIS2–early MIS3 [37], underscoring their value as indicators of specific climatic events [112,113].
Pedogenic gypsum, a scarce component in European loess deposits, provides further insight into the pedogenic processes of these soils and their relation to environmental conditions, paleosalinity, and water saturation conditions [68,114,115]. The study of the morphologies and compositions of pedogenic gypsum across five sequences (MEQ, AGR, FAY, BAT, and CHI) has allowed us the observation of the evolution of these pedofeatures and their relation to formation processes linked to local climatic and pedogenetic factors. Prolonged water saturation conditions during MIS5e led to the formation of gypsum-cemented horizons with xenotopic fabrics (MEQ: 5Bym, 405–420 cm). The formation of incomplete infillings (CHI: 2Bwky–130 cm to 5Bwy–320 cm and FAY: 2Bwy–210 cm to 5Cy–475 cm) has been associated with variations in the wetting front and climatic changes [116]. Compositional analyses of minor and trace elements (Mg, K, Na, Sr, and Ba) and isotopic signatures of sulphates in gypsum (δ34S and δ18O) provide information on gypsum origins (Miocene and Eocene sediments [33,34]) and paleosalinity conditions (Sr) [117,118]. The presence of elements such as Mg, K, and Na has been linked to solid inclusions or mixed sulphate precipitation in hyper-arid environments [119]. Isotopic analysis of hydration water reveals that evaporation processes are not significant, though the variability between sequences has been related to factors such as latitude, precipitation levels, and temperature gradients [38].
Finally, the differing sedimentation rates affecting these sequences, mainly associated with cold stages (MIS2 and MIS5e), influence the redistribution of carbonates and gypsum, disconnecting lower horizons from the surface, leading to semi-enclosed systems in some cases (BAT: ~450 cm; AGR: 2Bwy), limiting faunal activity, and significantly affecting the evolution of pedogenesis [34,38].

4.3. Regional Variability of Soil-Forming Factors

The analyses conducted have enabled us to identify the non-depositional and post-depositional processes affecting the loess in the study area and to link these processes to the soil-forming factors described by Jenny [120]. Soil formation is driven by the interaction of various factors, which were systematically described by Jenny [120] as S = f (r + p.m. + b.a. + c + t). For this discussion, the soil-forming factors and their associated processes are enumerated below:
  • Relief:
Wind-transported material is deposited in an organised manner when encountering elevated reliefs, typically on the leeward side, due to reduced wind speed [33,34]. Loess deposition is influenced by terrain morphology, climatic gradients, and vegetation density. Orographic barriers and their height promote loess accumulation at higher altitudes and on the leeward side as wind speed decreases and surface roughness increases [14,121].
  • Parent Material
Textural and mineralogical studies by Plata et al. [33,34] identified distinct source areas for loess deposits in the Ebro Valley Basin (central, southern, and northern zones), the Móra Basin, and the Sierra d’Almenara Loess. These findings were corroborated by isotopic analyses of gypsum sulphate (δ34S) in different loess sequences [38], with values ranging from 11.0 to 13.0‰. These values are consistent with those of Cenozoic evaporites from the Zaragoza Formation (Ebro Valley Loess) and the Barbastro Formation (Sierra d’Almenara Loess) [122,123]. Moreover, calcareous parent material promotes the redistribution of carbonate in the sequences and the formation of secondary accumulations.
  • Biological Activity
Biological activity is critical for loess structure formation after deposition. Micromorphological studies and thin-section porosity analyses following Stoops et al. [44], combined with structural porosity studies via image analysis [36], allowed classification of general loess porosity by origin [62], particularly bioporosity formed by faunal and root activity, which showed peaks at the horizons with more stability.
Calcium carbonate accumulations associated with root activity, such as rhizocretions [67,113], are notably significant in sequences like Bescanó (BSC), where cemented horizons (Bkm) are formed. Detailed analyses of queras (CRC) by Álvarez et al. [37] confirm biological activity as a key soil-forming factor in loess–palaeosol sequences (LPSs). This activity varies over time, influenced by palaeoenvironmental conditions.
  • Climate
Climate is a decisive factor in soil development and the evolution of pedofeatures, significantly affecting the studied LPS. These sequences, considered peri-desertic, were deposited during cold glacial stages [31,124]. The presence of clay in certain horizons is associated with rubefaction and indicates warmer and wetter climates (e.g., MIS 5e; 35). The existence of different carbonate accumulations highlights the influence of climatic factors, especially precipitation and temperature, providing useful knowledge about the arid, semi-arid, and sub-humid environments of the past associated with this type of accumulation. Isotopic analyses of carbonates in queras [37] provide specific climatic insights, while studies on gypsum hydration water and Sr composition [38] reveal variations of low humidity, groundwater presence, paleosalinity, and saturation conditions. The type of CaCO3 accumulations and clay illuviation in the BSC sequence, located in a more humid area (NE Girona), also demonstrate the influence of a wetter climate in their pedogenic development. Luminescence dating of deposits [31,33,34,35,36,37] has refined our understanding of pedogenic processes and paleoenvironmental conditions. These findings align with literature on Quaternary glacial and interglacial stages [125,126].
  • Time
Time is essential for soil development but challenging to define due to its correlation with other factors. Luminescence dating has been critical for temporally framing soil-forming processes.
  • Sedimentation Rate
Sedimentation rate is a relevant factor for soil formation on loess deposits. On one side, the continuous accretion of these deposits allows the pedogenic processes, to be expressed individually instead of being superposed, as in stable geomorphological positions. On the other side, these vertically accumulating deposits are influenced by deposition speed; faster deposition during cold periods reduces pedogenesis compared to slower accumulation phases. Variations in sedimentation result in overlapping morphologies. For example, in the AGR sequence, pedogenic gypsum formation, linked to the depth of the wetting front, halts as sedimentation rates increase, forming a semi-closed system with depleted δ34S isotopic values at depth. Similarly, bioporosity decreases significantly during high sedimentation periods [36].
In conclusion, these factors collectively determine the characteristics, evolution, and stratigraphy of the loess–palaeosol sequences in the studied region and allow us to propose a first regional hypothesis. The loess deposits of the Ebro Valley, Plana de Lleida (drier), and Serra de Almenara (slightly more humid latitudinal gradient) can be interpreted as a subgroup within the loess deposits of Southern Europe due to their low pedogenetic development, comparable to other loess from more extreme climates (eastern Mediterranean coast [20,127,128]. On the contrary, the Bescanó sequence, due to their geographical location and climatic conditions, presents degrees of development more like other loess profiles from Southern Europe [91,129].

4.4. Limitations of the Methodology and Future Proposals

While the results obtained have significantly advanced our understanding of the development and evolution of the loess–palaeosol sequences (LPSs) in the studied area, several limitations associated with the applied methodology have been identified.
One of the main challenges is the lack of chronological data for certain sequences, such as those in Batea (with only one date), Fayón (none), and Vilalba. This gap in dating hinders the precise determination of deposition timing and, consequently, the interpretation of post-depositional processes. Addressing this limitation requires obtaining additional chronological data to refine the temporal framework of these sequences.
Another limitation is the insufficient number of analysed sequences in the northeastern area of Girona [26]. The scarcity of loess outcrops and data from this region limit the ability to provide a more detailed account of its development. Expanding the study area to include additional sequences and enhancing the understanding of their source areas are proposed as essential steps for future research.
Although the analysis of quera features has proven useful, its potential could be further enhanced by correlating these findings with palynological and/or genetic data. Initial attempts to analyse pollen and DNA from these structures faced significant challenges, particularly due to the low organic matter content of the soils [130,131,132]. Similar limitations arise in the analysis of other biomarkers, such as n-alkanes. Techniques developed for organic-rich soils complicate the interpretation of results in substrates with minimal organic material.
Finally, the isotopic analysis of gypsum, while valuable, could benefit from expanding to include more sequences containing gypsum and incorporating pedogenic gypsum from non-loess soils for comparative purposes. A microanalysis of gypsum crystals to determine their evolutionary stages is also recommended. This approach would greatly enhance the interpretation of the data and provide a more comprehensive understanding of the processes involved.

5. Conclusions

(a)
Main characterisation of the LPS of the NE Iberian Peninsula
The loess deposits studied serve as valuable Quaternary records, characterised by loamy to silty textures, high calcium carbonate (30–45%), and basic to alkaline pH (8–9). Their thickness correlates with geomorphology, and gypsum content reflects local material sources like Miocene sediments. Pedogenic processes such as carbonate redistribution and compaction, alongside biological activity, highlight the need for integrating grain size, mineralogy, and micromorphology for broader insights into loess evolution.
(b)
Specific research and its relation to soil-forming processes
Porosity studies emphasise its structural and textural roles, influenced by bioporosity and climatic factors, with peaks linked to warmer periods. Pedogenic gypsum stabilises soils and reflects hydrological conditions, while queras, formed during geomorphological stability, provide isotopic evidence of paleoenvironmental conditions. Gypsum studies highlight pedogenesis stages and palaeosalinity, supported by isotopic signatures (δ34S and δ18O) and hydration water analyses, revealing latitude and climatic variability without significant evaporation processes. These findings reinforce the significance of loess–palaeosol sequences as proxies for environmental dynamics.
(c)
Soil-forming factors
Relief influences loess deposition, while parent material analyses confirm calcareous origins. Biological activity shapes structure through bioporosity, and climate drives carbonate, gypsum, and clay translocation. Luminescence dating connects soil processes to climatic stages, and sedimentation rate is suggested as a factor impacting loess pedogenesis. Ebro Valley and nearby loess are distinct within Southern Europe, showing links to extreme climates (western Mediterranean) but with a certain latitudinal gradient regarding moisture, while Bescanó sequences align with typical Southern European loess.
(d)
Methodological limitations
The main limitations have been insufficient chronological data (Batea, Fayón, and Vilalba) and a lack of sequences examined in northeastern Girona, which limits their temporal and spatial understanding. Quera analyses would increase their value if they were integrated with palynological and genetic data, but the scarcity of organic matter complicates these efforts. Biomarker studies (e.g., n-alkanes) have similar obstacles. Expanding samples for isotopic analysis of gypsum, together with their microanalysis, could refine interpretations of their pedogenesis and evolutionary processes.

Author Contributions

Conceptualization, D.Á., C.A.T.-G., J.B., C.B., J.M.P. and R.M.P.; Methodology, D.Á., C.A.T.-G. and R.M.P.; Software, C.A.T.-G.; Validation, D.Á.; Formal analysis, D.Á.; Inves-tigation, D.Á., J.B., C.B., J.M.P., R.R.O., J.R.O. and R.M.P.; Resources, R.M.P.; Data curation, D.Á.; Writing—original draft, D.Á.; Writing—review & editing, D.Á., C.A.T.-G. and R.M.P.; Supervision, J.B. and R.M.P.; Project administration, R.M.P. All authors have read and agreed to the published version of the manuscript.

Funding

This research was funded by [I + D + i RTI2018-094927-B-I00 project MCIN/AEI and FEDER, CONACyT-México] grant number [PRE-2019-088457 and #770673]. Torres-Guerrero, C.A., was funded by the CONACyT-México, Postdoctoral Fellowship #770673. And the APC was waived.

Data Availability Statement

The original contributions presented in this study are included in the article. Further inquiries can be directed to the corresponding author.

Conflicts of Interest

The authors declare no conflict of interest.

References

  1. Smalley, I.J.; Marković, S.B. Loessification and hydroconsolidation: There is a connection. Catena 2014, 117, 94–99. [Google Scholar] [CrossRef]
  2. Luo, H.; Wu, F.; Chang, J.; Xu, J. Microstructural constraints on geotechnical properties of Malan Loess: A case study from Zhaojiaan landslide in Shaanxi province, China. Eng. Geol. 2018, 236, 60–69. [Google Scholar] [CrossRef]
  3. Yaalon, D.H. Saharan dust and desert loess: Effect on surrounding soils. J. Afr. Earth Sci. 1987, 6, 569–571. [Google Scholar] [CrossRef]
  4. Smalley, I.J.; Krinsley, D.H. Loess deposits associated with deserts. Catena 1978, 5, 53–66. [Google Scholar] [CrossRef]
  5. Obruchev, V.A. Loess types and their origin. Am. J. Sci. 1945, 243, 256–262. [Google Scholar] [CrossRef]
  6. Smalley, I. The Formation of Loess Materials and Loess Deposits: Some Observations on the Tashkent Loess. In Loess Letter; Olszak, G., Ed.; De Gruyter: Berlin, Germany; Boston, MA, USA, 1980; Volume 2, Issue 2, pp. 247–258. [Google Scholar] [CrossRef]
  7. Iriondo, M.H.; Kröhling, D.M. Non-classical types of loess. Sediment. Geol. 2007, 202, 352–368. [Google Scholar] [CrossRef]
  8. Wright, J.S. “Desert” loess versus “glacial” loess: Quartz silt formation, source areas and sediment pathways in the formation of loess deposits. Geomorphology 2001, 36, 231–256. [Google Scholar] [CrossRef]
  9. Pye, K.; Sherwin, D. Loess. In Aeolian Environments, Sediments and Landforms; Goudie, A.S., Livingstone, I., Stokes, S., Eds.; Wiley: Chichester, UK, 1999; pp. 213–238. [Google Scholar]
  10. Vandenberghe, J. Multi-proxy analysis: A reflection on essence and potential pitfalls. Neth. J. Geosci. 2012, 91, 263–269. [Google Scholar] [CrossRef]
  11. Morrison, R.B. Quaternary soil stratigraphy—Concepts, methods and problems. In Quaternary Soils; Geo Abstracts Ltd.: Norwich, UK, 1978; pp. 77–108. [Google Scholar]
  12. Pécsi, M. Loess is not just the accumulation of dust. Quat. Int. 1990, 7–8, 1–21. [Google Scholar] [CrossRef]
  13. Pécsi, M. The role of principles and methods in loess-paleosol investigations. GeoJournal 1995, 36, 117–131. [Google Scholar] [CrossRef]
  14. Pye, K. The nature, origin and accumulation of loess. Quat. Sci. Rev. 1995, 14, 653–667. [Google Scholar] [CrossRef]
  15. Rousseau, D.-D.; Antoine, P.; Gerasimenko, N.; Sima, A.; Fuchs, M.; Hatté, C.; Moine, O.; Zoeller, L. North Atlantic abrupt climatic events of the last glacial period recorded in Ukrainian loess deposits. Clim. Past 2011, 7, 221–234. [Google Scholar] [CrossRef]
  16. Antoine, P.; Rousseau, D.D.; Fuchs, M.; Hatté, C.; Gauthier, C.; Marković, S.B.; Jovanović, M.; Gaudenyi, T.; Moine, O.; Rossignol, J. High-resolution record of the last climatic cycle in the southern Carpathian Basin (Surduk, Vojvodina, Serbia). Quat. Int. 2009, 198, 19–36. [Google Scholar] [CrossRef]
  17. Antoine, P.; Rousseau, D.D.; Moine, O.; Kunesch, S.; Hatté, C.; Lang, A.; Tissoux, H.; Zöller, L. Rapid and cyclic aeolian deposition during the Last Glacial in European loess: A high-resolution record from Nussloch, Germany. Quat. Sci. Rev. 2009, 28, 2955–2973. [Google Scholar] [CrossRef]
  18. Frechen, M.; Oches, E.A.; Kohfeld, K.E. Loess in Europe—Mass accumulation rates during the Last Glacial Period. Quat. Sci. Rev. 2003, 22, 1835–1857. [Google Scholar] [CrossRef]
  19. Coudé-Gaussen, G. The loess and loess-like deposits along the sides of the western Mediterranean Sea: Genetic and palaeoclimatic significance. Quat. Int. 1990, 5, 1–8. [Google Scholar] [CrossRef]
  20. Crouvi, O.; Amit, R.; Ben Israel, M.; Enzel, Y. Loess in the Negev desert: Sources, loessial soils, palaeosols, and palaeoclimatic implications. In Quaternary of the Levant: Environments, Climate Change, and Humans; Bar-Yosef, O., Enzel, Y., Eds.; Cambridge University Press: Cambridge, UK, 2017; pp. 471–482. [Google Scholar]
  21. Lehmkuhl, F.; Nett, J.J.; Pötter, S.; Schulte, P.; Sprafke, T.; Jary, Z.; Antoine, P.; Wacha, L.; Wolf, D.; Zerboni, A.; et al. Loess landscapes of Europe—Mapping, geomorphology, and zonal differentiation. Earth-Sci. Rev. 2021, 215, 103496. [Google Scholar] [CrossRef]
  22. González-Martín, J.A.; Asensio, I.; Fernández, A.; García-Giménez, R.; González, M.J.; Guerrero, L.; Rubio, V. Acumulaciones de origen frío en el modelado de los paisajes de la Rama castellana del Sistema Ibérico y de la Submeseta Sur. In Procesos y Formas Periglaciares en la Montaña Mediterránea; Lozano-Tena, M.V.J., Peña-Monné, J.L., Sánchez-Fabre, M., Eds.; Instituto de Estudios Turolenses: Teruel, Spain, 2000; pp. 149–160. [Google Scholar]
  23. Günster, N.; Eck, P.; Skowronek, A.; Zöller, L. Late Pleistocene loess and their paleosols in the Granada Basin, Southern Spain. Quat. Int. 2001, 76–77, 241–245. [Google Scholar] [CrossRef]
  24. García Giménez, R.; Vigil de la Villa, R.; González Martín, J.A. Characterization of loess in central Spain: A microstructural study. Environ. Earth Sci. 2012, 65, 2125–2137. [Google Scholar] [CrossRef]
  25. Torras, A.; Riba, O. Contribución al estudio de los limos yesíferos del centro de la depresión del Ebro. Bol. Inst. Estud. Astur. Supl. Cienc. 1968, 14, 125–137. [Google Scholar]
  26. Mücher, H.; Sevink, J.; Bergkamp, G.; Jongejans, J. A pedological and micromorphological study on Mediterranean loessial deposits near Gerona, NE Spain. Quat. Int. 1990, 5, 9–22. [Google Scholar] [CrossRef]
  27. Gutiérrez-Elorza, M.; Desir, G.; Gutiérrez-Santolalla, F. Yardangs in the semiarid central sector of the Ebro Depression (NE Spain). Geomorphology 2002, 44, 155–170. [Google Scholar] [CrossRef]
  28. Iriondo, M.; Kröhling, D. Loess yesíferos en el Cuaternario Superior de la Cuenca del Ebro (España): Características generales. In Miscelánea en Homenaje a Emiliano Aguirre; Rubió, S., Ed.; Museo Arqueológico Regional: Madrid, Spain, 2004; pp. 45–50. [Google Scholar]
  29. Josa, R. Estudi Cronoseqüencial de Sols Sobre Les Terrasses de L’anoia: Entre El Bedorc I Gelida. Ph.D. Thesis, Universitat de Barcelona, Facultat de Geologia, Barcelona, Spain, 1985. [Google Scholar]
  30. Lewis, C.J.; McDonald, E.V.; Sancho, C.; Peña, J.L.; Rhodes, E.J. Climatic implications of correlated Upper Pleistocene glacial and fluvial deposits on the Cinca and Gállego Rivers (NE Spain) based on OSL dating and soil stratigraphy. Glob. Planet. Change 2009, 67, 141–152. [Google Scholar] [CrossRef]
  31. Boixadera, J.; Poch, R.M.; Lowick, S.E.; Balasch, J.C. Loess and soils in the eastern Ebro Basin. Quat. Int. 2015, 376, 114–133. [Google Scholar] [CrossRef]
  32. Plata Moreno, J.M. Loess in the Eastern Ebro Valley: Source Areas and Red Soil Genesis. Ph.D. Thesis, Universitat de Lleida, Programa de Doctorat en Ciència i Tecnologia Agrària i Alimentària, Lleida, Spain, 2023. [Google Scholar]
  33. Plata, J.M.; Balasch, J.C.; Rodríguez, R.; Boixadera, J.; Castelltort, X.; Olarieta, J.R.; Antúnez, M.; Poch, R.M. Source areas of the Eastern Ebro Valley loess (NE Iberian Peninsula): Heavy mineral composition as a provenance indicator. Earth Surf. Process. Landf. 2022, 47, 3611–3628. [Google Scholar] [CrossRef]
  34. Plata, J.M.; Balasch, J.C.; Boixadera, J.; Baltiérrez, A.; Preusser, F.; Poch, R.M. Source areas and paleoenvironmental reconstruction of the Serra d’Almenara loess (NE Ebro Valley, Iberian Peninsula) from grain-size and heavy mineral signatures. Geomorphology 2024, 451, 109085. [Google Scholar] [CrossRef]
  35. Plata, J.M.; Rodríguez, R.; Preusser, F.; Boixadera, J.; Balasch, J.C.; Antúnez, M.; Poch, R.M. Red soils in loess deposits of the Western Ebro Valley. Catena 2021, 204, 105430. [Google Scholar] [CrossRef]
  36. Torres-Guerrero, C.A.; Álvarez, D.; Preusser, F.; Olarieta, J.R.; Poch, R.M. Corrigendum to “Evolution of soil porosity in loess-palaeosol sequences of the Ebro Valley, NE Iberia” [Catena 230 (2023) 107244]. Catena 2023, 236, 2023–2025. [Google Scholar] [CrossRef]
  37. Álvarez, D.; Torres-Guerrero, C.A.; Travé, A.; Preusser, F.; Plata, J.M.; Poch, R.M. Biogenic carbonates (queras) in loess-palaeosol sequences of the Ebro Basin and their potential use as a palaeoenvironmental proxy. Catena 2024, 240, 107969. [Google Scholar] [CrossRef]
  38. Álvarez, D.; Torres-Guerrero, C.; Boixadera, J.; Balasch, C.; Plata, J.M.; Rodríguez-Ochoa, R.; Olarieta, J.R.; Poch, R.M. Isotopy, Micromorphology and Composition of Pedogenic Gypsum in Loess-Palaeosol Sequences in the Ebro Valley as a Combined Paleoenvironmental Proxy. Geoderma 2024, in print. [Google Scholar]
  39. Zoeller, L. New approaches to European loess: A stratigraphic and methodical review of the past decade. Cent. Eur. J. Geosci. 2010, 2, 19–31. [Google Scholar] [CrossRef]
  40. Comisión del Banco de Datos de Suelos y Aguas. SINEDARES. Sistema de Información Edafológica y Agronómica de España, Manual Para la Descripción Codificada de Suelos en el Campo; Ministerio de Agricultura, Pesca y Alimentación: Madrid, Spain, 1983. [Google Scholar]
  41. Porta, J.; Lopez-Acevedo Reguerin, M.; Rodriguez-Ochoa, R. Técnicas y Experimentos en Edafología; Col·legi Oficial d’Enginyers Agrònoms de Catalunya: Catalunya, Spain, 1986. [Google Scholar]
  42. Artieda, O.; Herrero, J.; Drohan, P.J. Developing an arid soil-specific hypersaline solution for soil electrical conductivity analysis. Commun. Soil Sci. Plant Anal. 2006, 37, 2431–2441. [Google Scholar]
  43. Benyarku, C.A.; Stoops, G. Guidelines for Preparation of Rock and Soil Thin Sections and Polished Sections; Universitat de Lleida, Departament de Medi Ambient i Ciències del Sòl: Lleida, Spain, 2005. [Google Scholar]
  44. Stoops, G. Guidelines for Analysis and Description of Soil and Regolith Thin Sections; Soil Science Society of America: Madison, WI, USA, 2021. [Google Scholar] [CrossRef]
  45. Galbraith, R.F.; Roberts, R.G. Statistical aspects of equivalent dose and error calculation and display in OSL dating: An overview and some recommendations. Quat. Geochronol. 2012, 11, 1–27. [Google Scholar] [CrossRef]
  46. Kreutzer, S.; Burow, C.; Dietze, M.; Fuchs, M.C.; Schmidt, C.; Fischer, M.; Friedrich, J.; Riedesel, S.; Autzen, M.; Mittelstrass, D. Luminescence: Comprehensive Luminescence Dating Data Analysis, R Package Version 0.9.10. Available online: https://CRAN.R-project.org/package=Luminescence (accessed on 17 April 2025).
  47. Li, B.; Li, S.H. Luminescence dating of K-feldspar from sediments: A protocol without anomalous fading correction. Quat. Geochronol. 2011, 6, 468–479. [Google Scholar] [CrossRef]
  48. Preusser, F.; Kasper, H. The Last Glacial Maximum in Central Europe: Evidence from loess-paleosol sequences in northern Germany. Quat. Sci. Rev. 2001, 20, 1757–1774. [Google Scholar]
  49. Preusser, F.; Degering, D.; Fülling, A.; Miocic, J. Complex dose rate calculations in luminescence dating of lacustrine and palustrine sediments from Niederweningen, northern Switzerland. Geochronometria 2023, 50, 28–49. [Google Scholar] [CrossRef]
  50. Nathan, R.P.; Mauz, B. On the dose-rate estimate of carbonate-rich sediments for trapped charge dating. Radiat. Meas. 2008, 43, 14–25. [Google Scholar] [CrossRef]
  51. Degering, D.; Degering, A. Change is the only constant—Time-dependent dose rates in luminescence dating. Quat. Geochronol. 2020, 58, 101074. [Google Scholar] [CrossRef]
  52. Crouvi, O.; Amit, R.; Enzel, Y.; Porat, N.; Sandler, A. Sand dunes as a major proximal dust source for late Pleistocene loess in the Negev Desert, Israel. Quat. Res. 2008, 70, 275–282. [Google Scholar] [CrossRef]
  53. Bertran, P.; Bosq, M.; Borderie, Q.; Coussot, C.; Coutard, S.; Deschodt, L.; Franc, O.; Gardère, P.; Liard, M.; Wuscher, P. Revised map of European aeolian deposits derived from soil texture data. Quat. Sci. Rev. 2021, 266, 107085. [Google Scholar] [CrossRef]
  54. Mange, A.; Mauer, H. Heavy Minerals in Colour; Springer: Dordrecht, The Netherlands, 1992. [Google Scholar] [CrossRef]
  55. Andò, S.; Garzanti, E.; Padoan, M.; Limonta, M. Corrosion of heavy minerals during weathering and diagenesis: A catalog for optical analysis. Sediment. Geol. 2012, 280, 165–178. [Google Scholar] [CrossRef]
  56. Fernández, J.E. Los Minerales Pesados Del Mioceno de la Fosa Neógena Del Vallès-Penedès. Caracterización, Evaluación E Hipótesis de Procedencia. Ph.D. Thesis, Universitat de Barcelona, Departament de Mineralogia, Petrologia i Geologia Aplicada, Barcelona, Spain, 2016. Available online: http://hdl.handle.net/10803/400615 (accessed on 28 September 2016).
  57. Sandatlas. Informational Website Focused on Sand, Rocks, Minerals, etc. Available online: https://www.sandatlas.org/ (accessed on 28 February 2021).
  58. Hammer, Ø.; Harper, D.A.T.; Ryan, P.D. PAST—Palaeontological statistics, ver. 1.89. Palaeontol. Electron. 2001, 4, 1–9. [Google Scholar]
  59. Gutiérrez-Castorena, E.V.; Gutiérrez-Castorena, M.C.; Vargas, T.G.; Bontemps, L.C.; Martínez, J.D.; Méndez, E.S.; Solorio-Ortíz, C.A. Micromapping of microbial hotspots and biofilms from different crops using digital image mosaics of soil thin sections. Geoderma 2016, 279, 11–21. [Google Scholar] [CrossRef]
  60. Schindelin, J.; Arganda-Carreras, I.; Frise, E.; Kaynig, V.; Longair, M.; Pietzsch, T.; Preibisch, S.; Rueden, C.; Saalfeld, S.; Schmid, B.; et al. Fiji: An open-source platform for biological image analysis. Nat. Methods 2012, 9, 676–682. [Google Scholar] [CrossRef]
  61. Vogel, H.J. Quantim4 C/C++ Library for Scientific Image Processing; UFZ—Helmholtz Center for Environmental Research, Helmholtz: Leipzig, Germany, 2008; Available online: https://www.ufz.de/export/data/2/94413_quantim4_ref_manual.pdf (accessed on 20 October 2008).
  62. Ma, F.L.; Bai, X.H.; Wang, M. Quantitative analysis of loess microstructure and collapsibility. In Proceedings of the 1st Annual Conference of Civil Engineering in Central and Western China, Jinan, China, 14 October 2011; pp. 417–424. [Google Scholar]
  63. Sauzet, O.; Cammas, C.; Gilliot, J.M.; Bajard, M.; Montagne, D. Development of a novel image analysis procedure to quantify biological porosity and illuvial clay in large soil thin sections. Geoderma 2017, 292, 135–148. [Google Scholar] [CrossRef]
  64. Comber, A.; Fisher, P.F.; Brunsdon, C.; Khmag, A. Spatial analysis of remote sensing image classification accuracy. Remote Sens. Environ. 2012, 127, 237–246. [Google Scholar] [CrossRef]
  65. Jiao, L.; Liu, Y. Analyzing the shape characteristics of land use classes in remote sensing imagery. ISPRS Ann. Photogramm. Remote Sens. Spat. Inf. Sci. 2012, I-7, 135–140. [Google Scholar] [CrossRef]
  66. Bonnie, J.H.M.; Fens, T.W. Porosity and permeability from SEM based image analysis of core material. In Proceedings of the SPE Latin America Petroleum Engineering Conference, Caracas, Venezuela, 8–11 March 1992. [Google Scholar] [CrossRef]
  67. Reed, S.J.B. Scanning electron microscopy. In Electron Microscopy and Analysis; Reed, S.J.B., Ed.; CRC Press: Boca Raton, FL, USA, 2005. [Google Scholar]
  68. Barta, G. Secondary carbonates in loess-paleosol sequences: A general review. Open Geosci. 2011, 3, 129–146. [Google Scholar] [CrossRef]
  69. Herrero, J.; Porta, J.; Fédoroff, N. Hypergypsic soil micromorphology and landscape relationships in Northeastern Spain. Soil Sci. Soc. Am. J. 1992, 56, 1188–1194. [Google Scholar] [CrossRef]
  70. Reimer, P.J. Composition and consequences of the IntCal20 radiocarbon calibration curve. Quat. Res. 2020, 96, 22–27. [Google Scholar] [CrossRef]
  71. Drăzíc, S.; Sladoje, N.; Lindblad, J. Estimation of Feret’s diameter from pixel coverage representation of a shape. Pattern Recognit. Lett. 2016, 80, 37–45. [Google Scholar] [CrossRef]
  72. Cantarero, I.; Travé, A.; Alías, G.; Baqués, V. Pedogenic products sealing normal faults (Barcelona Plain, NE Spain). J. Geochem. Explor. 2010, 106, 44–52. [Google Scholar] [CrossRef]
  73. Reimer, P.; Bard, E.; Bayliss, A.; Beck, J.; Blackwell, P.; Ramsey, C.; Van der Plicht, J. IntCal13 and Marine13 Radiocarbon Age Calibration Curves 0–50,000 Years cal BP. Radiocarbon 2013, 55, 1869–1887. [Google Scholar] [CrossRef]
  74. Cerling, T.E.; Quade, J. Stable carbon and oxygen isotopes in soil carbonates. Geophys. Monogr. Ser. 1993, 78, 217–231. [Google Scholar]
  75. Dworkin, S.I.; Nordt, L.; Atchley, S. Determining terrestrial paleotemperatures using the oxygen isotopic composition of pedogenic carbonate. Earth Planet. Sci. Lett. 2005, 237, 56–68. [Google Scholar] [CrossRef]
  76. Buck, B.J.; Van Hoesen, J. Snowball morphology and SEM analysis of pedogenic gypsum, Southern New Mexico, USA. J. Arid. Environ. 2002, 51, 469–487. [Google Scholar] [CrossRef]
  77. Rohrssen, M.; Brunner, B.; Mielke, R.E.; Coleman, M. Method for simultaneous oxygen and hydrogen isotope analysis of water of crystallization in hydrated minerals. Anal. Chem. 2008, 80, 7084–7089. [Google Scholar] [CrossRef]
  78. Gázquez, F.; Calaforra, J.M.; Evans, N.P.; Hodell, D.A. Using stable isotopes (δ17O, δ18O and δD) of gypsum hydration water to ascertain the role of water condensation in the formation of subaerial gypsum speleothems. Chem. Geol. 2017, 452, 34–46. [Google Scholar] [CrossRef]
  79. Craig, H. Isotopic variations in meteoric waters. Science 1961, 133, 1702–1703. [Google Scholar] [CrossRef]
  80. Poch, R.M.; De Coster, W.; Stoops, G. Pore space characteristics as indicators of soil behaviour in gypsiferous soils. Geoderma 1998, 87, 87–109. [Google Scholar] [CrossRef]
  81. Machette, M.N. Dating Quaternary faults in the southwestern United States by using buried calcific paleosols. U.S. Geol. Surv. J. Res. 1978, 6, 369. [Google Scholar]
  82. Schoeneberger, P.J.; Wysocki, D.A.; Benham, E.C.; Soil Survey Staff. Field Book for Describing and Sampling Soils; Version 3.0; Natural Resources Conservation Service, National Soil Survey Center: Lincoln, NE, USA, 2012. [Google Scholar]
  83. Fedoroff, N.; Courty, M.-A. Revisiting the genesis of red Mediterranean soils. Turk. J. Earth Sci. 2013, 22, 359–375. [Google Scholar] [CrossRef]
  84. Bryant, R.B. Physical processes of fragipan formation. In Fragipans: Their Occurrence, Classification, and Genesis; Soil Science Society of America Special Publications: Madison, WI, USA, 1989; Volume 24, pp. 141–150. [Google Scholar] [CrossRef]
  85. Jing, J.; Hou, J.; Sun, W.; Chen, G.; Ma, Y.; Ji, G. Study on influencing factors of unsaturated loess slope stability under dry-wet cycle conditions. J. Hydrol. 2022, 612, 128187. [Google Scholar] [CrossRef]
  86. Carrión, J.S.; Fernández, S.; González-Sampériz, P.; Gil-Romera, G.; Badal, E.; Carrión-Marco, Y.; López-Merino, L.; López-Sáez, A.; Fierro, E.; Burjachs, F. Expected trends and surprises in the Lateglacial and Holocene vegetation history of the Iberian Peninsula and Balearic Islands. Rev. Palaeobot. Palynol. 2010, 162, 458–475. [Google Scholar] [CrossRef]
  87. González-Sampériz, P.; Valero-Garcés, B.L.; Carrión, J.S.; Peña-Monné, J.L.; García-Ruiz, J.M.; Martí-Bono, C. Glacial and lateglacial vegetation in northeastern Spain: New data and a review. Quat. Int. 2005, 140–141, 4–20. [Google Scholar] [CrossRef]
  88. González-Sampériz, P.; Valero-Garcés, B.L.; Moreno, A.; Morellón, M.; Navas, A.; Machín, J.; Delgado-Huertas, A. Vegetation changes and hydrological fluctuations in the Central Ebro Basin (NE Spain) since the Late Glacial period: Saline lake records. Palaeogeogr. Palaeoclimatol. Palaeoecol. 2008, 259, 157–181. [Google Scholar] [CrossRef]
  89. Schwertmann, U. Relations between iron oxides, soil color, and soil formation. In Soil Color; Soil Science Society of America Special Publications: Madison, WI, USA, 1993; Volume 31, pp. 51–69. [Google Scholar] [CrossRef]
  90. Herrero, J.; Porta, J. Gypsiferous soils in the North-East of Spain. In Micromorphologie des Sols, Soil Micromorphology; Fedoroff, N., Bresson, L.M., Courty, M.A., Eds.; AFES: Paris, France, 1987; pp. 186–192. [Google Scholar]
  91. Langford, H.E.; Boreham, S.; Coope, G.R.; Fletcher, W.; Horne, D.J.; Keen, D.H.; Mighall, T.; Penkman, K.E.H.; Schreve, D.C.; Whittaker, J.E. Palaeoecology of a late MIS 7 interglacial deposit from eastern England. Quat. Int. 2014, 341, 27–45. [Google Scholar] [CrossRef]
  92. Pfaffner, N.; Kadereit, A.; Karius, V.; Kolb, T.; Kreutzer, S.; Sauer, D. Reconstructing the Eemian to Middle Pleniglacial pedosedimentary evolution of the Baix loess-palaeosol sequence (Rhône Rift Valley, southern France)—Basic chronostratigraphic framework and palaeosol characterisation. EG Quat. Sci. J. 2024, 73, 1–22. [Google Scholar] [CrossRef]
  93. Landi, A.; Mermut, A.R.; Anderson, D.W. Origin and rate of pedogenic carbonate accumulation in Saskatchewan soils, Canada. Geoderma 2003, 117, 143–156. [Google Scholar] [CrossRef]
  94. Retallack, G.J. Pedogenic carbonate proxies for amount and seasonality of precipitation in paleosols. Geology 2005, 33, 333–336. [Google Scholar] [CrossRef]
  95. Badía, D.; Martí, C.; Palacio, E.; Sancho, C.; Poch, R.M. Soil evolution over the Quaternary period in a semiarid climate (Segre River terraces, northeast Spain). Catena 2009, 77, 165–174. [Google Scholar] [CrossRef]
  96. Monger, C.H. Pedogenic carbonate: Links between biotic and abiotic CaCO3. In Proceedings of the 17th World Congress of Soil Science, Bangkok, Thailand, 14–21 August 2002. [Google Scholar]
  97. Zamanian, K.; Pustovoytov, K.; Kuzyakov, Y. Pedogenic carbonates: Forms and formation processes. Earth-Sci. Rev. 2016, 157, 1–17. [Google Scholar] [CrossRef]
  98. Díaz-Hernández, J.L.; Barahona Fernández, E.; Linares González, J. Organic and inorganic carbon in soils of semiarid regions: A case study from the Guadix-Baza basin (Southeast Spain). Geoderma 2003, 114, 65–80. [Google Scholar] [CrossRef]
  99. Kraimer, R.A.; Monger, H.C. Carbon isotopic subsets of soil carbonate—A particle size comparison of limestone and igneous parent materials. Geoderma 2009, 150, 1–9. [Google Scholar] [CrossRef]
  100. Gile, L.H.; Peterson, F.F.; Grossman, R.B. Morphological and genetic sequences of carbonate accumulation in desert soils. Soil Sci. 1966, 101, 347–360. [Google Scholar] [CrossRef]
  101. Alonso-Zarza, A.M. Palaeoenvironmental significance of palustrine carbonates and calcretes in the geological record. Earth-Sci. Rev. 2003, 60, 261–298. [Google Scholar] [CrossRef]
  102. Kuzyakov, Y.; Shevtzova, E.; Pustovoytov, K. Carbonate re-crystallization in soil revealed by 14C labeling: Experiment, model and significance for paleo-environmental reconstructions. Geoderma 2006, 131, 45–58. [Google Scholar] [CrossRef]
  103. Gocke, M.; Pustovoytov, K.; Kühn, P.; Wiesenberg, G.L.B.; Löscher, M.; Kuzyakov, Y. Carbonate rhizoliths in loess and their implications for paleoenvironmental reconstruction revealed by isotopic composition: δ13C, 14C. Chem. Geol. 2011, 283, 251–260. [Google Scholar] [CrossRef]
  104. Vandenberghe, J.; Mücher, H.J.; Roebroeks, W.; Gemke, D. Lithostratigraphy and palaeoenvironment of the Pleistocene deposits at Maastricht-Belvédère, southern Limburg, The Netherlands. Meded. Rijks Geol. Dienst 1985, 39, 7–18. [Google Scholar]
  105. Guernsey, J.L. Orographic precipitation. In Climatology. Encyclopedia of Earth Science; Springer: Boston, MA, USA, 1987. [Google Scholar] [CrossRef]
  106. Badia, D.; Poch, R.M.; Martí Dalmau, C.; García-González, M.T. Paleoclimatic implications of micromorphic features of a polygenetic soil in the Monegros Desert (NE-Spain). Span. J. Soil Sci. 2013, 3, 95–115. [Google Scholar] [CrossRef]
  107. Jaillard, B.; Guyon, A.; Maurin, A.F. Structure and composition of calcified roots, and their identification in calcareous soils. Geoderma 1991, 50, 197–210. [Google Scholar] [CrossRef]
  108. Horner, H.T.; Wagner, B.L. Calcium oxalate formation in higher plants. In Calcium Oxalate in Biological Systems; CRC Press: Boca Raton, FL, USA, 1995; pp. 53–72. [Google Scholar]
  109. Camuera, J.; Jiménez-Moreno, G.; Ramos-Román, M.J.; García-Alix, A.; Toney, J.L.; Anderson, R.S.; Jiménez-Espejo, F.; Bright, J.; Webster, C.; Yanes, Y. Vegetation and climate changes during the last two glacial-interglacial cycles in the western Mediterranean: A new long pollen record from Padul (southern Iberian Peninsula). Quat. Sci. Rev. 2019, 205, 86–105. [Google Scholar] [CrossRef]
  110. Vogel, J.C. Variability of carbon isotope fractionation during photosynthesis. In Stable Isotopes and Plant Carbon-Water Relations; Elsevier: Amsterdam, The Netherlands, 1993; pp. 29–46. [Google Scholar]
  111. Quade, J.; Cerling, T.E. Expansion of C4 grasses in the Late Miocene of Northern Pakistan: Evidence from stable isotopes in paleosols. Palaeogeogr. Palaeoclimatol. Palaeoecol. 1995, 115, 91–116. [Google Scholar] [CrossRef]
  112. Bayat, O.; Karimi, A.; Khademi, H. Stable isotope geochemistry of pedogenic carbonates in loess-derived soils of northeastern Iran: Paleoenvironmental implications and correlation across Eurasia. Quat. Int. 2017, 429, 52–61. [Google Scholar] [CrossRef]
  113. Wright, V.P.; Beck, V.H.; Sanz-Montero, M.E. Spherulites in calcrete laminar crusts: Biogenic CaCO3 precipitation as a major contributor to crust formation—Discussion. J. Sediment. Res. 1996, 66, 1040–1041. [Google Scholar] [CrossRef]
  114. Zamanian, K.; Lechler, A.R.; Schauer, A.J.; Kuzyakov, Y.; Huntington, K.W. The δ13C, δ18O and Δ47 records in biogenic, pedogenic and geogenic carbonate types from paleosol-loess sequence and their paleoenvironmental meaning. Quat. Res. 2021, 101, 256–272. [Google Scholar] [CrossRef]
  115. Stoops, G.; Ilaiwi, M. Gypsum in arid soils: Morphology and genesis. In Proceedings of the Third International Soil Classification Workshop; Beinroth, F.H., Osman, A., Eds.; ACSAD: Damascus, Syria, 1981; pp. 175–178. [Google Scholar]
  116. Poch, R.M.; Artieda, O.; Lebedeva, M. Gypsic features. In Interpretation of Micromorphological Features of Soils and Regoliths; Stoops, G., Marcelino, V., Mees, F., Eds.; Elsevier: Amsterdam, The Netherlands, 2018; pp. 259–287. [Google Scholar]
  117. Schutt, B. Reconstruction of palaeoenvironmental conditions by investigation of Holocene playa sediments in the Ebro Basin, Spain: Preliminary results. Geomorphology 1998, 23, 93–104. [Google Scholar] [CrossRef]
  118. Playà, E.; Rosell, L. The celestite problem in gypsum Sr geochemistry: An evaluation of purifying methods of gypsiferous samples. Chem. Geol. 2005, 221, 81–89. [Google Scholar] [CrossRef]
  119. Toboła, T.; Kukiałka, P. The Lotsberg Salt Formation in central Alberta (Canada)—Petrology, geochemistry, and fluid inclusions. Minerals 2020, 10, 868. [Google Scholar] [CrossRef]
  120. Jenny, H. Factors of Soil Formation; McGraw-Hill: New York, NY, USA, 1941; p. 281. [Google Scholar]
  121. Goossens, D. Aeolian deposition of dust over hills: The effect of dust grain size on the deposition pattern. Earth Surf. Process. Landf. 2005, 31, 130–140. [Google Scholar] [CrossRef]
  122. Utrilla, R.; Pierre, C.; Orti, F.; Pueyo, J.J. Oxygen and sulphur isotope compositions as indicators of the origin of Mesozoic and Cenozoic evaporites from Spain. Chem. Geol. Isot. Geosci. Sect. 1992, 102, 229–245. [Google Scholar] [CrossRef]
  123. Cendón, D.I.; Peryt, T.M.; Ayora, C.; Pueyo, J.J.; Taberner, C. The importance of recycling processes in the Middle Miocene Badenian evaporite basin (Carpathian foredeep): Palaeoenvironmental implications. Palaeogeogr. Palaeoclimatol. Palaeoecol. 2004, 212, 141–158. [Google Scholar] [CrossRef]
  124. Muhs, D.R.; Bettis, E.A. Quaternary loess-paleosol sequences as examples of climate-driven sedimentary extremes. Spec. Pap. Geol. Soc. Am. 2003, 370, 53–74. [Google Scholar] [CrossRef]
  125. Annan, J.D.; Hargreaves, J.C. A new global reconstruction of temperature changes at the Last Glacial Maximum. Clim. Past 2013, 9, 367–376. [Google Scholar] [CrossRef]
  126. Annan, J.D.; Hargreaves, J.C. A perspective on model-data surface temperature comparison at the Last Glacial Maximum. Quat. Sci. Rev. 2015, 107, 1–10. [Google Scholar] [CrossRef]
  127. Coudé-Gaussen, G.; Rognon, P.; Rapp, A.; Nihlen, T. Dating of peridesert loess in Matmata, south Tunisia, by radiocarbon and thermoluminescence methods. Z. Geomorphol. 1987, 31, 129–144. [Google Scholar] [CrossRef]
  128. Crouvi, O.; Sun, J.; Rousseau, D.-D.; Muhs, D.R.; Zárate, M.A.; Marx, S. Loess records. In Reference Module in Earth Systems and Environmental Sciences; Elsevier: Amsterdam, The Netherlands, 2024. [Google Scholar] [CrossRef]
  129. Poch, R.M.; Galović, L.; Husnjak, S.; Martinčević Lazar, J.; Hećej, N.; Ružičić, S.; Pjanić, A.; Álvarez, D.; Beerten, K.; Gajić, R.; et al. Soil formation and environmental reconstruction of a loess-paleosol sequence in Zmajevac, Croatia. Catena 2024, 247, 108507. [Google Scholar] [CrossRef]
  130. Peñalba, M.C. The history of the Holocene vegetation in Northern Spain from pollen analysis. J. Ecol. 1994, 82, 815–832. [Google Scholar] [CrossRef]
  131. Tallón-Armada, R.; Costa-Casais, M.; Schellekens, J.; Taboada Rodríguez, T.; Vives-Ferrándiz Sánchez, J.; Ferrer García, C.; Schaad, D.A.; López-Sáez, J.A.; Carrión Marco, Y.; Martínez Cortizas, A. Holocene environmental change in Eastern Spain reconstructed through the multi-proxy study of a pedo-sedimentary sequence from Les Alcusses (Valencia, Spain). J. Archaeol. Sci. 2014, 49, 595–607. [Google Scholar] [CrossRef]
  132. Armada, E.; Portela, G.; Roldán, A.; Azcón, R. Combined use of beneficial soil microorganisms and agrowaste residue to cope with plant water limitation under semiarid conditions. Geoderma 2014, 232–234, 640–648. [Google Scholar] [CrossRef]
Figure 1. Geological map with the location of all studied sequences.
Quaternary 08 00025 g001
Figure 2. Scheme of the loess sequences classified (boxes) by source area (see Figure 1 for their location).
Quaternary 08 00025 g002
Figure 3. Porosity images (black pores) from BSE of horizons (a) Bwk1 (GUI, 23.8 ka), (b) Bw2 (PIL, 32.3 ka), and (c) 3By5 (ALM, 42.5 ka) [36].
Quaternary 08 00025 g003
Figure 4. Carbonate-cemented horizon of the Bescanó sequence (BSC) and detail of the rhizocretions that cement this horizon.
Quaternary 08 00025 g004
Figure 5. Quera images in a soil aggregate (a), isolated as seen with a stereoscope (ALM) (b).
Quaternary 08 00025 g005
Figure 6. Magnified images of gypsum crystals from different horizons of the Mequinenza profile, highlighting their morphological variations [38].
Quaternary 08 00025 g006
Figure 7. Different types of pedogenic gypsum observed in the loess sequences (adapted from [38]).
Quaternary 08 00025 g007
Figure 8. Plot of the isotopic signatures (δ34S vs. δ18O) of pedogenic gypsum sulphate (from [38]).
Quaternary 08 00025 g008
Figure 9. δ18O and δ2H values of gypsum hydration water plotted against the GMWL, LMWLm, LMWLz, and recalculated LMWLg (dotted line) (from [38]).
Quaternary 08 00025 g009
Figure 10. Evolution of c/f relational distribution from enaulic to porphyric.
Quaternary 08 00025 g010
Figure 11. Acicular calcite from the 2Ab horizon in the Borges Blanques sequence.
Quaternary 08 00025 g011
Table 1. Luminescence dating with sampling depth, radionuclide concentration for dose rate (K, Th, and U), dose rate (DR), and dose equivalent (De) for OSL quartz, overdispersion, and resulting deposition ages (Age OSL-ka).
OSL SampleDepth (cm)nRadionuclide ConcentrationDose Rate (DR) (Gy ka−1)Over Dispersion n (%)De OSL (Gy)Age OSL (ka)
238U
(mg/kg)
232Th
(mg/kg)
40K (%)
BB1135322.8 ± 0.29.1 ± 0.51.46 ± 0.042.7 ± 0.22417.1 ± 0.86.4 ± 0.4
BB2183323.1 ± 0.210.95 ± 0.61.17 ± 0.032.6 ± 0.33826.6 ± 3.010.3 ± 1.2
EC155242.3 ± 0.17.2 ± 0.51.08 ± 0.032.1 ± 0.11442.4 ± 1.620.0 ± 1.0
EC2115242.5 ± 0.17.7 ± 0.51.09 ± 0.032.2 ± 0.11541.6 ± 1.619.1 ± 0.1
EC3255242.8 ± 0.29.1 ± 0.51.07 ± 0.032.3 ± 0.32841.3 ± 4.718.0 ± 2.1
OMS1140242.6 ± 0.18.1 ± 0.51.24 ± 0.032.4 ± 0.11550.5 ± 1.921.5 ± 1.0
OMS2330242.4 ± 0.27.9 ± 0.51.30 ± 0.042.4 ± 0.11951.3 ± 1.921.8 ± 1.1
Disclaimer/Publisher’s Note: The statements, opinions and data contained in all publications are solely those of the individual author(s) and contributor(s) and not of MDPI and/or the editor(s). MDPI and/or the editor(s) disclaim responsibility for any injury to people or property resulting from any ideas, methods, instructions or products referred to in the content.

