Article

Magnetic Susceptibility Prospecting and Geochemical Characterization of Taxco’s Mining Waste Dam Guerrero I (Mexico)

by
Juan Morales
1,*,
María del Sol Hernández Bernal
2,
Nayeli Pérez Rodríguez
1,2 and
Avto Goguitchaichvili
1
1
Laboratorio Universitario de Geofísica Ambiental, Instituto de Geofísica Unidad Michoacán, Universidad Nacional Autónoma de México, Antigua Carretera a Pátzcuaro No. 8701, Col. Ex Hacienda de San José de la Huerta, Morelia C.P. 58190, Michoacán, Mexico
2
Escuela Nacional de Estudios Superiores, Unidad Morelia, Universidad Nacional Autónoma de México, Morelia C.P. 58190, Michoacán, Mexico
*
Author to whom correspondence should be addressed.
Quaternary 2023, 6(3), 40; https://doi.org/10.3390/quat6030040
Submission received: 17 November 2022 / Revised: 1 June 2023 / Accepted: 11 June 2023 / Published: 5 July 2023

Abstract

:
Mining activity at Taxco produces seven mining waste deposits, which are problematic for the health of the community and for the environment in general. This study targets the Guerrero I mining waste dam (the youngest of the region), located south of Taxco de Alarcon, in the northern portion of Guerrero State, Mexico. This study reports the vertical magnetic susceptibility prospecting results and geochemical characterization of 27 tailing samples from the Guerrero I dam. Results from magnetic techniques provide evidence for different deposit layers of variable mineral composition, in agreement with the lithological column. The short evolution period of this relatively young dam is corroborated by the practically constant and close to 1 S-300 ratio (low oxidation degree of the magnetic mineralogy) and the mainly neutral pH character at the dam’s upper part. Most maximum concentrations of potentially toxic elements are below the maximum permissible levels for agriculture/residential use, except for those of Pb and Zn, with average enrichment factors above 90 and 50 times the corresponding regional background concentrations, respectively. Simple sample preparation and fast magnetic and X-ray fluorescence elemental concentration measurements, together with a suitable systematic sampling distribution, result in an advantageous proxy method for a quick and cost-effective heavy metal evaluation of mining waste dams.

1. Introduction

Mining is one of Mexico’s most traditional economic activities, practiced since pre-Hispanic times [1], and it is a regional expansion source since colonization. It has been present in the country’s development as an essential modernization and development factor, providing goods to virtually all industries, including construction, metallurgical, steel, chemistry, and electronics.
The Taxco Mining District (TMD) has more than 450 years of mining history. During the colonial epoch (1521–1810), Taxco mines produced large quantities of silver and gold, and were considered among America’s wealthiest mines [2]. This activity has resulted in seven mining waste deposits (El Fraile I, La Concha, El Solar, Guerrero I, Guerrero II, Los Jales, and San Antonio) in the region, encompassing more than 55 million tons [3].
Unavoidably, as the ore bodies are exhausted, or when their exploitation becomes unprofitable, mines are abandoned. Due to erosion, waste materials left in piles or deposited in dams are exposed to the effects of wind and rain. Without a vegetative cover, the waste piles spread their toxic loads into atmospheric and aquatic environments for years afterward [4].
As noted by [5], “…dust levels in the environment near the mines and waste tailings affect the quality of air in communities and agriculture soils”. Moreover, such particles were found at a distance up to 6 km away from the dams [6].
Likewise, as noted by [7], “Metals in tailings are among the most damaging legacies of mining in that they can cascade through the environment into plants and animals and eventually into human food”. These findings are supported by those of [8,9,10].
Therefore, this activity also has some negative impacts on the environment and health (e.g., [2,11,12], and references therein), which are often severe problems for mining districts. Such waste accumulations have a high polluting potential due to the high potential toxic element (PTE) concentrations, as reported in various studies (e.g., [2,11,13,14]). For this reason, the study of the distribution and concentration of potentially toxic elements (PTEs) contained in mining wastes (tailings) is currently an issue of significant relevance [13].
In a metal geochemical investigation from El Fraile I mine tailings, carried out by [11], ten samples collected from different areas on the tailing’s walls, with distinct visible characteristics, were used for chemical and mineralogical analyses. Metal contents were analyzed by inductively coupled plasma mass spectrometry (ICP-MS). High concentrations of Zn, As, Fe, and Pb (20,200, 2052, 13,670, and 22,900 ppm, respectively) with close to neutral pH values were estimated in two out of the ten samples analyzed (Group I). Group II, on the contrary, showed lower concentration values and acidic pH values.
Similarly, in a mineralogical and geochemical investigation of sulfide-bearing tailings from silver mines in Taxco, ref. [2] analyzed 113 samples from the seven mine waste dumps using inductively coupled plasma atomic emission spectroscopy (ICP-AES). As mentioned by [2], “All tailings and waste-rock accumulations show high concentrations of all studied metals, although concentrations are variable suggesting high heterogeneity among the different mine waste impoundments”.
More recently, in a geochemical investigation on the behavior of Cu and sulfur isotopes in the Taxco region, ref. [3] reported the results of twelve surficial samples from five out of the seven tailings of the area, collected from both oxidized and non-oxidized horizons. The determination of total Fe, Cu, Zn, and Pb was performed by flame atomic absorption spectrometry (FAAS). In this study, the author concluded that “Concentrations and isotopic values of sulfur and copper in rocks, tailings, soils, and precipitates, collected in the Taxco mining district, exhibited that the oxidation of both sulfide and copper-bearing minerals, controls the release of metals”.
In the studies mentioned above, the sampling strategy seems to have been based mainly on the waste-dump physical characteristics (color, oxidation state, etc.) on the one hand, and a reduced number of samples per waste dump (10, between 5 and 15, and 2, respectively) on the other, rather than on a systematic and exhaustive approach. The reduced number of samples per waste dump that were taken could be justified because the above-mentioned standard methodologies require ultra-pure facilities, considerable processing time, and are generally expensive due to the high-purity reagents required.
Due to this situation, an alternative and complementary procedure allowing reliable estimation of PTE concentration economically and rapidly is desirable; this would enable economic resources and time to be focused on areas with the most significant impact or interest.
More than two decades ago, different investigations showed the correlation between magnetic susceptibility and heavy metal content [15,16,17,18]. This correlation has been attributed to the incorporation of heavy metal elements into the lattice structure of ferrimagnetic minerals during combustion, or alternatively to their adsorption onto the surface of the ferrimagnetic materials present in the environments [15].
Although magnetic methods are broadly employed at present in most areas of environmental investigation as a proxy for heavy metal pollution in industrial (e.g., [15,16,17]) and urban regions (e.g., [18,19]), mining wastes, however, have hardly been investigated with magnetic methods [20].
Apart from a study carried out in a metallurgical area in San Luis Potosi State, Mexico [21], and those studies accomplished in two western Mexico mining districts [22] and Angangueo [23], magnetic methods have not been systematically employed in the study of mining wastes.
The results of a systematic and exhaustive rock-magnetic and geochemical investigation of the Guerrero I mining waste deposits (the youngest in the region) are presented, highlighting their variations with the dam’s depth. Magnetic, chemical, and physicochemical methods were applied to achieve this goal.

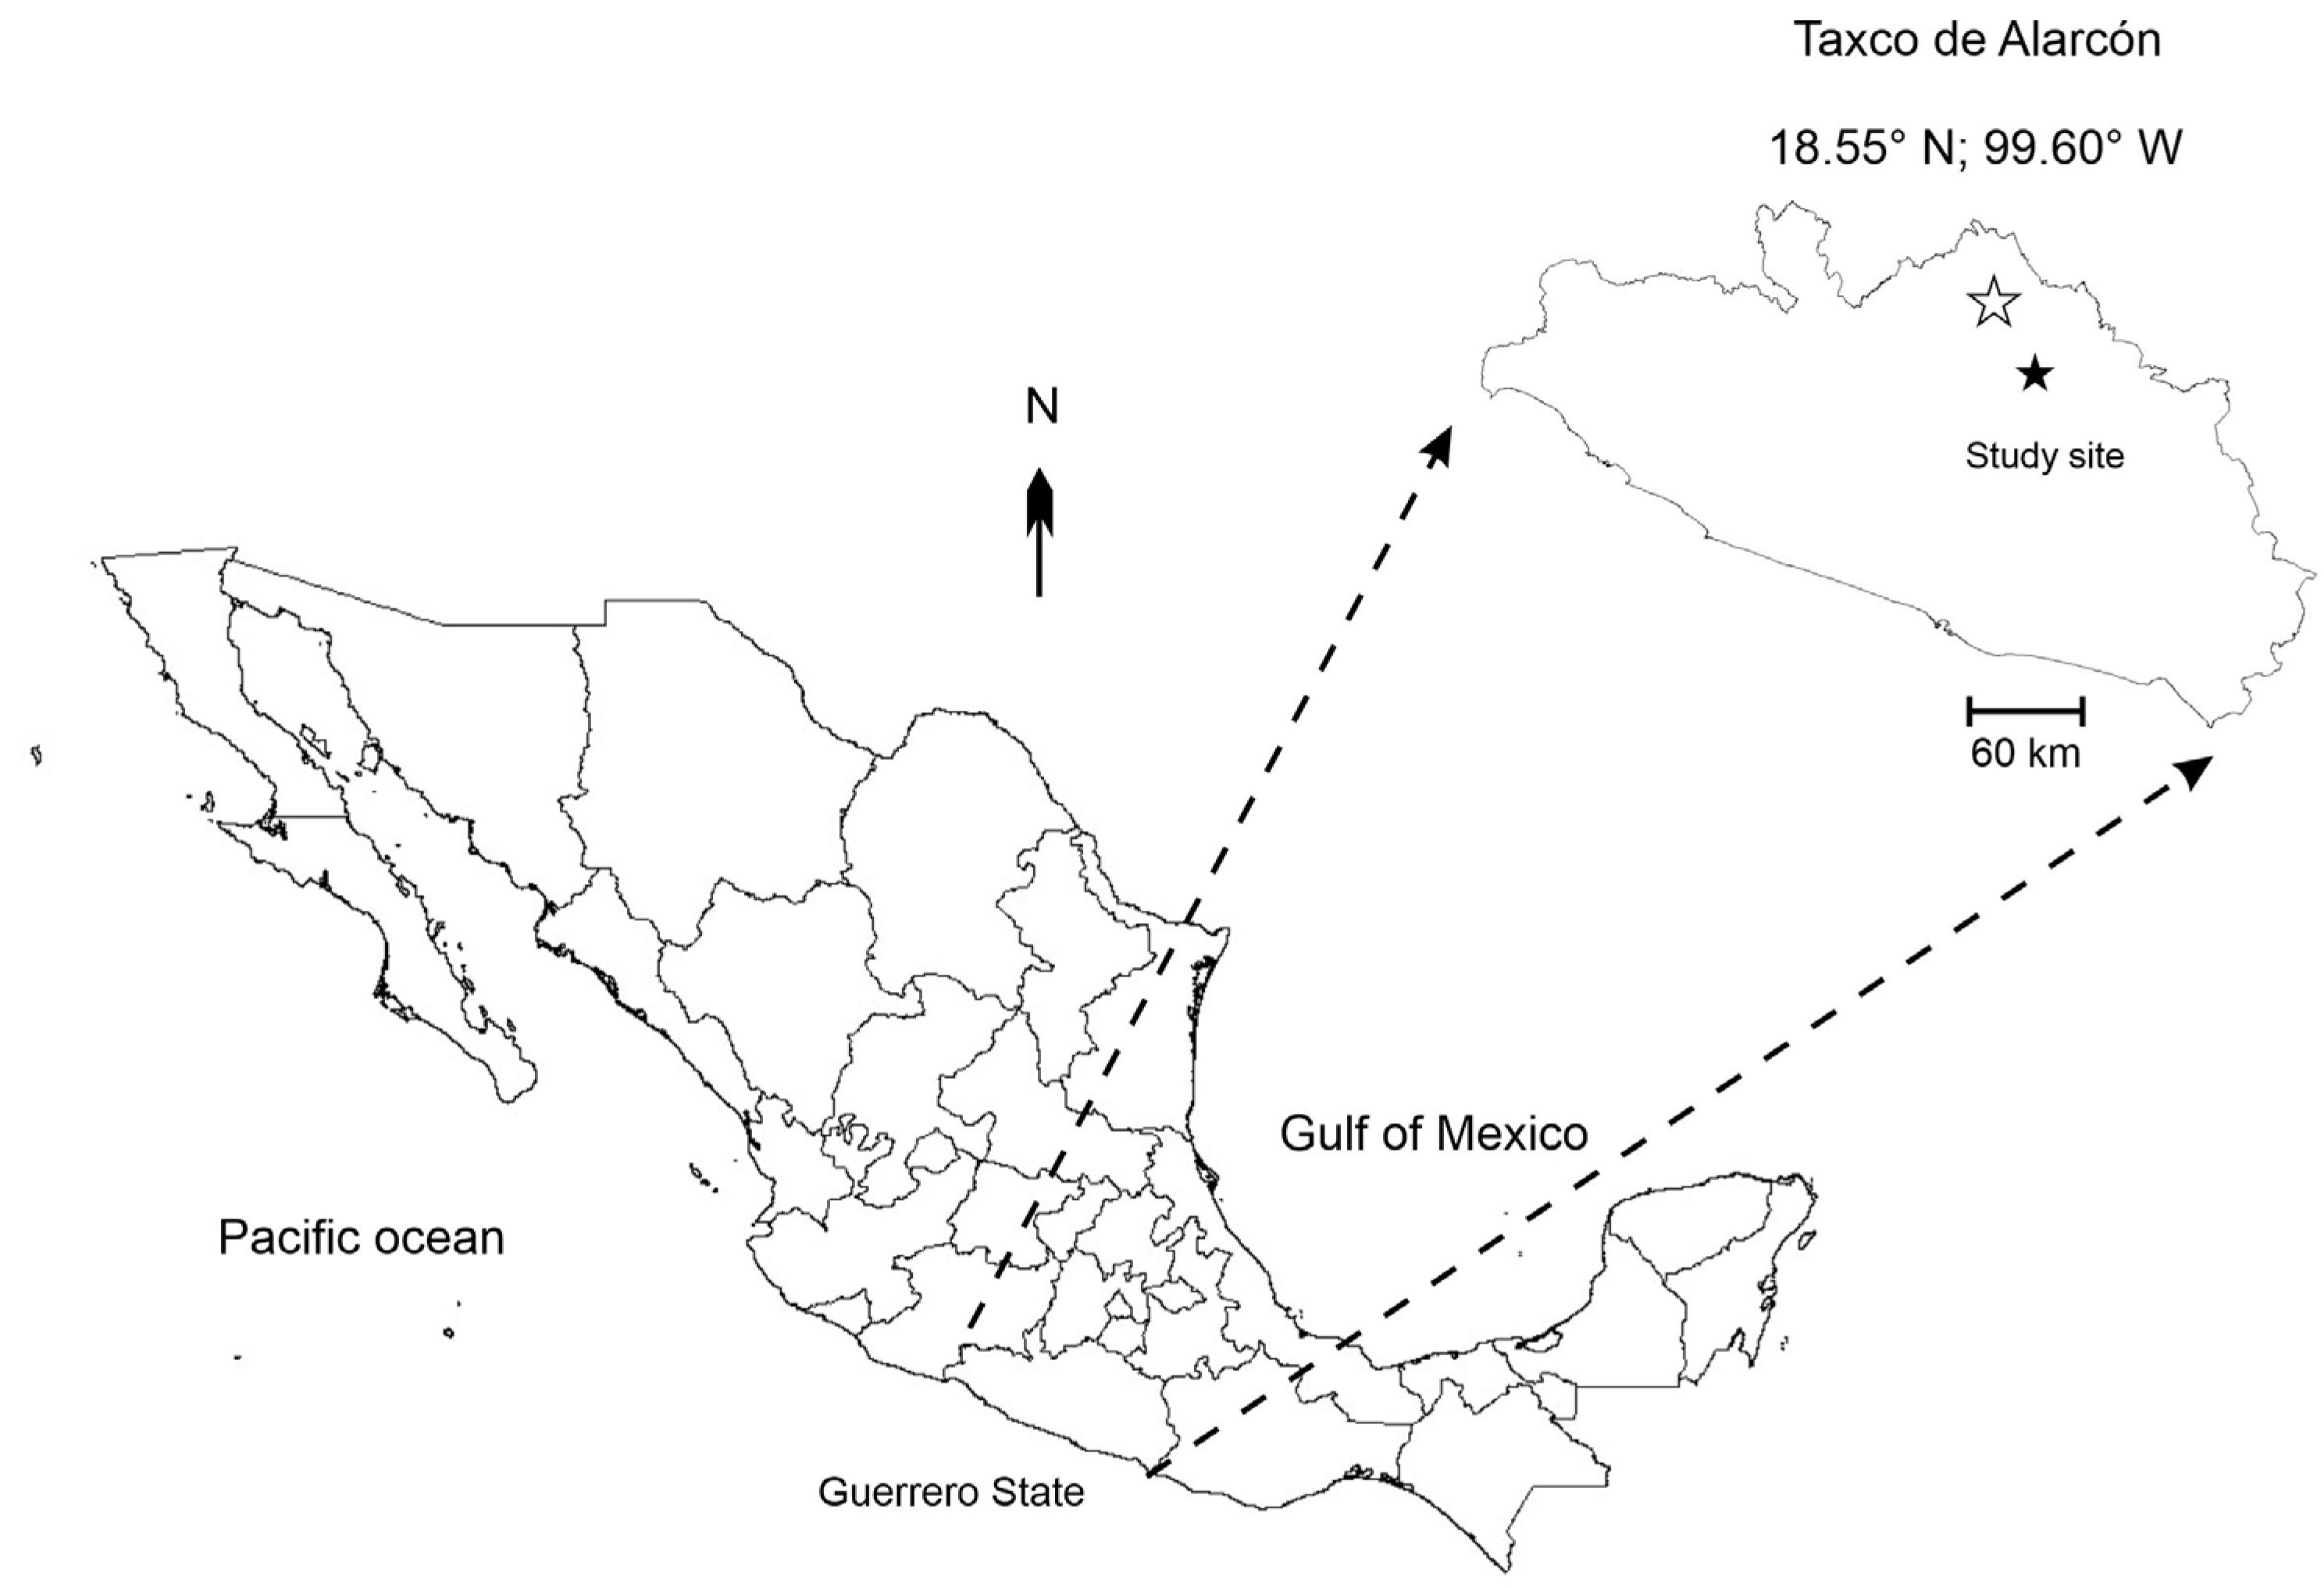
2. Study Area and Historical Background

The TMD is located south of Taxco de Alarcón, the Guerrero State’s northern area (Figure 1). Mineralization in the TMD primarily arises in hydrothermal veins, replacement ores, and stockworks hosted in limestones of the Morelos and Mexcala formations, but also, although less frequently, in the Taxco Schists and Balsas formations [24]. Up to 50 important mineralized structures (500–2000 m in length and 1–10 m in width) have been identified [3].
The TMD’s long mining history of more than 450 years has yielded seven mining waste deposits (El Fraile I, La Concha, El Solar, Guerrero I, Guerrero II, Los Jales, and San Antonio) in the region, encompassing more than 55 million tons [3].
The Guerrero tailings comprise two deposits, Guerrero I and Guerrero II, located at ~3.5 km south-east of Taxco. The Guerrero I dam (~420 m × 300 m × 90 m) contains the entire district’s most recent waste. It has a grayish color; the material is anhydrous and unconsolidated. Guerrero II tailings are oxidized, have an ochre-reddish color, are consolidated, and are widely spread in the riverside and bed of the Xochula creek [3].

3. Materials and Methods

A field campaign was done at the TMD, where twenty-seven tailing samples from the Guerrero I dam were collected. Sampling was carried out from the top to the dam’s base, making it as representative as possible, paying particular attention to the changes in the characteristics between the different horizons, both vertically and horizontally. Figure 2 shows the sampling points at the Guerrero I dam. Samples (~500 g) were placed into labeled and georeferenced polyethylene bags.
Mineralogy identification was carried out by microscopic observation of the samples spread on a petri dish. Sample preparation for magnetic analysis consisted of manually crushing ~250 g of the sample up to a particle size of clay using an agate mortar. Acrylic cubes (23 mm per side) were tightly packed with the pulverized and homogenized samples for magnetic analysis. Sample preparation for geochemical analysis consisted of mixing 3 g of the crushed and homogenized material with 0.5 g of wax-C micro powder (Hoechst) using a precision balance (Scout pro; accuracy 0.01 g). Both components were manually homogenized using the same mortar. Once homogenized, the mix was deposited into a 3 mm diameter stainless-steel die, pressed, and held under up to 20 tons of pressure for two minutes with an Atlas hydraulic press aid (Specac, Washington, DC, USA), obtaining pressed-pellet samples. Finally, for physicochemical analyses, 5 g of the material was dissolved into 50 mL of distilled water and stirred for half an hour so that the salts were dissolved in their entirety.
A set of different magnetic, geochemical, and physicochemical techniques were used to characterize the studied samples: (i) Magnetic susceptibility measurements at low (κLF) and high (κHF) frequency using a Bartington MS2 magnetic susceptibility meter [25].
From these results, the percent frequency-dependent magnetic susceptibility was calculated.
κ F D % = 100 × κ L F κ H F   κ L F ,
(ii) Acquisition of stepwise isothermal remanent magnetization (IRM) curves employing an IM-10 (ASC Scientific, Narragansett, RI, USA) pulse magnetizer. Magnetization acquired at 700 mT was taken as the saturation isothermal magnetization (SIRM). (iii) Induction of a backfield magnetization at 300 mT (IRM-0.3 T) for the S-300 ratio estimation, according to the following formula:
S - 300 = I R M - 0.3   T S I R M ,
Remanent magnetizations were measured using an Agico JR-6 spinner magnetometer.
The samples’ chemical composition (both major and trace elements) was obtained through energy dispersive (ED) X-ray fluorescence using a 50 kV tube (Xenemetrix, Austin, TX, USA) X-Calibur ED-XRF. An HI 2020 multi-parametric kit was used to determine physical-chemical properties (pH and EC).
All analyses were carried out at the Laboratorio Universitario de Geofísica Ambiental (LUGA) facilities, Instituto de Geofísica Unidad Michoacán.

4. Results

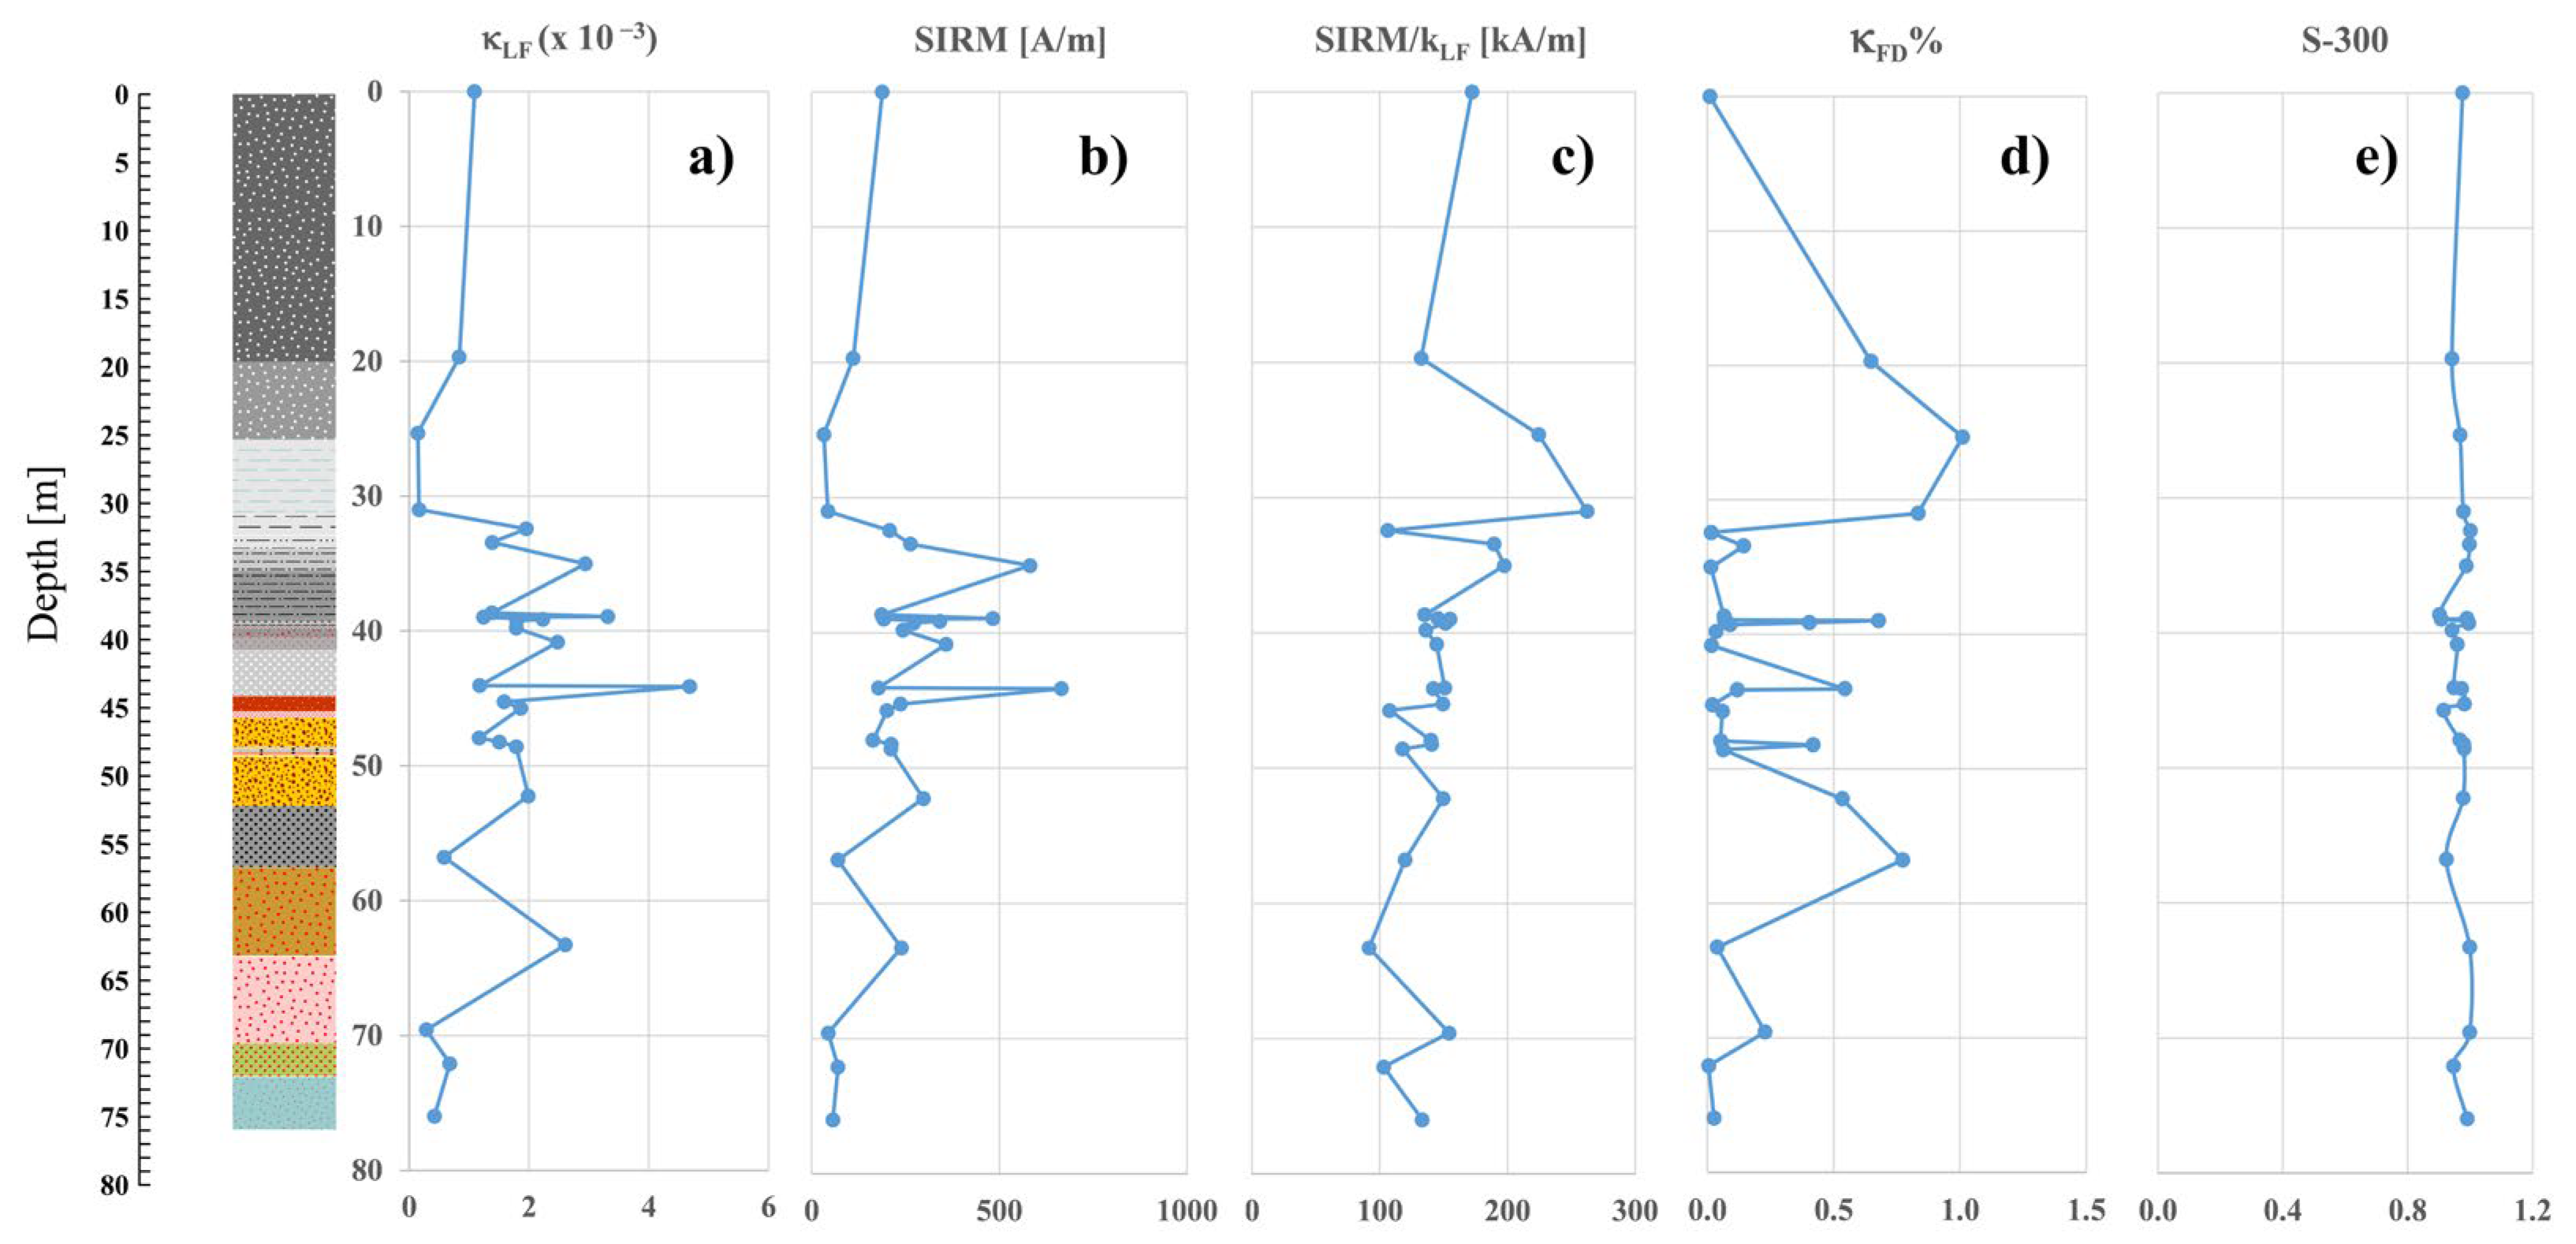
4.1. Physical and Magnetic Results

Based on the sampling strategy followed in this investigation, which focused on taking representative samples of the different recognizable strata in the field, a tentative lithological column of the dam is proposed (Figure 3). It is worth noting that the distribution of the sampling was not at regular intervals, because no extra information would have been obtained, for example, by obtaining twenty samples taken every 1 m from the first 20 m in depth. In addition, one must note that the construction of a representative lithological column would require flat layers over the whole surface of the impoundment—a fact hard to corroborate without obtaining a core.
A series of dark-/light-gray layers characterize the Guerrero I dam surface at its upper part, mainly composed of slightly- to well-consolidated grains, from fine sand grains up to clay grain size. At the dam’s central part (35.0–45.3 m thickness), an alternated partially-/well-consolidated thin-layer sequence (0.1–0.5 m width) with varying colors (dark-/light-gray, gray-reddish, and ochre) is observed. On the contrary, the lower part (48.6–72.1 m) is characterized by six well-consolidated red, ochre-reddish, and green color layers, except at the base, where partially consolidated thin layers are observed. Table 1 summarizes the textural and mineralogical characteristics of the analyzed samples.
Magnetic susceptibility (κ) vertical-survey results for the Guerrero I dam are shown in Figure 4a. From the summit (0.0 m) up to a depth of 19.7 m, κ presents a slight reduction of 23% (1.09 × 10⁻³–0.84 × 10⁻³) through this ~20.0 m wide dark-gray layer. Below this stratum underlays two light-gray layers (5.6 and 5.7 m width, respectively) with significantly lower values of 0.145 and 0.166 × 10⁻³, respectively. A thinner 1.4 m wide dark-gray layer, with almost twice the value (1.96 × 10⁻³) than the one at the summit, lays below the above-described layers. Within the thin-layer sequence described above, alternating κ values are found up to a depth of 48.6 m. Six intercalated layers (1.0, 1.6, 3.6, 1.0, 3.2, and 2.2 m-width) are also observed within it. A maximum κ value of 4.68 × 10⁻³ was obtained at a depth of 44.1 m, which corresponds to a 1.2 m wide reddish layer. The last six layers (2.5–6.5 m wide) are mainly characterized by red, ochre-reddish, and green colors with alternating κ values. The last two layers show significantly lower κ values.
The SIRM plot (Figure 4b) shows a similar trend. These variations could be attributed either to variations in concentration or composition of the magnetic mineralogy. However, since κ and SIRM are mostly sensitive to the concentration of the magnetic mineralogy [26], the ratio of SIRM to magnetic susceptibility (SIRM/κ, Figure 4c) depends chiefly on the iron oxides mineralogy, rather than on the concentration [26]. This fact seems to be reflected in the characteristic color of the different layers (see above).
Frequency-dependent magnetic susceptibility (κFD%) shows an antisymmetric trend (Figure 4d) to that followed by κ (Figure 4a). It gradually increases up to 1% within the first two layers from almost a zero value at the top. κFD% reduces to its original value within the following two layers. Within the thin-layer sequence mentioned above, κFD% also shows an alternating behavior between 0 and 0.7%. Finally, in the lowermost part, κFD% shows an antisymmetric trend of κ. These low κFD% values suggest a low (fine particle size) superparamagnetic content, especially in the middle part of the dam. The S-300 ratio, on the contrary, shows a very stable behavior (Figure 4e), with an average value of 0.967, suggesting an almost constant and negligible hematite contribution.

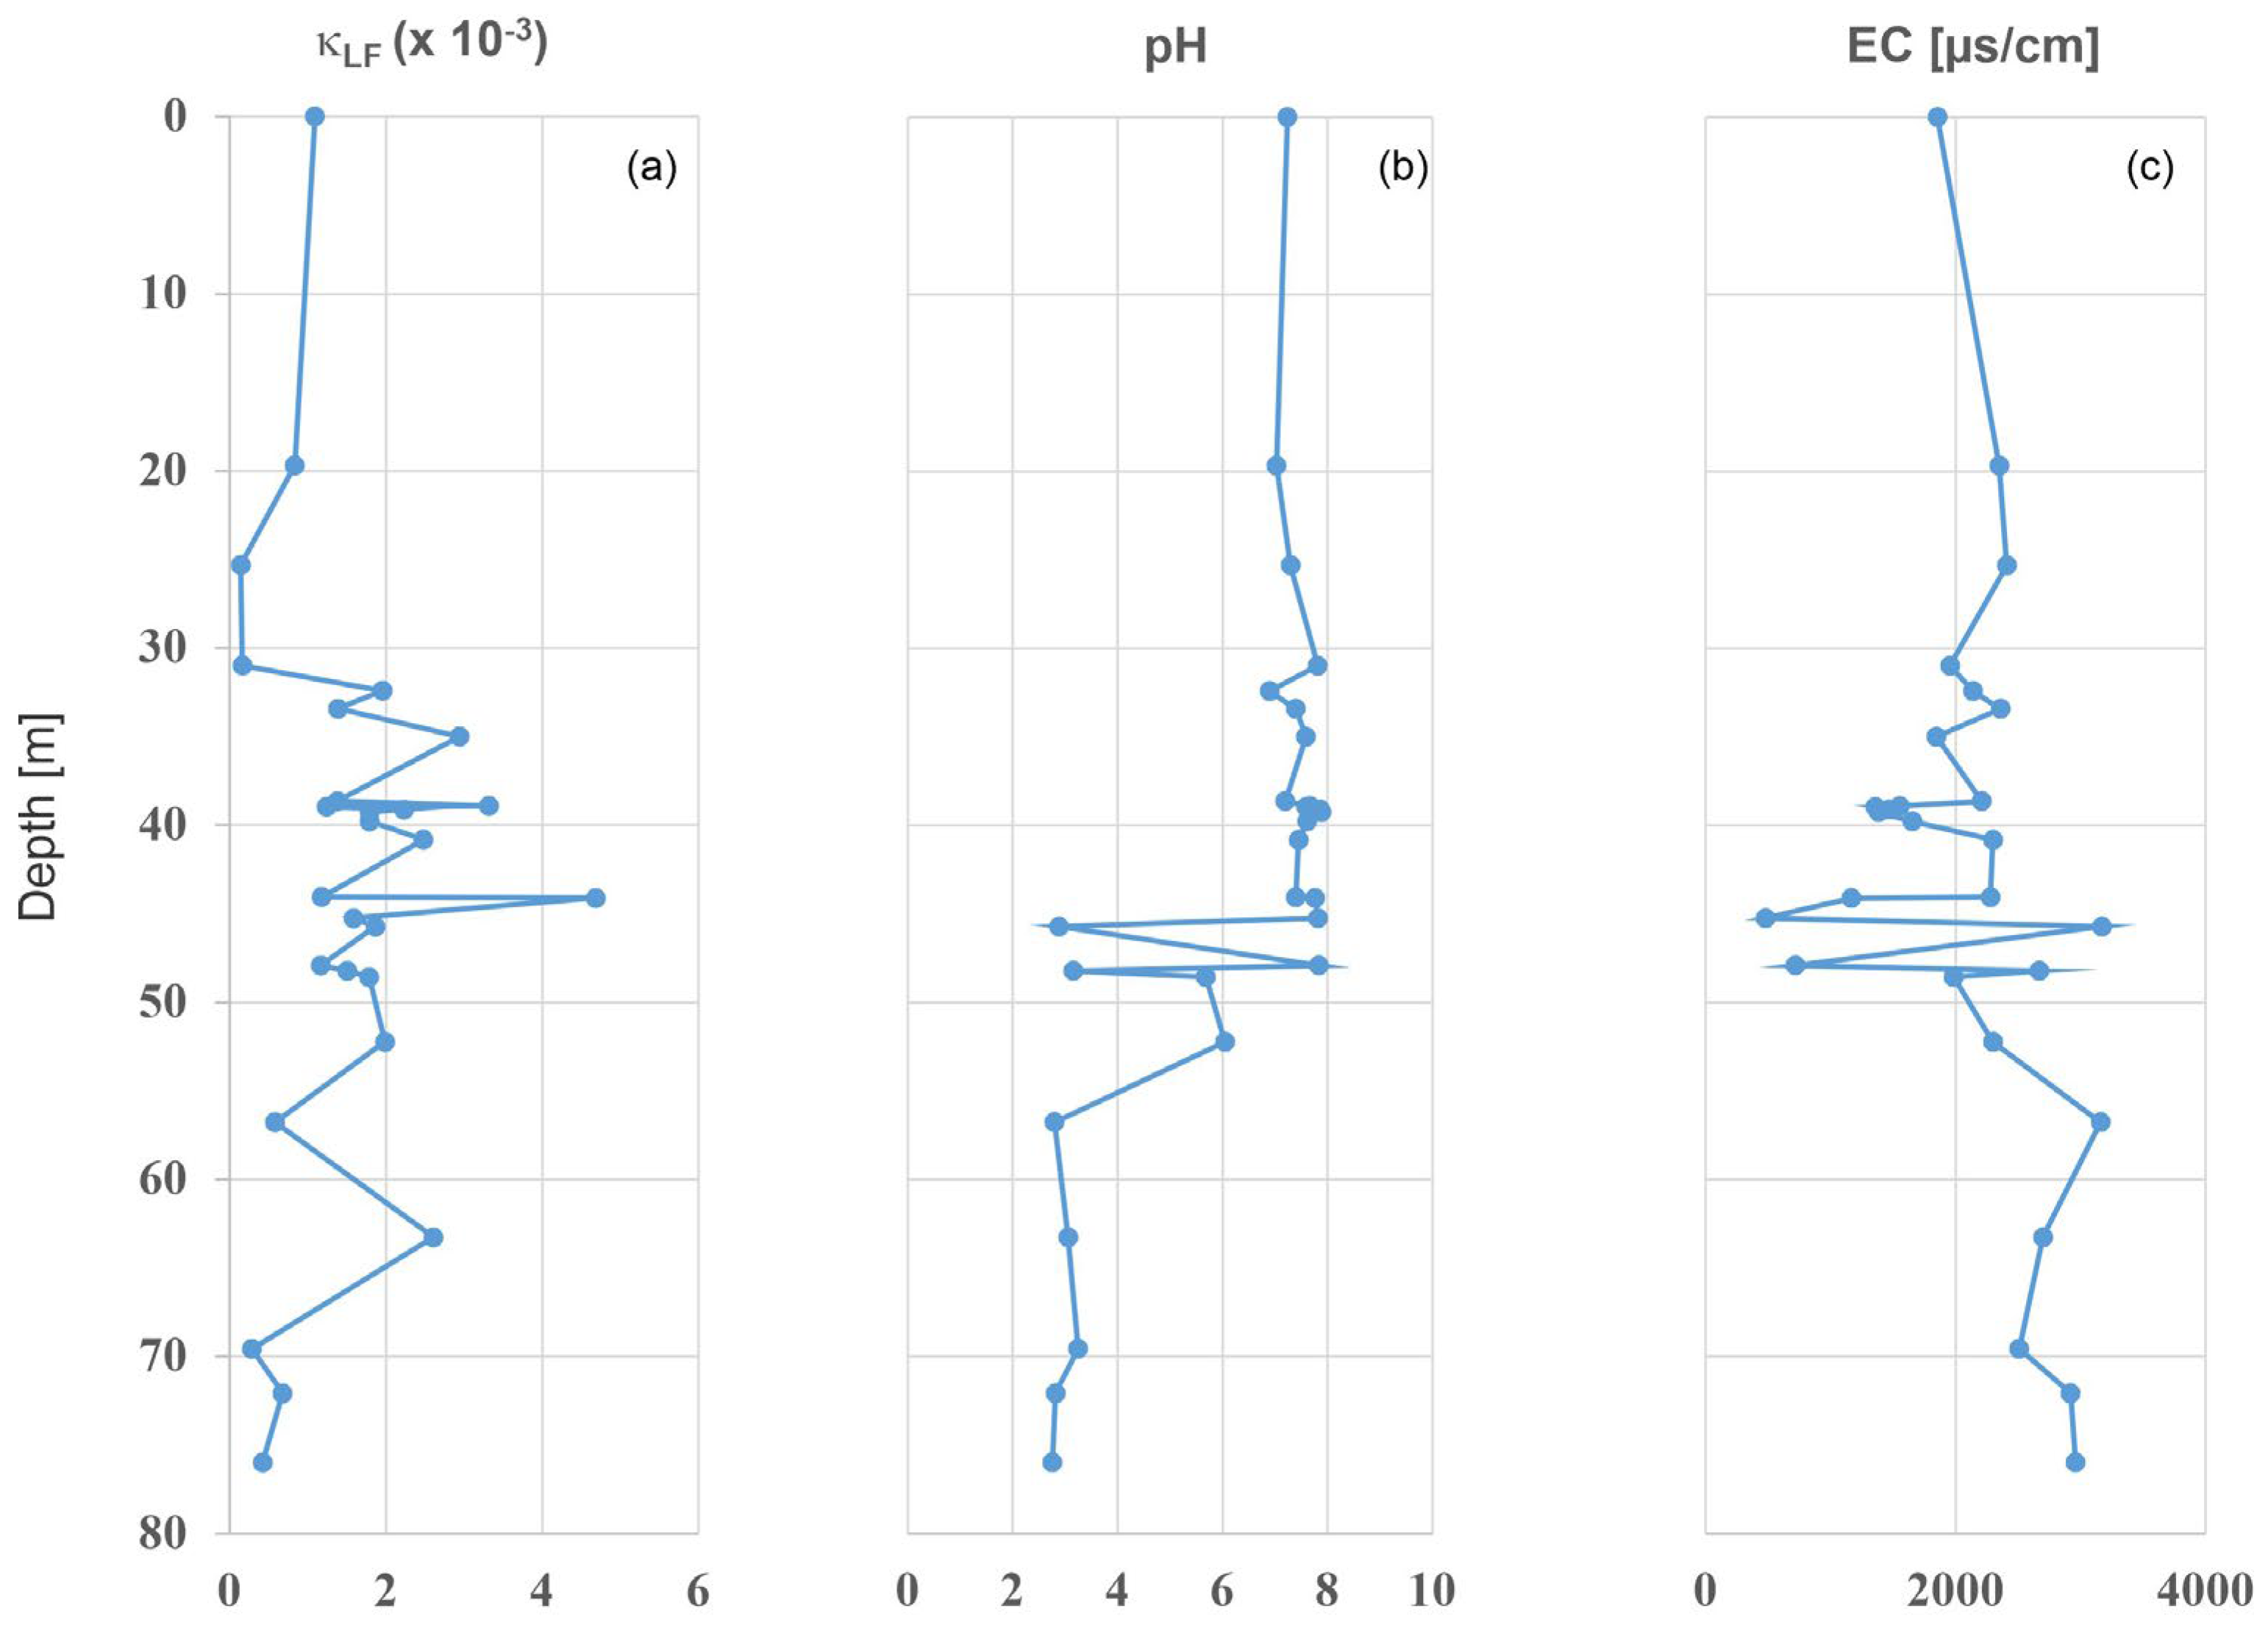
4.2. Physicochemical Results

Regarding the physicochemical parameters, an average, almost neutral, pH of 7.5 was obtained from the summit up to 45.3 m depth (Figure 5b). Figure 5a is again reproduced for comparison purposes. From this point, and up to 52.2 m depth, a zig-zag behavior in the pH values is observed. From this depth up to the dam’s base, an average acidic pH of 2.9 is observed.
While pH is the measurement of a specific ion (i.e., hydrogen) within a sample, electrical conductivity is a non-specific measurement of the concentration of both positively and negatively charged ions within it. As shown in Figure 5c, EC shows an antisymmetric trend to that of pH. This antisymmetric behavior could be likely explained by considering that the presence of any hydrogen ions present in a substance will affect the pH level and, most probably, also influence conductivity levels. Nevertheless, hydrogen ions make up only a small part of the ion concentration measured by a conductivity meter.

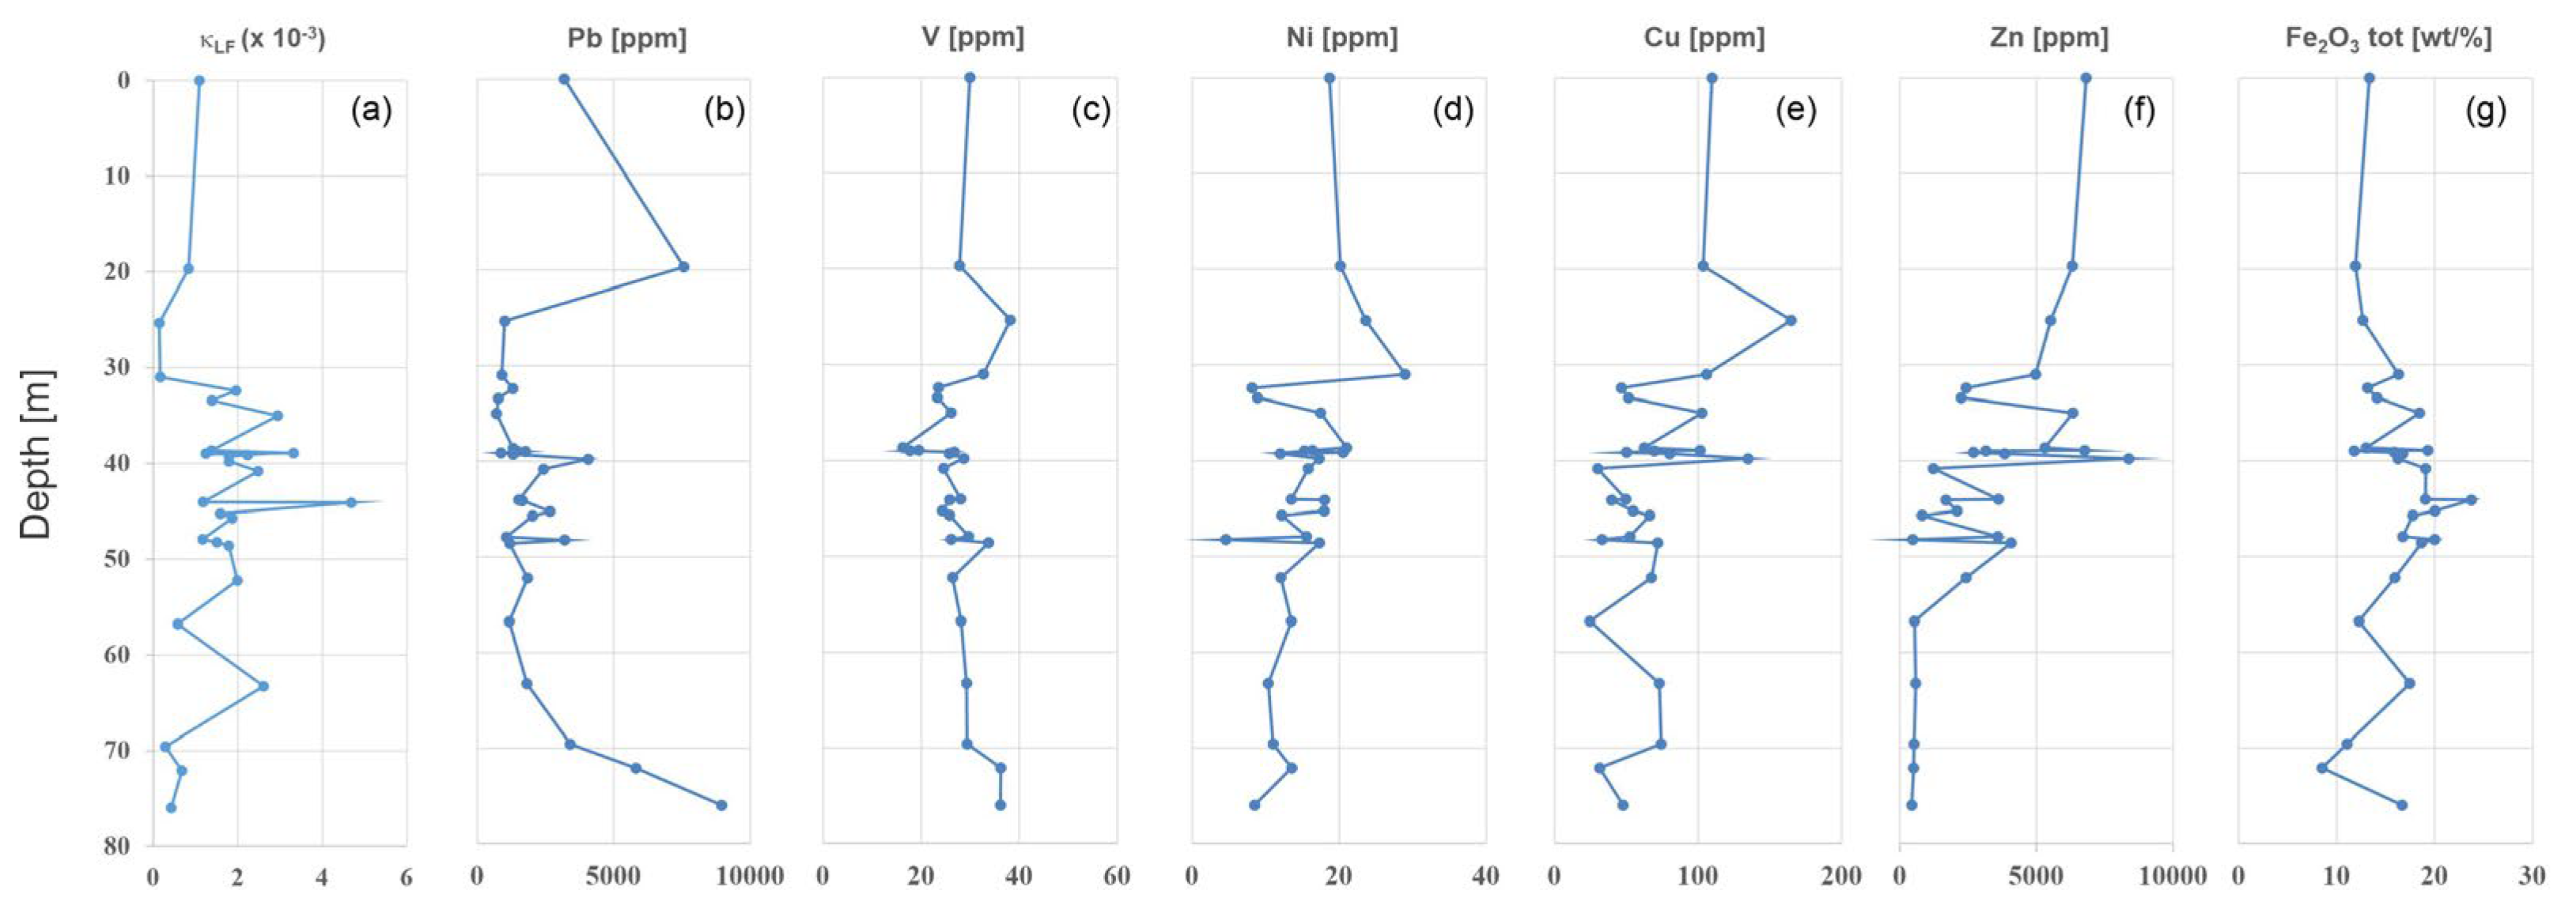
4.3. Geochemistry Results

Contrary to the trend followed by κ, Pb concentration shows an increase of almost 100% through the ~20.0 m wide dark-gray upper layer; those of V, Ni, Cu, Zn, and Fe show a slight decrease. Pb concentration abruptly decreases at ~one-third of its initial value within the first light-gray layer, while those of V, Ni, Cu, and Fe show an increase. At the second light-gray layer, Pb, Ni, and Fe concentrations increased, and those of V, Cu, and Zn decreased (Figure 6b–g).
Within the above-described varying-color thin-layer sequence (43.6–27.4 m deep), an alternating concentration value for the six elements mentioned above is also observed, as in the case of κ. Below this sequence, the Pb concentration gradually increases to almost 300% of its initial value at the dam’s bottom, which likely suggests that Pb is percolating towards the base. V and Ni remain practically constant, Zn shows an abrupt fall of nearly 90% within the two uppermost last layers (3.6 and 4.6 m deep), and Cu and Fe present moderate alternating changes.
Following [2], metal concentrations of tailings are compared to regional background concentrations (RBC) of crop soils to determine enrichment ratios of tailings relative to regional pristine soils. Through this comparison, it is evident that the Guerrero I tailings are highly enriched, mainly in Pb and Zn. A summary of the elemental composition and the corresponding statistical description of κ and PTE concentrations in the Guerrero I tailing samples is presented in Table 2.

5. Discussion

Magnetic susceptibility (and SIRM, as well) vertical survey clearly stands out the presence of different layers of variable ferrimagnetic mineral concentration and/or composition. Moreover, within-layer mineral composition differences follow straightforwardly from the SIRM/κ ratio values. These results reinforce the findings of [2,11] regarding the high heterogeneity among the different mines’ waste impoundments.
The results mentioned above are in good agreement with the (pseudo) lithological column proposed; variations in the lithology are followed by variations in the corresponding magnetic susceptibility and/or SIRM values, at least for the profile investigated.
Also, provided a correlation between additional parallel magnetic susceptibility surveys is obtained, one could be confident about the real thickness of the layers and, therefore, the dam’s likely stratigraphy.
However, although obtaining a sedimentary core could provide a precise knowledge of the layers’ thickness, this would not warrant the homogeneity of the layer or its entire flatness over the dam and would require different cores to be obtained.
Unfortunately, waste impoundments are, at least in Mexico, unattended entities and, after some time, used by the inhabitants. However, neither a government nor a particular company would invest time, effort, and economic resources to investigate the dam’s internal structure. This fact highlights the usefulness of magnetic susceptibility, and associated magnetic parameters, as a proxy for the investigation of waste dams.
The dam’s youth is reflected by the practically constant and close to 1 S-300 ratio (low oxidation degree of the magnetic mineralogy), in good agreement with the field observations of [3]. This result is supported by the average, slightly alkaline (7.5), pH value obtained for almost three-quarters of the depth studied, from the summit up to 45.3 m deep (Figure 5b). Only the last quarter, from a depth of ~50 m up to the dam’s base, presents an average acidic (2.9) pH. These two average pH values agree well with those of the unoxidized (T7) and oxidized (T8) tailings samples reported by [3].
From the results presented in the matrix correlation (Table 3), a moderate inverse correlation between Pb and V contents and concentration-dependent magnetic characteristics (κ, SIRM) is observed, in good agreement with previous studies [20,23]. This inverse correlation is also observed between Ni, Cu, and Zn, and depth. This is much more evident in the case of Zn.
On the contrary, a direct correlation holds between Pb and pH, as noted in Section 4.3. This abrupt Pb enhancement could be due to the acid mine drainage (AMD) produced by the oxidation of sulfide minerals [3,11], which led to the release of Pb.
As can be noted, the results presented here agree with those of previous studies. However, the systematic sampling distribution employed in this investigation enables us to obtain a broader view of the concentration and distribution within these deposits.
Additionally, the simple and non-destructive sample preparation, together with fast elemental concentration estimations, represents an advantageous proxy method for a quick and cost-effective evaluation of contamination by heavy metals.
Finally, the comparison of these results against those obtained using similar methodology from an older dam (El Fraile, in preparation), will enable us to investigate the evolution of mining wastes.

6. Conclusions

Magnetic susceptibility (and SIRM, as well) vertical survey highlights different layers of variable ferrimagnetic mineral concentration or composition, in agreement with the (pseudo) lithological column proposed. Within-layer mineral composition differences follow straightforwardly from the ratio SIRM/κ values. The results mentioned above stand out the usefulness of the magnetic methods as a proxy for stratigraphy and mineral composition of a depositional sequence.
The dam’s youth is reflected by the practically constant and close to 1 S-300 ratio (low oxidation degree of the magnetic mineralogy) and the dam’s mainly alkaline pH character. Because of its youth, health hazards are mainly due to the high Pb concentrations at its base.
By comparison with the RBC of crop soils, it is evident that the Guerrero I tailings are highly enriched, mainly in Pb and Zn.
Most maximum PTE concentration values are below the maximum permissible levels for agriculture/residential use, except for those of Pb and Zn.
Simple (and non-destructive) sample preparation and fast elemental concentration estimations, together with a suitable systematic sampling distribution, make XRF measurements an advantageous proxy method for a quick and cost-effective evaluation of contamination by heavy metals.

Author Contributions

Conceptualization, J.M. and M.d.S.H.B.; methodology, J.M.; formal analysis, J.M. and N.P.R.; investigation, J.M.; writing—original draft preparation, J.M.; writing—review and editing, M.d.S.H.B., N.P.R. and A.G.; All authors have read and agreed to the published version of the manuscript.

Funding

This research received no external funding.

Data Availability Statement

The datasets used and/or analyzed during the current study are available from the corresponding author upon reasonable request.

Acknowledgments

We thank the three reviewers for their constructive comments and suggestions, which definitively improved the scientific content and the manuscript presentation. Undergraduate student Julio Gómez Rivera is acknowledged for his participation in the fieldwork and laboratory measurements. Gabriela Solis-Pichardo (Instituto de Geología, UNAM) is broadly acknowledged for the careful review of the manuscript.

Conflicts of Interest

The authors declare no conflict of interest.

References

  1. Corona Chávez, P.; Uribe Salas, J.A.; Razo Pérez, N.; Martínez Medina, M.; Maldonado Villanueva, R.; Ramos Arroyo, Y.R.; Robles Camacho, J. The impact of mining in the regional ecosystem: The Mining District of El Oro and Tlalpujahua, Mexico. De Re Met. 2010, 15, 21–34. [Google Scholar]
  2. Talavera-Mendoza, O.; Yta, M.; Moreno, R.; Dótor, A.; Flores, N.; Duarte, C. Mineralogy and geochemistry of sulfide-bearing tailings from silver mines in the Taxco, Mexico area to evaluate their potential environmental impact. Geofísica Int. 2005, 44, 49–64. [Google Scholar] [CrossRef]
  3. Dótor-Almazán, A.; Armienta-Hernández, M.A.; Oscar Talavera-Mendoza, O.; Ruiz, J. Geochemical behavior of Cu and sulfur isotopes in the tropical mining region of Taxco, Guerrero (southern Mexico). Chem. Geol. 2017, 471, 1–12. [Google Scholar] [CrossRef]
  4. International Institute for Environment and Development (IIED). Mining for the Future: Appendix C Abandoned Mines Working Paper; Mining Minerals Sustain Development: London, UK, 2002; Volume 28, pp. 1–20. [Google Scholar]
  5. Boussen, S.; Soubrand, M.; Bril, H.; Ouerfelli, K.; Abdeljaouad, S. Transfer of lead, zinc and cadmium from mine tailings to wheat (Triticum aestivum) in carbonated Mediterranean (Northern Tunisia) soils. Geoderma 2013, 192, 227–236. [Google Scholar] [CrossRef]
  6. Castillo, S.; de la Rosa, J.D.; de la Campa, A.M.S.; González-Castanedo, Y.; Fernández-Caliani, J.C.; Gonzalez, I.; Romero, A. Contribution of mine wastes to atmospheric metal deposition in the surrounding area of an abandoned heavily polluted mining district (Rio Tinto mines, Spain). Sci. Total. Environ. 2013, 449, 363–372. [Google Scholar] [CrossRef]
  7. Cross, A.T.; Stevens, J.C.; Dixon, K. One giant leap for mankind: Can ecopoiesis avert mine tailings disasters? Plant Soil 2017, 421, 1–5. [Google Scholar] [CrossRef]
  8. Armienta, M.A.; Beltrán, M.; Martínez, S.; Labastida, I. Heavy metal assimilation in maize (Zea mays L.) plants growing near mine tailings. Environ. Geochem. Health 2019, 42, 2361–2375. [Google Scholar] [CrossRef]
  9. Duan, Z.; Luo, Y.; Wu, Y.; Wang, J.; Cai, X.; Wen, J.; Xu, J. Heavy metals accumulation and risk assessment in a soil-maize (Zea mays L.) system around a zinc-smelting area in southwest China. Environ. Geochem. Health 2021, 43, 4875–4889. [Google Scholar] [CrossRef]
  10. Bautista, F.; Gonsebatt, M.E.; Cejudo, R.; Goguitchaichvili, A.; Delgado, M.C.; Morales, J.J. Evidence of small ferrimagnetic concentrations in mice (Mus musculus) livers and kidneys exposed to the urban dust: A reconnaissance study. Geofísica Int. 2018, 57, 79–86. [Google Scholar] [CrossRef]
  11. Armienta, M.A.; Talavera, O.; Morton OBarrera, M. Geochemistry of Metals from Mine Tailings in Taxco, Mexico. Bull. Environ. Contam. Toxicol. 2003, 71, 387–393. [Google Scholar] [CrossRef]
  12. Ramos-Arroyo, Y.R.; Prol-Ledesma, R.M.; Siebe-Grabach, C. Características geológicas y mineralógicas e historia de extracción del Distrito de Guanajuato, México. Posibles escenarios geoquímicos para los residuos mineros. Rev. Mex. Cienc. Geol. 2004, 21, 268–284. [Google Scholar]
  13. Talavera-Mendoza, O.; Armienta, M.; García, J.; Flores, N. Geochemistry of leachates from the El Fraile I sulfide tailings piles in Taxco, Guerrero, southern Mexico. Environ. Geochem. Health 2006, 28, 243–255. [Google Scholar] [CrossRef] [PubMed]
  14. Méndez, M.; Armienta, M. Distribución de Fe, Zn, Pb, Cu, Cd y as originada por residuos mineros y aguas residuales en un transecto del Río Taxco en Guerrero, México. Rev. Mex. Cienc. Geol. 2012, 29, 450–462. [Google Scholar]
  15. Petrovsky, E.; Kapička, A.; Zapletal, K.; Šebestova, E.; Spanilá, T.; Dekkers, M.; Rochette, P. Correlation between magnetic parameters and chemical composition of lake sediments from northern Bohemia—Preliminary study. Phys. Chem. Earth 1998, 23, 1123–1126. [Google Scholar] [CrossRef] [Green Version]
  16. Petrovsky, E.; Kapicka, A.; Jordanova, N.; Boruvka, L. Magnetic properties of alluvial soils contaminated with lead, zinc and cadmium. J. Appl. Geophys. 2001, 48, 127–136. [Google Scholar] [CrossRef]
  17. Ďurža, O. Heavy metals contamination and magnetic susceptibility in soils around metallurgical plant. Phys. Chem. Earth 1999, 24, 541–543. [Google Scholar] [CrossRef]
  18. Shu, J.; Dearing, J.A.; Morse, A.P.; Yu, L.Z.; Yuan, N. Determining the sources of atmospheric particles in Shanghai, China, from magnetic and geochemical properties. Atmos Environ. 2001, 35, 2615–2625. [Google Scholar] [CrossRef]
  19. Aguilera, A.; Morales, J.J.; Goguitchaichvili, A.; García-Oliva, F.; Armendariz-Arnez, C.; Quintana, P.; Bautista, F. Spatial distribution of magnetic material in urban road dust classified by land use and type of road in San Luis Potosí, Mexico. Air Qual. Atmos. Health 2020, 13, 951–963. [Google Scholar] [CrossRef]
  20. Matasova, G.G.; Kazansky, A.Y.; Bortnikova, S.B.; Airijant, A.A. The use of magnetic methods in an environmental study of áreas polluted with non-magnetic wastes of the mining industry (Salair region, Western Siberia, Russia). Geochem. Explor. Env. Anal. 2005, 5, 75–89. [Google Scholar] [CrossRef]
  21. Pérez, I.; Romero, F.M.; Zamora, O.; Gutiérrez-Ruiz, M.E. Magnetic susceptibility and electrical conductivity as a proxy for evaluating soil contaminated with arsenic, cadmium and lead in a metallurgical area in the San Luis Potosi State, Mexico. Environ. Earth Sci. 2014, 72, 1521–1531. [Google Scholar] [CrossRef]
  22. Morales, J.; Hernández-Bernal, M.D.S.; Corona-Chávez, P.; Gogichaishvili, A.; Bautista, F. Further evidence for magnetic susceptibility as a proxy for the evaluation of heavy metals in mining wastes: Case study of Tlalpujahua and El Oro Mining Districts. Environ. Earth Sci. 2016, 75, 309. [Google Scholar] [CrossRef]
  23. Hernández-Bernal, M.D.S.; Morales, J.; Corona-Chávez, P.; Goguitchaichvili, A.; Bautista, F. Combined rock-magnetic and geochemical characterization of Angangueo mining district, central Mexico. Environ. Earth Sci. 2016, 75, 1287. [Google Scholar] [CrossRef]
  24. IMSA. Geology and Ore Deposits of the Taxco Mining District; Interim Report; IMSA: Guerrero, México, 1978; 40p. [Google Scholar]
  25. Dearing, J.A. Using the BartingtonMS2 System; Environmental Magnetic Susceptibility; Bartington Instruments Ltd.: Witney, UK, 1999. [Google Scholar]
  26. Thompson, R.; Stober, J.C.; Turner, G.M.; Oldfield, F.; Bloemendal, J.; Dearing, J.A.; Rummery, T.A. Environmental Applications of Magnetic Measurements. Science 1980, 207, 481–486. [Google Scholar] [CrossRef] [PubMed] [Green Version]
  27. SEMARNAT. NOM-147, Norma Oficial Mexicana que Establece los Criterios para Determinar las Concentraciones de Remediación de Suelos Contaminados por Arsénico, Bario, Berilio, Cadmio, Cromo Hexavalente, Mercurio, Níquel, Plata, Plomo, Selenio, Talio y/o Vanadio; Diario Oficial de la Federación, 2 de marzo de 2007; SEMARNAT: Ensenada, Mexico, 2007. [Google Scholar]
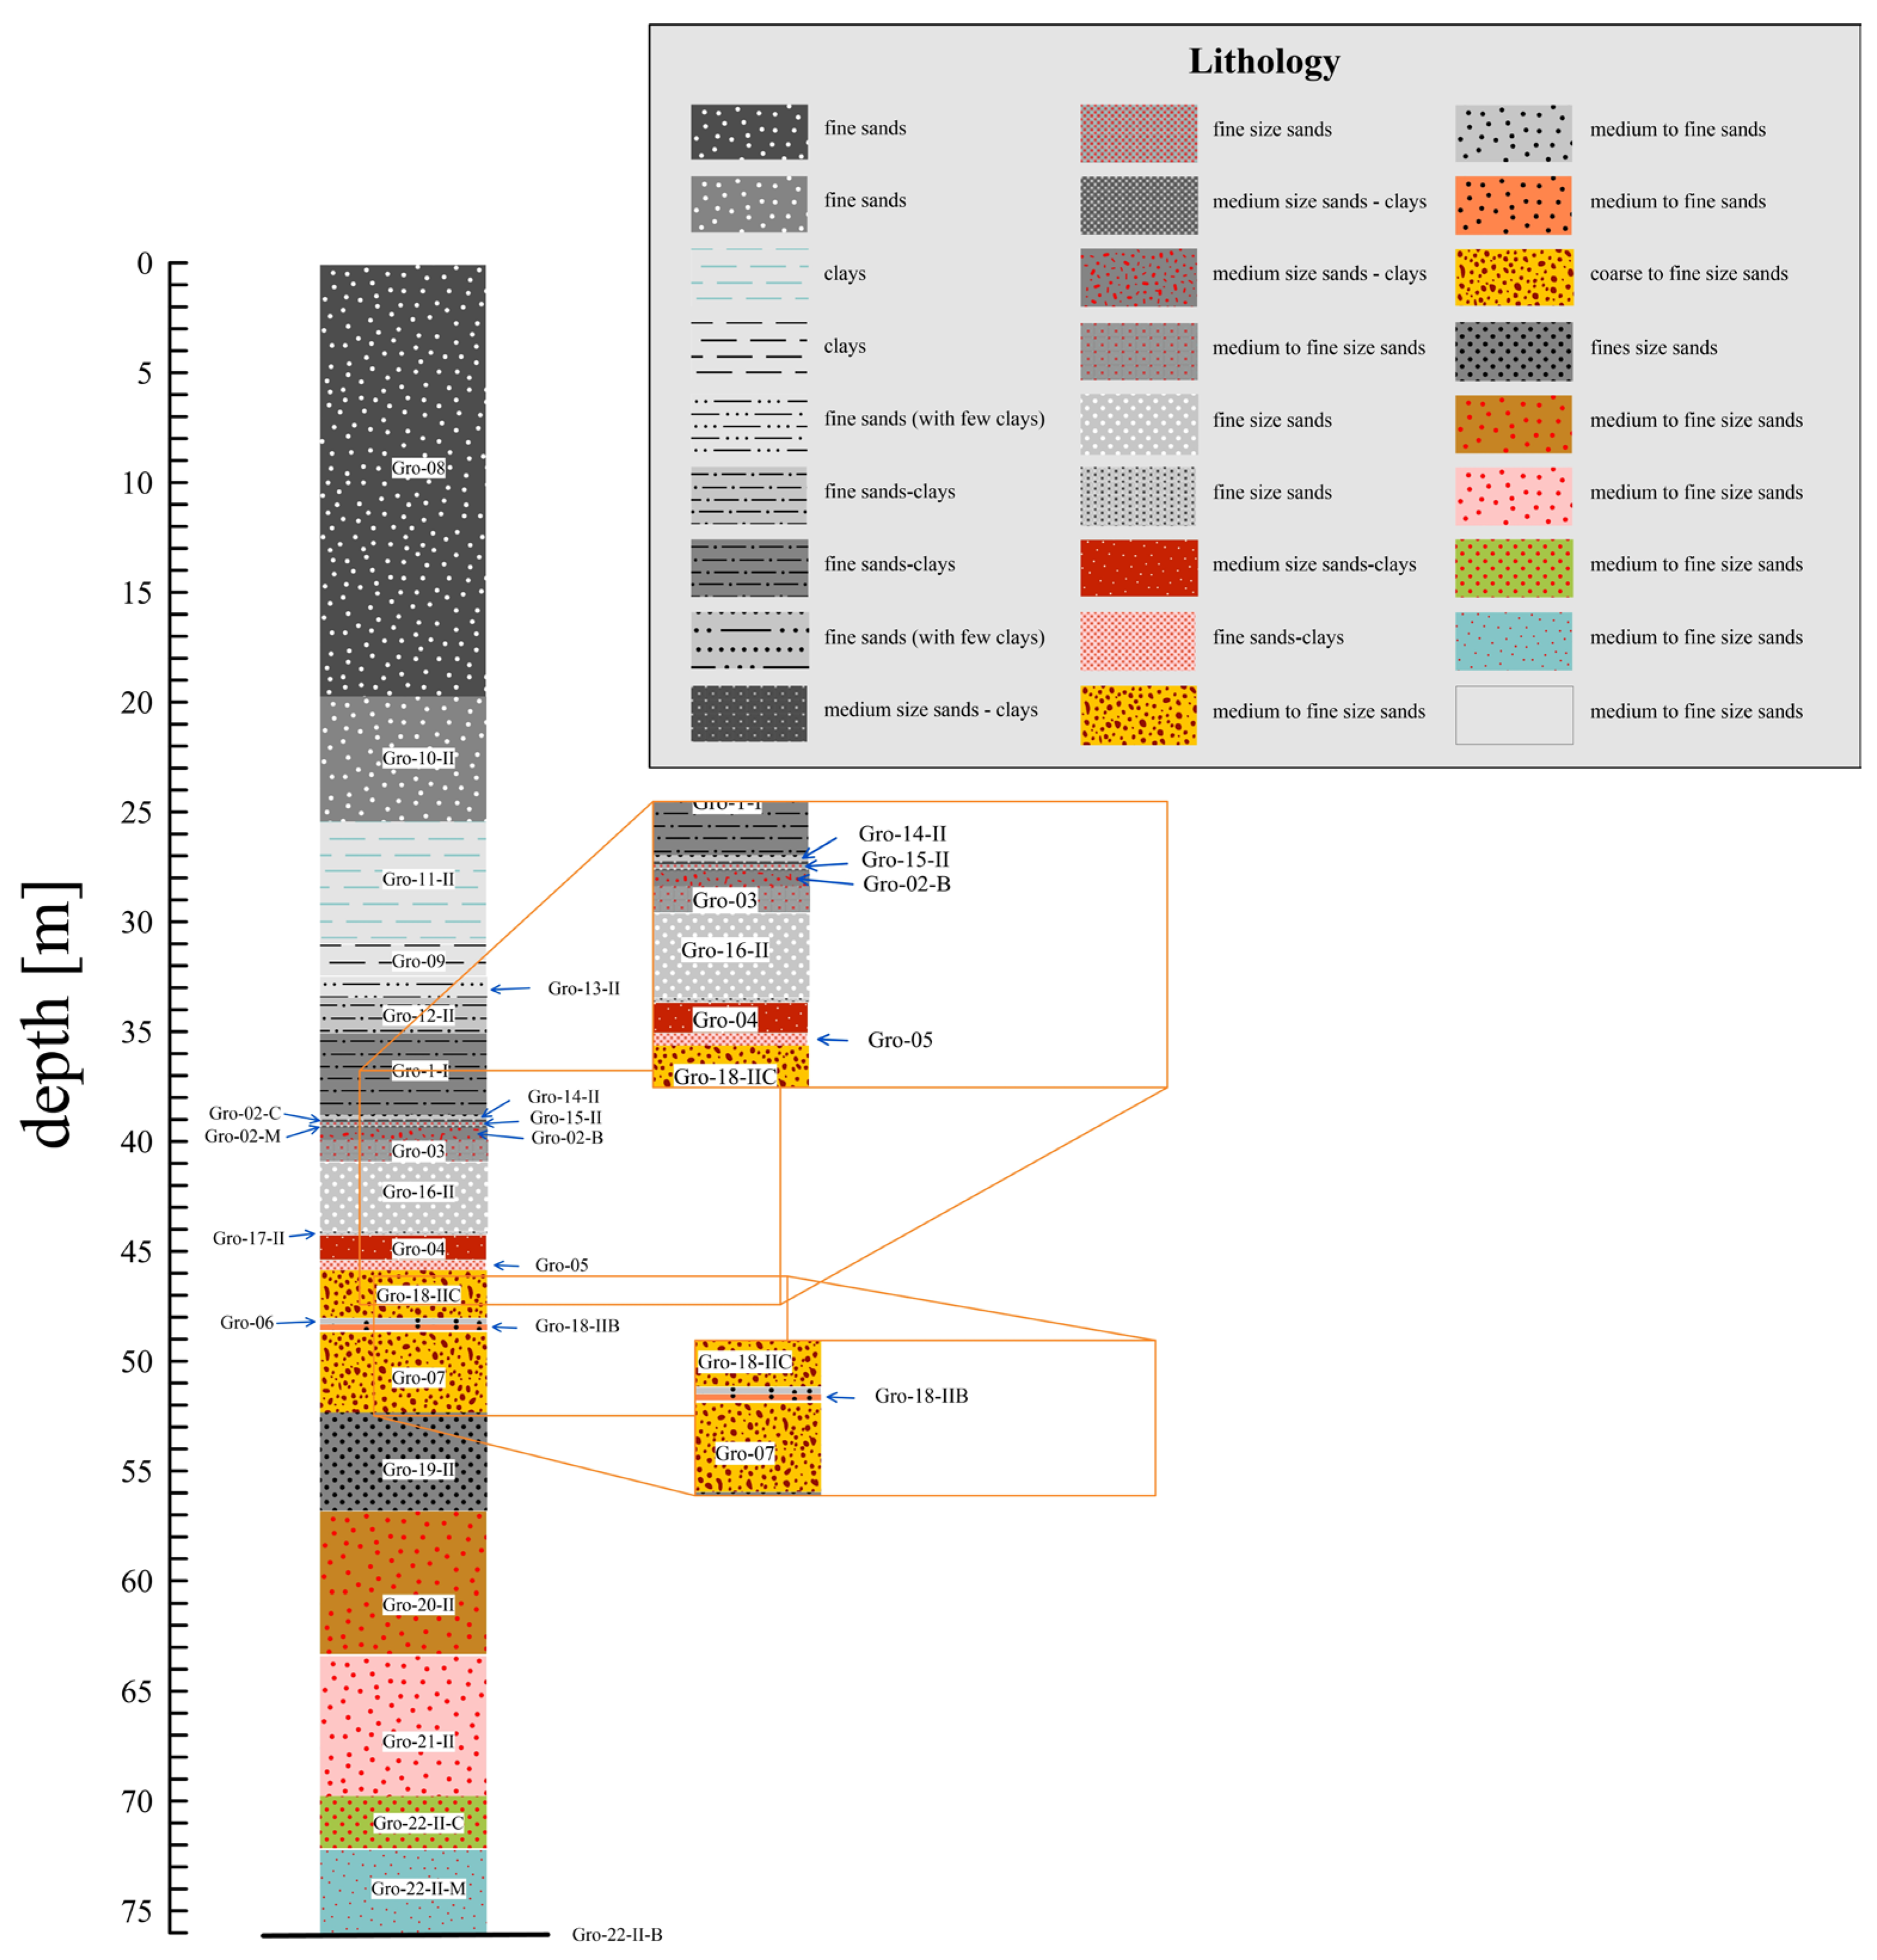
Figure 1. Location map of the study area. The hollow star indicates the location of Taxco de Alarcón, while the solid one highlights the Guerrero I tailings.
Quaternary 06 00040 g001
Figure 2. Distribution of the sampling points at the Guerrero I dam. (a) Orthogonal view of the site. (b) Oblique view of the site.
Quaternary 06 00040 g002
Figure 3. Guerrero I lithological column.
Quaternary 06 00040 g003
Figure 4. Concentration- and composition-dependent rock-magnetic parameters (κLF and SIRM), mainly concentration-dependent ratio (SIRM/κLF), and κFD% and S-300 ratio in the vertical ground profile of the Guerrero I dam. The lithological column is again reproduced for comparison purposes.
Quaternary 06 00040 g004
Figure 5. Corresponding physicochemical parameters (pH and EC) in the vertical ground profile of Guerrero I dam. κLF plot (a) is again reproduced for comparison purposes.
Quaternary 06 00040 g005
Figure 6. Associated heavy metal concentrations through the Guerrero I profile.
Quaternary 06 00040 g006
Table 1. Textural and mineralogical characteristics. Py: pyrite; Qz: quartz; Mt: magnetite; Ca: calcite; Gy: gypsum; Mexcala Fm.: Mexcala formation.
Depth [m]SampleColorSizeConsolidation StateMineralogyStructure
0.0 Gro 8-I dark gray fine sands consolidated Py + Qz + Mt well-defined strata
19.7 Gro 10-II dark gray fine size sands slight consolidated Py + Qz + Mt well-defined strata
25.3 Gro 11-II light gray clays well consolidated Not observed fine lamellae
31.0 Gro 9-I light gray clays well consolidated Not observed fine lamellae and desiccation cracks
32.4 Gro 13-II dark gray fine sands (with few clays) slight consolidated Qz + Mt + Py + Lithics (Mexcala Fm.)
33.4 Gro 12-II light gray fine sands–clays consolidated Qz + Py + Lithics (Mexcala Fm.) fine lamellae
35.0 Gro 1-I dark gray fine sands–clays partially consolidated (summit of the dam) Qz + Mt
38.7 Gro 14-II dark gray fine sands (with few clays) consolidated Qz + Mt + Py + Ca + Lithics (Mexcala Fm.) fine strata and lamellae
38.9 Gro 2-I C dark gray medium size sands–clays partially consolidated Qz + Mt + Py
39.0 Gro 15-II gray reddish fine size sands consolidated only superficially (3 cm) Qz + Mt + Py + Lithics (Mexcala Fm.)
39.1 Gro 2-I M dark gray medium size sands–clays partially consolidated Qz + Mt + Py
39.3 Gro 2-I B dark gray medium size sands–clays partially consolidated Qz + Mt + Py
39.8 Gro 3-I dark gray with some reddish areas (oxidation) medium to fine size sands partially consolidated Qz + Mt + Py
40.8 Gro 16-II gray fine size sands consolidated only superficially (3 cm) Qz + Mt + Py + Ca + Lithics (Mexcala Fm.)
44.1 Gro 17-II gray fine size sands consolidated only superficially (3 cm) Qz + Mt + Py + Lithics
(Mexcala Fm.) + Gy?
44.1 Gro 4-I reddish medium size sands–clays partially consolidated Qz + Mt + Py + Ca + Gy?
45.3 Gro 5-I reddish fine sands–clays partially consolidated Qz + Mt + Py + Gy?
45.7 Gro 18-II C ochre medium to fine size sands well consolidated Qz + Mt + Py + Gy?
47.9 Gro 6-I light gray medium to fine size sands consolidated Qz + Mt + Py + Ca fine strata and lamellae
48.2 Gro 18-II B ochre medium to fine size sands consolidated Qz + Mt + Py + Gy?
48.6 Gro 7-I yellowish-ochre-reddish coarse to fine size sands well consolidated Qz + Mt + Py + Ca + Gy? peak shape structures
52.2 Gro 19-II dark gray fine size sands slight consolidated.
It is, apparently, an erosion level and redeposits of upper strata
Qz + Mt + Py + Lithics (Mexcala Fm.)
56.8 Gro 20-II ochre-reddish medium to fine size sands well consolidated Qz + Mt + Py + Ca peak shape structures
63.3 Gro 21-II reddish medium to fine size sands well consolidated Qz + Mt + Py + Gy? peak shape structures
69.6 Gro 22-II C greenish with some reddish surfaces medium to fine size sands partially consolidated Qz + Mt + Py peak shape structures
72.1 Gro 22-II M greenish with some reddish surfaces medium to fine size sands partially consolidated Qz + Mt + Py peak shape structures
76.0 Gro 22-II B greenish with some reddish surfaces medium to fine size sands partially consolidated Qz + Mt + Py peak shape structures
Table 2. Elemental composition and statistical description of κ and PTE concentrations in the Guerrero I tailing samples. Concentration values are in ppm, except for Fe. RBC: regional background concentration; MPL: maximum permissible levels according to [27]; AEF: average enrichment factor; N.A.: not available.
Depth Sample κLFPbVNiCuZnFe
[m] [Unitless][ppm][ppm][ppm][ppm][ppm][wt/%]
0.0 Gro 08 1.09 × 10−33193.430.018.7109.86823.013.4
19.7 Gro 10-II 8.36 × 10−47573.327.820.2103.66319.511.9
25.3 Gro 11-II 1.45 × 10−41011.738.223.6164.95527.712.7
31.0 Gro 09 1.66 × 10−4907.232.729.0106.04974.816.3
32.4 Gro 13-II 1.96 × 10−31305.723.68.246.52434.713.2
33.4 Gro 12-II 1.39 × 10−3780.423.38.951.62250.814.1
35.0 Gro 01 2.94 × 10−3707.326.117.5102.66334.718.5
38.7 Gro 14-II 1.38 × 10−31316.816.321.062.65313.813.0
38.9 Gro 02_Cima 3.32 × 10−31457.919.516.4101.56770.719.3
39.0 Gro 15-II 1.24 × 10−31767.717.715.369.53152.511.8
39.1 Gro 02_med 2.23 × 10−3874.726.820.650.32702.415.9
39.3 Gro 02_Base 1.79 × 10−31319.425.712.080.23842.416.8
39.8 Gro 03 1.79 × 10−34065.328.717.3134.88383.816.3
40.8 Gro 16-II 2.48 × 10−32428.924.615.830.21231.019.1
44.1 Gro 17-II 1.18 × 10−31528.428.113.549.83615.419.1
44.1 Gro 04 4.68 × 10−31657.425.818.039.81692.223.8
45.3 Gro 05 1.59 × 10−32663.324.418.054.72102.920.0
45.7 Gro 18-II C 1.86 × 10−32027.225.812.266.4819.117.8
47.9 Gro 06 1.17 × 10−31072.629.715.652.63589.316.8
48.2 Gro 18-II B 1.51 × 10−33209.426.24.633.2484.520.0
48.6 Gro 07 1.79 × 10−31191.233.817.372.04082.718.7
52.2 Gro 19-II 1.99 × 10−31848.026.412.167.52429.115.9
56.8 Gro 20-II 5.83 × 10−41181.128.113.524.8545.012.3
63.3 Gro 21-II 2.61 × 10−31823.729.310.473.0586.617.5
69.6 Gro 22-II C 2.85 × 10−43409.629.411.074.3528.311.1
72.1 Gro 22-II M 6.79 × 10−45817.636.313.631.5509.88.5
76.0 Gro 22-II B 4.22 × 10−48958.136.28.547.8445.016.7
# samples 27272727272727
Average 1.6 × 10−032411.027.415.370.43240.415.9
Standard deviation 1.0 × 10−032058.65.25.233.72364.73.5
Coeff. of variation [%] 6.4 × 10−0185.419.034.347.973.021.7
Minimum 1.5 × 10−04707.316.34.624.8445.08.5
Maximum 4.7 × 10−038958.138.229.0164.98383.823.8
Range 4.5 × 10−038250.821.924.4140.17938.815.3
Standardized bias 2.154.370.050.762.201.07−0.10
Standardized bias 1.934.240.400.711.08−0.88−0.18
RBC N.A.2640N.A.25642.7
MPL N.A.400781600N.A.N.A.N.A.
AEF N.A.930.7 2.850.15.9
Table 3. Correlation matrix. Concentration values are in ppm, except for Fe [wt./%].
Depth [m]XLFARM [A/m]SIRM [A/m]SIRM/XLF [A/m]ARM/XLF [A/m]SRIM/ARMpHEC [µs/cm]PbVNiCuZnFe
Depth [m] 1.000
XLF −0.0671.000
ARM [A/m] −0.2020.7841.000
SIRM [A/m] −0.1710.9480.7601.000
SIRM/XLF [A/m] −0.473−0.251−0.096−0.0241.000
ARM/XLF [A/m] −0.460−0.3340.092−0.2780.6131.000
SRIM/ARM 0.3110.131−0.3800.182−0.183−0.7481.000
pH −0.6940.2860.4030.4180.5000.346−0.1951.000
EC [µs/cm] 0.338−0.361−0.483−0.434−0.230−0.1290.200−0.7731.000
Pb0.283−0.327−0.092−0.356−0.297−0.001−0.132−0.4130.3241.000
V0.237−0.455−0.269−0.4660.1450.397−0.253−0.3610.3160.3661.000
Ni−0.497−0.0780.1580.0080.5710.627−0.4270.563−0.371−0.1990.1171.000
Cu−0.522−0.1590.052−0.0830.5200.720−0.4100.360−0.144−0.0360.2280.5411.000
Zn−0.7020.0400.2230.1590.4150.467−0.2830.669−0.398−0.111−0.0980.6060.7831.000
Fe0.0110.6820.6460.6600.010−0.069−0.2260.226−0.368−0.248−0.152−0.034−0.142−0.0291.000
Disclaimer/Publisher’s Note: The statements, opinions and data contained in all publications are solely those of the individual author(s) and contributor(s) and not of MDPI and/or the editor(s). MDPI and/or the editor(s) disclaim responsibility for any injury to people or property resulting from any ideas, methods, instructions or products referred to in the content.

