Article

Hyperspectral Core-Logging for Past Primary Productivity Assessment

1
Normandie Université, UNIROUEN, UNICAEN, CNRS, M2C, 76000 Rouen, France
2
Université du Littoral Côte d’Opale, CNRS UMR 8187, LOG, 62930 Wimereux, France
3
Normandie Université, INSA Rouen, UNIROUEN, CNRS, COBRA (UMR 6014), Avenue de l’Université, 76800 Saint-Etienne-du-Rouvray, France
4
Chrono-Environnement, MSHE, CNRS, Université de Bourgogne Franche-Comté, 25000 Besançon, France
*
Author to whom correspondence should be addressed.
Quaternary 2022, 5(4), 53; https://doi.org/10.3390/quat5040053
Submission received: 9 December 2020 / Revised: 7 March 2022 / Accepted: 15 June 2022 / Published: 12 December 2022

Abstract

:
Past primary productivity is tracked in lake sediments to reconstruct environmental changes. However, the resolution of the routinely used destructive techniques is not suitable for the analysis of a large number of samples due to cost. Non-destructive analysis of chlorophyll-a performed by hyperspectral imagery enables the quick determination of indices of past primary productivity. Eighteen indices used in paleo-environmental reconstruction were inventoried to define the best index capable of tracking chlorophyll-a by this technique. All the indices were applied to hyperspectral data measured on the sediment of Lake Bresson, in which detrital organic matter input is likely to skew chlorophyll-a identification, and the results were compared with concentrations measured by a routinely used destructive analysis. The 18 indices all produced a different result and only three indices were positively correlated with chlorophyll-a concentrations (n = 28, p < 0.0001). The detrital organic matter impacts chlorophyll-a characterization and shows the bias produced by the sediment matrix variations. Moreover, artificial modification of the sediment matrix revealed an impact of the mineral phase. To tackle this issue, the indices are normalized by two proxies of the sediment components. This new approach reduces the impact of detrital organic matter, hence the sediment matrix variations also reduce the normalization of the chlorophyll-a indices by a specific proxy of the mineral phase. These results identify the impact of local geochemical features that limit past primary productivity assessment and show the necessity of characterizing the sediment composition prior to tracking the chlorophyll-a by hyperspectral imaging.

1. Introduction

The imprint of humans on the lithosphere–atmosphere interface and even more on the biosphere is omnipresent on earth [1]. Among the harmful consequences of human impact on its environment and specifically on the fresh water systems, eutrophication is one of the most relevant environmental problems that has been observed across the world [2,3]. Indeed, human activities, toward an increase of nutrient loads [3,4,5,6] and climate change [7], lead to disequilibrium in the trophic lake status (e.g., [6,8,9,10]). Massive input of nutrient incidental to soil erosion, fertilizer and atmospheric emission lead to an increase of the lake primary productivity [8,9,11]. Even great lakes, such as Le Bouget for example, the biggest in France, can be affected by eutrophication. Indeed, after 1943, the lake has suffered from additional phosphorus loading originating from industrial and urban wastewater as well as non-point sources from agricultural practices [12] inducing a massive oxygen depletion. Another striking example is the case of certain arctic lakes. Although they are not directly affected by humans by very limited action in the watershed, some lakes see their trophic regime profoundly altered with the appearance of eutrophic conditions linked to atmospheric fertilization. Initially more mineralogic, the sedimentation of some arctic lakes has evolved to a more organic rich deposit linked to higher productivity in the lake. This major change in the lacustrine sedimentation is considered as a potential key proxy to track the human impact on ecosystems and was even used to identity the Anthropocene worldwide [8,9,11]. To evaluate the anthropic impact on fresh water systems, it is necessary to look back in time toward sedimentary archives and use chlorophyll content as a proxy of paleoproductivity.
Currently, most of the methods used to reconstruct past variations in paleoproductivity involve destructive sampling sediment cores (e.g., on isotopic fractionation of organic nitrogen; the study of diatom assemblies; or the quantification of the pigment concentration [9,10,13,14]). Unfortunately, destructive sampling is a limiting factor to reach a high resolution (less than a centimeter) which is necessary for low sedimentation rates. Finally, some sedimentary records can be particularly valuable due to their provenance, for example. In order to optimize the study of these records, it is necessary to develop advanced, innovative, non-destructive, high resolution analysis methods, which are therefore required for specific methodological and computer developments. Hyperspectral imaging spectroscopy meets these criteria and has shown increasing interest since the pioneer works of Butz et al. [15,16,17,18,19,20,21,22] and see, more recently, Zander et al. [23] for a review.
Reflectance spectroscopy is a non-destructive, relatively fast and inexpensive method [24]. A review of the uses of reflectance spectroscopy shows that this type of analysis has been used to infer a large number of indicators of past climatic and paleo-environmental changes [25] such as: sedimentation rates [26], water depth [27,28], water temperature [29], oxygenation of the hypolimnion [30,31], the time of exposition to oxygen [32] and bioturbation [33], changes in lake trophic status of several lakes around the world [34,35,36], changes in rainfall patterns [37], variations of bathymetry and consequences on water oxygenation [38], and the variations of paleo-temperatures in South America [39], the Swiss Alps [40], Australia [41], Europe [42] and the Arctic [24,43]. More specifically, previous studies have already shown that spectroscopy is a useful method to identify chlorophyll-a and by products ([44,45,46]. A major advantage is that the degradation products of chlorophyll-a are also isolated by this technique (i.e., pheo-pigments [45,47]). This means that the paleoproductivity signal is not affected by diagenetic processes in the sediment. Initially measured by spectrophotometry (intermediate resolution 0.5 cm), the recent development of hyperspectral imaging applied to core-logging has led to a new technique of diffuse reflectance with high resolution (43 µm pixels). Accordingly, hyperspectral imagery is suitable to quickly track, at very high spatial resolution, the reflectance of sediment [15,21,48] and the past aquatic primary productivity.
The aim of this study is to test the hyperspectral imaging of 18 existing spectroscopic markers in the literature (Section 3.4). Here, we propose to test these indices in a lacustrine archive (Lake Bresson, South of France) whose organic sedimentation includes both primary aquatic productivity and detrital organic inputs (charcoal). This study site was chosen for its geological characteristics. The mother rock is a volcanic rock (rhyolite) called Estérellite and therefore devoid of fossil OM. The soil, mainly developed on colluvium, shows a thin organo-mineral horizon (named “A” in pedology) surmounted by a sparse litter resulting from Mediterranean bushes. The OM present in the lake therefore comes from either (i) Mediterranean bushes, (ii) aquatic primary productivity, or (iii) combustion residues produced by forest fires.
In previous studies, the origin of organic matter is mainly linked to the paleoproductivity in the lake [15]. The novelty of this study is both to estimate the impact of the interactions between organic matter signals (OM) and also the matrix effect on the quantification of chlorophyll-a and degradation products. Indeed when opening a sedimentary archive, oxidation causes a change in reflectance [46,49] and sedimentary structures potentially invisible at the time of opening appear [20] or disappear (e.g., [50]). Ultimately, the objective is to propose a synthesis on the paleoproductivity indices to extract the most efficient ones.

2. Study Site

Lake Bresson is a reservoir lake with an area of 4700 m2 built in 1976 in the Esterel Massif in south-eastern France (Figure 1A). The Mediterranean climate of the region is characterized by a strong seasonality with mild and wet winters and hot and dry summers that favor wildfires. The 27 ha of the catchment area, between 78 m and 174 m asl, is composed of two parts; a first subwatershed is oriented North–South and a second is oriented North–East (Figure 1B). The first sub-watershed is drained by an ephemeral stream. The second subwatershed is divided by the passage of a track. The ditches on both sides of the track collect runoff water and divide the flow of this subwatershed. The northern part of the basin drains towards the ephemeral stream and joins the lake. The southern part drains towards a small pond in front of the lake (Figure 1B). This part of the basin is therefore excluded from the hydrological catchment area of the lake (Figure 1B).
This study site was chosen for its geological characteristics. The mother rock is a volcanic rock (rhyolite) called Estérellite and therefore devoid of fossil OM. The soil, mainly developed on colluvium, shows a thin organo-mineral horizon (named “A” in pedology) surmounted by a sparse litter resulting from Mediterranean bushes. The OM present in the lake therefore comes from either (i) Mediterranean bushes, (ii) aquatic primary productivity, or (iii) combustion residues produced by forest fires.

3. Materials and Methods

The methodology followed in this article is composed of the following steps. The reflectance was first acquired. Chlorophyll-a concentrations were measured by high performance liquid chromatography (HPLC) corresponding to the protocol commonly used in paleoclimatology. The 18 indices were calculated and compared to the HPLC data to test their ability to reconstruct chlorophyll content in sediments. The next step was to evaluate the interaction between different OM, because in addition to primary productivity, this Mediterranean study site is frequently impacted by fire events producing carbonized residue of OM (charcoal). Finally, we tested hyperspectral measurements on the unoxidized sediment according to a new protocol to simulate a “matrix effect” (cf. [51,52]) and to understand what kind of information is lost during the opening of the core.

3.1. Core Sampling

The lake is shallow towards the north and deepens to up to 3 m in the south (Figure 1C). The bathymetry follows the shape of the old talweg on which the sediments of the lake were deposited (Figure 1D). The waters of the lake are turbid. The BRE1601 archive (35 cm, IGSN number: IEM2C0019) was collected by gravity sampling at the deepest part of the lake (43°28′4.2″ N, 6°48′56.4″ E). The maximum level of the lake was 2.30 m at the time of sampling due to the summer drought. The gravity core made it possible to reach the sediment base since the presence of very heterogeneous material and roots show that soil that existed before the establishment of the dam was taken. The second archive LR1203 (40 cm, IGSN number: IEM2C0018), taken a few meters apart (Figure 1C), is used as a reference for the use of the age model. Indeed, this archive has been precisely dated and analyzed by several destructive methods (e.g., dating, 137Cs, 210Pb, macroscopic charcoal particle counting, and Rock-Eval pyrolysis, ref. [15]).

3.2. High Pressure Liquid Chromatography for Pigment Analysis

Core BRE1601 was sampled at every centimeter directly at the time of opening using a metal spatula and placed at −80 °C before lyophilization. The HPLC extraction and quantification protocol for pigments was presented in a previous study [15]. Pigment identification was performed by comparing retention times with an external reference standard of 28 phytoplankton pigments (Mixed-119, DHI, Amsterdam, The Netherlands) and also following the work of Van Heukelem et al. [53] listing elution orders by HPLC and spectral information (wavelengths of maximum absorption) of 43 pigments. In the present study, 22 pigments were identified in the sedimentary archive (listed in Figure 2). The quantification was possible thanks to a standard of known chlorophyll-a concentration (DHI, The Netherlands). This protocol allowed us to obtain a limit of quantification of 0.08 µg·g−1 and a detection limit of 0.03 µg·g−1 for the chlorophyll a. The identified pigments were grouped into three categories: chlorophyll-a pigments only, pigments whose absorbance is between 600 and 700 nm (i.e., chlorophyllin pigments: chlorophyll-a, by-products of chlorophyll-a, chlorophyll-b + by-products of chlorophyll-b, chlorophyll-c2) and the sum of the concentrations of all the pigments (i.e., total pigments).

3.3. Hyperspectral Image Analysis

3.3.1. Analysis Protocols: Simulation of a Matrix Effect

After the opening, the protocol routinely used consists of stabilizing the oxidation of the sediment as well as the surface water content in the open air for 24 h [51]. After 24 h, the right part of the half core, named B, was cleared to reveal the unoxidized sediment. The oxidation layer removed had a thickness of 1 mm and an additional millimeter of sediment was removed for safety. The left part of the half-core, named A, was measured without further action as a witness of oxidation. This protocol makes it possible to measure the oxidized and unoxidized sections during the same acquisition under the camera. In the rest of this article, section A will designate the oxidized half (Left) of the BRE1601 core and section B (Right) the non-oxidized half of this same core (Figure 2A).

3.3.2. Acquisition

The hyperspectral data were acquired using a VNIR-PFD hyperspectral camera manufactured by SPECIM mounted on a core-logger bench. The image has a spatial resolution of 47 × 47-μm2 per pixel. Each pixel of the resulting image contains the raw spectral data with a spectral resolution of 6.5 nm in the visible and near infrared range (400 to 1000 nm). The depth of field of the imager is about 2 mm. A normalization step is required to convert the raw data (8 bits) in percentage of reflectance. At each acquisition, a 100% reflective SPECTRALON standard was measured and used as a reference to express the data as the percentage of reflectance (for more details about protocol see Jacq et al., 2020 [54]). The data processing was carried out using ENVI software (Exelisvis, ENVI/IDL 5.01/8.2, Boulder, CO, USA). At the end of the standardization, a selection of the least noisy bands with a signal-to-noise ratio greater than 2 allowed the bands between 475 and 1000 nm to be retained.

3.4. Index Categories

In spectroscopy, the evaluation of the concentration of a chemical compound from indices is based (1) on the intensity of its absorption band, characterized by a minimum of reflectance and (2) on the notion of reflectance continuum, characterized by the general shape of the spectrum (e.g., [55,56]). The presence of chlorophyll-a creates a depression around 675 nm (i.e., a local minimum) in the general shape of the reflectance spectrum that is proportional to the concentration (Figure 2B–D). In this study, the continuum refers to the form that the spectrum would have in the absence of chlorophyll-a, i.e., without this local minimum formed by the pigment absorption band on the reflectance spectra. Therefore, the intensity of the absorption band is used to measure the concentration; it is calculated by the difference between the reflectance continuum and the minimum reflectance produced by chlorophyll-a and its derivatives at 675 nm [45]. Several methods allow us to estimate this difference, hence 18 indices from the literature are presented into three categories defined with their calculation principles (fully described in Table 1).
First, indices based on amplitude, derivative, or ratio use two spectral bands (8 indices): the first corresponds to the reflectance measured at the absorption band of chlorophyll-a (i.e., 660, 670, 675 or 690 nm) and the second band is located at the level of the continuum, outside the absorption band of chlorophyll-a (i.e., 590, 645, or 750 nm). These indices consist of subtracting or dividing these two reflectance bands to measure the relative importance of the minimum reflectance at the absorption band of chlorophyll-a. More specifically, the derivative indexes emphasize the slope formed by the absorption band at 660 or 675 nm (Table 1).
Second, indices based on reflectance feature depth: The Relative Absorption Depth Band (RABD) index (2 indices) is the ratio between two values; the first value is the reflectance measured at 670 nm [44], the second corresponds to the reflectance continuum position at this wavelength. As the continuum designates the shape that would have the spectrum if there was no chlorophyll-a, its value at 670 nm is modelled by a straight line connecting the local maxima (i.e., 590 and 730 nm) located on both sides of the reflectance minimum. The continuum value at 670 nm is estimated by weighting the reflectance measured at 590 and 730 nm by the number of bands separating them from 670 nm (i.e., 9 et 13, Table 1). The I-Band index is the division of the RABD index by the Rmean index (i.e., the mean reflectance of each spectrum taken individually, not to be confused with the average spectrum of a sedimentary archive) to remove the effect of the continuum [44]. To sum up, the I-Band index corresponds to the continuum estimate at 670 nm (RABD) divided by the reflectance measured at 670 nm and divided a second time by Rmean [44].
Third Area indices directly measure the surface area between the continuum and the reflectance spectrum at the absorption band formed by chlorophyll-a and its derivatives (4 indices). The sum of the reflectance bands located throughout the absorption band is subtracted from the area under a line connecting the beginning and the end of the depression formed by the absorption band (i.e., between 600 and 650 nm, 650 and 700 nm, 690 and 730 nm, or 600 and 760 nm, Table 1). In the bibliography, this type of index is called either the Trough Area (TA) [34,45] or the Relative Absorption Band Area (RABA) [40]. Two equations exist to calculate these indices, that proposed by Das et al. [34] and that of Trachsel et al. [40] which will be called AreaW and AreaT respectively. The difference between the two is a narrower area for the indice of Trachsel et al. [40] in order to reduce the impact of other component. In this review, these similar indices are grouped together under the term “Area” index, followed by wavelengths indicating the width of the absorption band considered (e.g., AreaT650–700).

4. Results and Interpretation

4.1. Sedimentology of BRE1601 and LR1203 Cores

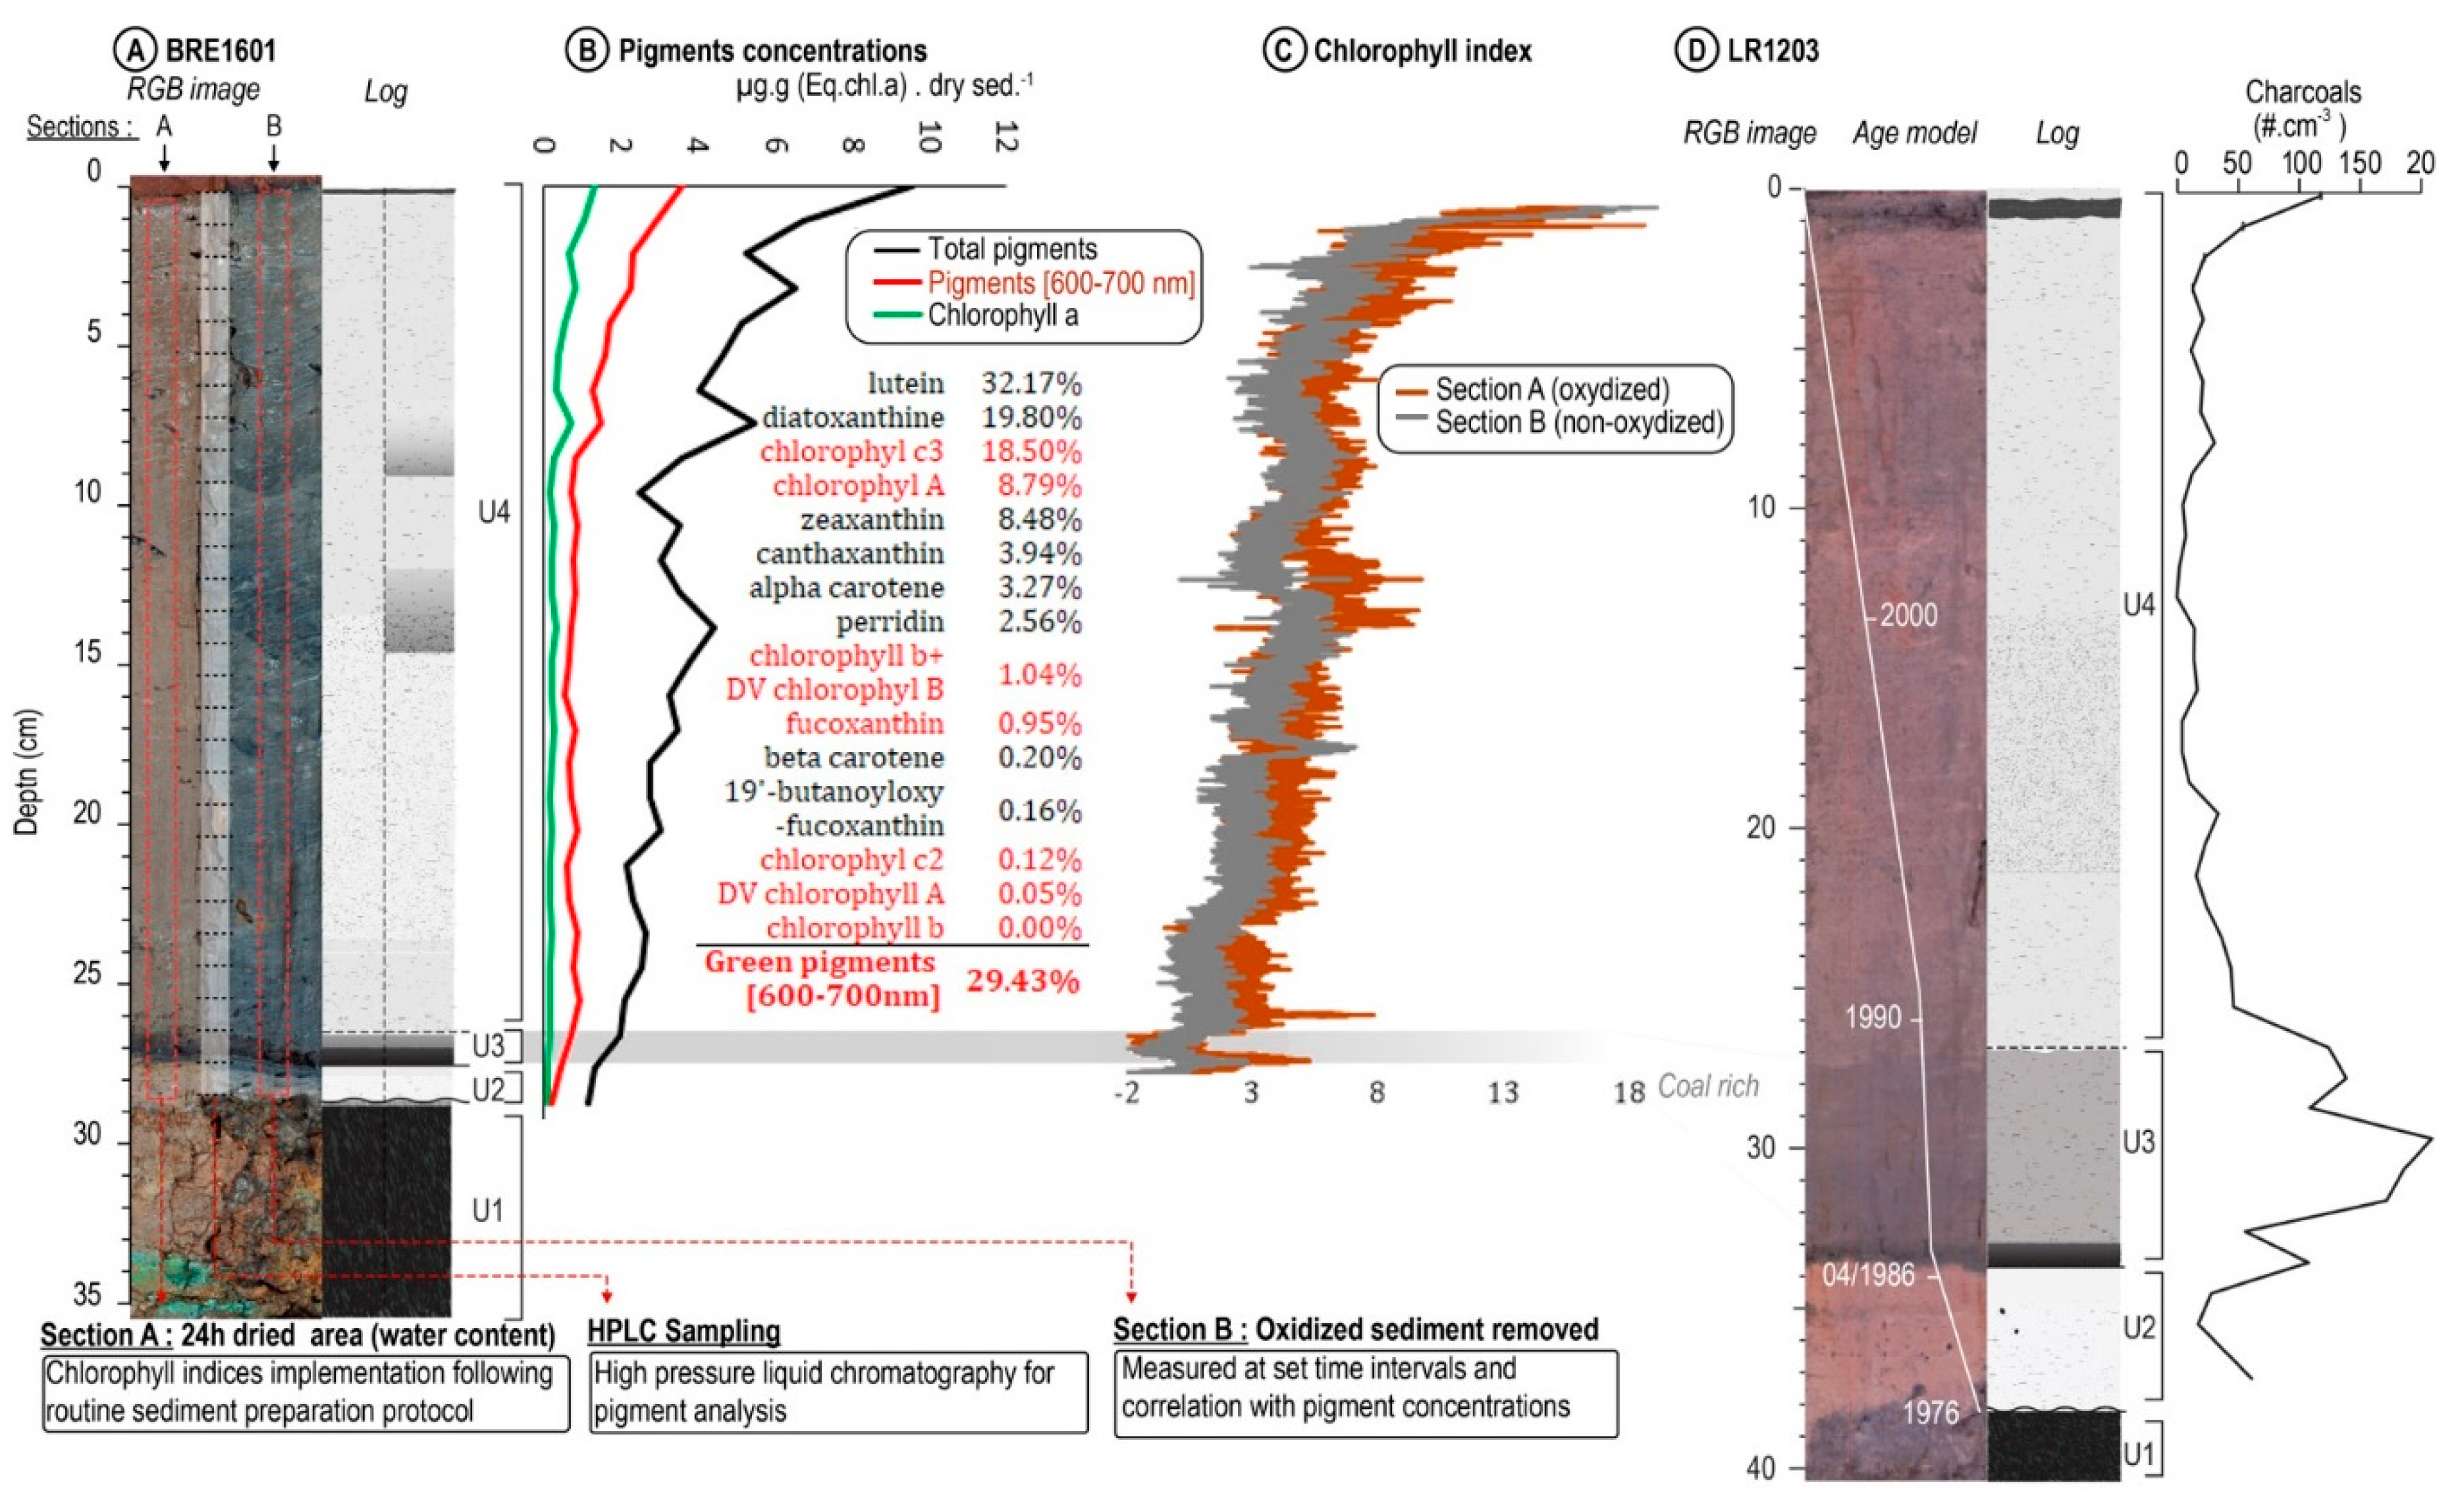
The BRE1601 archive imaging made it possible to establish the stratigraphic log according to the color of the sediment. In section A (Oxidized), unit 1, from 35 to 29 cm, is composed of the dark brown soil (Figure 2). Unit 2, from 29 to 28 cm, has a brown color. The base of the unit shows irregular contact due to the presence of gravel. Unit 3, between 28 and 27 cm, is black. Contact with unit 2 is sharp. Unit 4, between 27 and 0 cm, is brown and the contact with unit 3 is gradual. This stratigraphy is also found in section B (i.e., unoxidized), but color differences are observed. The black color of unit 3 is identical in both sections, unlike the grey color of units 2 and 4 in section B. In addition, unit 4 has two darker areas at 9 cm and 15 cm. These color variations have sharp lower contacts but transitions to the top of the archive are very gradual. The stratigraphy of the LR1203 archive is identical to that of section A, although the thickness of unit 3 is greater. Sediment sieving confirmed that the black color of unit 3 is due to the presence of large amounts of charcoal particles Figure 2 [15].

4.2. Pigment Concentrations by HPLC

The average concentration of the six chlorophyll pigments (i.e., chlorophylls, -a, -b, -c and divinyl-chlorophyll-a, -b, -c) represents 30% of the measured concentrations (Figure 2) and is mostly associated with chlorophyll-a and -c. Chlorophyll-a represents 11% of the total pigments. The highest concentrations of pigments and chlorophyll-a are reached at the top of the core. Between 0 and 1 cm, the concentration of chlorophyll-a is 7.566 µg·g−1 of dry sediment. It decreases rapidly to 6964 µg·g−1 in the sample taken between 1 and 2 cm. The highest concentration of lutein is reached at the sediment interface again with 18.386 µg·g−1 (eq.chl.-a). Its concentration decreases less rapidly than chlorophyll-a along the archive, which explains why the lutein concentration is the highest on average (Figure 2). The concentration of pigments shows a decreasing trend. Between 0 and 5 cm, the concentrations are divided by 4; between 5 and 15 cm the slope decreases less rapidly and between 15 and 28 cm the slope is slightly steep but the decreasing trend continues. In unit 3 (between 26 and 27 cm), the black lamina does not induce significant variations in the pigment concentration profiles. The presence of coal particles therefore has no effect on the chlorophyll-a concentration profile (Figure 2).

4.3. Comparison of Indices with Chlorophyll-a Concentration

Figure 3 shows the correlation between the chlorophyll-a concentration and the 18 indices calculated according to measurements acquired after oxidation (section A), following the protocol of Balsam et al. [51]. These first results indicate that few indices reproduce the pigment concentration measured by HPLC. Among the 18 indices, only AreaT650–700, AreaT600–760, AreaT590–730, AreaT650–750 and RABD show a significant positive correlation with the chlorophyll-a concentration with a threshold of 95%, and the ratio 675/750 and the amplitude d660–d690 show a negative correlation. Among the ratio, amplitude and derivative indices, only the derivative at 675 nm (d675) produces a decreasing trend (Supplementary Figure S1), but this is not statistically significant when compared with the trend measured by HPLC. Second, the 27 cm deep black lamina (Figure 2, Unit 3) is the main cause of the differences between the indices and the HPLC values, including the seven indices whose chlorophyll-a profiles are significant, since only the AreaT600–760 and AreaT590–730 indices do not show any variations in unit 3. The AreaT650–700 and AreaT650–750 indices show a decrease and, conversely, the other indices increase at a depth of 27 cm (Figure 3; Supplementary Figure S1). Consequently, these variations observed at the depth of the charcoal rich laminae show that the presence of carbonized OM implies a problem of identification of chlorophyll-a. However, the value of the same index is also different depending on the oxidation of the sediment. The values of the AreaT650–700 index are higher for the oxidized section A (Figure 2C). Nevertheless, not much difference is observed in the coal lamina (unit 3). This phenomenon is explained because this refractory OM is not, or only weakly, sensitive to oxidation. Therefore, these results show that sediment oxidation increases the intensity of the absorption band of chlorophyll-a and produces a higher chlorophyll-a index. The scatter plot (Figure 3) seems to indicate that the correlation is not linear with a drastic change around 0.25 µg·g−1 of chlorophyll-a concentration. From 0 to 0.25 µg·g−1, no relationship exists between hyperspectral and HPLC data. This threshold is linked to the detection limit of the HPLC.

5. Discussion

5.1. Impact of Sediment Oxidation

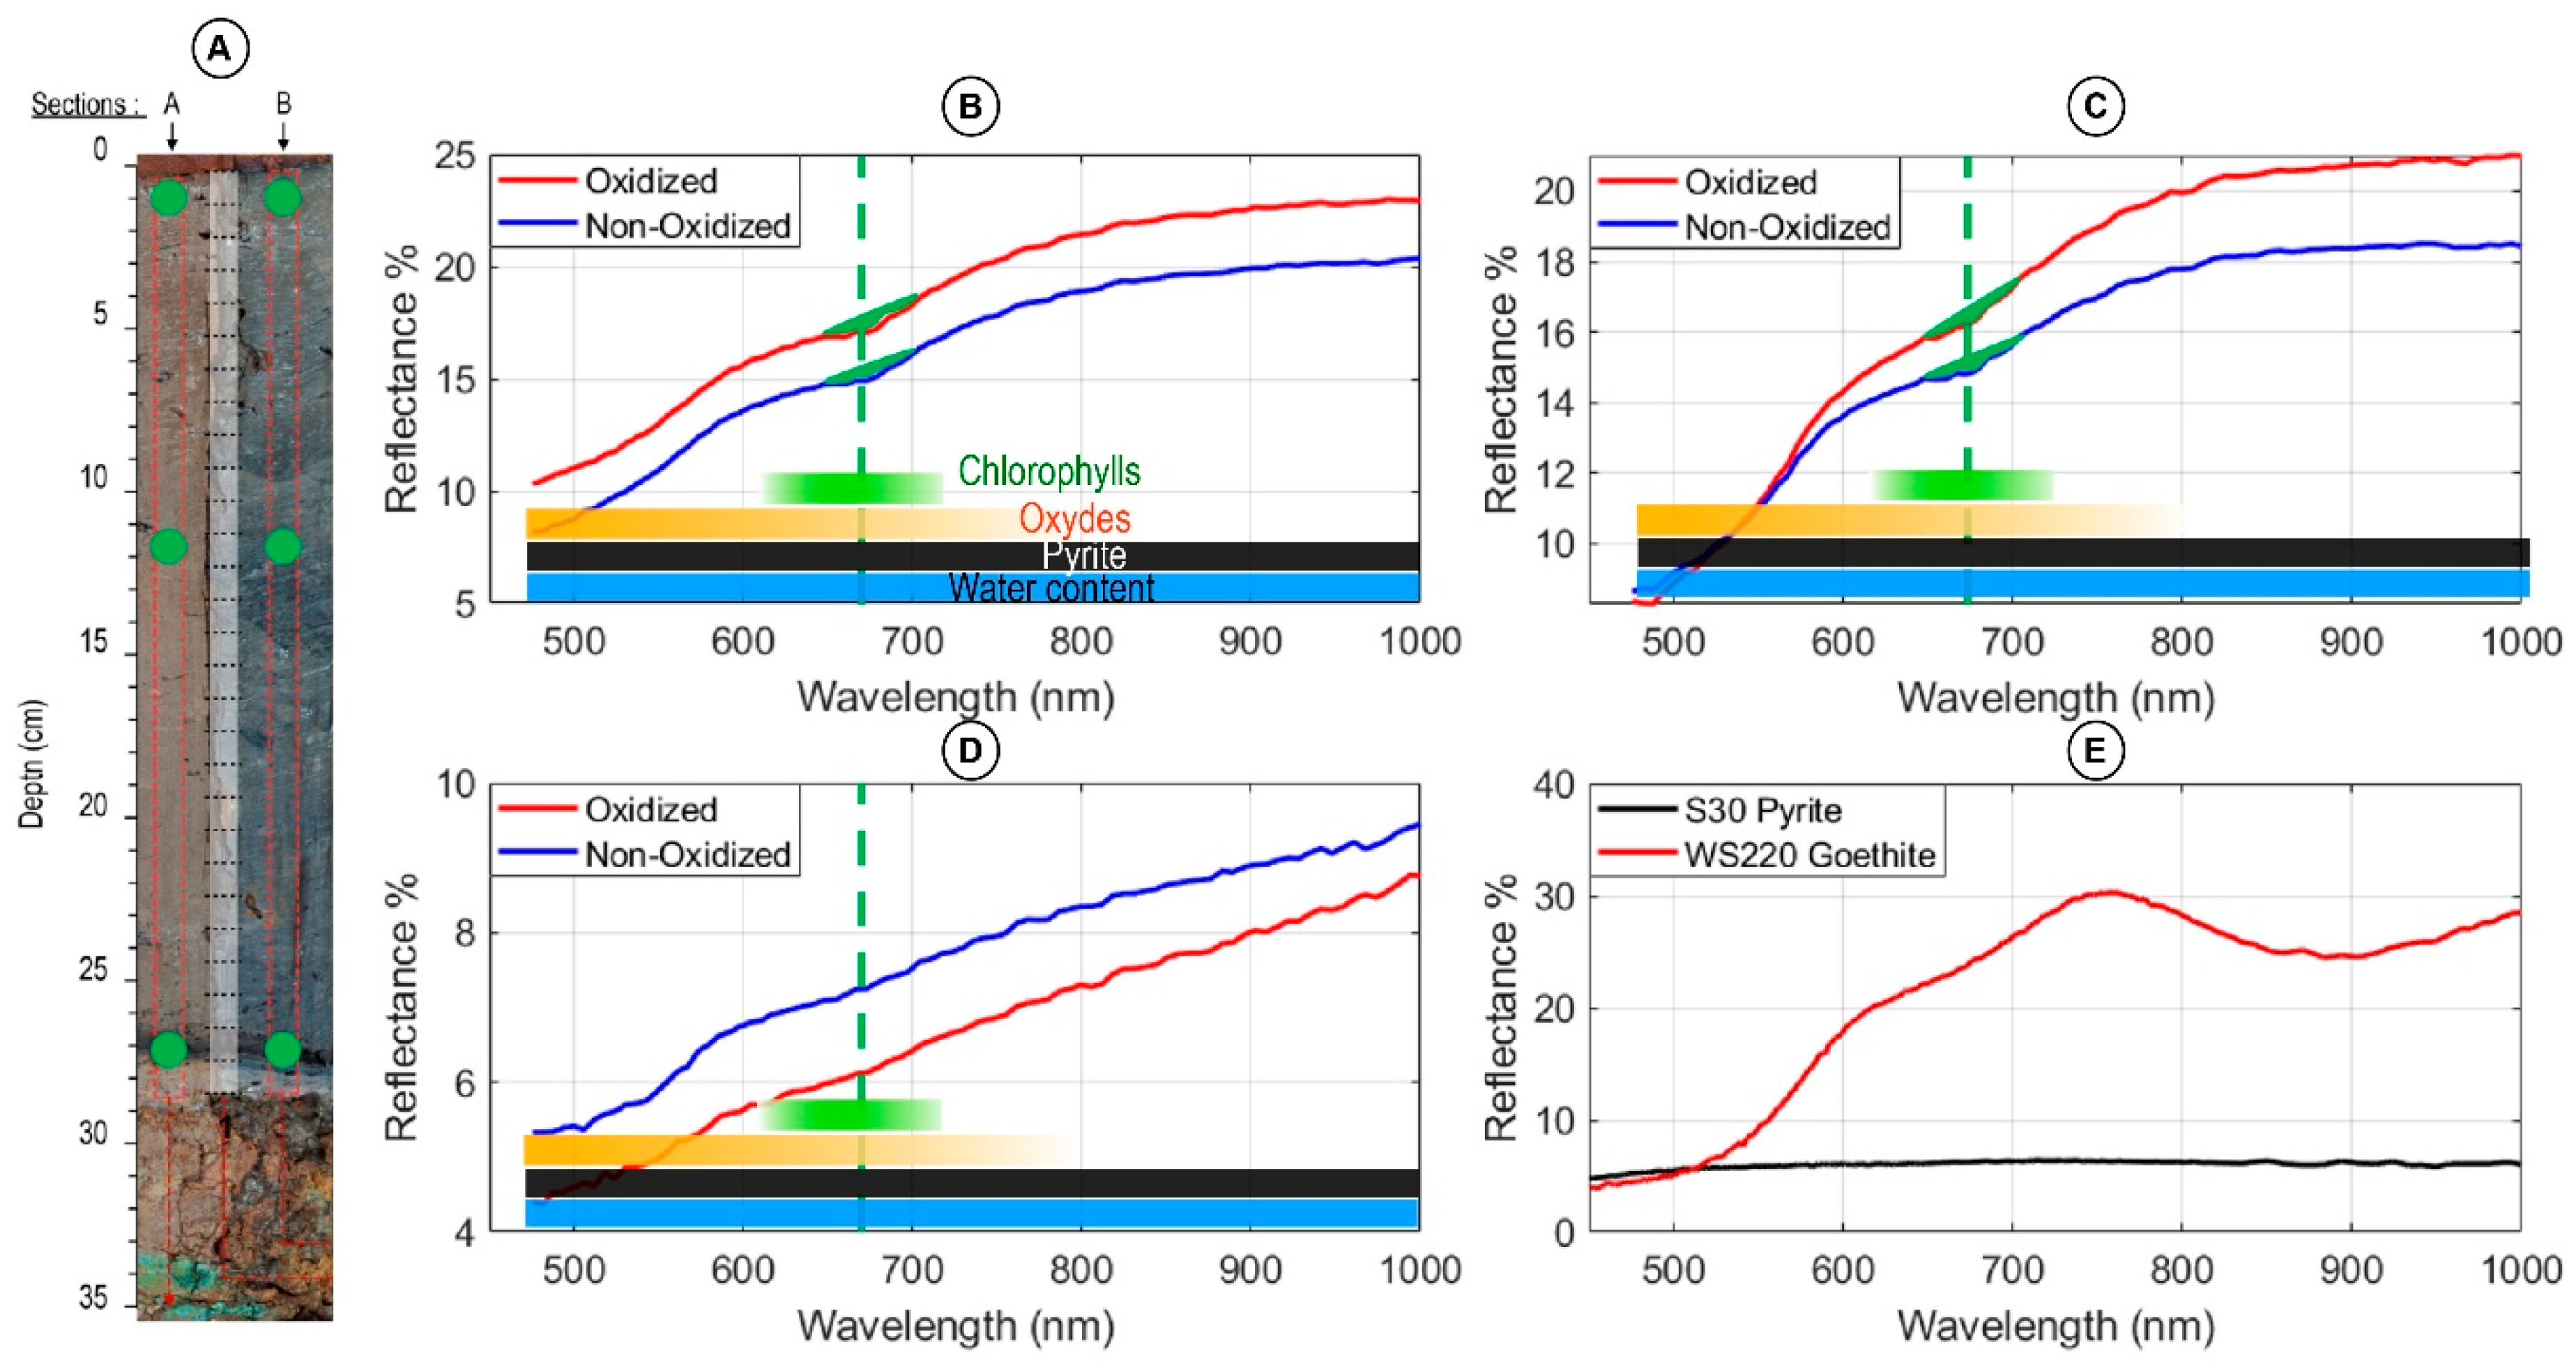
The comparison of sections A and B shows that the oxidation of the sedimentary matrix modifies the reflectance continuum (Figure 4). The average reflectance spectra of sections A and B show that the average reflectance has increased following oxidation (Supplementary Figure S2). Therefore, the increase in the intensity of the chlorophyll absorption band (Figure 2C) also corresponds to a general increase in the reflectance. The decrease in water content caused by the Balsam et al. [51] protocol in section A cannot explain the different shape of the average spectra of sections A and B since the absorption of H2O is uniform between 500 and 1000 nm (Figure 3) [57,58]. Moreover, before oxidation, pyrite and charcoal layers are black. After exposure to oxygen, pyrite disappears whereas charcoal layers stay black. Pyrite is a common mineral in sediment that reacts very fast with oxygen [59]. The offset between “oxidize” and “non-oxidized” curves seems to be the same along the core, but with a closer look at the Figure 2 and Supplementary Figure S2, the charcoal layer does not highlight an offset. This offset is less important when the charcoal content is more important. This means that the offset can be constant between oxidized and non-oxidized sediment if, and only if, the matrix effect remains constant. With the charcoal layer, the matrix effect changes and so does the offset.
We can hypothesize that this increase in the continuums may be explained by the oxidation of pyrite (FeS2) and the formation of iron oxides (Fe2O3) by an oxidation reaction, such as 4 FeS2 + 11 O2 = 2 Fe2O3 + 8 SO2 (gaseous). However, iron oxide and pyrite interact with light at different wavelengths (Figure 4E). The Fe-S bond absorbs light at all wavelengths measured, while the Fe-O bond absorbs light only between 300 and 550 nm [61]. The characteristic reflectance spectra of these bonds are illustrated by the spectra of pyrite (Fe-S bond) and goethite (Fe-O bond, Figure 4E, e.g., Clark et al. [60]).
Three consequences could occur when the sediment is oxidized. First, the oxidation of iron pyrite (FeS2) causes a decrease in absorbance and therefore an increase in reflectance between 500 and 1000 nm. The average reflectance of the sediment is therefore higher on the oxidized matrix. The formation of iron oxides (Fe2O3) limits this increase between 400 and 550 nm. The absorbance of the Fe-O bond only at short wavelengths implies a greater slope (inclination) of the average spectrum of section A (Figure 4).
Second, the absorption band of FeS2 (500–700 nm) and that of chlorophyll-a (670 nm) are superimposed. The absorption of FeS2 therefore partly hides the absorption of chlorophyll-a. Thus, the intensity of the absorption band of chlorophyll-a is less important in section B. The decrease in the intensity of the absorption band of chlorophyll by the presence of FeS2 results in a lower difference between the minimum reflectance at 670 nm and the continuum than after the oxidation. This implies a decrease of the area indices in section B compared with section A where the oxidized iron does not absorb at the same wavelengths as the chlorophyll-a. Furthermore, the greater intensity of the absorption band in chlorophyll-a following oxidation cannot be due to a decrease in the concentration of chlorophyll-a. Moreover, the work of Reuss and Conley [62] indicates that after 6 months at a storage temperature of 3 °C, the pigment concentrations are not affected. The oxidation over 24 h does not change the measured chlorophyll-a content, thus the concentration of chlorophyll-a is identical for both sections. The difference in the reflectance levels of the chlorophyll-a absorption band observed before and after oxidation on the Lake Bresson sediments likely depends on the presence of other sedimentary components and their respective affinity with oxygen.
Third, to accurately estimate the concentration of chlorophyll-a using hyperspectral analysis, the indices must consider variations in sediment composition. The different absorption bands of the sedimentary components result in changes in the reflectance continuum. The difference between the two sections is characterized by an increase in the slope of the spectra and their average reflectance. Thus, changes in the average reflectance spectra rendered the variations in the sedimentary composition. The division of the indices by the average spectrum on which they were calculated makes it possible to remove the impact of the continuum [63]. The normalization of the indices by the Rmean proxy would then make it possible to correct the effect of variations in the sedimentary composition. This hypothesis is tested below.
We can look at the AreaT650–700 index [45] in detail, for example to evaluate the effect of sediment oxidation on the reflectance of chlorophyll-a. This index is a direct measure of the intensity of the absorption band, and it allows the measurement of the difference in intensity of absorption caused by chlorophyll-a on the reflectance spectra with and without sediment oxidation (Figure 2C). The comparison of the index between the two sections shows an identical trend, but the average value is around 0.60 for the oxidized section, while the index is lower for the unoxidized section with an average value around 0.35. The minimum value is the same (0.2) for both sections and is 27 cm deep (unit 3). Therefore, when the sediment is oxidized, the absorption band of chlorophyll-a is deeper and larger than when the sediment is not oxidized.

5.2. Matrix Effect Correction: Normalization of Indices

5.2.1. Normalization by the Average Spectrum: Rmean

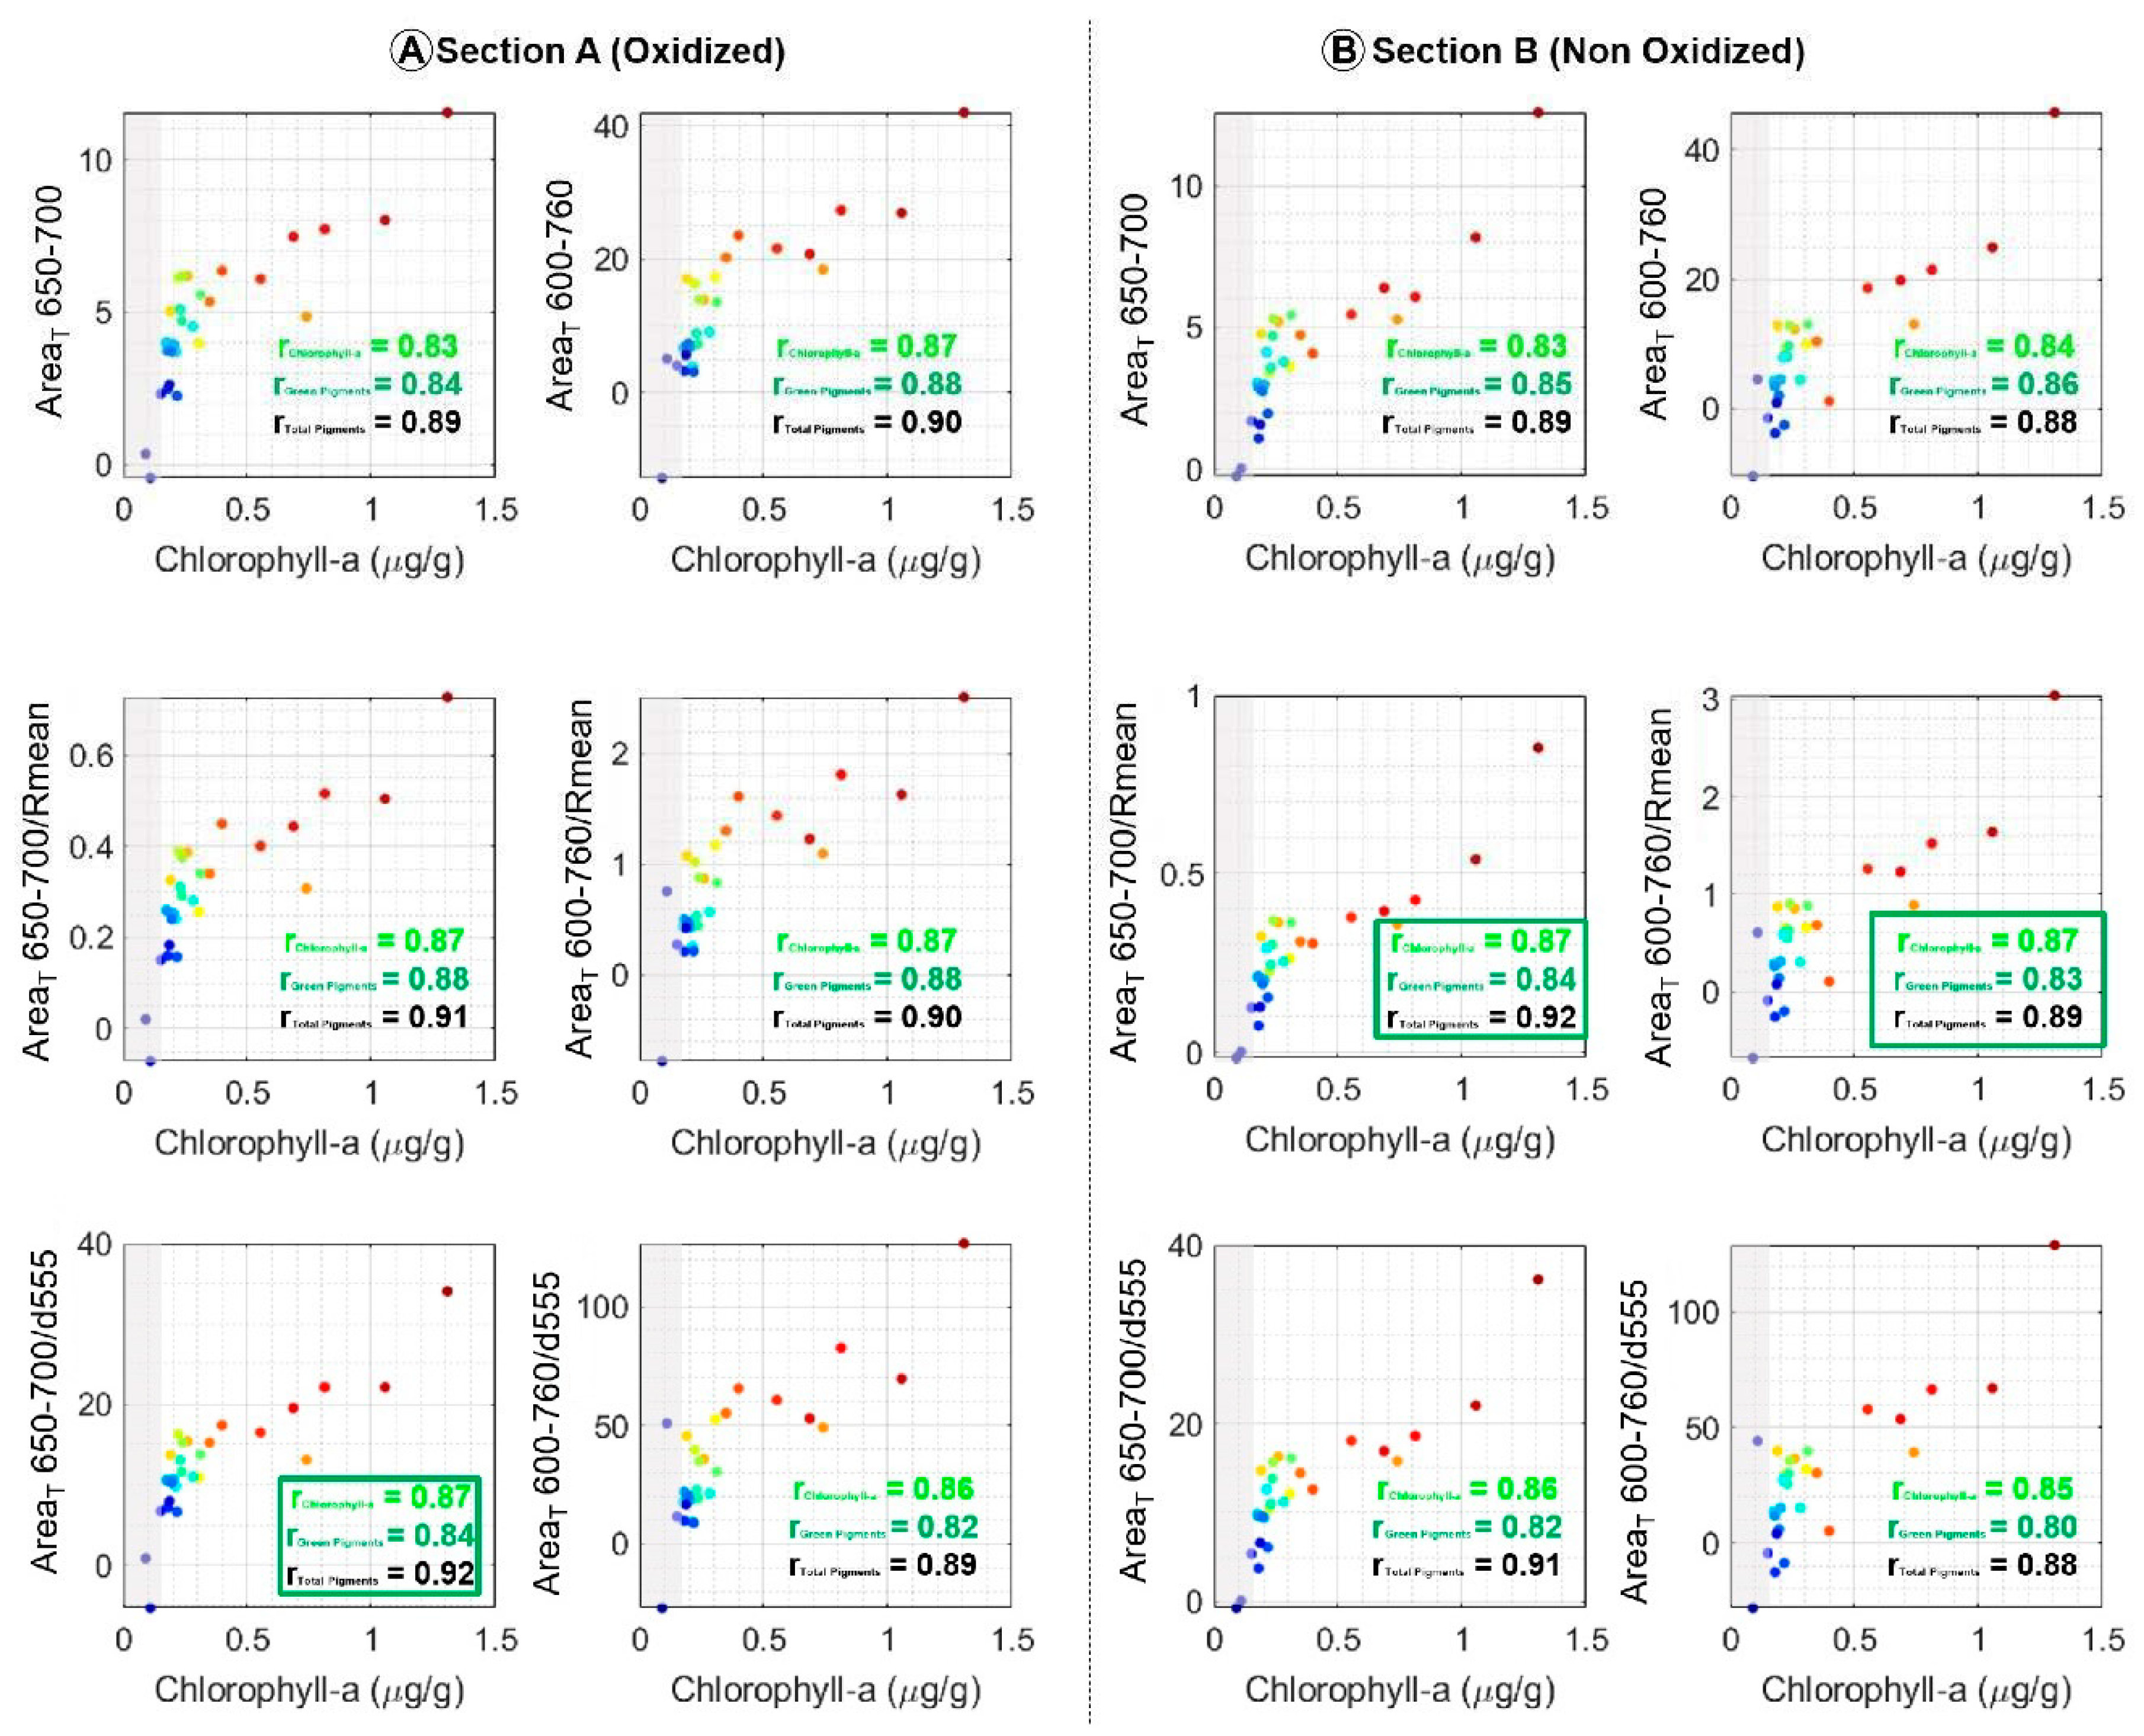
There are interactions between the minimum reflectance of the desired compound (here chlorophyll-a) and the rest of the sedimentary composition. This impact is referred to as the “continuum effect” or the “matrix effect” [51]. Thus, to accurately estimate the concentration of chlorophyll-a, the effect of the continuum on the indices must be corrected. Variations in the sediment composition result in changes in the average reflectance spectra (Figure 4). These variations are estimated by the Rmean proxy, which consists of calculating the average reflectance of each spectrum. The Rmean proxy is therefore used to correct the effect of variations in sediment composition on the spectra, by dividing the AreaT650–700 and AreaT600–760 indices. These normalized indices are plotted on sections A and B and compared with concentrations measured by HPLC (Figure 5; Supplementary Figure S3). Index users should be careful not to confuse the Rmean index with the average spectrum of a sedimentary archive. The averages of the reflectance spectra (Rmean) are calculated for each pixel, and each value is specific to a measurement (a pixel) and reflects a particular sedimentary composition. It is by this singularity that normalization allowed correcting the impact of the sedimentary composition on chlorophyll-a indices. Furthermore, division by the average spectrum of an archive (e.g., Von Gunten et al. [24]), like those presented in Figure 5, does not bring any improvement. In this case, a single value is used for all the indices, which is similar to dividing the index by a constant value. This division does not modify the variations of the index with respect to the calibration series. It is because the correlation coefficient measures the variance that it is independent of the average difference between the two variables. Therefore, dividing by a constant has no effect on correlation performance.
The RABD index cannot be normalized because its formula includes a first division by R670 (Table 1). Normalization by Rmean then constitutes a second division aimed at removing the matrix effect again. Indeed, the RABD index divided by Rmean was defined by Rein and Sirocko [44] as the I-Band index (Table 1). However, the I-Band index does not correlate significantly with the chlorophyll-a concentration in the sediments of Lake Bresson (Figure 3B). The second division has the effect of over-representing the other components of the sedimentary matrix on the absorption band of chlorophyll-a. Instead of correcting the effect of the sedimentary composition, these two successive divisions amplify the matrix effect. This property has also been exploited to plot the carbonized OM in the sediments of Lake Bresson [15].
The normalization of the AreaT650–700 index by Rmean increases the correlation with the chlorophyll-a concentration, which slightly increases from 0.83 to 0.87 in section A (oxidized). This effect is confirmed in section B where the correlations increase from 0.83 to 0.87. The high concentration of charcoal particles in unit 3 at a depth of 27 cm is also responsible for the large variations in the indices in section B, as previously shown in section A (Figure 3 and Figure 4). With normalization, the impact of carbonized OM at 27 cm deep on the index profile is reduced on both sections (Supplementary Figure S3, Figure 5). Variations at depths of 9 and 15 cm in the AreaT650–700 index are also reduced by normalization. However, for the AreaT600–760 index, normalization does not change the correlation in section A from r = 0.87 to r = 0.87, whereas it improves the correlation in section B from 0.84 to 0.87. This decrease is explained by the amplification of the two variations at 9 and 15 cm deep after normalization (Supplementary Figure S3, Figure 5: section B, AreaT600–760/Rmean). This result shows that a high-performance index on the oxidized section may not be adapted to the unoxidized section. Conversely, the AreaT650–700 index is improved by standardization on both sections. The difference between these two indices is the number of bands included in the area calculation. Therefore, this result suggests that the chlorophyll-a absorption intensity requires the adaptation of the wavelengths included in the area indices.
The only difference between the AreaT650–700 and AreaT600–760 indices is the width of the absorption band considered for evaluating chlorophyll-a: between 650 and 700 nm or between 600 and 760 nm. Since their correlations with chlorophyll-a concentrations are different, the area width used to calculate the indices therefore impacts the performance of the indices. The difference between the two sections deals with the presence of FeS2, which decreases the chlorophyll-a absorption band intensity. The decrease implies a reduction in the width in wavelength of the absorption band. The number of bands to be measured to calculate the absorption area must therefore be reduced. Indeed, the AreaT600–760 index incorporates an area wider than the absorption band of chlorophyll-a on section B and it then includes bands independent of the concentration of chlorophyll-a. The Rmean normalization corrects the effect of the matrix by integrating a division by bands independent of the chlorophyll-a concentration. However, if independent bands are already included in the chlorophyll-a index, the Rmean normalization amplifies the effect of the continuum. The same phenomenon occurs when the RABD index is divided by Rmean to form the I-band index (Table 1). In the Lake Bresson sediments, the Rmean division of the RABD index (which includes bands distant from 675 nm, i.e., 590 and 730 nm) amplifies the continuum effect by including too many bands independent of the chlorophyll-a concentration (Figure 3B).
A detailed look at the correlation coefficient between hyperspectral measurements and chlorophyll a, or green pigments or total pigments, shows that the correlations with total pigment are the best. The correlation increases drastically with chlorophyll-a content or with green pigments. For these last two, the correlation coefficient is the same.

5.2.2. Normalization by the Signature in Oxides: d555

It is important to consider the oxide impact. Indeed, it interacts with the reflectance continuum from a content of 0.01 wt% [52]. The difference in sediment composition between the oxidized and unoxidized sections is characterized by a different spectrum slope (Figure 4). The slope is accentuated in the presence of iron oxides. Therefore, the indices are normalized by a slope index of the 555 nm spectrum that corrects for the effect of changes in iron oxide content (i.e., the “d555” index [64,65]). This approach aims to further reduce the impact of the reflectance continuum by specifically targeting a component with a strong impact on the shape of the reflectance continuum; in a second step the normalization of the AreaT650–700 and AreaT600–760 indices was thus also performed with the index d555 (Figure 5).
In the presence of iron oxides in section A, normalization of the AreaT650–700 index by d555 increases the correlation of r = 0.83 to r = 0.87. This normalization has low impact on the correlation of the AreaT600–760 index (r = 0.86). In contrast, in the absence of iron oxides in section B, the division by d555 adds a bias to the indices and has less effect on the correlation coefficients. These results are explained simply by the absence of iron oxides on section B, where consequently the index is less accurate to consider the variations of the sedimentary composition. Normalization by d555 is only relevant in the presence of iron oxides. This result confirms the impact of the sedimentary composition on the chlorophyll-a indices and the correction of the variations of the sedimentary composition by the normalization of the indices with a marker of the matrix.

5.3. The Problem of Quantification

The choice to use a linear regression can be questionable with regard to the trend of the correlations presented in Figure 3 and Figure 5. In order to approach this problem, the example of AreaT600–760 index was chosen because it illustrates the fact that it seems to have a first correlation line for values below 0.2 µg·g−1, and a second for higher values. This break in the correlation slopes is explained by the HPLC values, which seem to mark a threshold, while the hyperspectral values conserve their variability. First of all, this slope change value around 0.2 µg·g−1 is higher than the detection threshold of 0.03 µg·g−1 but also the quantification threshold which is 0.08 µg·g−1 by our HPLC protocol. Nevertheless, it is interesting to note that this second slope (Figure 6) tends to disappear when correlated with green pigments or is even better with total pigments. The explanation stems, in particular, from the fact that all the pigments measured are specifically covariant in our sedimentary record, and thus correlating with chlorophyll-a or all of the pigments is the same. The concentration of pigments being necessarily higher than the quantity of chlorophyll alone makes it possible to move away from the threshold value of 0.2 µg·g−1 of chlorophyll a. The problem of this double slope therefore comes from low concentrations below 0.2 µg·g−1 which, although above the quantification threshold (0.08 µg·g−1), seems to pose a problem. However, as evidenced by the depth profiles (Figure 2 and Supplementary Figures S1 and S3), hyperspectral imaging such as HPLC detects low concentration levels. Indeed, the two weakest points, even negative, correspond to the level of coals linked to the fire. However, the correlation is lost. It would therefore seem that there is uncertainty about the correlation when the values are lower than 0.2 µg·g−1.
A consequence of this uncertainty is that it could have strongly impacted all the correlations of all the indices tested in Figure 3. If this is the case, certain indices could be admissible even though they were initially discarded, and potentially render the need for division by Rmean or d555 to improve quantification of chlorophyll a. For this, we removed the points lower than 0.2 µg·g−1, and studied again the correlation coefficients for the higher concentrations presented in Table S1, Figure 4. However, it appears that removing these data has very little influence on the correlation values. The admissible indices stay admissible and the others do not improve, or not enough, to be taken into account.

6. Conclusions

Chlorophyll-a is a marker used routinely for paleo productivity reconstructions (e.g., Kaufman [66] and references therein). To track changes in primary productivity at high resolution, hyperspectral signal processing must consider the impact of other sedimentary components on the reflectance of chlorophyll-a. This study defines the AreaT650–700 index as the best of the 18 existing indices. A new method is defined to correct the effects of iron oxides and detrital OM (charcoal here) on the spectra. These results allow for the correction of the reconstruction of chlorophyll-a in the sediments of Lake Bresson and opens up the prospect of being able to explore this method on other lacustrine sedimentary archives to improve paleo-environmental reconstructions. To avoid the effect of oxidized iron, (iron (hydro)oxides), frequently observed in various sediment reflectance spectra, we suggest normalization by the d555 proxy, which significantly improves the tracing of chlorophyll-a in a matrix rich in iron oxides, even at low concentrations (i.e., <1 μg·g−1). In addition, the Rmean normalization corrects the variations of the sedimentary composition in relation to the presence of pyrite and refractory OM (charcoals) originating from the watershed. Chlorophyll-a can now be tracked in complex sedimentary matrices by hyperspectral imaging.
Normalization should be performed by an index selected based on an understanding of the sediment dynamics of the relevant geosystem (watershed/sediment receptacle). The constituents identified here underline the impacts of carbonized OM and iron oxides, and the two examples from this study on sediments from Lake Bresson lead to the normalization of the AreaT650–700 index by d555 on the oxidized matrix A, whereas the Rmean index is used in the un-oxidized matrix B. Finally, the normalization of the indices reminds us of the ratios used in the XRF technique, where a characteristic element of the geochemical signature of the watersheds is divided by another element (e.g., Ca, Al, Si) to reveal variations independent of the chemical background of a geosystem [67]. This same approach must be carried out for hyperspectral imaging and in the future the AreaT650–700 spectral index must therefore be systematically normalized to faithfully reconstruct the concentration of chlorophyll-a.

Supplementary Materials

The following supporting information can be downloaded at: https://www.mdpi.com/article/10.3390/quat5040053/s1.

Author Contributions

Conceptualization, A.V.E., M.D., Y.C. and B.V.; Data curation, M.D., K.J.; Formal analysis, C.V., K.J.; Funding acquisition, M.D.; Investigation, A.V.E., M.D. and Y.C.; Methodology, A.V.E., M.D., C.V., S.M. and B.V.; Project administration, M.D. and B.V.; Supervision, M.D., Y.C., B.L. and B.V.; Writing—original draft, A.V.E., M.D., Y.C. and B.V.; Writing—review & editing, A.V.E., M.D., Y.C. and B.V. All authors have read and agreed to the published version of the manuscript.

Funding

This work was funded by the Region Normandie, which supports the scientific consortium SCALE UMR CNRS 3730.

Institutional Review Board Statement

Not applicable.

Informed Consent Statement

Not applicable.

Data Availability Statement

Not applicable.

Acknowledgments

Michel Simon and Léo Chaumillon are thanks for preparation and help during field work.

Conflicts of Interest

All authors have read and agreed to the published version of the manuscript. The funders had no role in the design of the study; in the collection, analyses, or interpretation of data; in the writing of the manuscript, or in the decision to publish the results.

References

  1. Brantley, S.L.; Goldhaber, M.B.; Vala Ragnarsdottir, K. Crossing disciplines and scales to understand the critical zone. Elements 2007, 3, 307–314. [Google Scholar] [CrossRef]
  2. Friedrich, J.; Janssen, F.; Aleynik, D.; Bange, H.W.; Boltacheva, N.; Çagatay, M.N.; Dale, A.W.; Etiope, G.; Erdem, Z.; Geraga, M.; et al. Investigating hypoxia in aquatic environments: Diverse approaches to addressing a complex phenomenon. Biogeosciences 2014, 11, 1215–1259. [Google Scholar] [CrossRef] [Green Version]
  3. Jenny, J.P.; Francus, P.; Normandeau, A.; Lapointe, F.; Perga, M.E.; Ojala, A.; Schimmelmann, A.; Zolitschka, B. Global spread of hypoxia in freshwater ecosystems during the last three centuries is caused by rising local human pressure. Glob. Chang. Biol. 2016, 22, 1481–1489. [Google Scholar] [CrossRef] [PubMed]
  4. Battarbee, R.W.; Anderson, N.J.; Bennion, H.; Simpson, G.L. Combining limnological and palaeolimnological data to disentangle the effects of nutrient pollution and climate change on lake ecosystems: Problems and potential. Freshw. Biol. 2012, 57, 2091–2106. [Google Scholar] [CrossRef] [Green Version]
  5. Mills, K.; Schillereff, D.; Saulnier-Talbot, É.; Gell, P.; Anderson, N.J.; Arnaud, F.; Dong, X.; Jones, M.; McGowan, S.; Massaferro, J.; et al. Deciphering long-term records of natural variability and human impact as recorded in lake sediments: A palaeolimnological puzzle. Wiley Interdiscip. Rev. Water 2017, 4, e1195. [Google Scholar] [CrossRef] [Green Version]
  6. Schneider, T.; Rimer, D.; Butz, C.; Grosjean, M. A high-resolution pigment and productivity record from the varved Ponte Tresa basin (Lake Lugano, Switzerland) since 1919: Insight from an approach that combines hyperspectral imaging and high-performance liquid chromatography. J. Paleolimnol. 2018, 60, 381–398. [Google Scholar] [CrossRef]
  7. Lee, M.; Shevliakova, E.; Malyshev, S.; Milly, P.C.D.; Jaffé, P.R. Climate variability and extremes, interacting with nitrogen storage, amplify eutrophication risk. Geophys. Res. Lett. 2016, 43, 7520–7528. [Google Scholar] [CrossRef] [Green Version]
  8. Wolfe, A.P.; Hobbs, W.O.; Birks, H.H.; Briner, J.P.; Holmgren, S.U.; Ingólfsson, Ó.; Kaushal, S.S.; Miller, G.H.; Pagani, M.; Saros, J.E.; et al. Stratigraphic expressions of the Holocene–Anthropocene transition revealed in sediments from remote lakes. Earth Sci. Rev. 2013, 116, 17–34. [Google Scholar] [CrossRef]
  9. Holmgren, S.U.; Bigler, C.; Ingólfsson, Ó.; Wolfe, A.P. The Holocene-Anthropocene transition in lakes of western spitsbergen, Svalbard (Norwegian high arctic): Climate change and nitrogen deposition. J. Paleolimnol. 2010, 43, 393–412. [Google Scholar] [CrossRef]
  10. Florian, C.R.; Miller, G.H.; Fogel, M.L.; Wolfe, A.P.; Vinebrooke, R.D.; Geirsdóttir, Á. Algal pigments in Arctic lake sediments record biogeochemical changes due to Holocene climate variability and anthropogenic global change. J. Paleolimnol. 2015, 54, 53–69. [Google Scholar] [CrossRef]
  11. Waters, C.N.; Steffen, W.; Waters, C.N.; Zalasiewicz, J.; Zalasiewicz, J.; Summerhayes, C.; Summerhayes, C.; Barnosky, A.D.; Barnosky, A.D.; Poirier, C.; et al. The Anthropocene is functionally and stratigraphically distinct from the Holocene. Science 2016, 351, aad2622. [Google Scholar] [CrossRef] [PubMed]
  12. Giguet-Covex, C.; Arnaud, F.; Poulenard, J.; Enters, D.; Reyss, J.-L.; Millet, L.; Lazzaroto, J.; Vidal, O. Sedimentological and geochemical records of past trophic state and hypolimnetic anoxia in large, hard-water Lake Bourget, French Alps. J. Paleolimnol. 2010, 43, 171–190. [Google Scholar] [CrossRef]
  13. Winegardner, A.K.; Legendre, P.; Beisner, B.E.; Gregory-Eaves, I. Diatom diversity patterns over the past c. 150 years across the conterminous United States of America: Identifying mechanisms behind beta diversity. Glob. Ecol. Biogeogr. 2017, 26, 1303–1315. [Google Scholar] [CrossRef]
  14. Zalasiewicz, J.A.N.; Williams, M.; Steffen, W.; Crutzen, P. The new world of the anthropocene. Environ. Sci. Technol. 2010, 44, 2228–2231. [Google Scholar] [CrossRef] [PubMed]
  15. Van Exem, A.; Debret, M.; Copard, Y.; Vannière, B.; Sabatier, P.; Marcotte, S.; Laignel, B.; Reyss, J.-L.; Desmet, M. Hyperspectral core logging for fire reconstruction studies. J. Paleolimnol. 2018, 59, 297–308. [Google Scholar] [CrossRef]
  16. Van Exem, A.; Debret, M.; Copard, Y.; Verpoorter, C.; De Wet, G.; Lecoq, N.; Sorrel, P.; Werner, A.; Roof, S.; Laignel, B.; et al. New source-to-sink approach in an arctic catchment based on hyperspectral core-logging (Lake Linné, Svalbard). Quat. Sci. Rev. 2019, 203, 128–140. [Google Scholar] [CrossRef]
  17. Jacq, K.; Perrette, Y.; Fanget, B.; Sabatier, P.; Coquin, D.; Martinez-Lamas, R.; Debret, M.; Arnaud, F. High-resolution prediction of organic matter concentration with hyperspectral imaging on a sediment core. Sci. Total Environ. 2019, 663, 236–244. [Google Scholar] [CrossRef] [Green Version]
  18. Jacq, K.; Giguet-Covex, C.; Sabatier, P.; Perrette, Y.; Fanget, B.; Coquin, D.; Debret, M.; Arnaud, F. High-resolution grain size distribution of sediment core with hyperspectral imaging. Sediment. Geol. 2019, 393–394, 105536. [Google Scholar] [CrossRef]
  19. Jacq, K.; Rapuc, W.; Benoit, A.; Coquin, D.; Fanget, B.; Perrette, Y.; Sabatier, P.; Wilhelm, B.; Debret, M.; Arnaud, F. Sedimentary structure discrimination with hyperspectral imaging in sediment cores. Sci. Total Environ. 2022, 817, 152018. [Google Scholar] [CrossRef]
  20. Butz, C.; Grosjean, M.; Fischer, D.; Wunderle, S.; Tylmann, W.; Rein, B. Hyperspectral imaging spectroscopy: A promising method for the biogeochemical analysis of lake sediments. J. Appl. Remote Sens. 2015, 9, 096031. [Google Scholar] [CrossRef]
  21. Butz, C.; Grosjean, M.; Poraj-Górska, A.; Enters, D.; Tylmann, W. Sedimentary Bacteriopheophytin a as an indicator of meromixis in varved lake sediments of Lake Jaczno, north-east Poland, CE 1891–2010. Glob. Planet. Chang. 2016, 144, 109–118. [Google Scholar] [CrossRef]
  22. Butz, C.; Grosjean, M.; Goslar, T.; Tylmann, W. Hyperspectral imaging of sedimentary bacterial pigments: A 1700-year history of meromixis from varved Lake Jaczno, northeast Poland. J. Paleolimnol. 2017, 58, 57–72. [Google Scholar] [CrossRef]
  23. Zander, P.D.; Wienhues, G.; Grosjean, M. Scanning Hyperspectral Imaging for In Situ Biogeochemical Analysis of Lake Sediment Cores: Review of Recent Developments Scanning Hyperspectral Imaging for n Situ Biogeochemical Analysis of Lake Sediment Cores: Review of Recent Developments. J. Imaging 2022, 8, 58. [Google Scholar] [CrossRef] [PubMed]
  24. Von Gunten, L.; D’Andrea, W.J.; Bradley, R.S.; Huang, Y. Proxy-to-proxy calibration: Increasing the temporal resolution of quantitative climate reconstructions. Sci. Rep. 2012, 2, 609. [Google Scholar] [CrossRef] [Green Version]
  25. Michelutti, N.; Smol, J.P. Visible spectroscopy reliably tracks trends in paleo-production. J. Paleolimnol. 2016, 56, 253–265. [Google Scholar] [CrossRef]
  26. Müller, P.J.; Suess, E. Productivity, sedimentation rate, and sedimentary organic matter in the oceans-I. Organic carbon preservation. Deep Sea Res. Part A Oceanogr. Res. Pap. 1979, 26, 1347–1362. [Google Scholar] [CrossRef]
  27. Middelburg, J.J.; Vlug, T.; Vandernat, F.J.W.A. Organic-Matter Mineralization in Marine Systems. Glob. Planet. Chang. 1993, 8, 47–58. [Google Scholar] [CrossRef]
  28. Ferland, M.E.; Prairie, Y.T.; Teodoru, C.; Del Giorgio, P.A. Linking organic carbon sedimentation, burial efficiency, and long-term accumulation in boreal lakes. J. Geophys. Res. Biogeosci. 2014, 119, 836–847. [Google Scholar] [CrossRef]
  29. Gudasz, C.; Bastviken, D.; Steger, K.; Premke, K.; Sobek, S.; Tranvik, L.J. Temperature-controlled organic carbon mineralization in lake sediments. Nature 2010, 466, 478–481. [Google Scholar] [CrossRef] [Green Version]
  30. Kristensen, E.; Holmer, M. Decomposition of plant materials in marine sediment exposed to different electron acceptors (O2, NO3 and SO42−), with emphasis on substrate origin, degradation kinetics, and the role of bioturbation. Geochim. Cosmochim. Acta 2001, 65, 419–433. [Google Scholar] [CrossRef]
  31. Moodley, L.; Middelburg, J.; Herman, P.; Soetaert, K.; de Lange, G. Oxygenation and organic-matter preservation in marine sediments: Direct experimental evidence from ancient organic carbon-rich deposits. Geology 2005, 33, 889–892. [Google Scholar] [CrossRef] [Green Version]
  32. Sobek, S.; Durisch-Kaiser, E.; Zurbrügg, R.; Wongfun, N.; Wessels, M.; Pasche, N.; Wehrli, B. Organic carbon burial efficiency in lake sediments controlled by oxygen exposure time and sediment source. Limnol. Oceanogr. 2009, 54, 2243–2254. [Google Scholar] [CrossRef] [Green Version]
  33. Kristensen, E. Organic matter diagenesis at the oxic/anoxic interface in coastal marine sediments, with emphasis on the role of burrowing animals. Hydrobiologia 2000, 426, 1–24. [Google Scholar] [CrossRef]
  34. Das, B.; Vinebrooke, R.D.; Sanchez-azofeifa, A.; Rivard, B.; Wolfe, A.P. Inferring sedimentary chlorophyll concentrations with reflectance spectroscopy: A novel approach to reconstructing historical changes in the trophic status of mountain lakes. Can. J. Fish. Aquat. Sci. 2005, 62, 1067–1078. [Google Scholar] [CrossRef] [Green Version]
  35. Chen, Q.; Liu, X.; Nie, Y.; Sun, L. Using visible reflectance spectroscopy to reconstruct historical changes in chlorophyll-a concentration in East Antarctic ponds. Polar Res. 2013, 32, 19932. [Google Scholar] [CrossRef]
  36. Michelutti, N.; Blais, J.M.; Cumming, B.F.; Paterson, A.M.; Rühland, K.; Wolfe, A.P.; Smol, J.P. Do spectrally inferred determinations of chlorophyll-a reflect trends in lake trophic status? J. Paleolimnol. 2010, 43, 205–217. [Google Scholar] [CrossRef]
  37. Saunders, K.M.; Kamenik, C.; Hodgson, D.A.; Hunziker, S.; Siffert, L.; Fischer, D.; Fujak, M.; Gibson, J.A.E.; Grosjean, M. Late Holocene changes in precipitation in northwest Tasmania and their potential links to shifts in the Southern Hemisphere westerly winds. Glob. Planet. Chang. 2012, 92–93, 82–91. [Google Scholar] [CrossRef]
  38. Meyer, I.; Van Daele, M.; Fiers, G.; Verleyen, E.; De Batist, M.; Verschuren, D. Sediment reflectance spectroscopy as a paleo-hydrological proxy in East Africa. Limnol. Oceanogr. Methods 2018, 16, 92–105. [Google Scholar] [CrossRef]
  39. von Gunten, L.; Grosjean, M.; Rein, B.; Urrutia, R.; Appleby, P. A quantitative high-resolution summer temperature reconstruction based on sedimentary pigments from Laguna Aculeo, central Chile, back to AD 850. Holocene 2009, 19, 873–881. [Google Scholar] [CrossRef] [Green Version]
  40. Trachsel, M.; Grosjean, M.; Schnyder, D.; Kamenik, C.; Rein, B. Scanning reflectance spectroscopy (380–730 nm): A novel method for quantitative high-resolution climate reconstructions from minerogenic lake sediments. J. Paleolimnol. 2010, 44, 979–994. [Google Scholar] [CrossRef]
  41. Saunders, K.M.; Grosjean, M.; Hodgson, D.A. A 950 yr temperature reconstruction from Duckhole Lake, southern Tasmania, Australia. Holocene 2013, 23, 771–783. [Google Scholar] [CrossRef]
  42. Amann, B.; Lobsiger, S.; Fischer, D.; Tylmann, W.; Bonk, A.; Filipiak, J.; Grosjean, M. Spring temperature variability and eutrophication history inferred from sedimentary pigments in the varved sediments of Lake Zabińskie, north-eastern Poland, AD 1907–2008. Glob. Planet. Chang. 2014, 123, 86–96. [Google Scholar] [CrossRef]
  43. Boldt, B.R.; Kaufman, D.S.; Mckay, N.P.; Briner, J.P. Holocene summer temperature reconstruction from sedimentary chlorophyll content, with treatment of age uncertainties, Kurupa Lake, Arctic Alaska. Holocene 2015, 25, 641–650. [Google Scholar] [CrossRef]
  44. Rein, B.; Sirocko, F. In-situ reflectance spectroscopy—Analysing techniques for high-resolution pigment logging in sediment cores. Int. J. Earth Sci. 2002, 91, 950–954. [Google Scholar] [CrossRef]
  45. Wolfe, A.P.; Vinebrooke, R.D.; Michelutti, N.; Rivard, B.; Das, B. Experimental calibration of lake-sediment spectral reflectance to chlorophyll-a concentrations: Methodology and paleolimnological validation. J. Paleolimnol. 2006, 36, 91–100. [Google Scholar] [CrossRef]
  46. Debret, M.; Desmet, M.; Balsam, W.; Copard, Y.; Francus, P.; Laj, C. Spectrophotometer analysis of Holocene sediments from an anoxic fjord: Saanich Inlet, British Columbia, Canada. Mar. Geol. 2006, 229, 15–28. [Google Scholar] [CrossRef]
  47. Barillé, L.; Méléder, V.; Combe, J.P.; Launeau, P.; Rincé, Y.; Carrère, V.; Morançais, M. Comparative analysis of field and laboratory spectral reflectances of benthic diatoms with a modified Gaussian model approach. J. Exp. Mar. Bio. Ecol. 2007, 343, 197–209. [Google Scholar] [CrossRef]
  48. Zander, P.D.; Żarczyński, M.; Vogel, H.; Tylmann, W.; Wacnik, A.; Sanchini, A.; Grosjean, M. A high-resolution record of Holocene primary productivity and water-column mixing from the varved sediments of Lake Żabińskie, Poland. Sci. Total Environ. 2020, 755, 143713. [Google Scholar] [CrossRef]
  49. Balsam, W.L.; Deaton, B.C.; Damuth, J.E. Evaluating optical lightness as a proxy for carbonate content in marine sediment cores. Mar. Geol. 1999, 161, 141–153. [Google Scholar] [CrossRef]
  50. Debret, M.; Sebag, D.; Desmet, M.; Balsam, W.; Copard, Y.; Mourier, B.; Susperrigui, A.-S.; Arnaud, F.; Bentaleb, I.; Chapron, E.; et al. Spectrocolorimetric interpretation of sedimentary dynamics: The new “Q7/4 diagram”. Earth-Sci. Rev. 2011, 109, 1–19. [Google Scholar] [CrossRef]
  51. Balsam, W.L.; Deaton, B.C.; Damuth, J.E. The effects of water content on diffuse reflectance spectrophotometry studies of deep-sea sediment cores. Mar. Geol. 1998, 149, 177–189. [Google Scholar] [CrossRef]
  52. Balsam, W.; Ji, J.; Renock, D.; Deaton, B.C.; Williams, E. Determining hematite content from NUV/Vis/NIR spectra: Limits of detection. Am. Mineral. 2014, 99, 2280–2291. [Google Scholar] [CrossRef]
  53. Van Heukelem, L.; Thomas, C.S. Computer-assisted high-performance liquid chromatography method development with applications to the isolation and analysis of phytoplankton pigments. J. Chromatogr. A 2001, 910, 31–49. [Google Scholar] [CrossRef] [PubMed]
  54. Jacq, K.; Martinez-Lamas, R.; Van Exem, A.; Debret, M. Hyperspectral Core-Logger Image Acquisition; Protocols.io: Berkeley, CA, USA, 2020. [Google Scholar]
  55. Sunshine, J.M.; Pieters, C.M.; Pratt, S.F. Deconvolution of Mineral Absorption Bands: An Improved Approach. J. Geophys. Res. 1990, 95, 6955–6966. [Google Scholar] [CrossRef] [Green Version]
  56. van der Meer, F.; Kopačková, V.; Koucká, L.; van der Werff, H.M.A.; van Ruitenbeek, F.J.A.; Bakker, W.H. Wavelength feature mapping as a proxy to mineral chemistry for investigating geologic systems: An example from the Rodalquilar epithermal system. Int. J. Appl. Earth Obs. Geoinf. 2018, 64, 237–248. [Google Scholar] [CrossRef]
  57. Verpoorter, C.; Carrère, V.; Combe, J.-P. Visible, near-infrared spectrometry for simultaneous assessment of geophysical sediment properties (water and grain size) using the Spectral Derivative-Modified Gaussian Model. J. Geophys. Res. Earth Surf. 2014, 119, 2098–2122. [Google Scholar] [CrossRef]
  58. Balsam, W.L.; Damuth, J.E.; Schneider, R.R. Comparison of shipboard vs. Shore-based spectral data from amazon fan cores: Implications for interpreting sediment composition. In Proceedings of the Ocean Drilling Program, Scientific Results; ODP Publications: College Station, TX, USA, 1997; Volume 155, pp. 193–215. [Google Scholar]
  59. Chang, S.; Berner, R.A. Coal weathering and the geochemical carbon cycle. Geochim. Cosmochim. Acta 1999, 63, 3301–3310. [Google Scholar] [CrossRef]
  60. Clark, R.N.; Swayze, G.A.; Wise, R.A.; Livo, K.E.; Hoefen, T.M.; Kokaly, R.F.; Sutley, S.J. USGS Digital Spectral Library splib06a; U.S. Geological Survey: Reston, VA, USA, 2007. [CrossRef]
  61. Hunt, G.R. Spectral Signatures of Particulate Minerals in the Visible and Near Infrared. Geophysics 1977, 42, 501. [Google Scholar] [CrossRef] [Green Version]
  62. Reuss, N.; Conley, D.J. Effects of sediment storage conditions on pigment analyses. Limnol. Oceanogr. Methods 2005, 3, 477–487. [Google Scholar] [CrossRef]
  63. Clark, R.N.; Roush, T.L. Reflectance spectroscopy: Quantitative analysis techniques for remote sensing applications. J. Geophys. Res. Solid Earth 1984, 89, 6329–6340. [Google Scholar] [CrossRef]
  64. Barranco, F.T.; Balsam, W.L.; Deaton, B.C. Quantitative reassessment of brick red lutites: Evidence from reflectance spectrophotometry. Mar. Geol. 1989, 89, 299–314. [Google Scholar] [CrossRef]
  65. Deaton, B.C.; Balsam, W.L. Visible spectroscopy—A rapid method for determining hematite and goethite concentration in geological materials. J. Sediment. Petrol. 1991, 61, 628–632. [Google Scholar] [CrossRef]
  66. Kaufman, D.S. An overview of late Holocene climate and environmental change inferred from Arctic lake sediment. J. Paleolimnol. 2009, 41, 1–6. [Google Scholar] [CrossRef]
  67. Weltje, G.J.; Tjallingii, R. Calibration of XRF core scanners for quantitative geochemical logging of sediment cores: Theory and application. Earth Planet. Sci. Lett. 2008, 274, 423–438. [Google Scholar] [CrossRef]
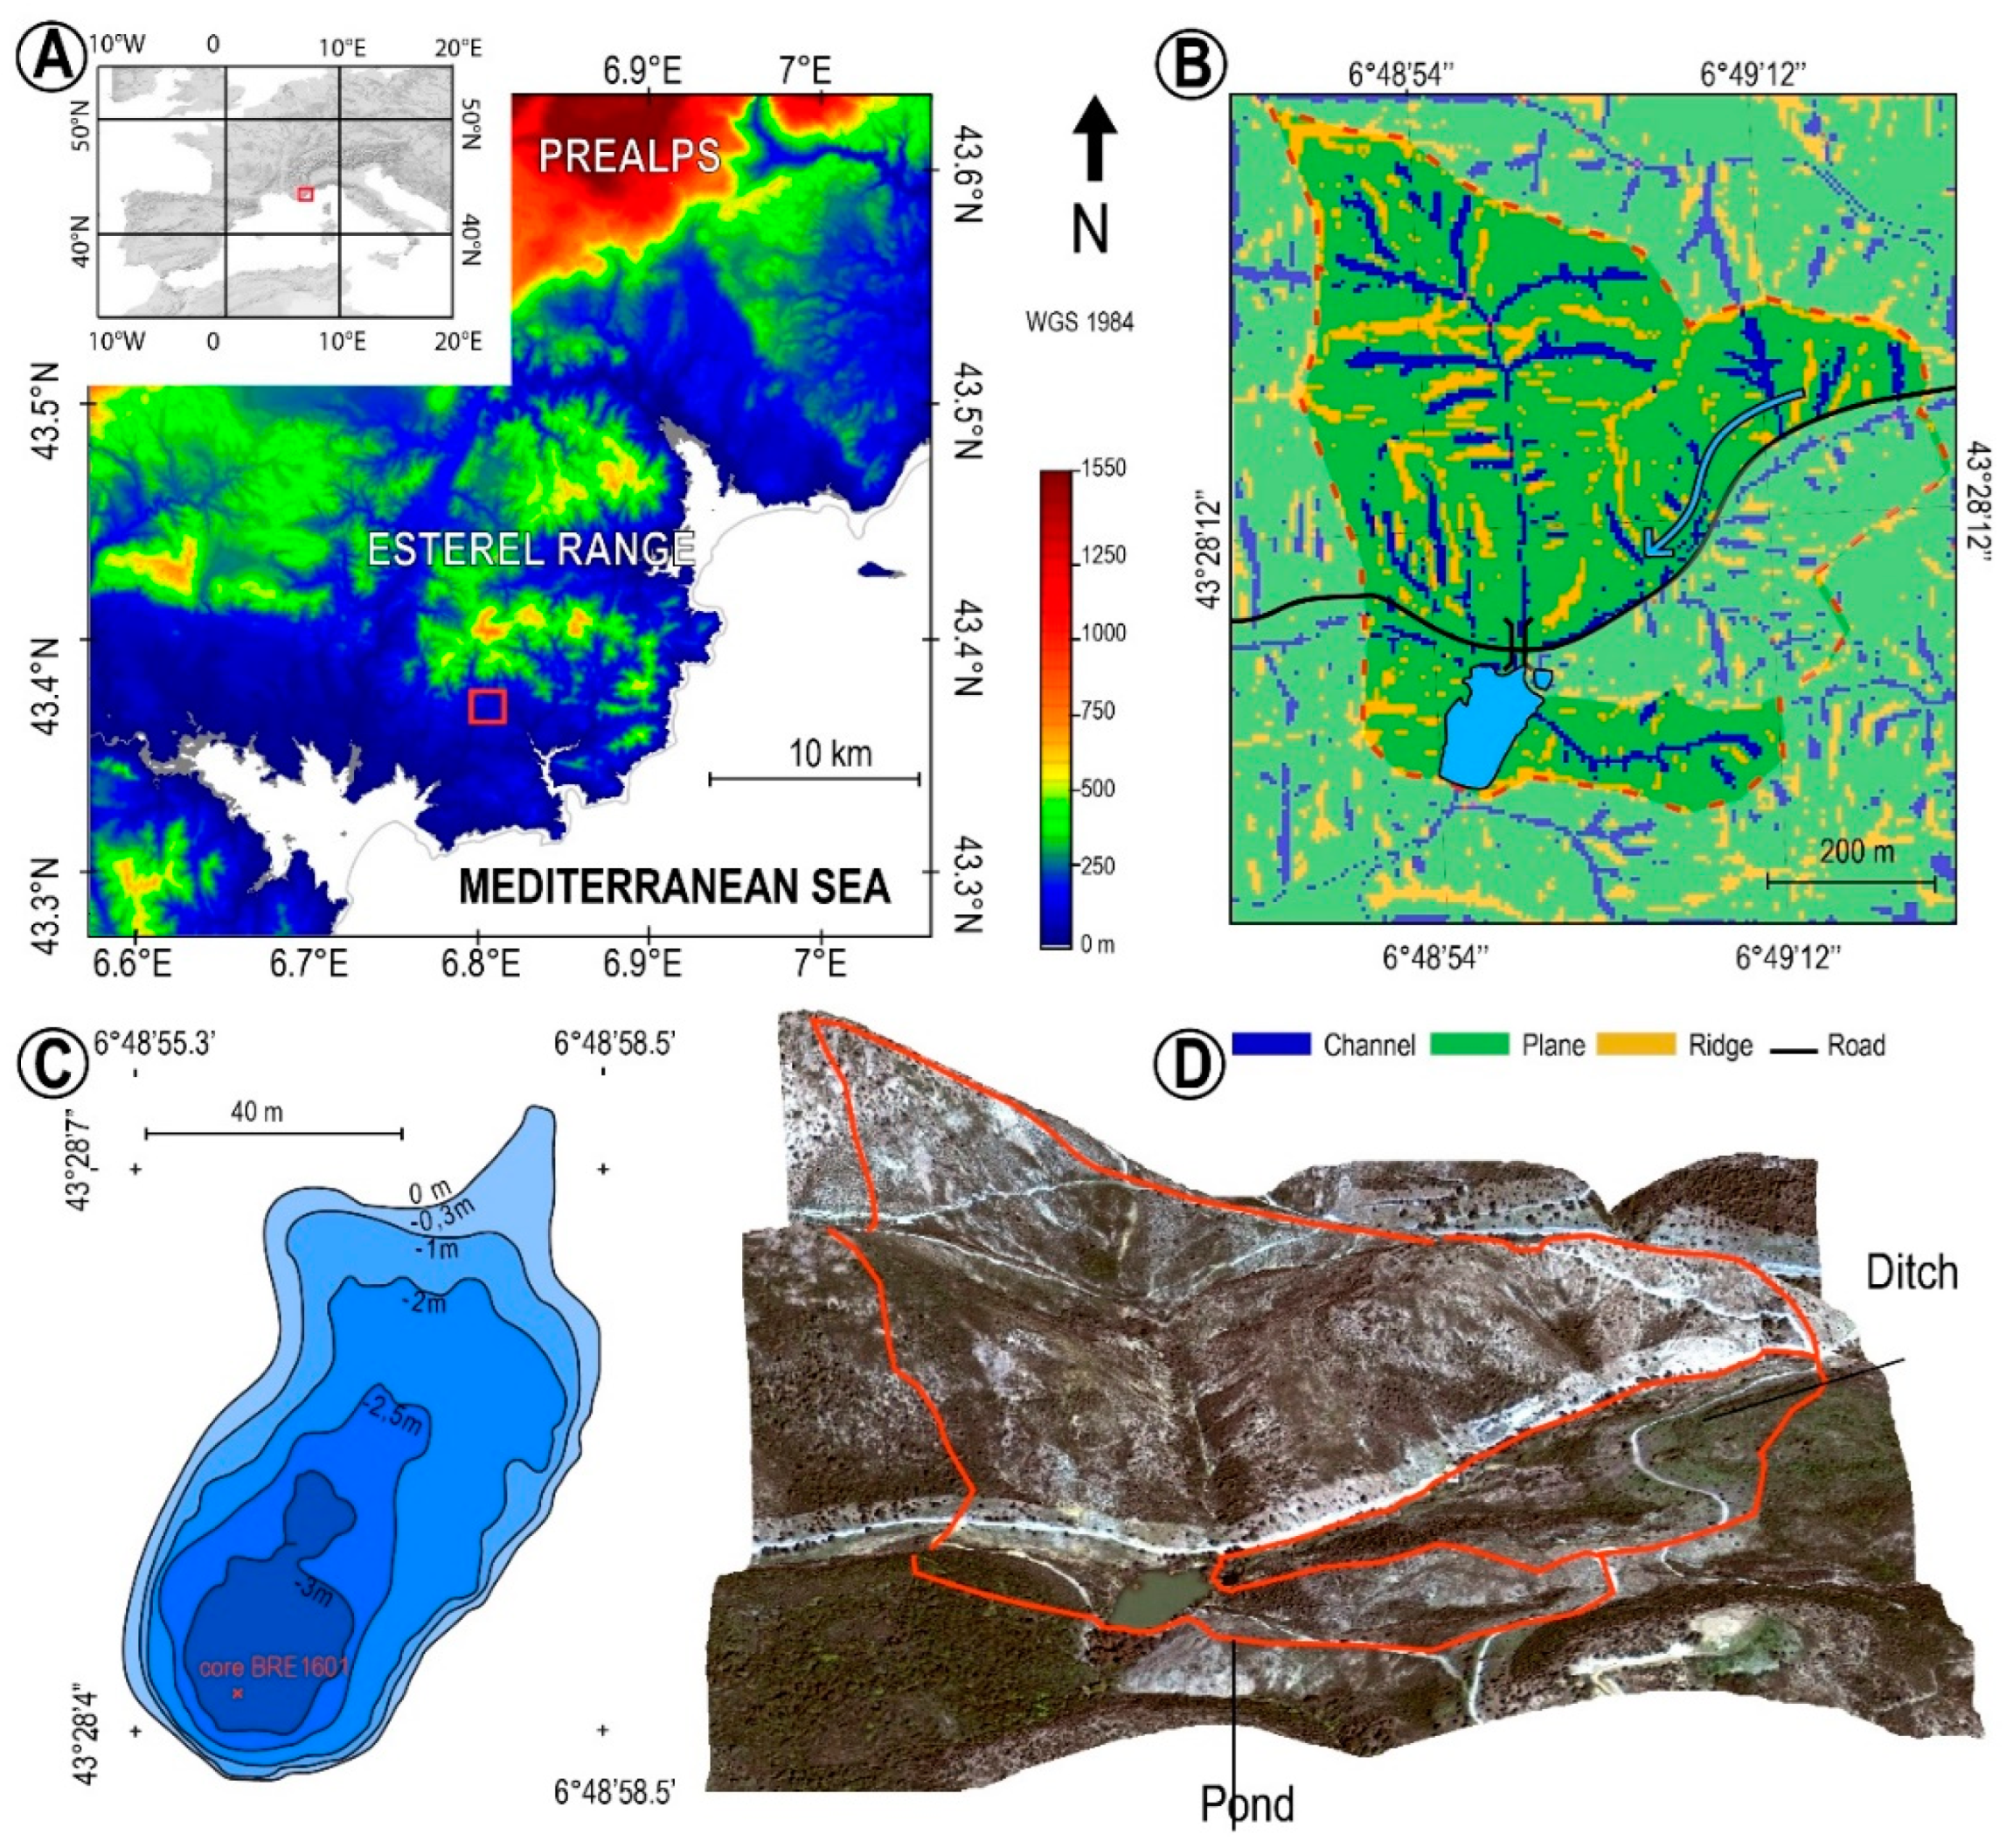
Figure 1. (A) Location of the site in the Esterel Massif. (B) Classification of the watershed topography of the lake. (C) Bathymetry of the lake with the coring site. (D) Numerical model of the catchment area and the subwatershed drained by the pond located northeast of the lake.
Quaternary 05 00053 g001
Figure 2. (A) Presentation of the BRE1601 archive with the areas concerned by the two protocols. The left section of the archive corresponds to the routinely used protocol (section (A), oxidized), the center was sampled for the HPLC analysis and the cross section is used to compare the indices before oxidation (section (B), unoxidized). (B) In-depth profiles of chlorophyll-a, chlorophyll pigments and total pigments. The average value of the 22 pigments concentrations is presented, and the chlorophyllin pigments whose reflectance is between 600 and 700 nm are given in red. (C) The sampling of the analysis is presented on the profile in total pigments. The AreaT650–700 index is presented before and after oxidation. (D) Comparison with the LR1203 archive and the profile of macroscopic coals particles [15].
Quaternary 05 00053 g002
Figure 3. Scatter plots of 18 chlorophyll-a indices for the oxidized sedimentary matrix (following the routine protocol used in Balsam et al. [51]) and presented according to their typology, (A): ratio, amplitude and derivative indices, (B), RABD index and I-band (i.e., RABD/Rmean). The division of RABD by Rmean degrades the correlation. (C) Area indices. N.S. = Not Significant, p-value > 0.0001 (n = 28). The red dots indicate the top of the core and the blue color is for the bottom.
Quaternary 05 00053 g003
Figure 4. (A) Sediment Core BRE16-01 (BD) Presentation of spectra in three representative areas of the chlorophyll-a and pigments contents according to the oxidized (red spectra) or non-oxidized (blue spectra) section. The local minimum of the chlorophyll-a at 675 nm is represented with the dotted green line, and its spectral area is colored in green. (E) Reflectance of pure standard samples of pyrite and goethite [60] are presented to describe the reflectance of reduced iron (Fe-S, pyrite) and oxidized iron (Fe-O, goethite). The higher reflectance of goethite at long wavelengths explains the difference in reflectance between sections (A,B). The wavelengths impacted both by chlorophyll-a and by the sedimentary components related to the oxidation of sediment are shown. Sediment oxidation produces a smaller increase in reflectance at short wavelengths due to the formation of iron oxides.
Quaternary 05 00053 g004
Figure 5. Scatter plots of new indices aimed at removing the effect of the sediment composition for sections (A) (oxidized) and (B) (unoxidized). Rmean normalization improves correlations with chlorophyll-a concentration measured for AreaT650–700 and AreaT600–760 on section (B), but only for AreaT650–700 on section (A) due to the reduced size of the absorption band of chlorophyll in this section. Normalization by d555 (iron oxide index) improves the correlation only for section A due to the absence of iron oxide in section B. N.S. = Not Significant with p-value > 0.0001 (n = 28). The red dots indicate the top of the core and the blue color is for bottom.
Quaternary 05 00053 g005
Figure 6. Correlation between HSI and chlorophyll a, green pigment and total pigment. The last correlation highlights the narrow link between total pigment and chlorophyll-a variations. The red dots indicate the top of the core and the blue color is for the bottom.
Quaternary 05 00053 g006
Table 1. Synthesis of the various indices used in publications to reconstruct chlorophyll and by products signal.
TypeContinuum Removal MethodNamePublicationFormula
RatioDivisaon by a reflectance band without influence of chlorophyll-a675/750Das et al., 2005 [34]Ratio = R 1 R 2
645/675Das et al., 2005 [34]
660/670Von Gunten et al., 2005 [24],
Saunder et al., 2012 [37]
590/690Trachsel et al., 2010 [40]
AmplitudeSubtraction by a reflectance band without infuence of chlorophyll-a 675–750Das et al., 2005 [34]Amplitude = R 1 R 2
650–675Das et al., 2005 [34]
First derivativeEnhance the efect of chlorophll-a on the continuum (spectral slope of the absorption feature)d675Das et al., 2005 [34], Debret et al., 2006 [46], Debret et al., 2011 [50], Das et al., 2005 [34]First derivative values at 675 nm
d660–d690Das et al., 2005 [34]First derivative values at 660 nm
Reflectance feature depthTheoretical continuum estimation at 670 nm and subtraction of the measured reflectance at 670 nmRABDRein and Sirocko 2002 [44]; von Gunten et al., 2009 [39], von Gunten et al., 2012 [24], Trachsel et al., 2010 [40], Chen et al., 2013 [35], Saunders et al., 2012 [37], Saunders et al., 2013 [41], Amann et al., 2014 [42], Boldt et al., 2015 [43] R A B D = 13 × R 590 + 9 × R 730 ( 13 + 9 ) R 670
I-band index adds a division by the mean reflectance (R mean)Band-IMeyer et al., 2017 [38]I-band = R A B D R m e a n
Rein and Sirocko 2002 [44]
Absorbance feature areaArea between two bands not influenced by chlorophyll-a concentration. A line draw between thoes two bans represents the theoretical continuumAreaWolfe et al., 2006 [45] A r e a W   R 1 R 2 = R 1 × ( W 2 W 1 ) + ( R 2 R 1 ) × ( W 2 W 1 ) 2 W 1 W 2 R 1 : R 2
650–750
AreaWolfe et al., 2006 [45], Michellutti 2010 [36], Saunder et al., 2012 [37], Trachsel et al., 2010 [40], Michelutti and Smol 2016 [25] A r e a T   R 1 R 2 = R 1 × ( W 2 W 1 ) + ( R 2 R 1 ) × ( W 2 W 1 ) 2 b a n d w i d t h × W 1.1 W 1.9 R 1.1 : R 1.9 b a n d w i d t h 2 × ( R 1 + R 2 )
650–700
AreaTrachsel et al., 2010 [40]
690–730
AreaDas et al., 2005 [34] R 1.1 : Wavelength following R 1 ; R 1.9 : wavelength before R 2
600–760
Publisher’s Note: MDPI stays neutral with regard to jurisdictional claims in published maps and institutional affiliations.