Article

From Climatic to Anthropogenic Drivers: A Multi-Proxy Reconstruction of Vegetation and Peatland Development in the French Jura Mountains †

by
Emilie Gauthier
1,*,
Vincent E.J. Jassey
2,
Edward A.D. Mitchell
3,4,
Mariusz Lamentowicz
5,
Richard Payne
6,
Frédéric Delarue
7,
Fatima Laggoun-Defarge
8,
Daniel Gilbert
1 and
Hervé Richard
1
1
Chrono-Environnement, University de Bourgogne-Franche-Comte UMR CNRS 6249, 16 Route de Gray, 25030 Besancon, France
2
ECOLAB, Université de Toulouse CNRS, 118 Route de Narbonne, CEDEX, 31062 Toulouse, France
3
Laboratory of Soil Biodiversity, University of Neuchâtel, CH-2000 Neuchâtel, Switzerland
4
Neuchâtel Botanical Gardens, Perthuis-du-Sault 58, 2000 Neuchâtel, Switzerland
5
Laboratory of Wetland Ecology and Monitoring, and Department of Biogeography and Paleoecology, Faculty of Geographical and Geological Sciences, Adam Mickiewicz, University, Dzigielowa 27, 61–680 Poznan, Poland
6
Environment and Geography, University of York, York YO105DD, UK
7
Institut de Minéralogie, de Physique des Matériaux et de Cosmochimie, Sorbonne Universités—Muséum National d’Histoire Naturelle, Université Pierre et Marie Curie, Université Paris 06, UMR CNRS 7590, IRDUMR 206 Paris, France
8
Institute of Earth Sciences, National Center for Scientific Research (CNRS) and University of Orléans, 45100 Orléans, France
*
Author to whom correspondence should be addressed.
We dedicate this study to our co-author Richard Payne who tragically died in a mountaineering accident in May 2019 while climbing a peak in the Himalayas.
Quaternary 2019, 2(4), 38; https://doi.org/10.3390/quat2040038
Submission received: 10 July 2019 / Revised: 11 November 2019 / Accepted: 14 November 2019 / Published: 2 December 2019

Abstract

:
A 4 m core was extracted from the center of a peatland located in the Drugeon valley (France). Thirteen radiocarbon dates were used to build a robust age model. Testate amoebae were used for reconstructing mire surface wetness. High-resolution pollen analysis of the sequence reconstructed 9 millennia of development of the peatland and its surrounding vegetation. During the early/middle Holocene (9500 to 5800 cal BP), warm conditions led to high evapotranspiration and low water levels. The vegetation history is characterized by the development of a Pinus and a mixed Quercus forest. From 5800 cal BP, testate amoebae show wetter conditions, indicating the onset of the cooler Neoglacial period. The cooling is also evidenced by the development of Abies and Fagus trees, replacing the oak forest. The first indicators of human impact appear at about 4800 cal BP, and indicators of farming activity remains very rare until ca. 2600 cal BP, at the beginning of the Iron Age. The development of the peatland responded to climatic fluctuation until 2600 cal BP, after which human impact became the main driver. The last millennium has been characterized by sudden drying and the spread of pine on the peatland.

1. Introduction

The Drugeon valley (Figure 1) is a landscape dominated by wet meadows and peatlands at different stages of development. Wooded peatlands with Mountain pine (Pinus uncinata), such as Forbonnet, are believed to be the ultimate stage of peatland development in the region. The Forbonnet peatland has been intensively studied for over 10 years, and climatic parameters and soil temperature are recorded at a permanent monitoring station [1,2]. However, to date, no comprehensive study has been conducted to describe the developmental history of this site since the beginning of its formation.
Several pollen and multiproxy analyses have been performed in smaller peatlands in the Drugeon valley [3,4], as well as in lakes 10 km north east of the peatland [5,6]. Peatlands of the Drugeon valley (Figure 1) were among the first to be studied by palynologists, and the first pollen diagram carried out in the Jura Mountains was performed at Chaffois, a peatland located about 10 km from Frasne [7]. For the Forbonnet peatland, a first pollen diagram was published in 1950 [8]. Although major phases of vegetation development were recognized, the diagram was not very informative because of the absence of dates. In the early 1980s, a new analysis was carried out by Jean Heim (Louvain-la-Neuve, B); however, the diagram has never been published. The first diagram informing chronology was made by Reille [9]. Even if radiocarbon dates gave an imprecise chronology, the diagram provides valuable information on vegetation development in this region, and confirms that this peatland had been forested for a long time. In addition, combined with ecological and palaeoecological analyses from peatlands in the Eastern Pyrenees [9,10], Jura [11,12,13,14], and Vosges [10,15], it serves as a reference for studying the Holocene development of Mountain pine in Western Europe.
Based on pollen and testate amoeba analyses, this study aims to reconstruct mire surface wetness; describe plant successions around the peatland, from the beginning of its formation to the present day; and reconstruct the history of local human activities and their likely impact on the peatland.

2. Materials and Methods

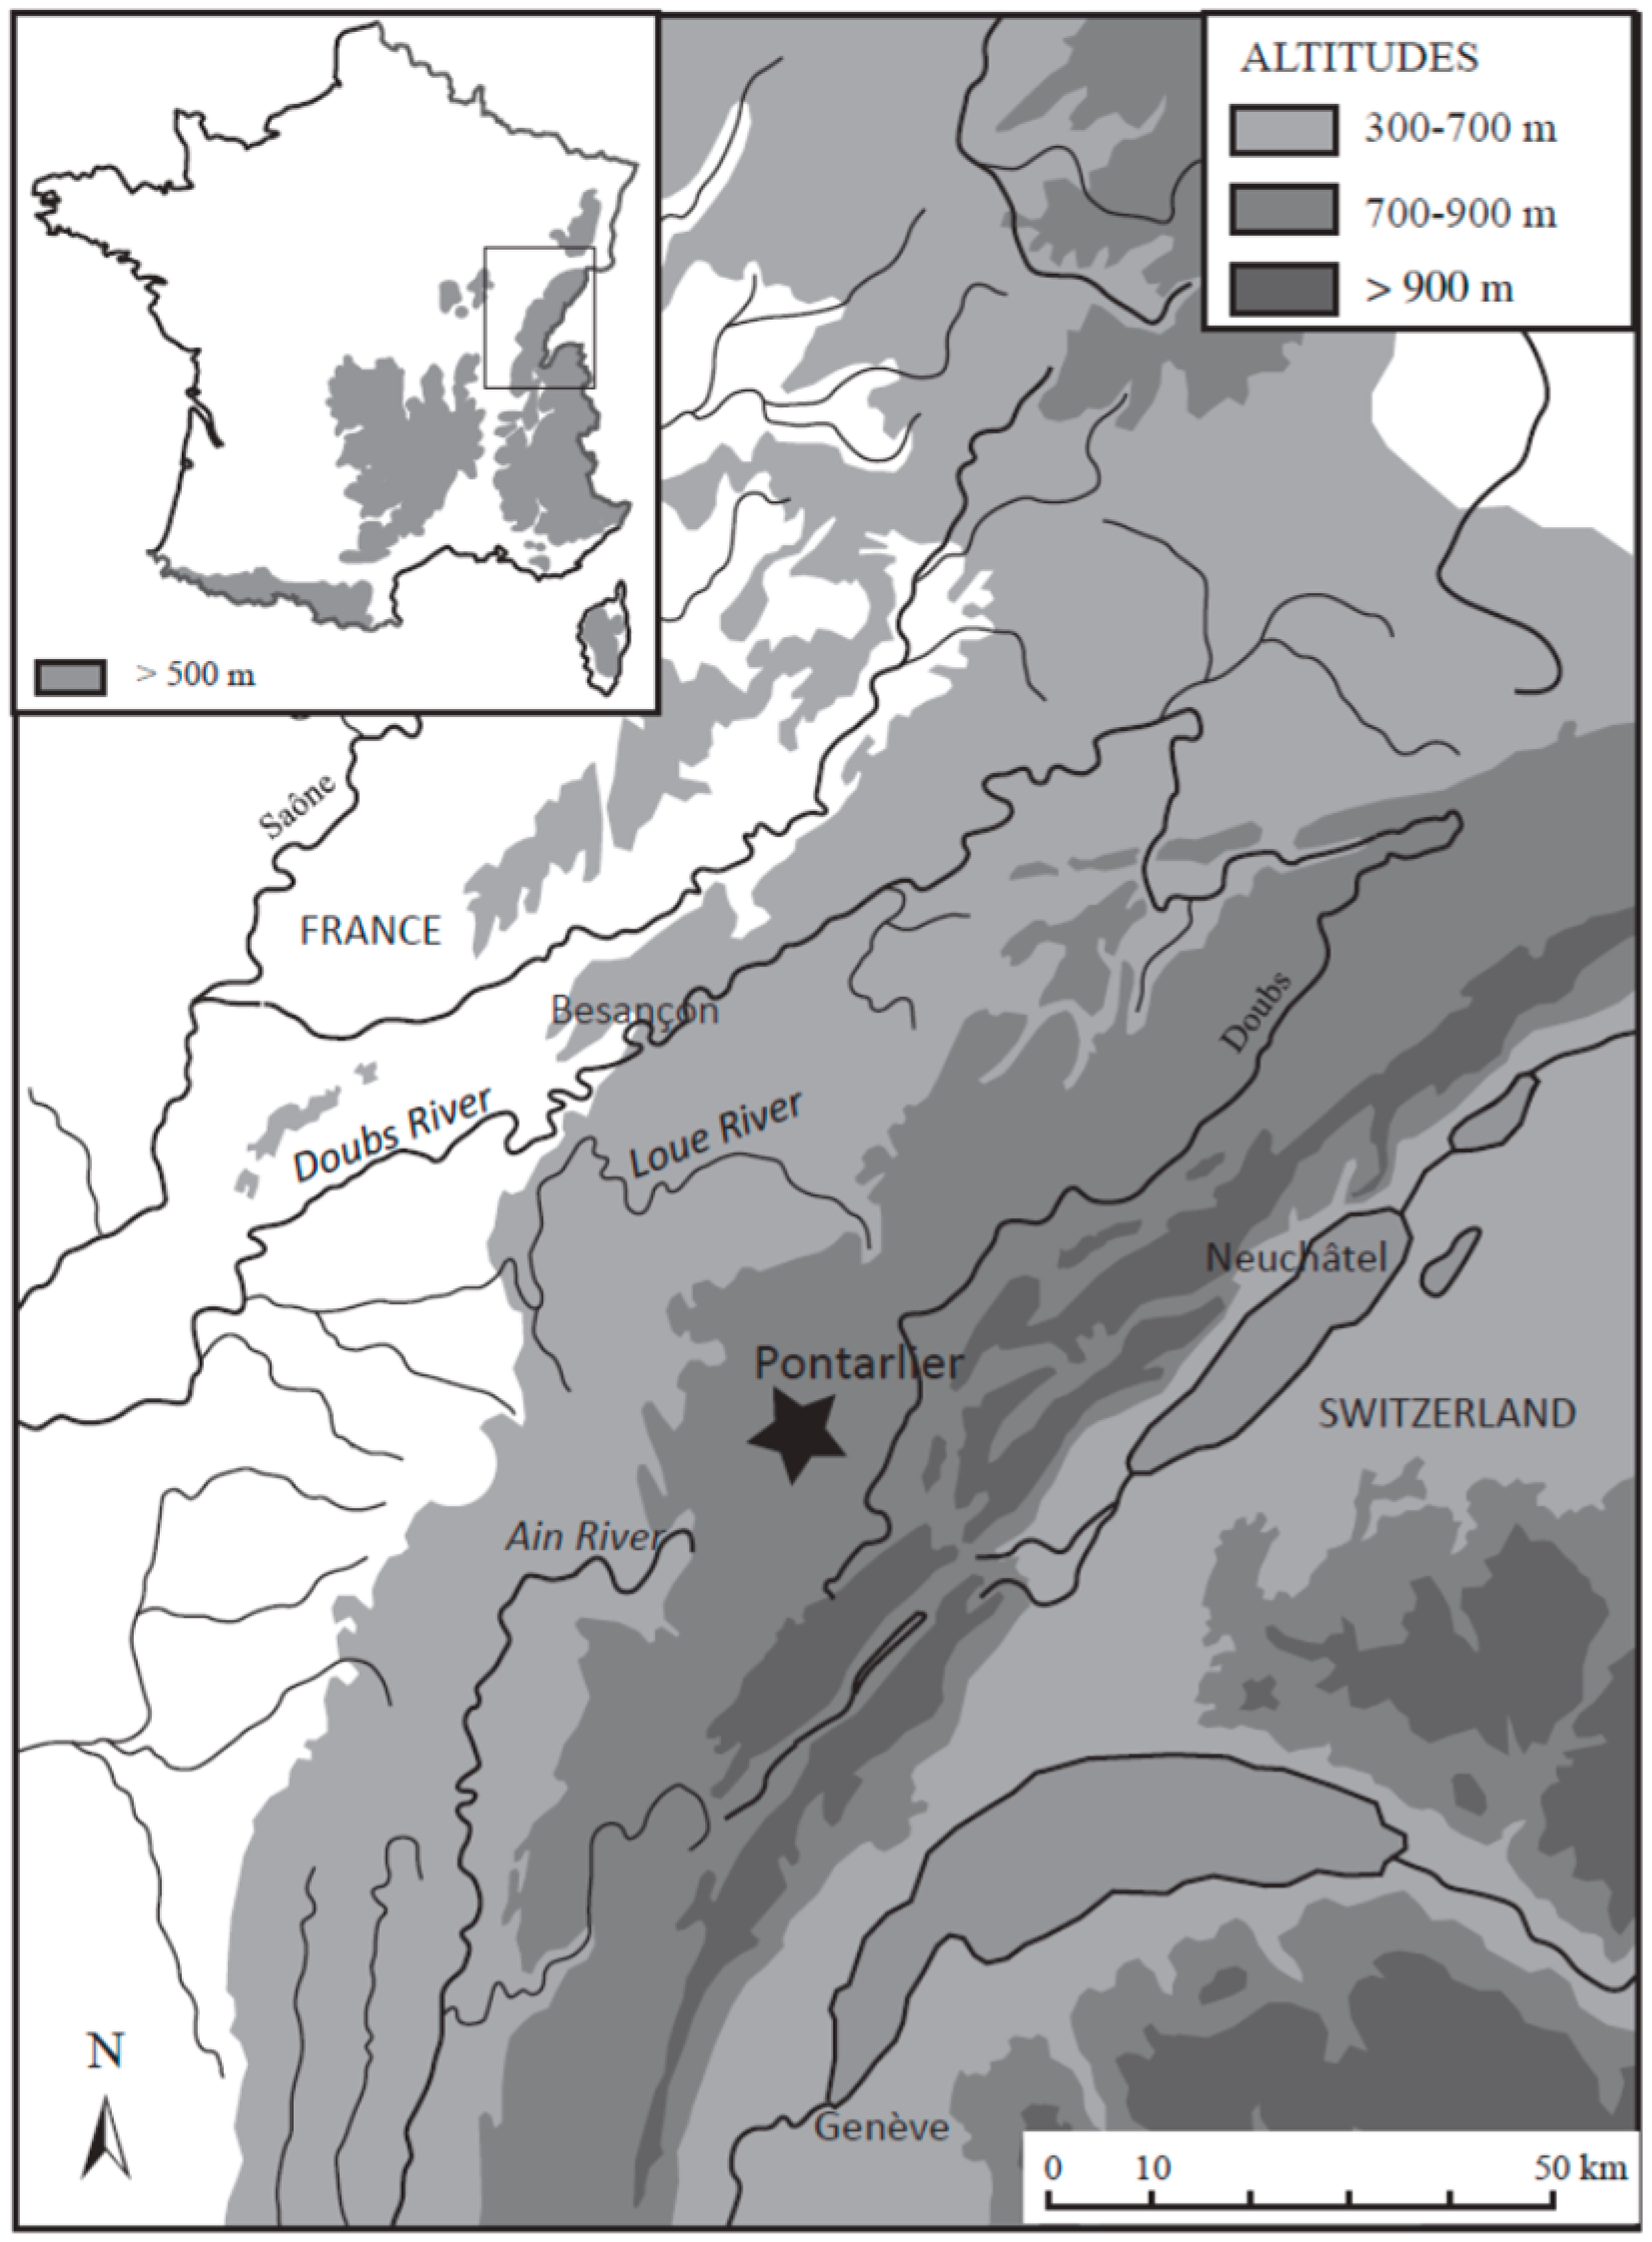
2.1. Study Area and Coring

The Forbonnet peatland (317 ha) is located in the Jura Mountains (46°49′N; 6°10′E) at an altitude of 836 m a.s.l (Figure 1). The peatland is a mosaic of different stages of development: alkaline and oligotrophic peatlands, transitional peatlands, and floating mats recolonizing old peat exploitation pits. Peat forests, which are the ultimate stage of development, cover a large area, including a pine mountain forest. The average annual temperature is ca. 7 °C, and annual precipitation averages range between 1200 and 1300 mm. The warmest month of the year is July, with an average temperature of ca. 16 °C; the coldest month is January, with an average temperature of ca −1.5 °C. A 4.36 m core was taken from the Forbonnet peatland in 2011 using a GIK corer close to the climate monitoring station, in the oligotrophic part where preliminary surveys had shown that peat thickness was about 4 m. Two parallel sequences were collected in order to avoid gaps in the record between the two sections.

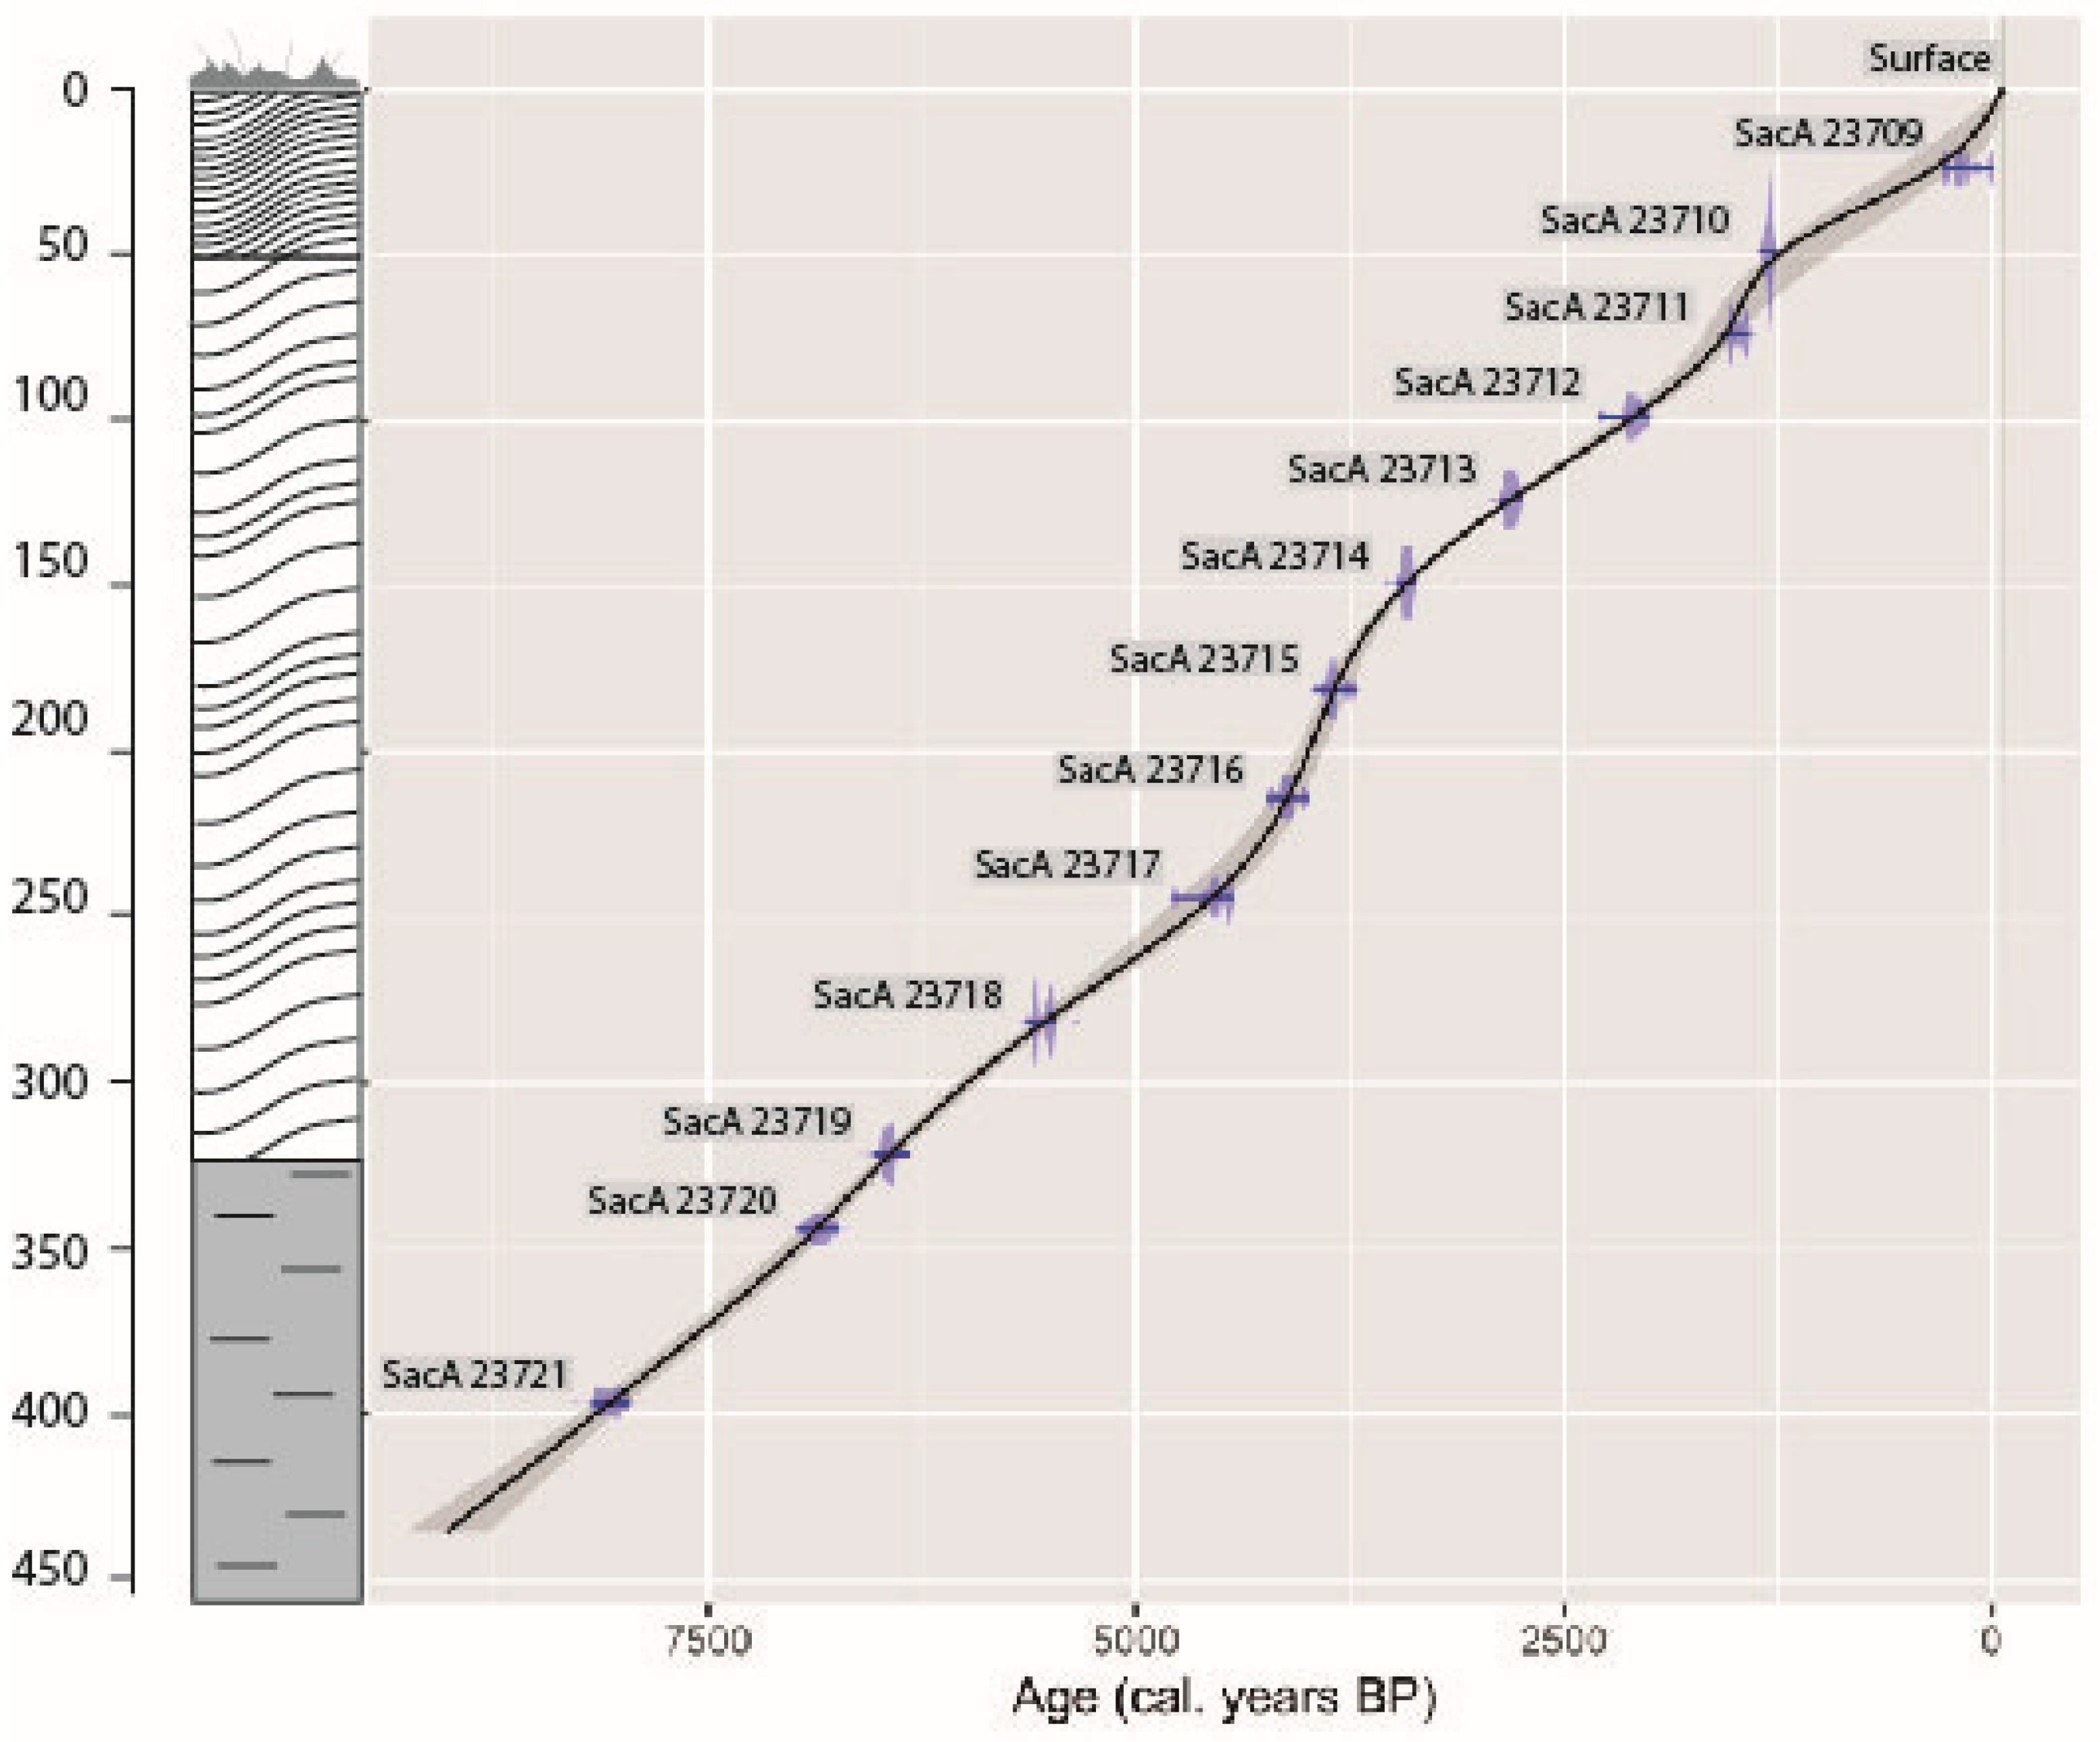
2.2. Radiocarbon Dates and the Age–Depth Model

Thirteen AMS 14C dates (Table 1, Figure 2) were obtained from the Saclay laboratory (France). These 13 radiocarbon dates are equally distributed over the entire core. However, it was impossible to obtain a radiocarbon date from the basis of the sequence, because there were no organic remains in the clay sediments. The age–depth model (Figure 2) was obtained using the clam software [16] within the R software (R Core Team 2015, version 3.2.0 [17]), using spline interpolation of the weighted averages of 1000 sampling iterations of the calibrated ages for each dated level.

2.3. Testate Amoebae

Subsamples were extracted from the different peat sections, following the procedure described by Booth et al. [18]. The material was washed through a sieve of 250 μm mesh size, and the filtrate was used for microscopic analyses. Testate amoebae were identified and counted using an inverted microscope at 200–400× magnification (OLYMPUS IX71), following Uthermöhl’s method [18]. At least 150 specimens were counted per sample, and were identified to the species level whenever possible [18]. A depth of water table (DWT) was inferred from testate amoeba using the European calibration data set [19].
The testate amoeba diagram (Figure 3) was drawn using the rioja R package [20]. Zone delineation was achieved by constrained hierarchical clustering, with clusters constrained by sample order (depth). Quantitative reconstruction of the depth of water table (DWT) was performed in C2 software [21], using the training set developed for the Jura Mountains by Mitchell et al. [14].

2.4. Palynology

A continuous sampling (2.5 cm thick) totalizing 109 samples was made. Peat samples were processed for pollen analysis using standard techniques [22]. They were treated with HCl, NaOH, HF, ZnCl2, and acetolysis. A minimum of 400 pollen grains from terrestrial plants was counted in each sample to ensure statistical significance. Cyperaceae, hygrophilous plant, and spores were excluded from the pollen sum. Pollen grains were identified with the aid of a reference collection of modern pollen types, pollen keys, and photographs [23,24,25]. The pollen diagram (Figure 4) was drawn using TILIA and TGView software [26]. Pollen zones were delimited with the help of CONISS [27].

3. Results

The basis of the core sequence was made of compact clay, up to 3.80 m (Figure 2). From 3.80 m to 0.5 m, sediment becomes progressively more organic-rich: black and decomposed peat layers alternate with blond Sphagnum peat layers. The peat was fibrous in the upper 50 cm.

3.1. Radiocarbon Dates and Age–Depth Model

The 13 AMS 14C dates (Table 1, Figure 2) are consistent with the stratigraphic position of the samples and with palynology results, which do not show sudden ruptures possibly caused by sedimentation gaps.

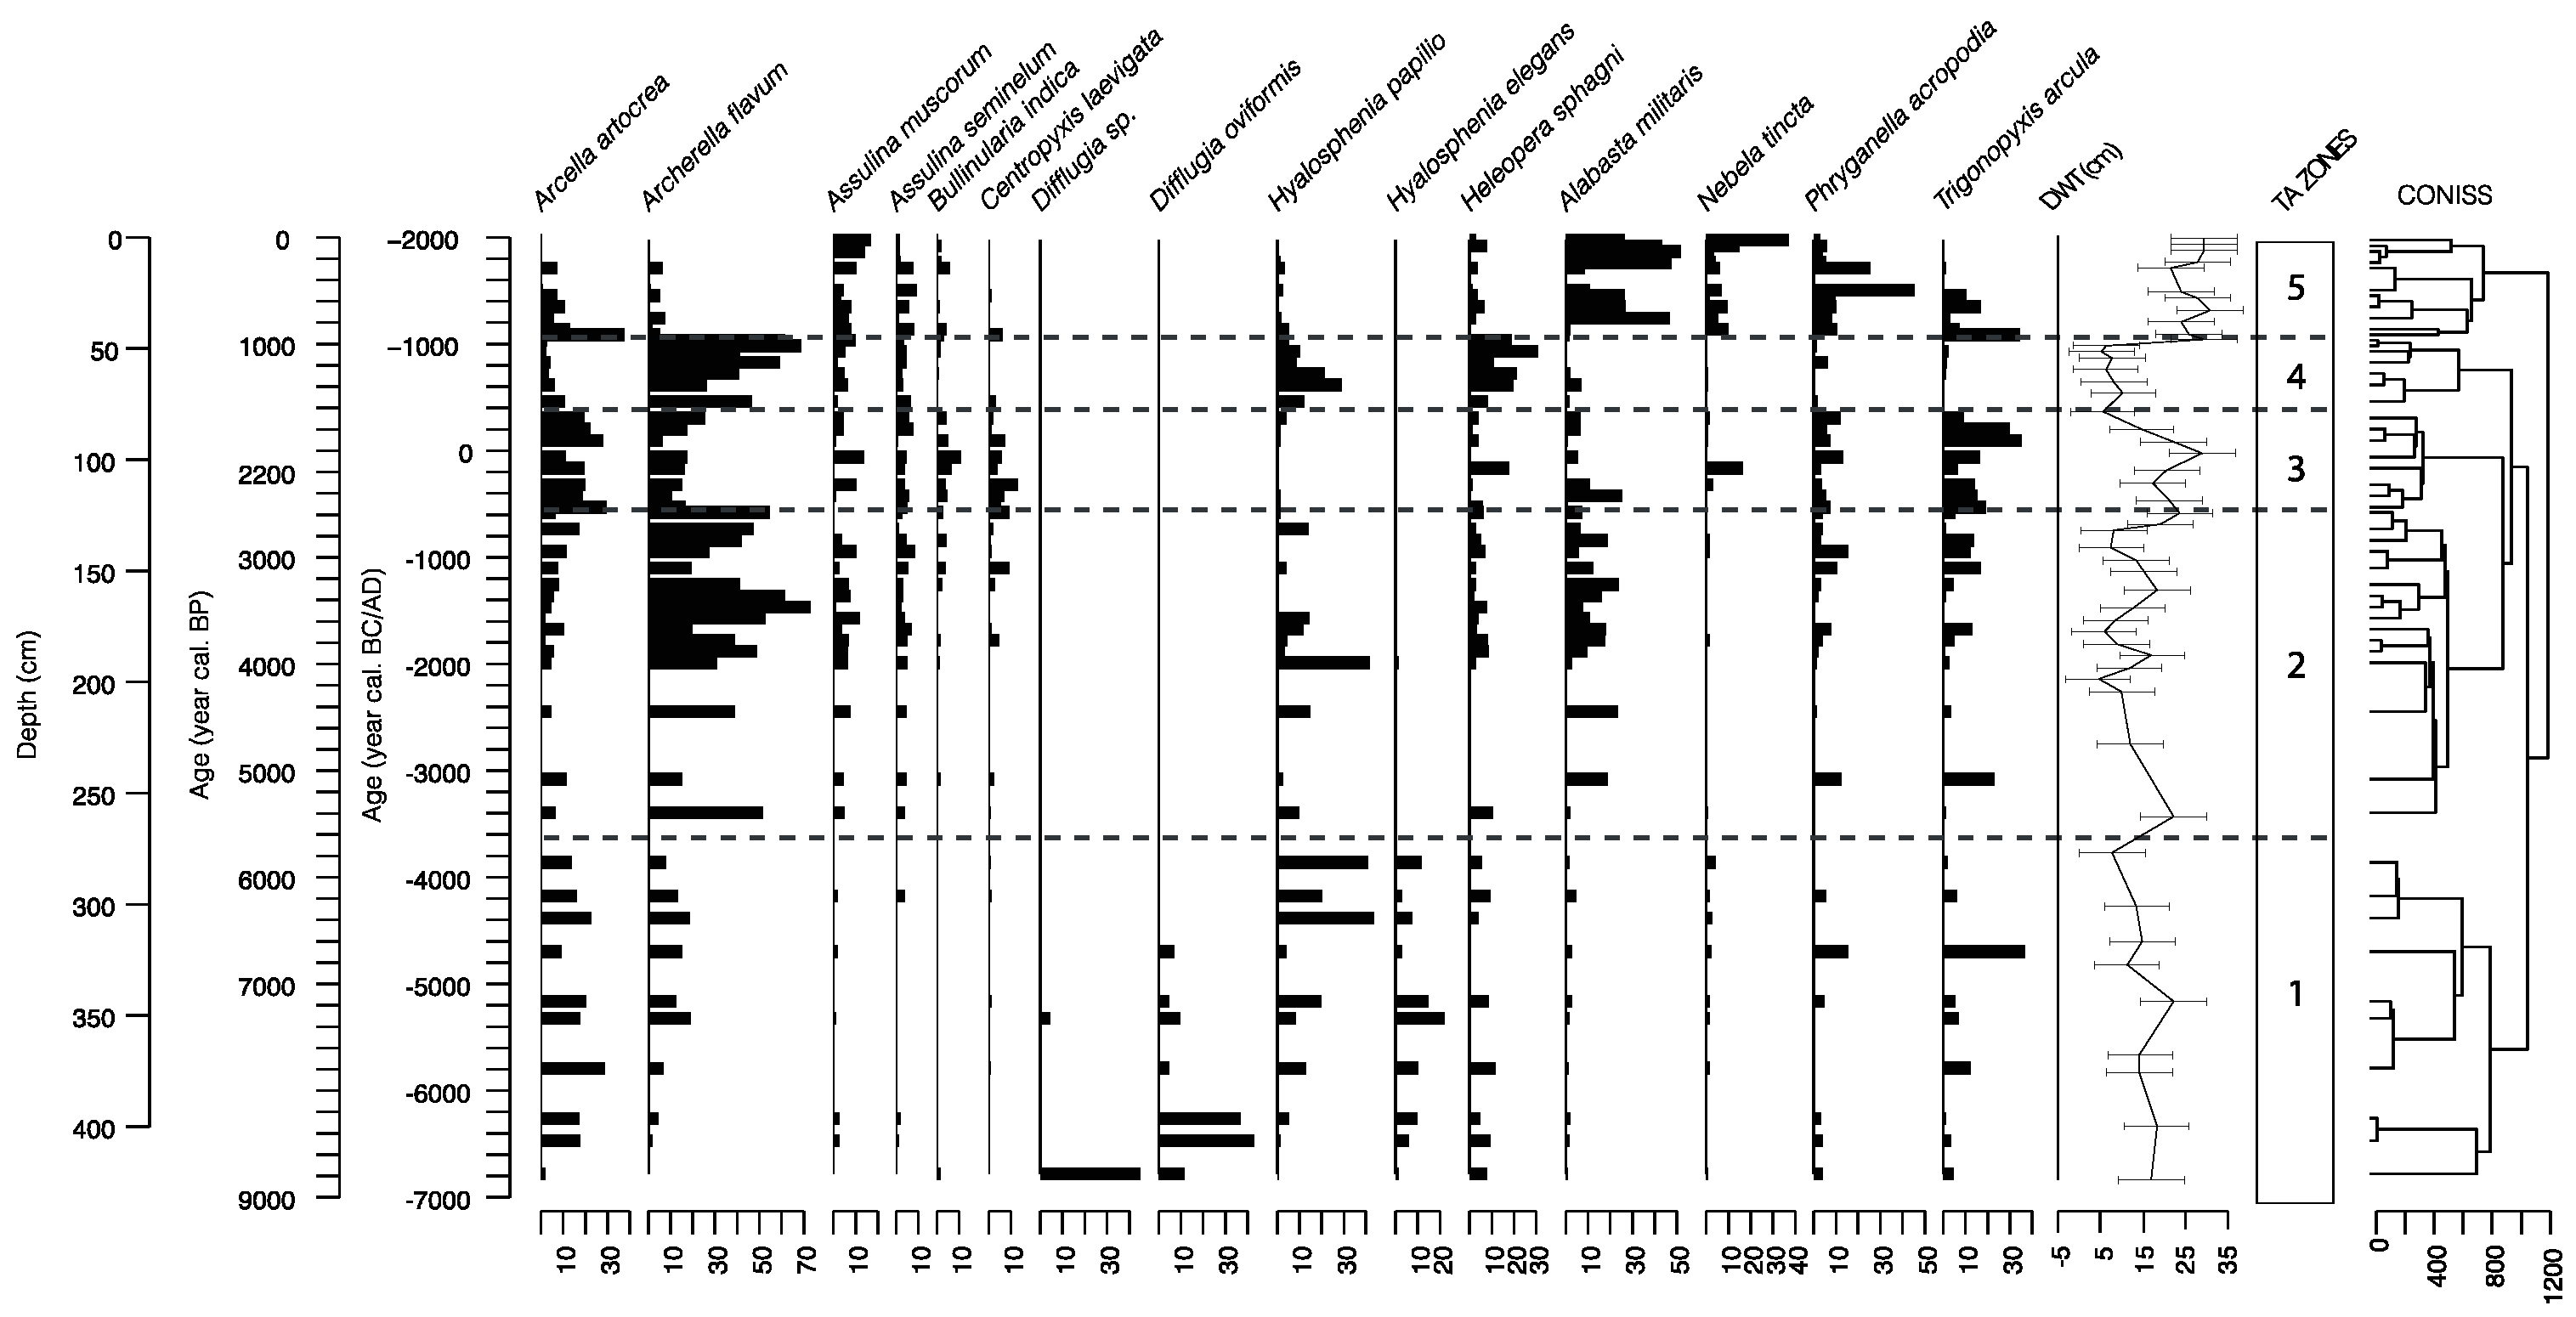
3.2. Testate Amoeba Analysis

A total of 150 testate amoeba taxa were identified along the core (Figure 3). Five successive zones can be identified, with transitions at approximately 5600, 2600, 1600, and 1000 years cal BP (Figure 3).
The chronologically constrained clustering identified four hydrological phases in the testate amoeba record. The first two major phases, 9000–5600 and 5600–2600 cal BP, are characterized by a relatively stable DWT of c. 15 cm, with the joint occurrence (with fluctuations) of indicators of wet (Arcella artocrea, Archerella flavum, Centropyxis laevigata, Hyalosphenia papilo, and Heleopera sphagni) and dry (Alabasta (Nebela) militaris, Bullinularia indica, Phryganella acropodia and Trigonopyxis arcula) conditions. In contrast, during the third phase (2600–1600 cal BP), most of the wet indicators declined in relative abundance (except Archerella flavum), while dry indicators became predominant, especially Alabasta millitaris, Phryganella acropodia, and Trigonopyxis arcula. This resulted in a higher DWT, with values that reached c. 25 cm DWT. The fourth hydrological phase (1600–1000 cal BP) was the wettest (DWT = 5 cm), with a strong increase in wet indicators (Archerella flavum, Hyalosphenia papilio, and Heleopera sphagni) and a loss of dry indicators. Following this wet phase (1000–0 cal BP), DWT abruptly changed towards a new dry phase (DWT = 25 cm), due to the loss of wet indicators and the predominance of dry indicators (Alablasta militaris, Nebela tincta, Phyrganella acropodia and Trigonopyxis arcula).
The 9000–1000 cal BP period is divided into four phases: the first two extend over a period of about 3000 years each, while the next two last less than 1000 years each (Figure 3). The phase spanning 9000 to 5600 cal BP corresponds to the first stages of peatland formation, i.e., a mosaic of peat-accumulating vegetation developing in the lowest parts of the site. The next two phases (5600–2600 cal BP and 2600–1600 cal BP), are marked by a more variable water table level, reflecting a variation in precipitation and air temperature. The fourth phase (1600–1000 cal BP) is marked by the decline or disappearance of indicators of relatively dry conditions (Arcella artocrea, Alabasta militaris, Nebela tincta, Phryganella acropodia), as well as an increase in species indicators of wet conditions (Archerella flavum, Hyalosphenia papilio, Heleopera sphagni) [14].
The most recent period (1000–0 cal BP) corresponds to a very marked and rapid change in the community composition of testate amoeba species. Thus, the species characteristics of wet conditions disappear, while the abundance of drier species increases.
In addition, the specific amoeba richness observed in the samples decreases steadily over time over the first four periods, with 42, 35, 24, and then 20 species, respectively; it then increases sharply after 1000 cal BP (43 species). These results confirm the hypothesis of a natural development of the peatland between 9000 and 1000 cal BP, followed by a probable intermediate level disturbance in 1000 cal BP, leading to an increase in biodiversity.

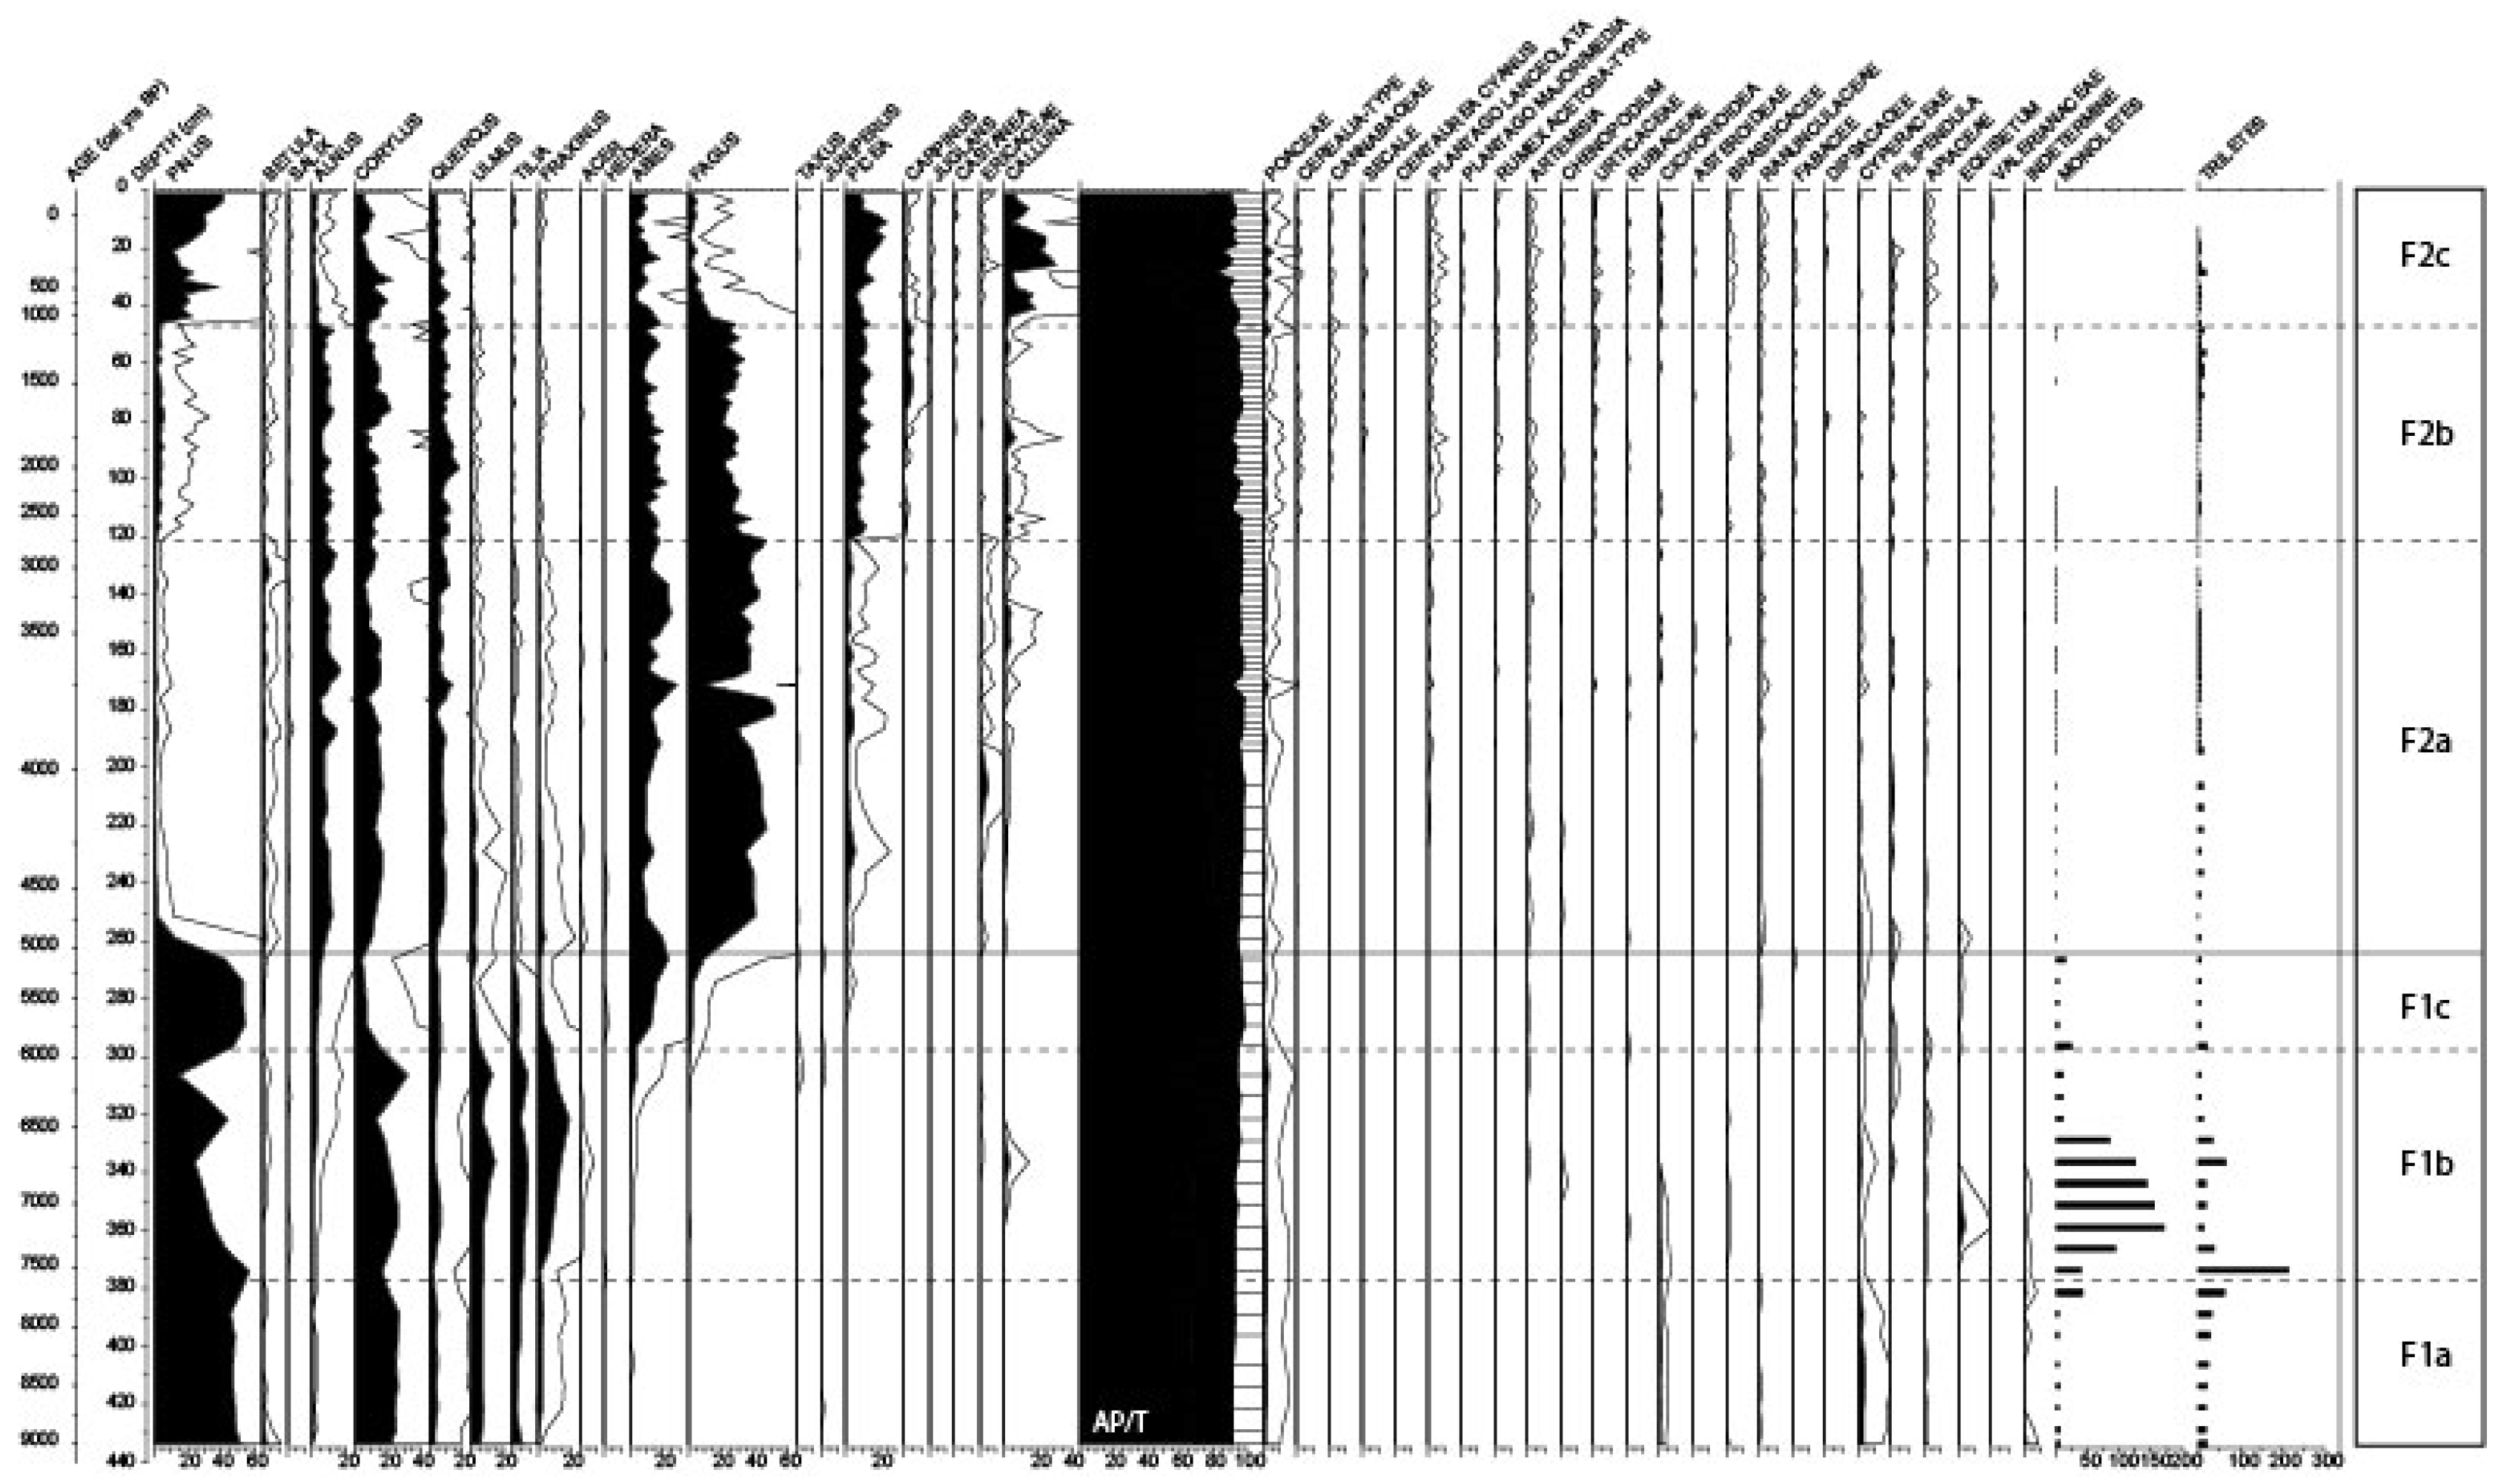
3.3. Pollen Analysis

The pollen diagram shows two main local pollen zones (LPZ) (Figure 4). Each zone was further divided into three subzones.

3.3.1. Local Pollen Zone F1 (ca. 9000–5000 cal BP)

In this zone, pollen assemblages are dominated by Pinus (pine) and Corylus (hazelnut). The main taxa of mixed oak forest (Quercus, Ulmus, Tilia, Fraxinus, Acer), usually developing at this time, show low values and are masked by the local pollen contribution of Pinus.
The F1a subzone (9000–7600 cal BP) is dominated by Pinus, Corylus, and the components of a nearby mixed oak forest.
In subzone F1b (7600–5800 cal BP), Pinus decreases slightly, allowing a better record of Corylus, Quercus, Ulmus, Tilia, and Acer, while the abundance of Abies increases (the first Abies pollen grains appear a little earlier) and Fagus occurrences remain weak. Relative moisture is also highlighted by the development of Alnus. Fern spores reach relatively high values in this subzone. Pollen evidence of the first farming activity in this area is not confirmed here [3,4,28]; the rare occurrences of Rumex, Urtica, and Artemisia are not very significant.
In subzone F1c (5800–5000 cal BP), Abies increases and Picea appears, while mixed oak forest tends to almost completely disappear.

3.3.2. Local Pollen zone F2 (ca. 5000 cal BP—2011 AD)

Fagus is the best-represented species, followed by Abies, and to a smaller extent, Picea. If Corylus and Quercus are still present, Ulmus, Fraxinus, and Tilia have almost disappeared from the environment near the peatland. The wetland was probably surrounded by alder, as shown by the relatively good representation of this taxon, sometimes accompanied by Betula and Salix. Zone F2 is mainly characterized by the almost total absence of Pinus pollen.
Subzone F2a (5000–2800 cal BP) records the maximum development of Fagus, while Picea is still undeveloped and Pinus is represented by only a few pollen grains. From the beginning of F2a, anthropogenic indicators, such as Cerealia-type ruderals (e.g., Chenopodiaceae, Artemisia, Urticaceae) and pasture plants (e.g., Plantago lanceolata, Rumex acetosa-type), appear regularly. Between 220 and 170 cm depth, an atypical and sudden variation of pollen values is recorded that strongly disrupts the values of many taxa; this event does not find any visible sedimentological level in peat stratigraphy.
In subzone F2b (2800–1000 cal BP), Fagus values slightly decrease in comparison to F2a, while the representation of the other dominant species varies little. Carpinus appears, and in the second part of the zone, the first occurrences of Juglans and Castanea pollen are observed. Plants related to human activities are better represented, with cereals including Secale (rye), crop weeds, ruderals, and pastures plants. Cannabaceae is also regularly present, and has its highest values in the second part of this sub-zone.
For the last subzone, F2c (1000 cal BP–2011 AD), Pinus is again dominant. This recent dynamic probably corresponds to Mountain pine (Pinus uncinata), which is now widely present in the peatland. Calluna vulgaris also increases up to 30% between 25 and 15 cm.

4. Discussion

The quality and robustness of the age-depth model (Figure 2) make this analysis of a new regional pollen/testate amoeba reference for a part of the Holocene (Figure 3 and Figure 4). It is thus possible to understand the different stages of development of the peatland and precisely date the first occurrences, development, and sometimes decline of the main taxa present in this part of the Jura Mountains. The results obtained from both proxies (Figure 5) then enables us to infer past hydrological changes in the peatland and changes in the surrounding vegetation.

4.1. Trees Migration during the First Part of the Holocene Period

As almost always happens in the Jura, Abies has been the first component of the Fagus/Abies forest to appear in pollen analyses [5,6,28,29,30,31]. A few rare grains appear around 8400 cal BP, but it is from ca. 7500 cal BP that, although still very weak, it is present as a continuous curve (Figure 4, pollen zone F1). It is not until 5900 cal BP, though, that Abies really expands. Slightly late compared to Abies, Fagus pollen grains are found around 7100 cal BP; a continuous curve appears from 6100 BP and this tree seems to really expand after 5100/5000 cal BP. Picea finally appears around 5500/5400 cal BP; however, it remains very discreet until around 2700 cal BP. Pollen analyses performed at Lake Saint Point [5,6], 12 km east of the Forbonnet peatland, allow a comparison with this pollen sequence. Thus, it is possible to follow the extension of emblematic taxa (Abies, Fagus, Picea) from the eastern to the western part of the massif. This east–west colonization, already demonstrated [28] and based on previous analyses [30] is confirmed here. At Lake Saint Point, the still small but continuous presence of Abies is dated to around 7600 cal BP; however, it really starts five centuries earlier, around 6400 cal BP. Fagus also appears earlier on the eastern slopes, where it appears around 7400/7300 cal BP, but the more marked development of this species is contemporary at both sites. If the beginning of Picea is always very discreet in Frasne from 5600 BP, at the same date the occurrence of this species in the pollen record is much more obvious around Saint Point.
Abies probably reached its highest abundance in West Switzerland, in the Northern Alps and in the Jura Mountains [30,31].The east–west migration of these species is therefore confirmed here: Abies first colonized the highlands near the Swiss Plateau before extending westward; a little later, it was the same scenario for Fagus, which seemed to progress more easily towards the west; and finally, spruce, although discreet for a long time, found its place more easily at high elevation. In spite of the human impact on forests, this expansion is in accordance with the present-day distribution of these trees in the Jura Mountains: Faxus admixed with Abies dominate at middle elevations, and Picea expand at higher elevations.

4.2. Pollen Variation at 3900–3800 Cal BP

From 5000 to 2800 cal BP (Figure 4, pollen zone F2a), neoglacial cooling enabled the spread of a Fagus and Abies forest [5,28]. This period was only interrupted by a short event around 3900–3800 cal BP. Indeed, between 185 and 160 cm deep atypical trees pollen variation is recorded, beginning with a sudden decrease of Fagus. This decline temporarily enhanced the relative contribution of other pollen, including Corylus, Alnus, and Abies, as well as plants such as Calluna, which in this region is restricted to dry peatland habitats. Then, suddenly, the phenomenon was reversed: Fagus shows high values, while Alnus, Quercus, Corylus, and Calluna fall. The last significant event was a sudden decline of Fagus, mirroring an increase in Abies values and a higher contribution of herbaceous plants (Poaceae, Cyperaceae, Cerealia-type, Plantago lanceolata), as well peatland plants such as Calluna. Finally, pollen representations became more stable, and taxa recovered values similar to what they had been before this event, with the possible exception of Abies, which was slow to recover. These variations have been verified and are probably related to an event that affected the pollen representation of some taxa positively or negatively. However, this event is not observed in the testate amoeba diagram, suggesting it did not affect hydrological conditions on the peatland.
While limited to pollen representation, some of the variations described above could be due to competition between species within the same territory: when one disappears, the other is favored. This event could also be the local expression of a climatic anomaly already observed in the Jura massif based on lake level fluctuations [32], with an increase in lakes levels around 2000 cal BC. (ca. 4000/3900 cal BP). This high-level lake phase is perfectly documented, particularly on Neolithic lake dwellings [33]. The origin of this significant oscillation of the climate, highlighted in many regions of the globe, should be sought in an orbital forcing [5], resulting in a decrease in insolation. In this case, it is difficult to precisely relate the cause-and-effect links between this global deterioration of the climate and its local expression in the vicinity of the Forbonnet peatland. Many phenomena may have interacted at the level of local meteorological conditions, including extended dry periods and successions of violent storms. Regarding the pollen diagram, the change is seen first and foremost in the pollen representation of Fagus, suggesting changes in its abundance in the forest surrounding the peatland. We could then consider a disease specific to this species, as has been the case for elm [34]. In any case, this event was either too short or not strong enough to impact peatland testate amoebae communities.

4.3. Human Impact on the Environment

This analysis is also characterized by the poor representation of anthropogenic indicators (Figure 4), underlining a weak human impact around the peatland. Indeed, the size of this large wetland surrounded by forest limits pollen rain from grasslands and fields from the region. However, it is possible to identify periods of more intense land use, as well as some periods of decline whose origins can be complex and multiple—for instance, the Black Death during the 14th century or conflicts, as evidenced in previous analyses (Hundred Years’ War and plague during the 17th century) [3,4,5].
Rare evidence of human activities are recorded in the first millennia of the Neolithic period, but the first tangible signs appear around 5000/4800 cal BP, during the final Neolithic period (Figure 4). These indices remain very subtle until 2600 cal BP, and then become more clearly visible. In this diagram, the end of the Bronze Age and the very beginning of the Iron Age are marked by the weak impact of farming activities. Indeed, a more obvious impact could be expected, due to the numerous tumuli dating from this period, known and excavated in the “Chaux d’Arlier” [35] located a few kilometers northeast of the peatland (Figure 1). The end of the Iron Age and part of the Gallo-Roman period provide evidence of farming; however, from the third to the fourth century AD onwards, all signs of human impact disappear. This agricultural decline lasted here until the seventh century. This phenomenon corresponds to a migration period often described in literature [4,36,37,38], and includes the fifth and even sixth century AD. With regard to the cultivated plants revealed by this diagram, cereals are mainly cultivated between the Iron Age and the third to fourth centuries AD; a subtle recovery is visible around the 17th–18th centuries. Cannabaceae are characterized by low values, and remain sporadic; they do not prove hemp cultivation, which has been demonstrated in this area during the last millennium [3,4]. Human impact on the environment is maybe well-evidenced by testate amoebae (Figure 3), which suggest increasingly dry conditions during the last millennium linked with human activities.

4.4. The Comeback of Pinus during the Last Millennium

From 1000 years cal BP, the water table level declines, which significantly modifies the biological communities of the environment (Figure 3 and Figure 5). The vegetation also changes, and Pinus expands again, possibly including on the peatland margin. In most pollen analyses performed in the Jura Mountains, Pinus decreases after the Preboreal period, and its pollen representation remains weak during the Holocene period [5,28,38]. In some case, Pinus increases again at the end of the Holocene, and this expansion on the peatland, as well as in other places, has been widely discussed. It was first discussed by Reille [10], who considered that man has played an important role in the expansion of Pius. Then other authors [12,15] attempted to explain the “recent” development of Mountain Pinus as the consequences of peat cutting; attempts to drain the peatland; exploitation of the Pinus themselves; and more generally, attempts to exploit these vast wetlands as grazing areas.
Historical pine expansion starts during the warm medieval maximum [28,39]. Local historical sources suggest a growing human impact on forest cover as soon as the seventh and eighth centuries; however, deforestation increased mostly during the 10th–11th centuries. Our study is consistent with historical data. A previous testate amoebae study carried out in the Swiss Jura Mountains has already highlighted how 1500 years ago, deforestation had resulted in a rapid lowering of the groundwater level [40], and dryness conditions enhanced Pinus encroachment on a peatland [13].
Historical and paleoenvironmental data [41,42,43] also suggest reforestation and relative land abandonment during the 14th century, as a consequence of wars and the Black Death. As human activities are weakly perceived, our pollen diagram does not evidence abandonment. However, pollen Pinus maximum around the 15th century could be linked to the consequences of this temporary abandonment. From the 16th century, Pinus values declined progressively, but remained relatively important and unusual. Pollen representation of species directly related to the peatland, such as Calluna and other ericaceous plants, also shows fluctuations that are probably related to moisture variations. Peat was harvested in almost all peatlands of the region, and particularly in the Forbonnet peatland. According Bégeot and Richard [12], Pinus uncinata and Calluna vulgaris development is associated with the increase in peat cutting since the middle of the 17th century. The minimum of Pinus pollen is dated from the beginning of the 19th century. At this period, forest areas covered less than 13% of the national territory (31% nowadays). Afterward, Pinus values increased again to reach a maximum in last decades.

5. Conclusions

This study shows the very good complementarity of pollen and testate amoebae analyses (Figure 5). With the help of a robust age–depth model, it is therefore possible to reconstruct climate and local human impact on vegetation and peatland development accurately. Climate seems to be the main driver of observed changes until 2600 cal BP, after which deforestation seems to be the main driver of observed changes. Large peatlands are known to record a quite large pollen rain signal. However, the presence of trees around the peatland could have created a filter for regional pollen rain. Thus, the vegetation history inferred from the pollen data seems very local, and human activities beyond the trees are weakly recorded.
The results show four successive phases, corresponding to major Holocene climatic oscillations and to anthropogenic impact as follows:
(1)
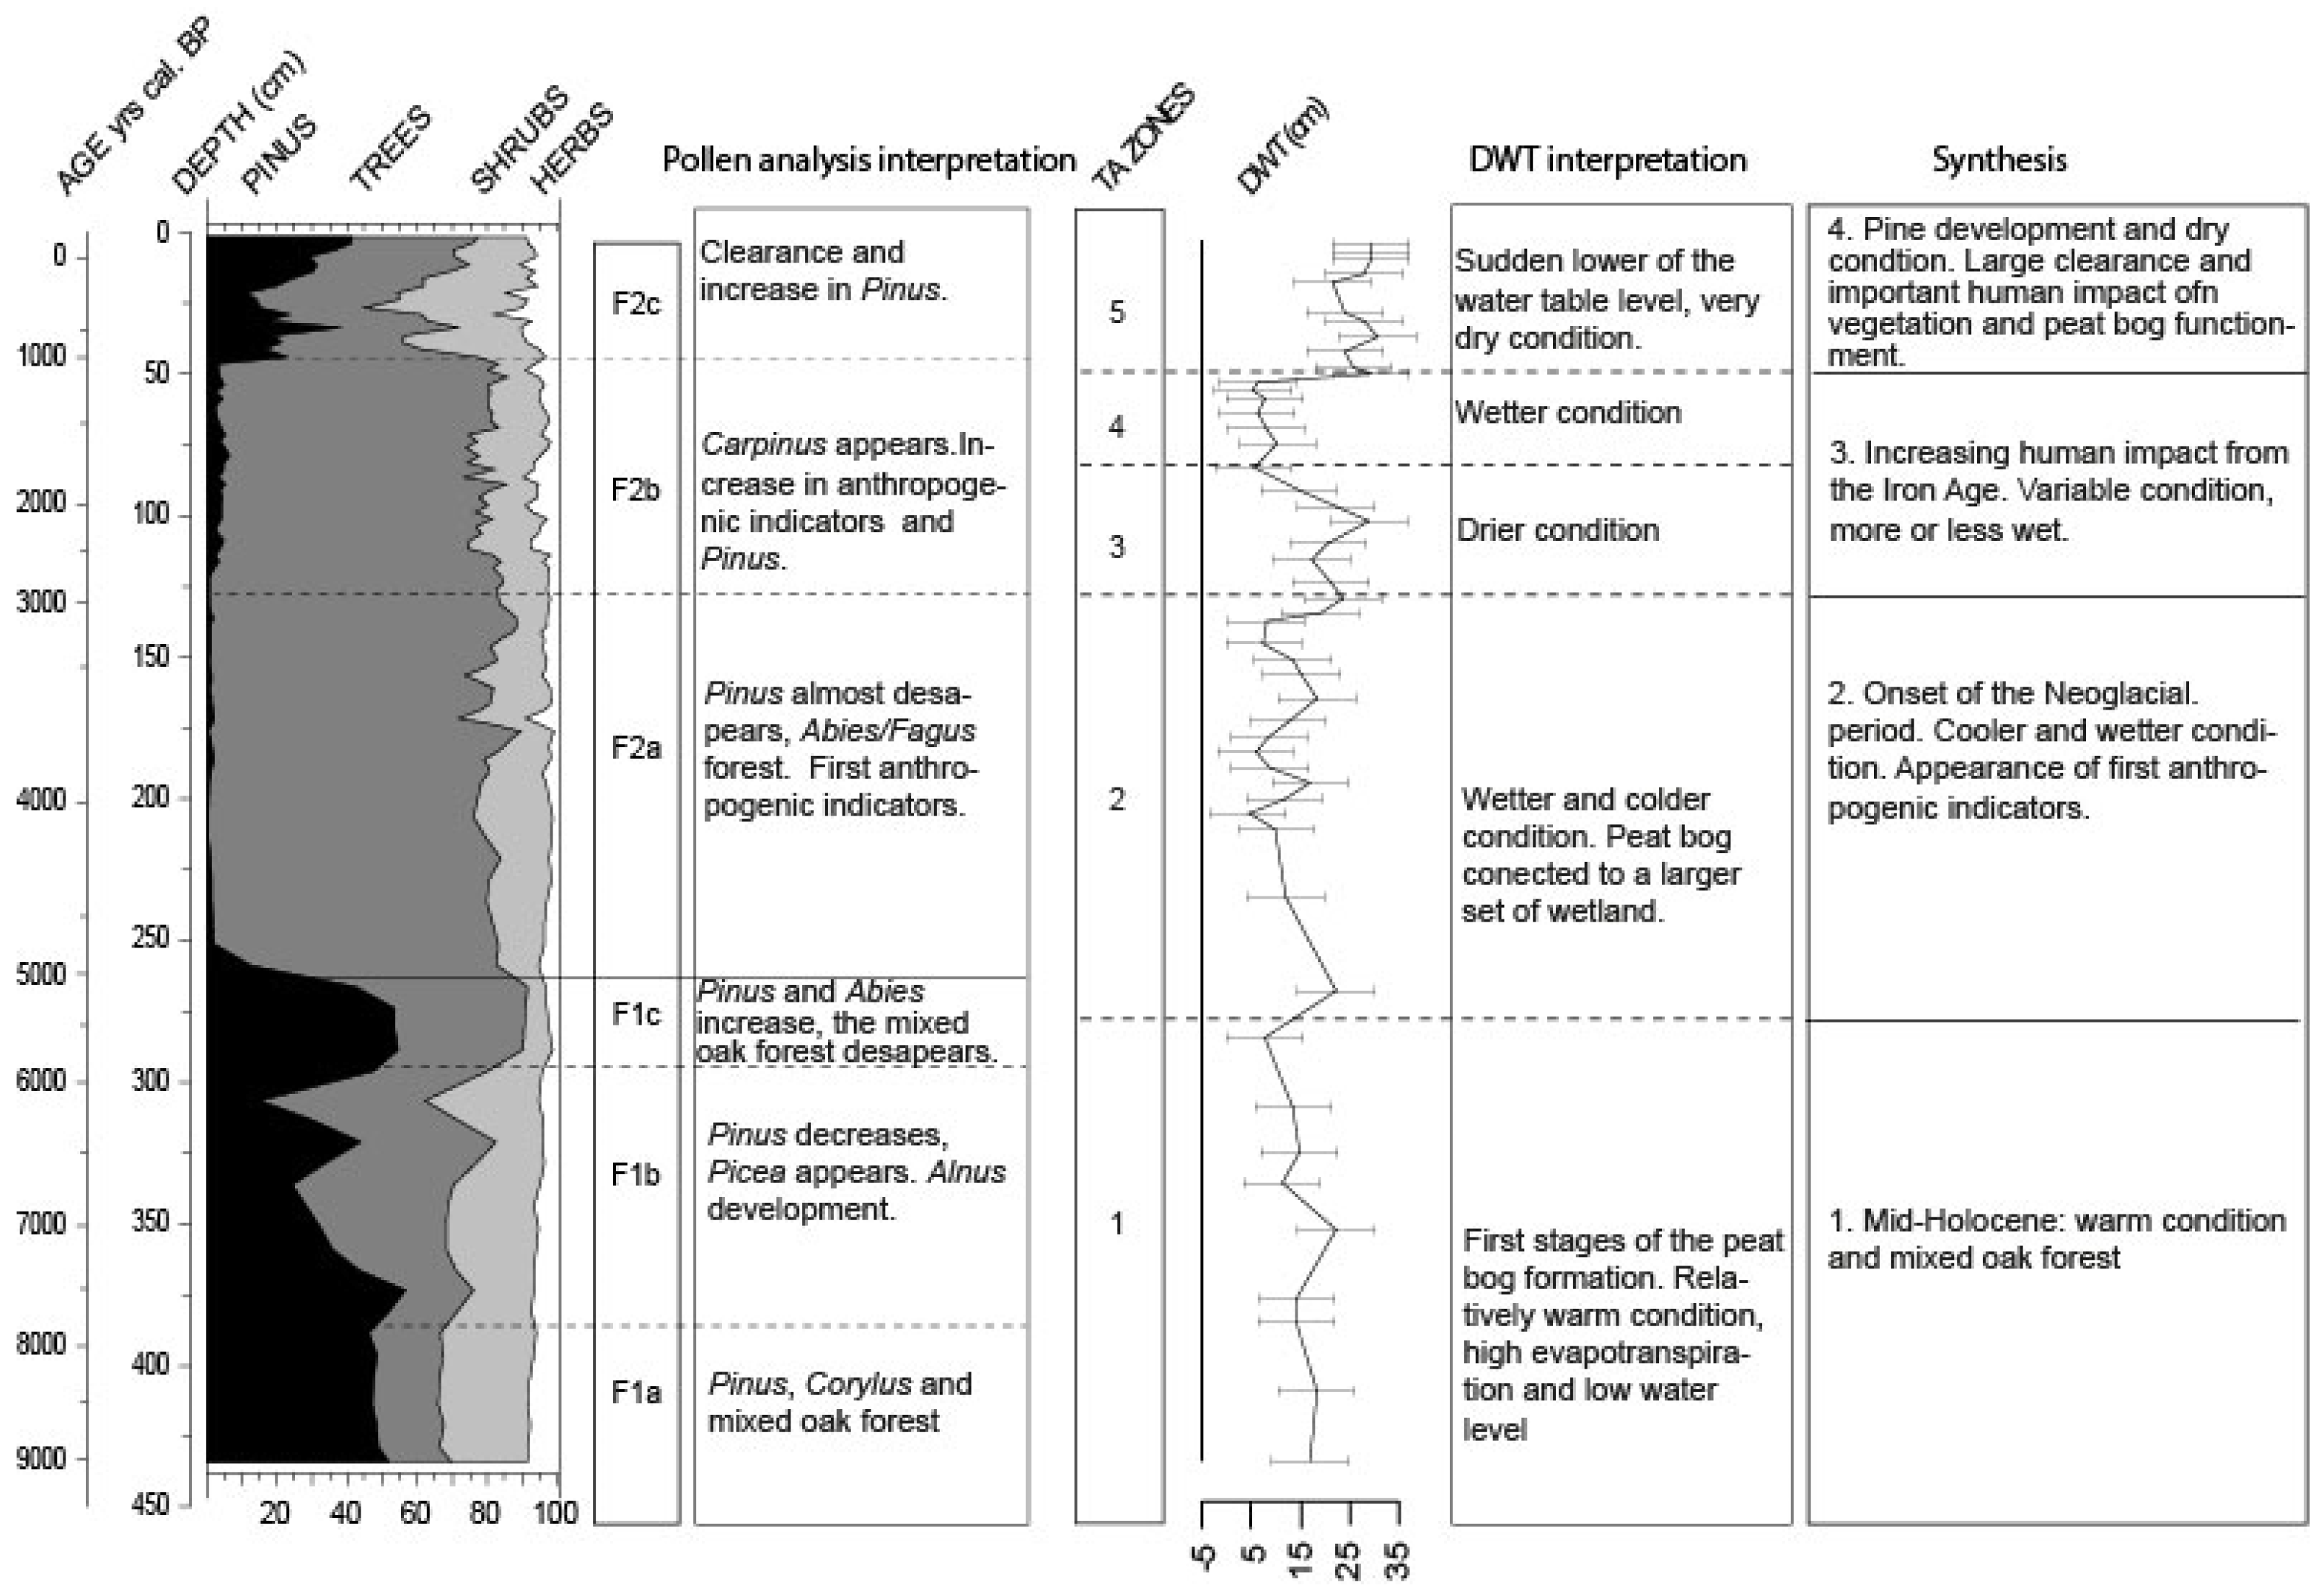
The early-middle Holocene (9000 to 5800 cal BP): peatland formation probably began 9000 years ago, first by filling a basin in which water accumulated. The relatively warm conditions during this period, which were responsible for high evapotranspiration, may have led to relatively low water levels. Dry condition enabled Pinus expansion in and around the peatland. Regionally, the mixed Quercus forest remained the main vegetation formation;
(2)
Neoglacial period (5800 cal BP onward): around 5800/5600 cal BP, the main components of the Holocene thermal maximum mixed broad-leaves forest progressively disappeared to give way to the Fagus/Abies forest. The peatland expanded and became wetter. Testate amoebae show a long-term trend with the wetter conditions, indicating the onset of the Neoglacial period [5,29]. From this period onward, the different wetlands connected to form a vast peatland complex, with peat thickness reaching more than three meters. The near absence of anthropogenic pollen indicators is quite unusual in this region;
(3)
Increasing human activities (2600–1000 cal BP): it is not until 2600 cal BP (the Iron Age) that human impact seems to have played a role on peatland development, modifying the water table. The recorded changes are potentially linked to farmers’ settlements in the surroundings, increasing or decreasing land use (migration period), and the reduction or extension of the forested area at the periphery of the peatland;
(4)
Last millennium: the development of agricultural practices regionally on this Jura plateau over thousands of years is not well known. If human impact seems locally weak, the consequences on the peatland are clearly visible. Land use development and human impact (e.g., deforestation, drainage systems, and peat cutting) probably enhanced peatland dryness. Pinus development appears as a consequence of these massive impacts, and is therefore not a natural stage of peatland development.
The Forbonnet peatland sequence offers a clear illustration of how changes in the water table or increases in human impact may provoke rapid responses in a peatland ecosystem. Both proxies, pollen and testate amoeba, seems to have, in this case, the same dates of their tipping points. Changes in humidity, temperature, and vegetation directly affected both pollen and testate amoeba representation, suggesting comparable threshold sensitivity.

Author Contributions

Methodology: E.G., H.R., V.E.J.J., E.A.D.M., M.L., D.G. and R.P.; investigation: H.R., V.E.J.J., E.A.D.M., D.G. and R.P.; writing—original draft preparation: E.G., H.R., V.E.J.J., D.G. and V.D.; writing—review and editing: E.G., H.R., V.E.J.J., E.A.D.M., M.L. and D.G.; project administration, F.-L.D.; funding acquisition, F.D. and F.-L.D.

Funding

This project was financially supported by the ANR (French National Agency) and the PeatWarm project (ANR-07-VULN-010).

Acknowledgments

This article is dedicated to our colleague Richard Payne, who died accidentally during the ascent of Nanda Nevi (India) in May 2019. The authors would like to thank Julien Didier for the chemical preparation of the palynological samples, and Benjamin Diètre for the construction of the age–depth model.

Conflicts of Interest

The authors declare no conflict of interest.

References

  1. Jassey, V.E.J.; Chiapusio, G.; Gilbert, D.; Toussaint, M.L.; Binet, P. Phenoloxidase and peroxidase activities in Sphagnum-dominated peatland in a warming climate. Soil Biol. Biochem. 2012, 46, 49–52. [Google Scholar] [CrossRef]
  2. Jassey, V.E.J.; Chiapusio, G.; Binet, P.; Buttler, A.; Laggoun-Défarge, F.; Delarue, F.; Gilbert, D. Above-and belowground linkages in Sphagnum peatland: Climate warming affects plant-microbial interactions. Glob. Chang. Biol. 2013, 19, 811–823. [Google Scholar] [CrossRef] [PubMed]
  3. Gauthier, E. Évolution des activités agropastorales du Haut Jura (France) au cours des trois derniers millénaires. Quaternaire 2002, 13, 137–147. [Google Scholar] [CrossRef]
  4. Gauthier, E. Forêts Et Agriculteurs Du Jura. Les Quatre Derniers Millénaires; Annales Littéraires de l’Université de Franche-Comté; 765, série « Environnement, sociétés et archéologie; Presses Universitaires de Franche-Comté: Besançon, France, 2004; p. 197. [Google Scholar]
  5. Leroux, A.; Bichet, V.; Walter-Simonnet, A.-V.; Magny, M.; Adatte, T.; Gauthier, E.; Richard, H.; Baltzer, A. Late Glacial-Holocene sequence of Lake Saint-Point (Jura Mountains, France): Detrital inputs as records of climate change and anthropic impact. C. R. Geosci. 2008, 340, 883–892. [Google Scholar] [CrossRef]
  6. Magny, M.; Gauthier, E.; Vannière, B.; Peyron, O. Palaeohydrological changes and human-impact history over the last millennium recorded at Lake Joux in the Jura Mountains, Switzerland. Holocene 2008, 18, 255–265. [Google Scholar] [CrossRef]
  7. Dubois, C.; Dubois, G.; Firtion, F. Examen micropaléontologique de tourbes du Jura français. Rev. De Sci. Nat. D’auvergne 1943, 9, 44–50. [Google Scholar]
  8. Firtion, F. Contribution à l’étude Paléontologique, Stratigraphique et Physicochimique des Tourbières du Jura Français; Mémoire du Service de la Carte géologique d’Alsace et Lorraine: Strasbourg, France, 1950; Volume 10, p. 92. Available online: https://www.persee.fr/doc/sgeol_0080-9020_1950_mon_10_1 (accessed on 28 November 2019).
  9. Reille, M. L’origine de la station de pin à crochets de la tourbière de Pinet (Aude) et de quelques stations isolées de cet arbre dans les Vosges et le Jura. Bulletin de la Société Botanique de France. Lett. Bot. 1991, 138, 123–148. [Google Scholar]
  10. Guiter, F.; Andrieu-Ponel, V.; Digerfeldt, G.; Reille, M.; de Beaulieu, J.L.; Ponel, P. Vegetation history and lake-level changes from the Younger Dryas to the present in Eastern Pyrenees (France): Pollen, plant macrofossils and lithostratigraphy from Lake Racou (2000 m asl). Veg. Hist. Archaeobotany 2005, 14, 99–118. [Google Scholar] [CrossRef]
  11. Bégeot, C.; Richard, H. L’origine récente des peuplements de Pin à crochets (Pinus uncinata Miller ex Mirbel) sur la tourbière de Frasne et exploitation de la tourbe dans le Jura. Acta Bot. Gall. 1996, 143, 47–53. [Google Scholar] [CrossRef]
  12. Freléchoux, F.; Buttler, A.; Gillet, F. Dynamics of peatland-pine dominated mires in the Jura mountains, Switzerland: A tentative scheme based on synusial phytosociology. Folia Geobot. 2000, 35, 273–288. [Google Scholar] [CrossRef]
  13. Freléchoux, F.; Buttler, A.; Schweingruber, F.H.; Gobat, J.M. Spatio-temporal pattern of peatland pine (Pinus uncinata var. rotundata) at the interface with the Norway spruce (Picea abies) belt on the edge of a raised peatland in the Jura Mountains, Switzerland. Ann. Forest Sci. 2004, 61, 309–318. [Google Scholar]
  14. Mitchell, E.A.D.; Buttler, A.J.; Warner, B.G.; Gobat, J.-M. Ecology of testate amoebae (Protozoa: Rhizopoda) in Sphagnum peatlands in the Jura mountains, Switzerland and France. Ecoscience 1999, 6, 565–576. [Google Scholar] [CrossRef]
  15. Heuertz, M.; Teufel, J.; González-Martínez, S.C.; Soto, A.; Fady, B.; Alía, R.; Vendramin, G.G. Geography determines genetic relationships between species of mountain pine (Pinus mugo complex) in western Europe. J. Biogeogr. 2010, 37, 541–556. [Google Scholar] [CrossRef]
  16. Booth, R.K.; Lamentowicz, M.; Charman, D.J. Preparation and analysis of testate amoebae in peatland palaeoenvironmental studies. Mires Peat 2010, 7, 1–7. [Google Scholar]
  17. R Core Team. R: A Language and Environment for Statistical Computing; R Foundation for Statistical Computing: Vienna, Austria, 2015; Available online: http://www.R-project.org/ (accessed on 21 November 2019).
  18. Utermöhl, H. Zur Vervollkommnung der quantitativen Phytoplanktonmethodik. Mitt. Int. Ver. Limnol. 1958, 9, 1–38. [Google Scholar]
  19. Amesbury, M.J.; Swindles, G.T.; Bobrov, A.; Charman, D.J.; Holden, J.; Lamentowicz, M.; Mallon, G.; Mazei, Y.; Mitchell, E.A.D.; Payne, R.J.; et al. Development of a new pan-European testate amoeba transfer function for reconstructing peatland palaeohydrology. Quat. Sci. Rev. 2016, 152, 132–151. [Google Scholar] [CrossRef]
  20. Blaauw, M. Methods and code for “classical” age-modelling of radiocarbon sequences. Quat. Geochronol. 2010, 5, 512–518. [Google Scholar] [CrossRef]
  21. Juggins, S. C2 User Guide. Software for Ecological and Palaeoecological Data Analysis and Visualisation; University of Newcastle: Newcastle Upon Tyne, UK, 2003. [Google Scholar]
  22. Moore, P.D.; Webb, J.A.; Collison, M.E. Pollen Analysis; Blackwell Scientific Publications: Hoboken, NJ, USA, 1991. [Google Scholar]
  23. Faegri, K.; Iversen, J. Textbook of Pollen Analysis; Wiley: Chichester, UK, 1989; p. 486. [Google Scholar]
  24. Reille, M. Pollen et Spores d’Europe et d’Afrique du Nord. Laboratoire de Botanique Historique et Palynologie; URA CNRS: Marseille, France, 1992; p. 327. [Google Scholar]
  25. Beug, H.J. Leitfaden der Pollenbestimmung für Mitteleuropa und Angrenzende Gebiete; Friedrich Pfeil: München, Germany, 2004. [Google Scholar]
  26. Grimm, E.C. Tilia and Tiliagraph; Illinois State Museum: Springfield, IL, USA, 1991; Volume 101. [Google Scholar]
  27. Grimm, E.C. CONISS: A FORTRAN 77 program for stratigraphically constrained cluster analysis by the method of incremental sum of squares. Comput. Geosci. 1987, 13, 13–35. [Google Scholar] [CrossRef]
  28. Richard, H. Nouvelles Contributions à L’histoire de la végétation Franc-Comtoise Tardiglaciaire et Holocène à Partir des Données de la Palynologie; Université de Franche-Comté: Besançon, France, 1983; p. 155. [Google Scholar]
  29. Wegmüller, S. Uber die Spät- und Postglaziale Vegetationgeschichte des Südwestlichen Jura; Beitr. Geobot. Landesaufn: Schweiz, Switzerland, 1966; Volume 48, p. 142. [Google Scholar]
  30. Van Der Knaap, W.O.; Van Leeuwen, J.F.; Finsinger, W.; Gobet, E.; Pini, R.; Schweizer, A.; Ammann, B. Migration and population expansion of Abies, Fagus, Picea, and Quercus since 15000 years in and across the Alps, based on pollen-percentage threshold values. Quat. Sci. Rev. 2005, 24, 645–680. [Google Scholar] [CrossRef]
  31. Matthey, F. Contribution à l’étude de l’évolution tardi- et postglaciaire de la végétation dans le Jura central. Beitr. Geobot. Landesaufn. Schweiz 1971, 53, 86. [Google Scholar]
  32. Magny, M. Holocene climate variability as reflected by mid-European lake-level fluctuations and its probable impact on prehistoric human settlements. Quat. Int. 2004, 113, 65–79. [Google Scholar] [CrossRef]
  33. Pétrequin, P.; Magny, M.; Bailly, M. Habitat lacustre, densité de population et climat. L’exemple du Jura français. In Proceedings of the International Conference on Wetland Economies and Societies in Zürich, Switzerland, 10–13 March 2004; Della Casa, P., Trachsel, M., Eds.; Collectio Archaeologica: Zürich-Chronos, Switzerland, 2005; pp. 143–168. [Google Scholar]
  34. Clark, S.H.; Edwards, K.J. Elm bark beetle in Holocene peat deposits and the northwest European elm decline. J. Quat. Sci. 2004, 19, 525–528. [Google Scholar] [CrossRef]
  35. Bichet, P.; Millotte, J.-P. L’âge du Fer dans le Haut Jura. Les Tumulus de la région de Pontarlier (Doubs); Documents d’Archéologie Française: Paris, France, 1992; Volume 34, p. 151. [Google Scholar]
  36. Behre, K.E. The rôle of Man in European Vegetation History; Huntley, B., Webb, T., Eds.; Vegetation History: Dordrecht, The Netherlands, 1988; pp. 633–672. [Google Scholar]
  37. Rösch, M. Human impact as registred in the pollen record: Some results from the western Lake Constance region, Southern Germany. Veg. Hist. Archaeobotany 1992, 1, 101–109. [Google Scholar] [CrossRef]
  38. Dreßler, M.; Selig, U.; Dörfler, W.; Adler, S.; Schubert, H.; Hübener, T. Environmental changes and the Migration Period in northern Germany as reflected in the sediment of Lake Dudinghausen. Quat. Res. 2005, 66, 25–37. [Google Scholar] [CrossRef]
  39. Crowley, T.J.; Lowery, T.S. How warm was the medieval warm period? AMBIO A J. Hum. Environ. 2000, 29, 51–55. [Google Scholar] [CrossRef]
  40. Mitchell, E.A.D.; van der Knaap, W.O.; van Leeuwen, J.F.; Buttler, A.; Warner, B.G.; Gobat, J.-M. The palaeoecological history of the Praz-Rodet peatland (Swiss Jura) based on pollen, plant macrofossils and testate amoebae (Protozoa). Holocene 2001, 11, 65–80. [Google Scholar] [CrossRef]
  41. Gresser, P.; Robert, A.; Royer, C.; Vion-Delphin, F. Les Hommes Et La Forêt En Franche-Comté; Editions Bonneton: Paris, France, 1990. [Google Scholar]
  42. Chabin, J.-P. La Forêt Dans Tous Ses Etats: De La Préhistoire à Nos Jours; Presses Universitaires de Franche-Comté: Besançon, France, 2005; p. 409. [Google Scholar]
  43. Richard, H.; Gauthier, E. Préhistoire et histoire des forêts du Jura. Available online: https://hal.archives-ouvertes.fr/hal-01114379 (accessed on 21 November 2019).
Figure 1. Location map of Forbonnet peatland.
Quaternary 02 00038 g001
Figure 2. Peat core stratigraphy (1: clay; 2: successive layers of sapric and fibric peat; 3: compact and fibrous peat) and age–depth model, using a smooth polar interpolation of 13 radiocarbon dates.
Quaternary 02 00038 g002
Figure 3. Testate amoebae simplified percentage diagram with a reconstructed depth of water table curve. Species with an average relative abundance of less than 1% or that appeared in fewer than three samples are not presented, and were not included in the depth of water table (DWT) calculation. Note that Nebela militaris is now called Alabasta militaris.
Quaternary 02 00038 g003
Figure 4. Percentage pollen diagram showing regional vegetation changes in the Forbonnet peatland. AP/T: Arboreal pollen Σ/Total Pollen Σ.
Quaternary 02 00038 g004
Figure 5. Pollen (simplified diagram) and testate amoeba (DWT and zones): synthesis of interpretations.
Quaternary 02 00038 g005
Table 1. Radiocarbon dates for terrestrial remains and age calibrations.
Depth (cm)Materiald13CAGE BP2σ Calibration
SacA 2370922.5–25Peat−25.50165 ± 300–288 cal BP
SacA 2371047.5–50Peat−21.201380 ± 351194–1353 cal BP
SacA 2371172.5–75Peat−27.701610 ± 301413–1557 cal BP
SacA 2371297.5–100Peat−29.202120 ± 302000–2293 cal BP
SacA 23713122.5–125Peat−27.802715 ± 352756–2871 cal BP
SacA 23714147.5–150Peat−27.603205 ± 303368–3477 cal BP
SacA 23715180–182.5Peat−27.303555 ± 303368–3477 cal BP
SacA 23716212.5–215Peat−25.003755 ± 353988–4235 cal BP
SacA 23717242.5–245Peat−27.704055 ± 304432–4784 cal BP
SacA 23718280–282.5Peat−30.304825 ± 405471–5644 cal BP
SacA 23719320–322.5Peat−28.305665 ± 35 6295–6407 cal BP
SacA 23720342.5–345Peat−13.506010 ± 506733–6984 cal BP
SacA 23721395–397.5Peat−9.107250 ± 607965–8177 cal BP

