Last Interglacial Climate in Northern Sweden—Insights from a Speleothem Record

 ,
,
Abstract
1. Introduction
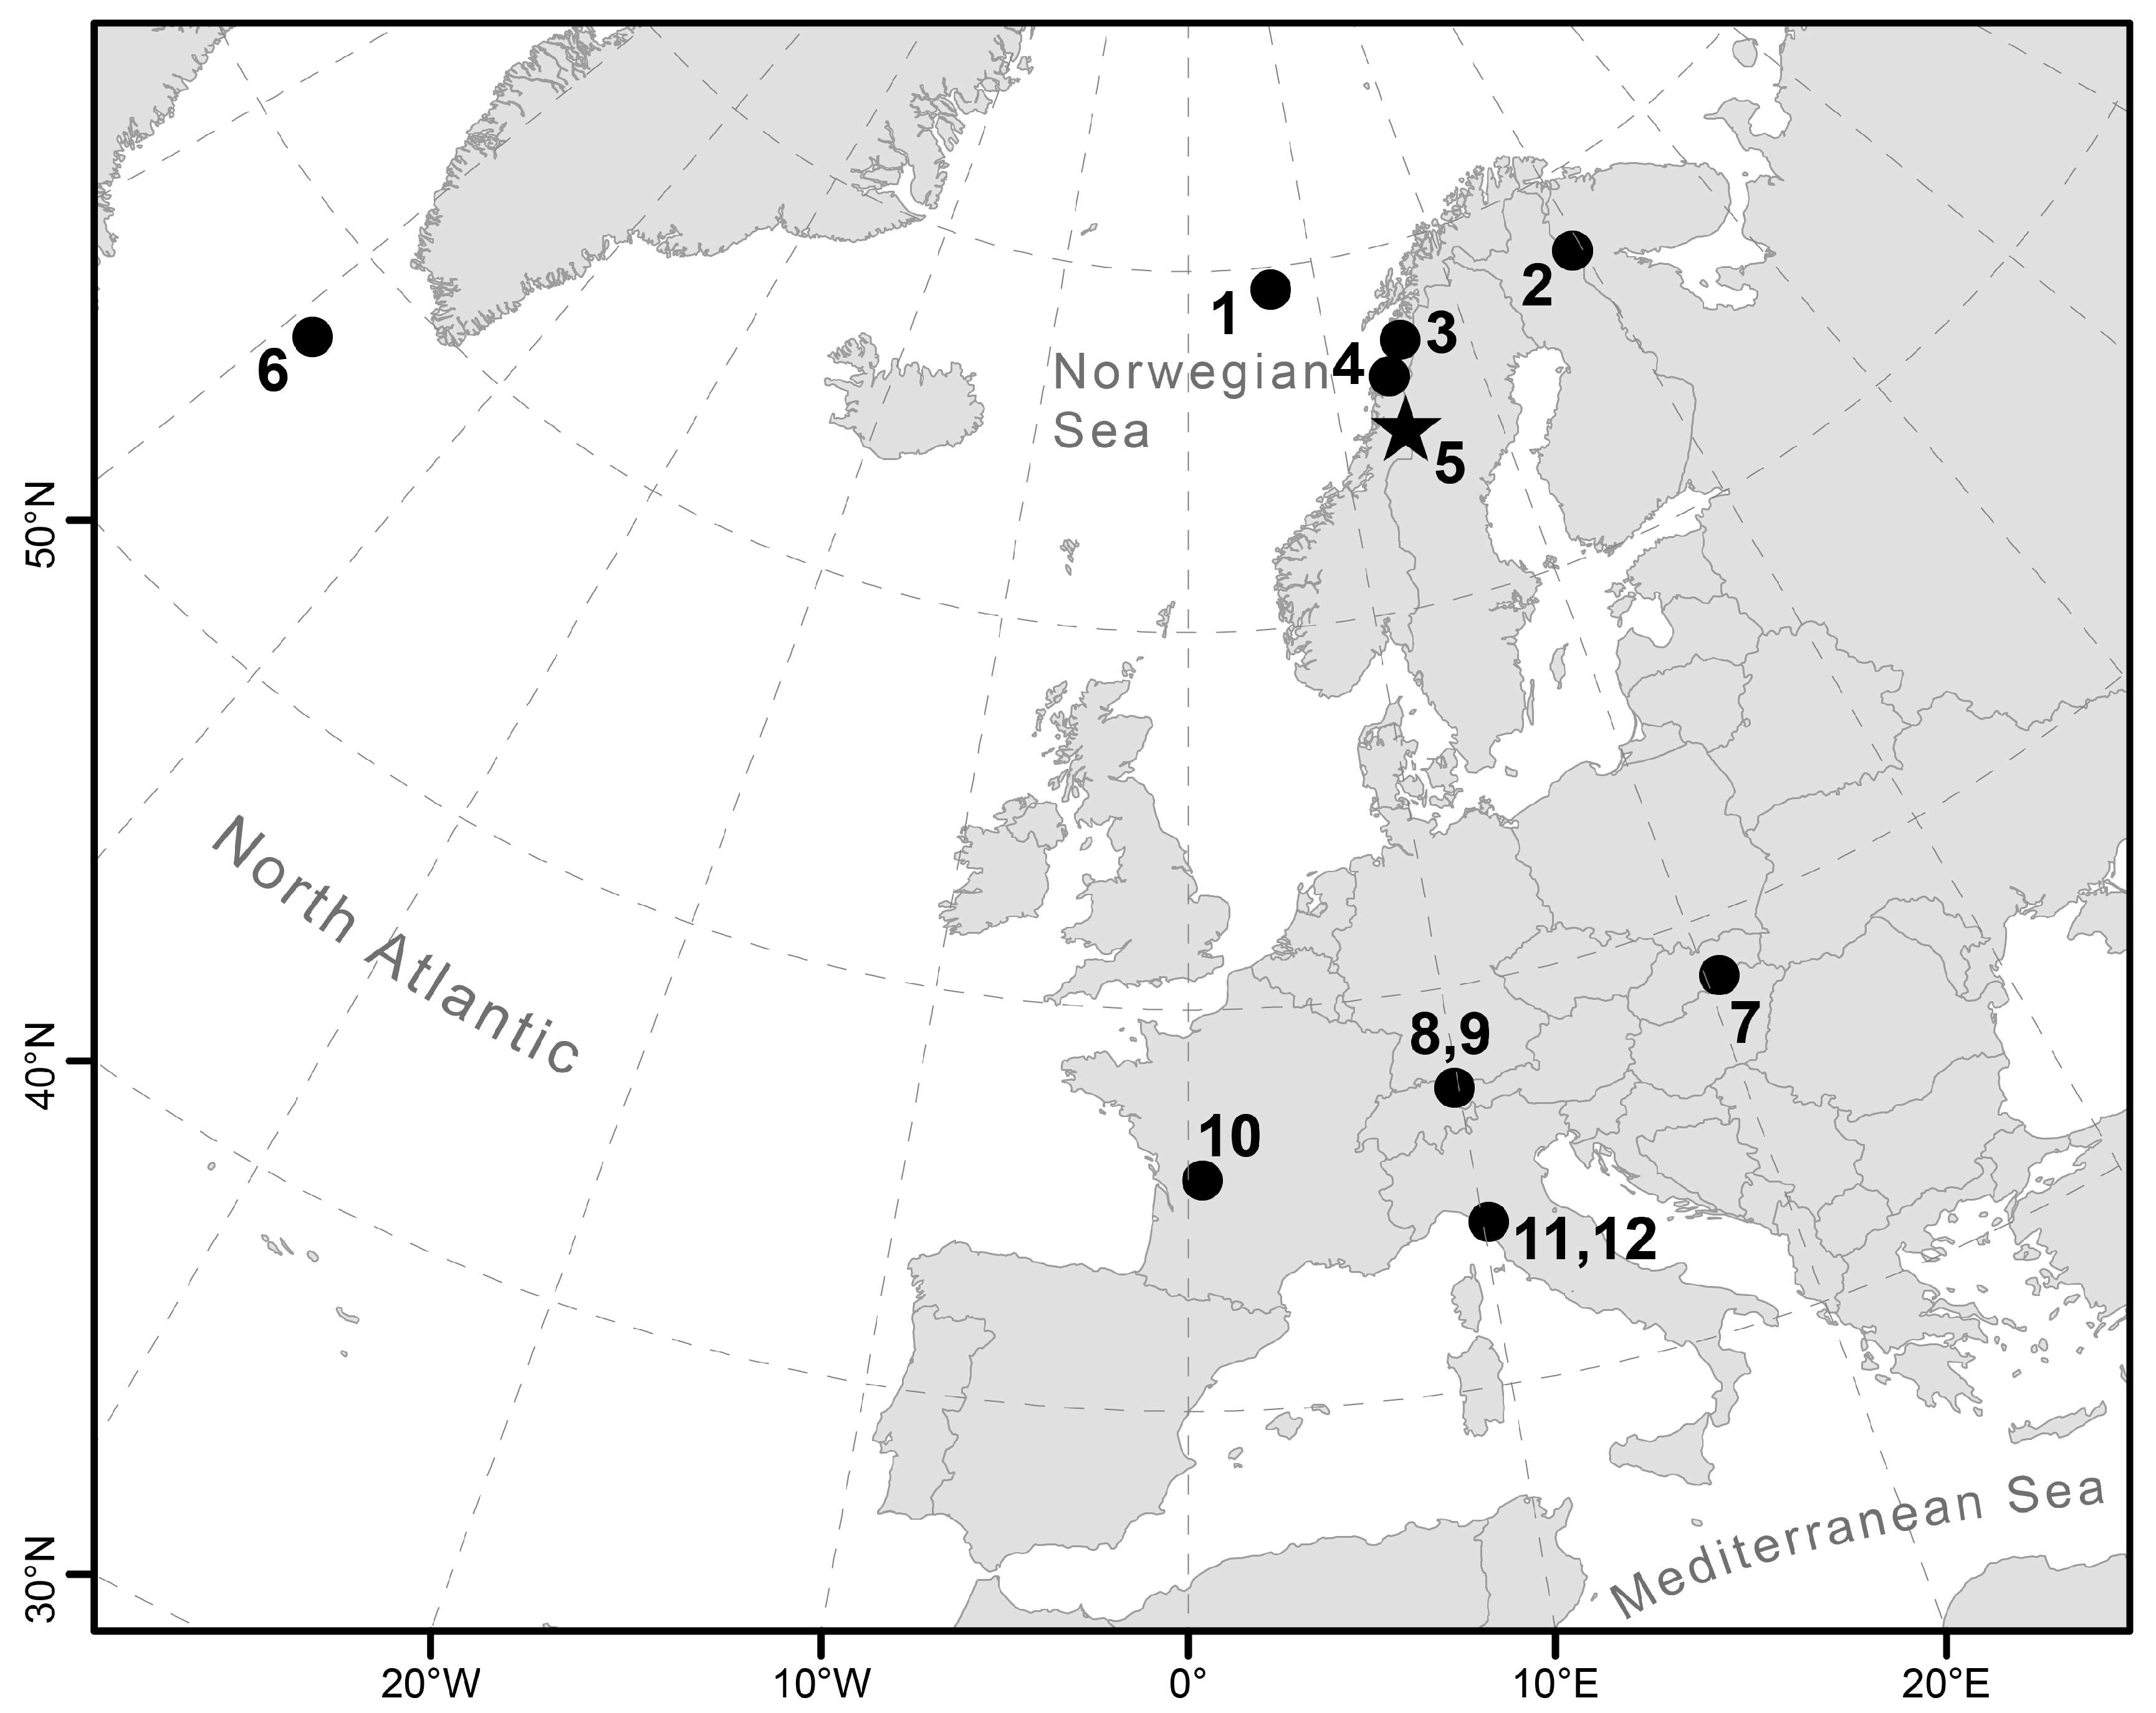
2. Study Site
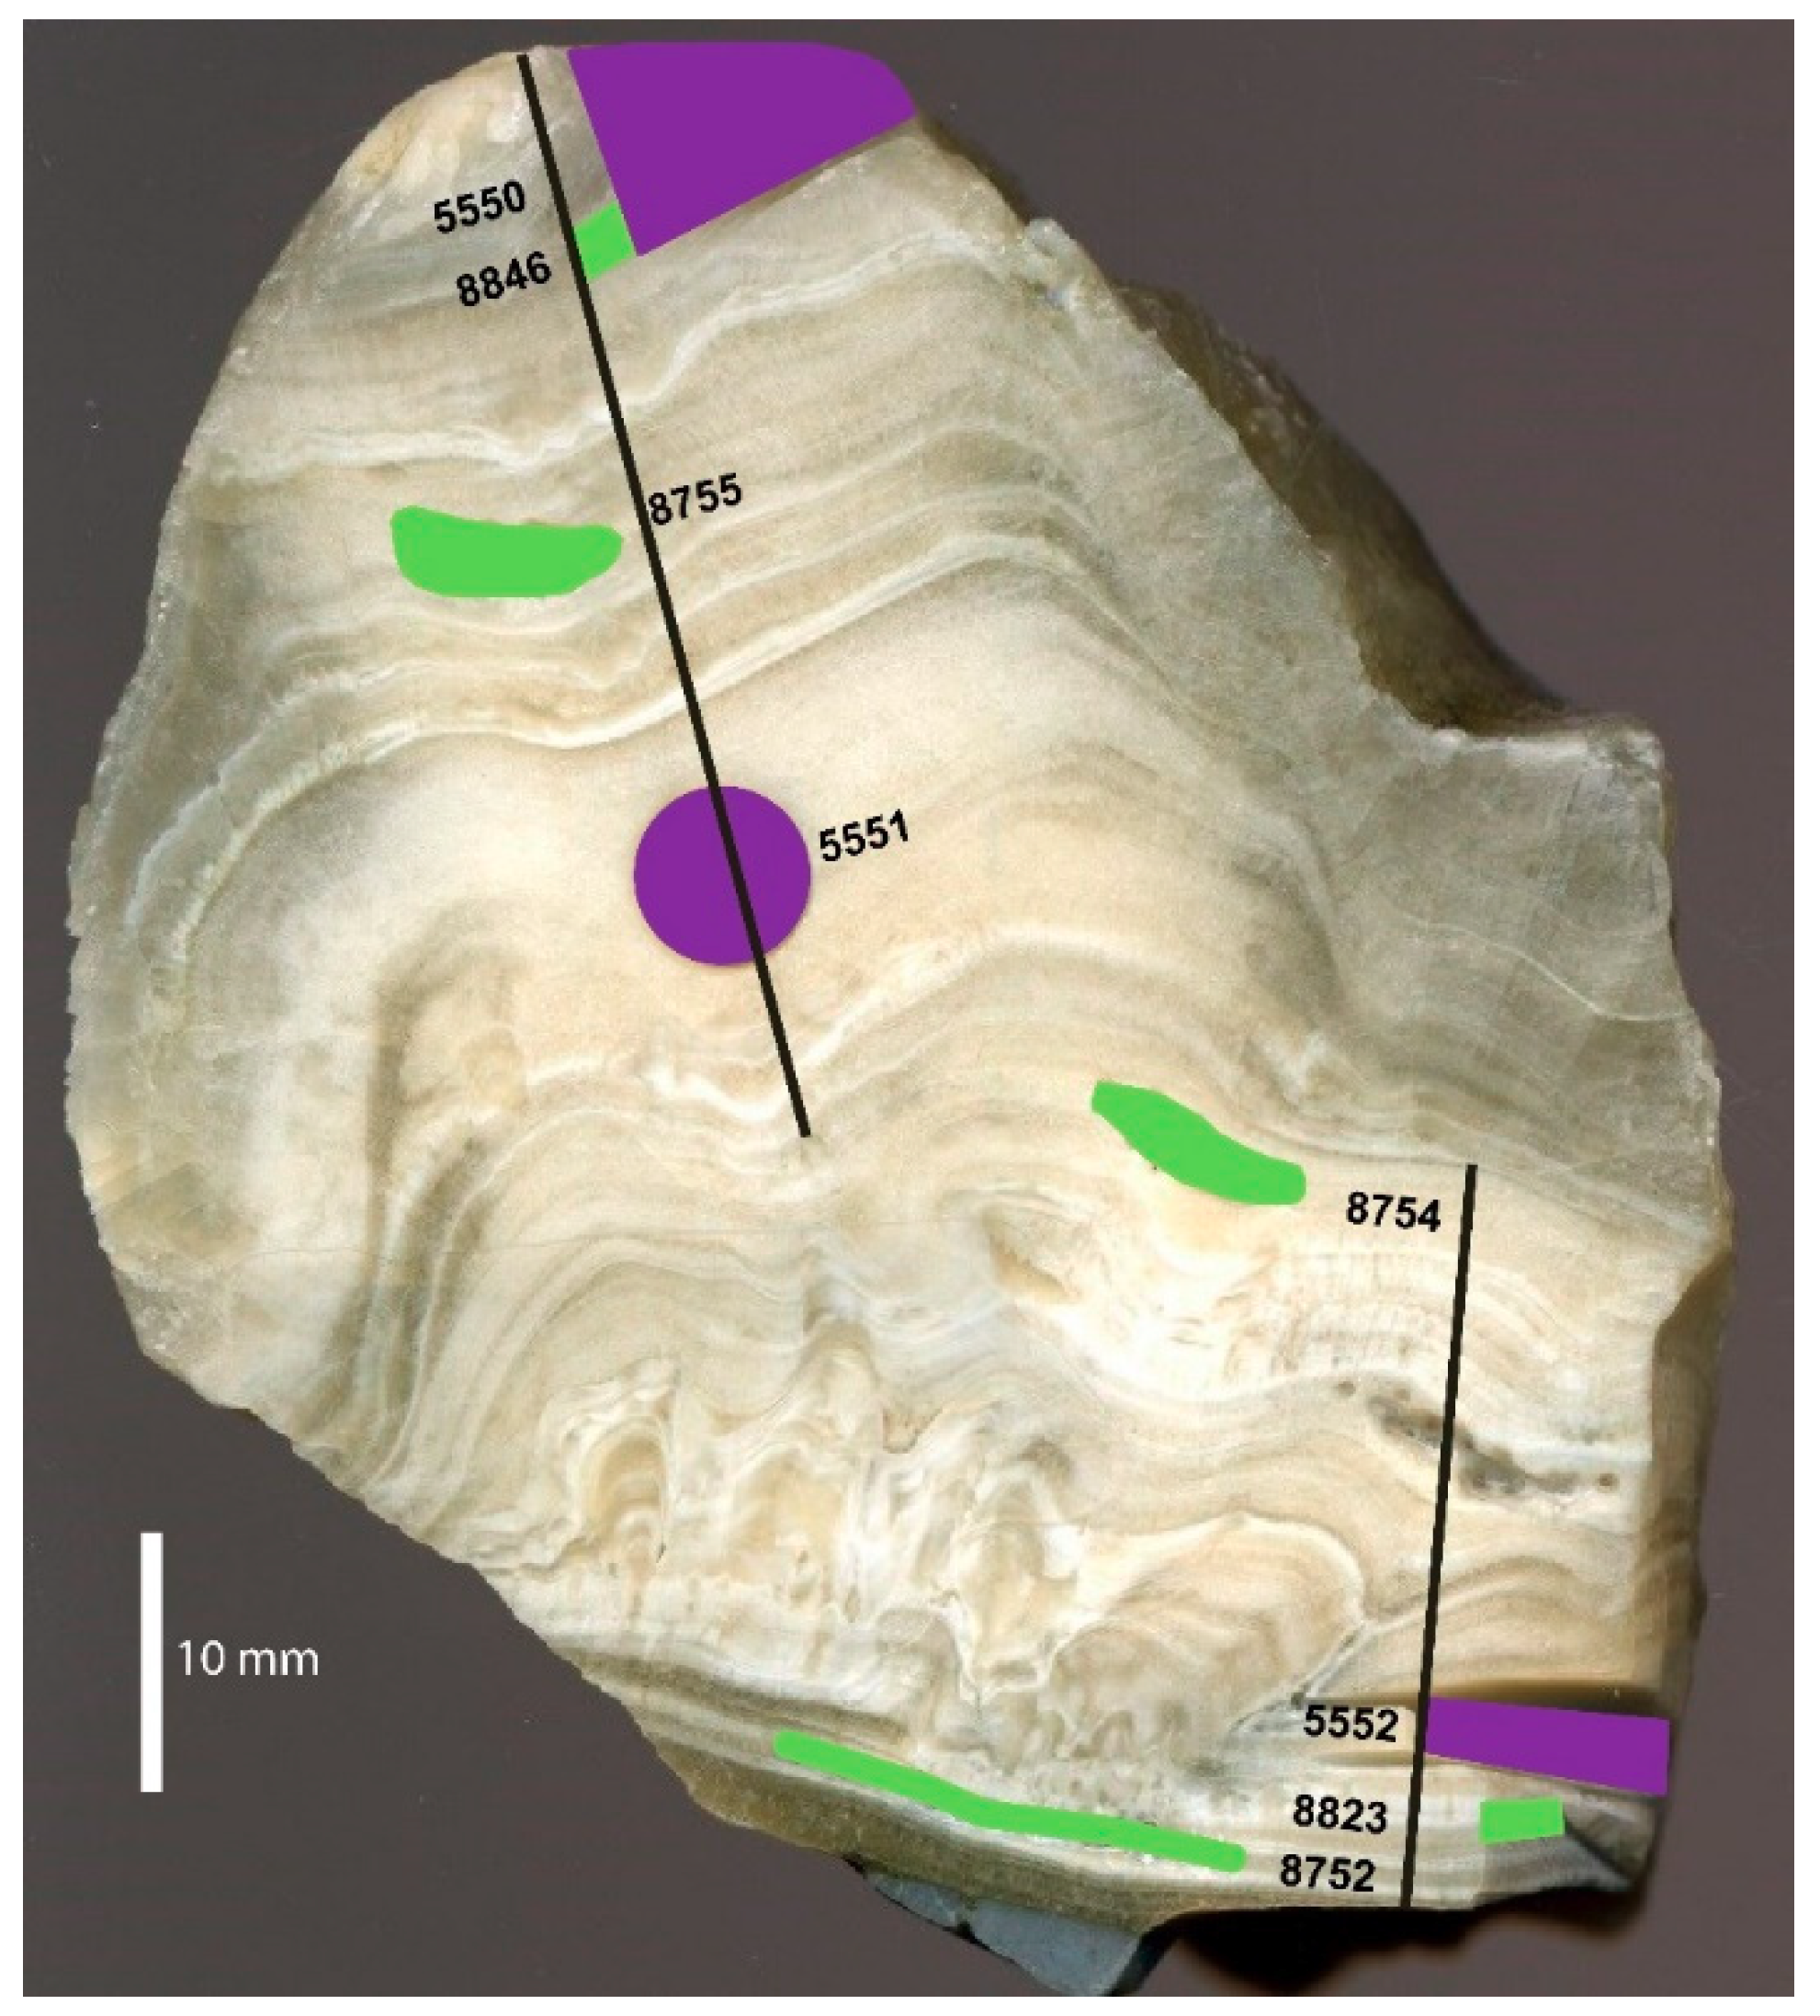
3. Materials and Methods
4. Results
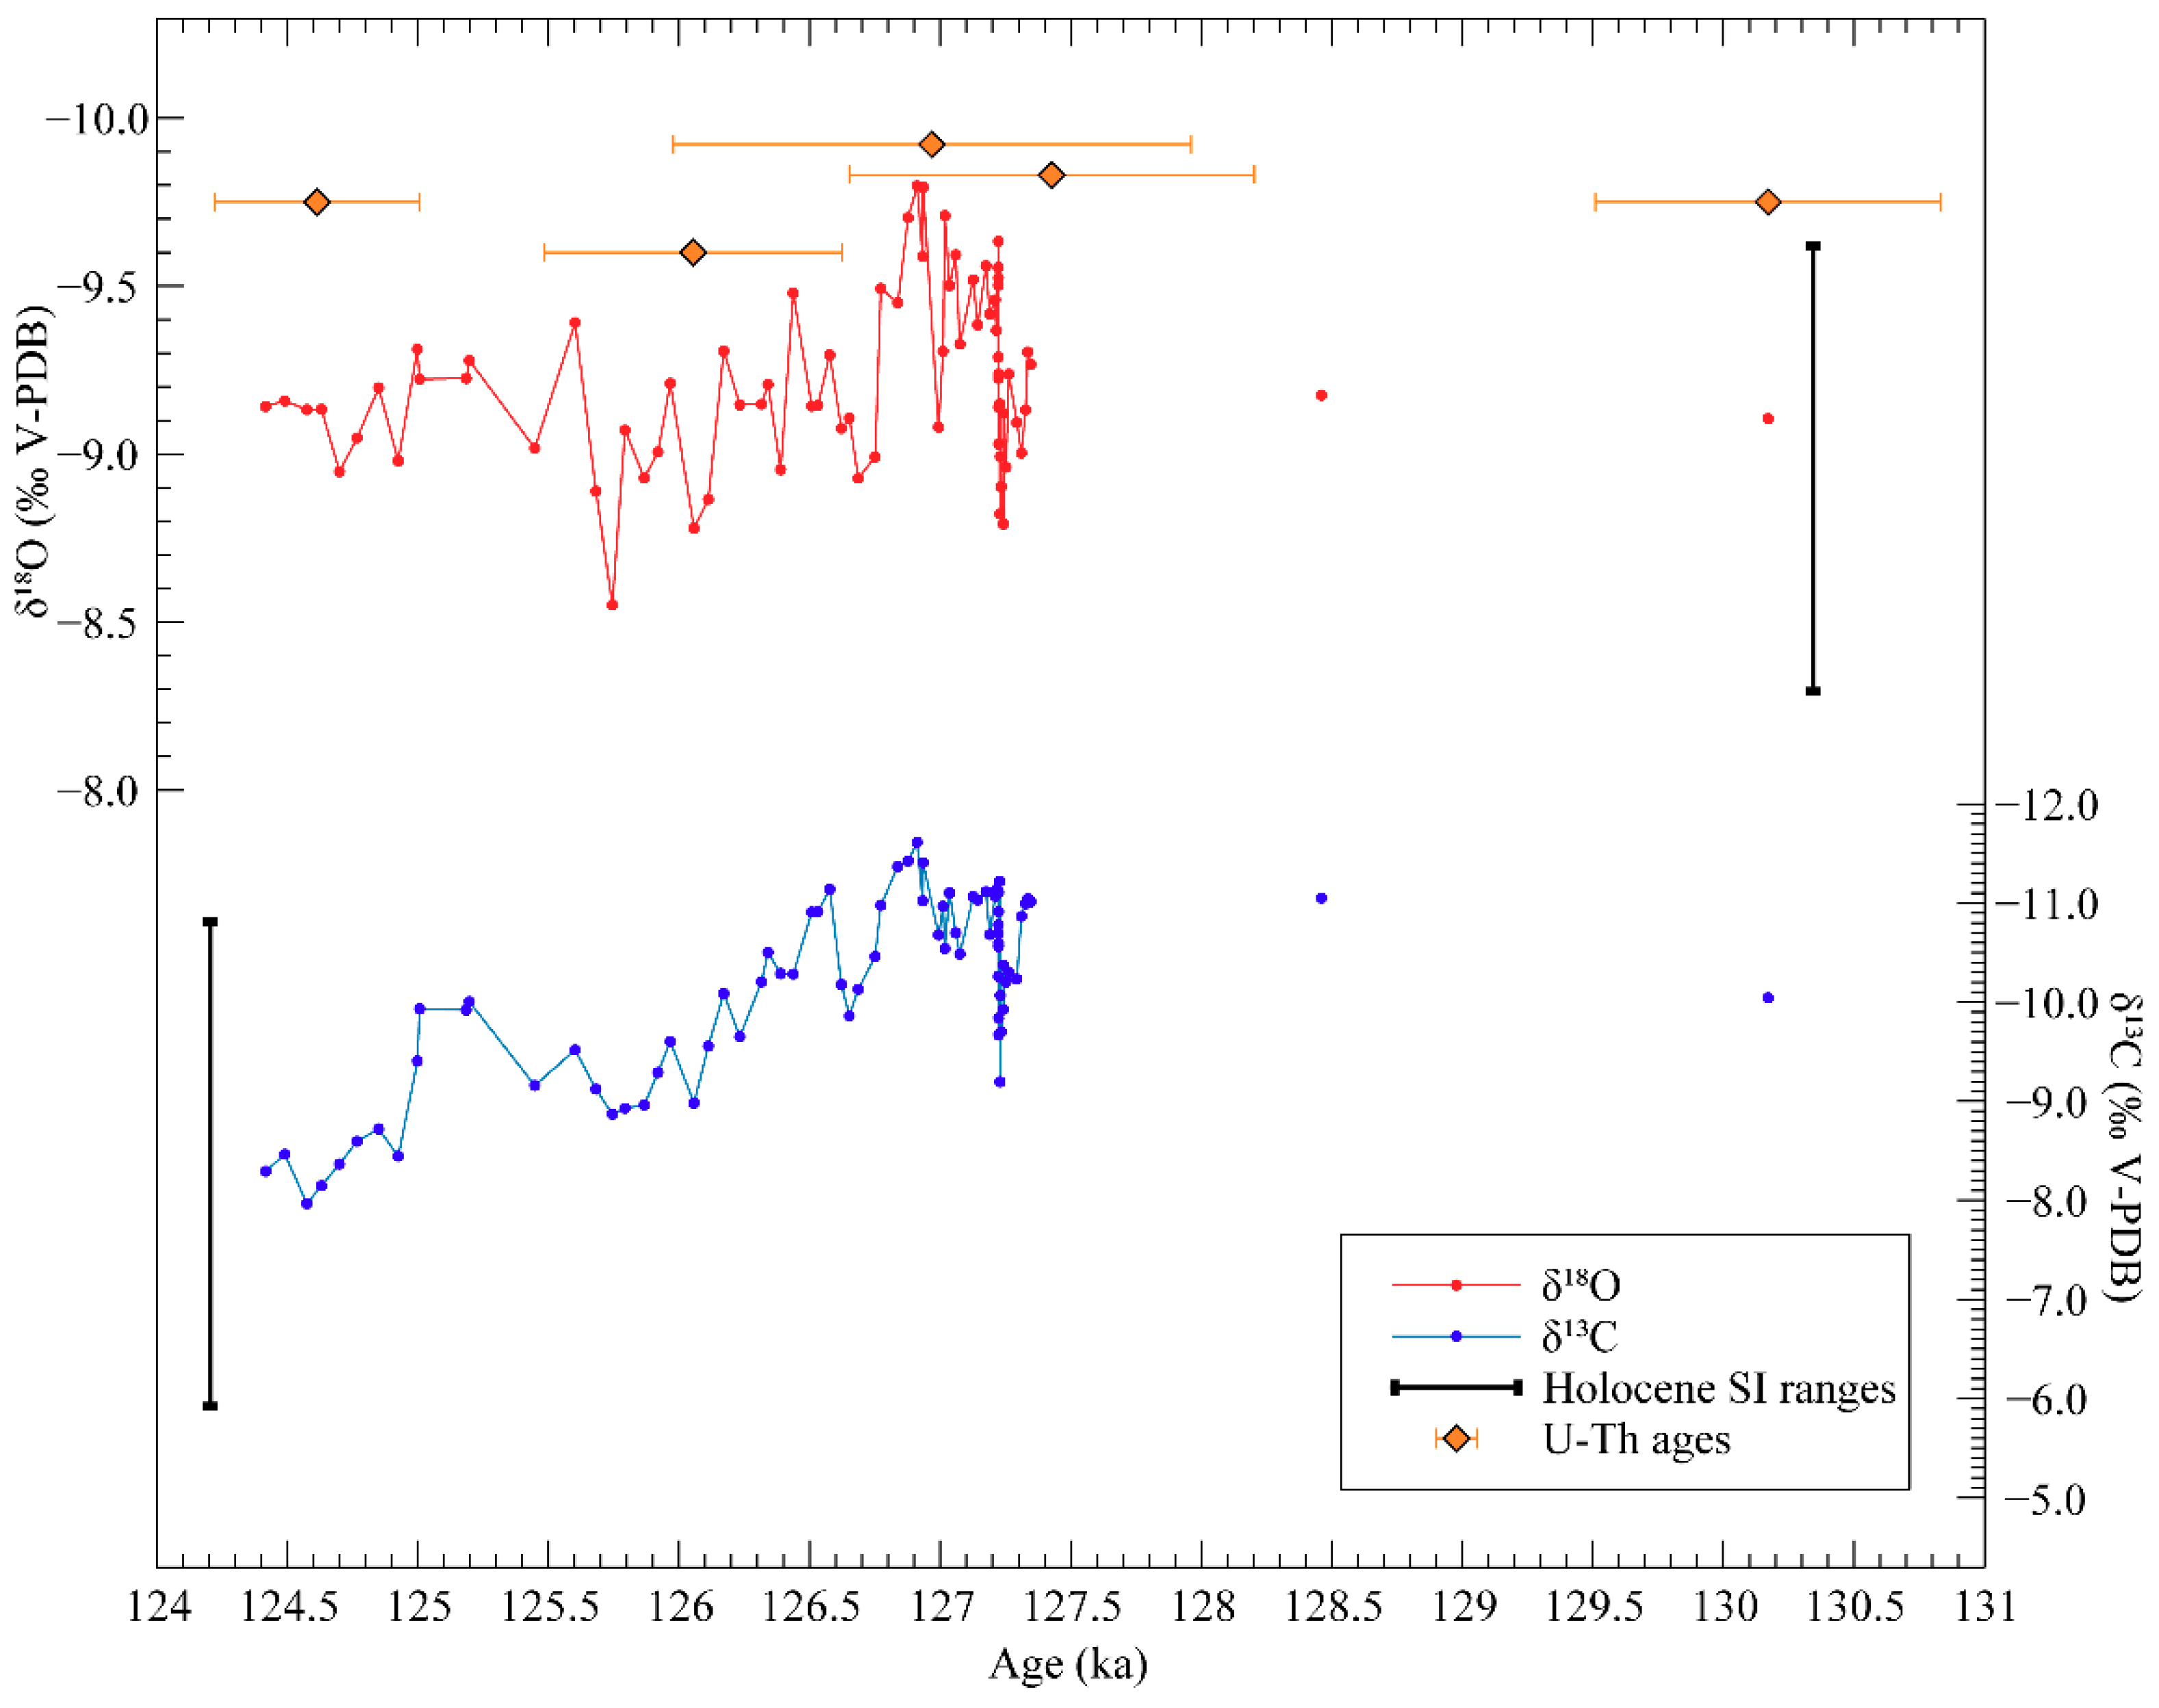
4.1. Chronology
4.2. The δ13C and δ18O Records
5. Discussion
5.1. Interpretation of Carbon and Oxygen Isotope Compositions
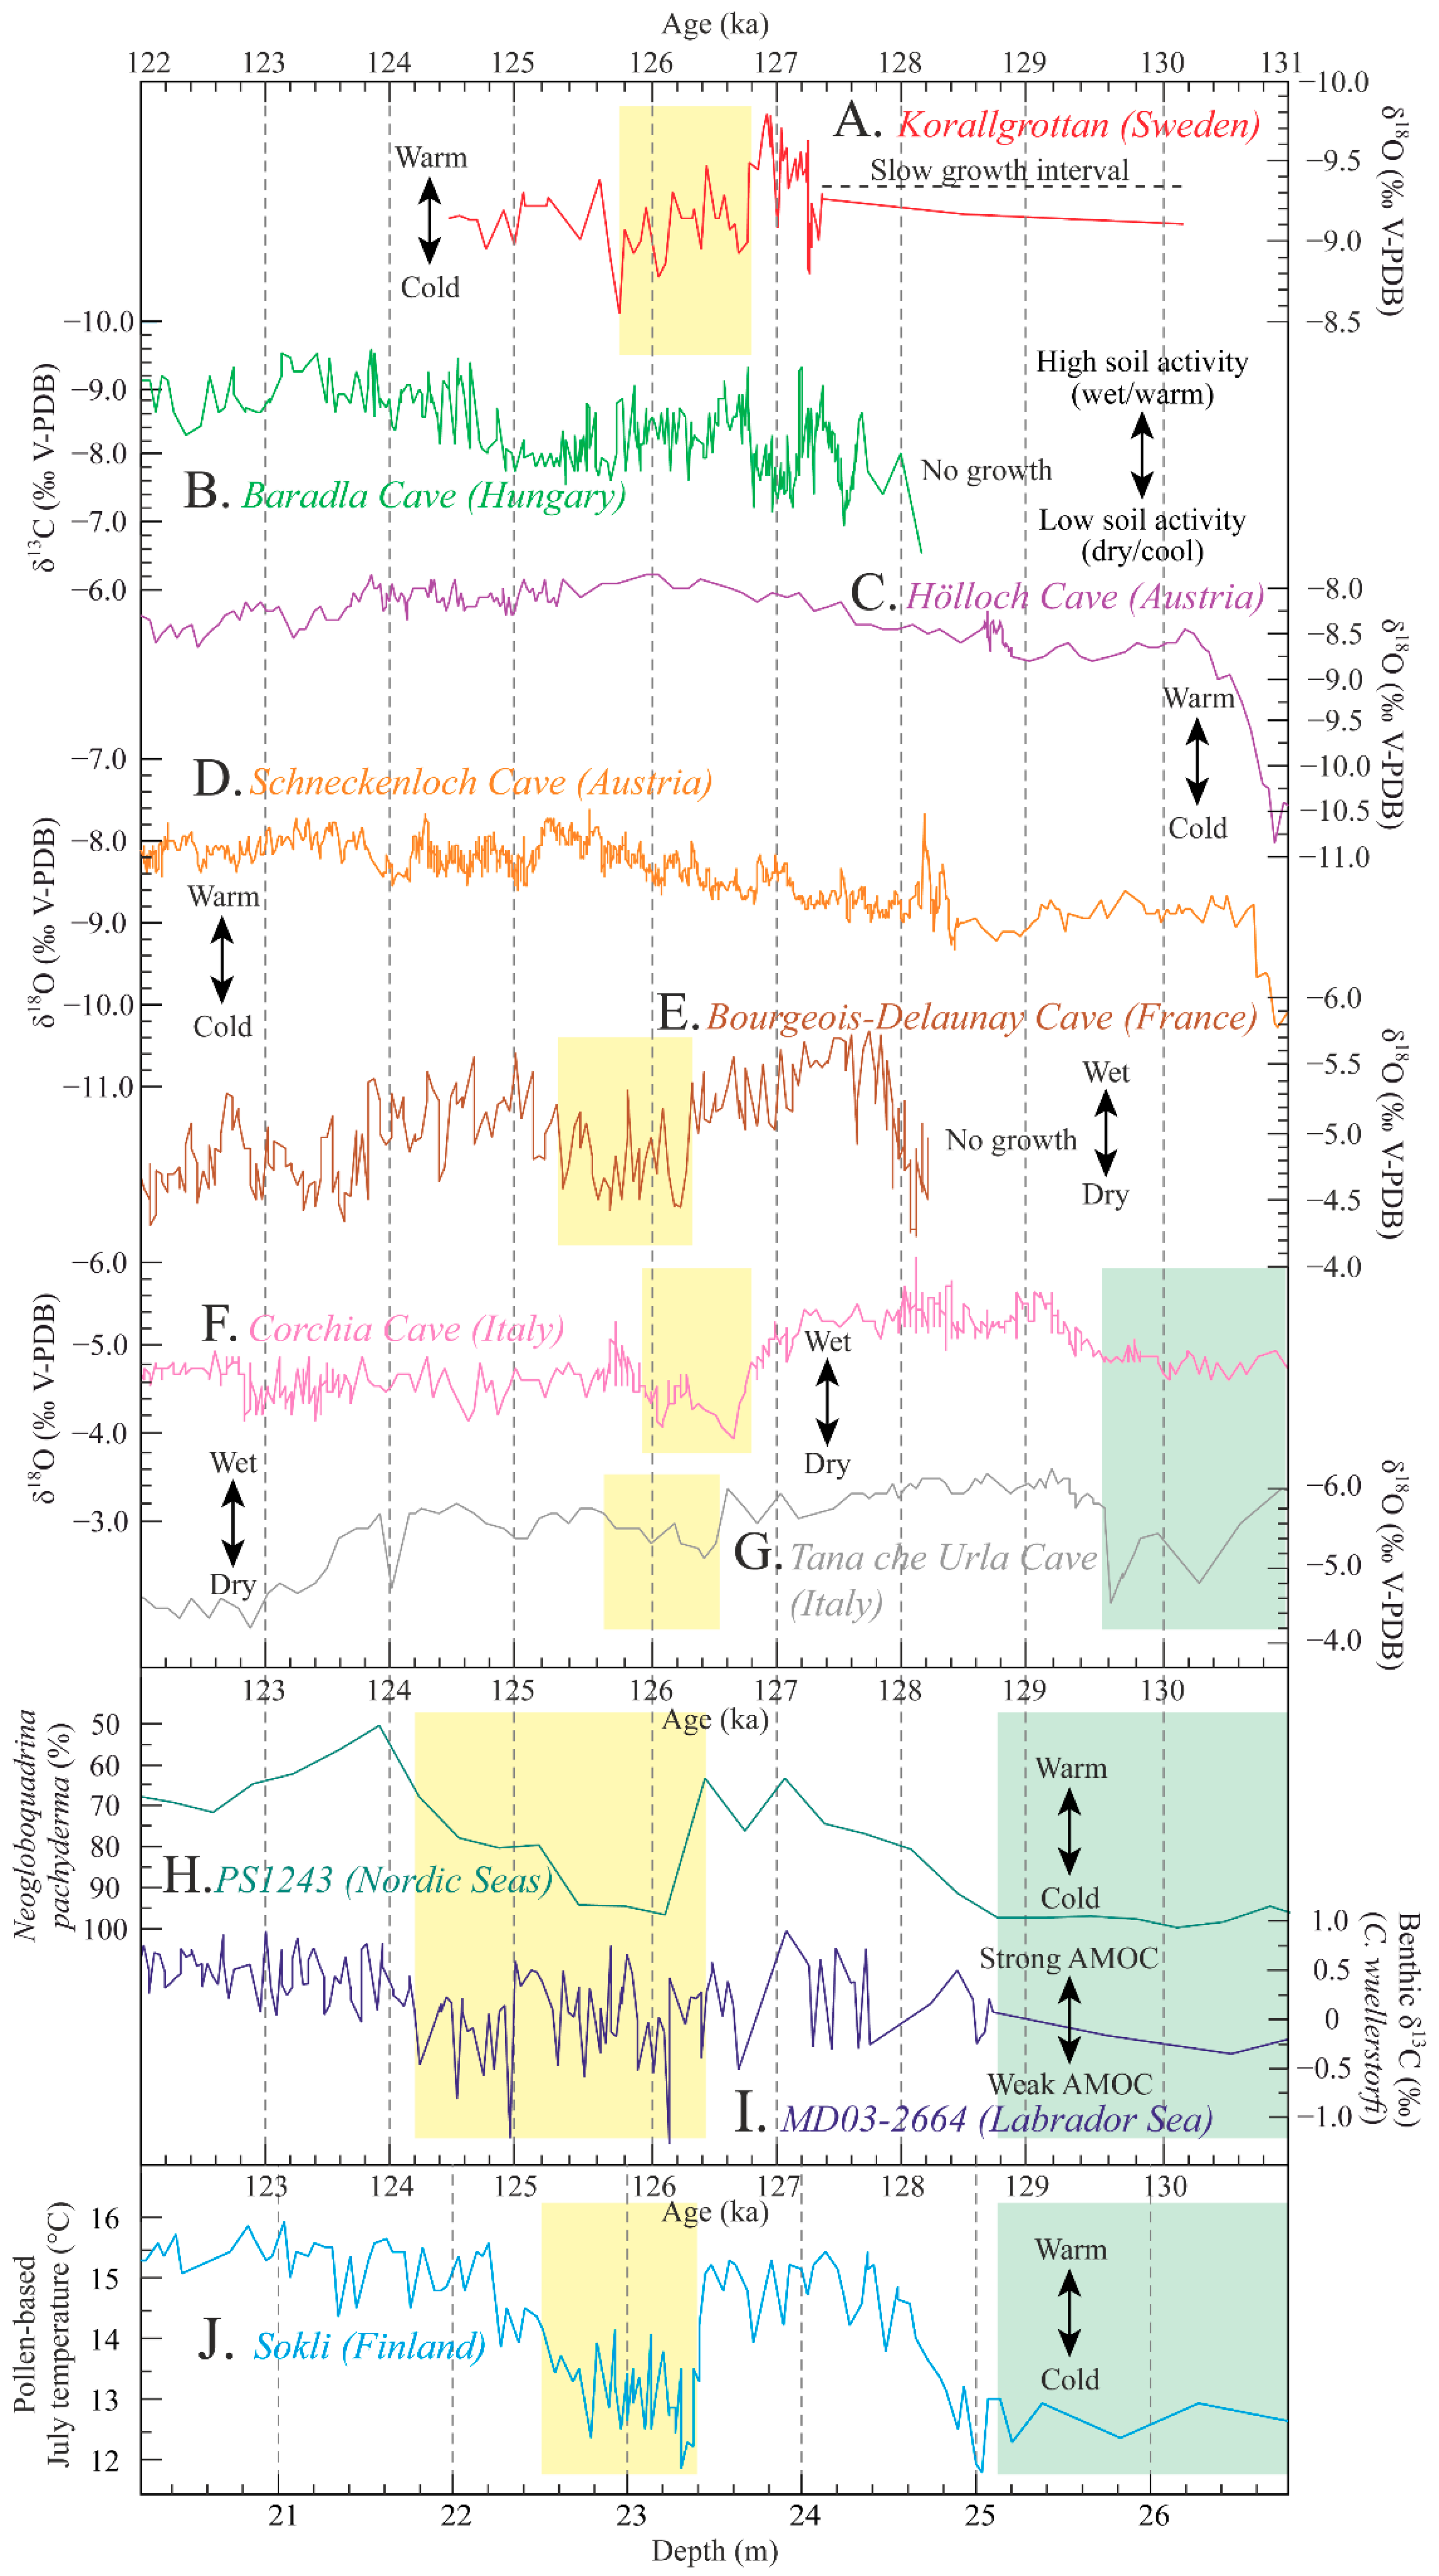
5.2. Climate Interpretation and Comparison with Scandinavian Speleothem Records
5.3. Comparison with Speleothem Records from Other Parts of Europe
5.4. Comparisons with Other Nearby Terrestrial and Marine Climate Archives
6. Conclusions
Supplementary Materials
Author Contributions
Funding
Acknowledgments
Conflicts of Interest
References
- Henderson, G.M.; Slowey, N.C. Evidence from U–Th dating against Northern Hemisphere forcing of the penultimate deglaciation. Nature 2000, 404, 61–66. [Google Scholar] [CrossRef] [PubMed]
- Holzkämper, S.; Spötl, C.; Mangini, A. High-precision constraints on timing of Alpine warm periods during the middle to late Pleistocene using speleothem growth periods. Earth Planet. Sci. Lett. 2005, 236, 751–764. [Google Scholar] [CrossRef]
- Imbrie, J.; Hays, J.D.; McIntyre, A.; Mix, A.C.; Morley, J.J.; Pisias, N.G.; Prell, W.L.; Shakleton, N.J. The Orbital Theory of Pleistocene Climate: Support from a Revised Chronology of the Marine d18O Record. In Milankovitch and Climate: Understanding the Response to Astronomical Forcing; Berger, A., Imbrie, J., Hays, J., Kukla, G., Saltzman, B., Eds.; D. Reidel Publishing Company: Dordrecht, The Netherlands, 1984; pp. 269–305. [Google Scholar]
- Bauch, H.A.; Kandiano, E.S.; Helmke, J.; Andersen, N.; Rosell-Mele, A.; Erlenkeuser, H. Climatic bisection of the last interglacial warm period in the Polar North Atlantic. Quat. Sci. Rev. 2011, 30, 1813–1818. [Google Scholar] [CrossRef]
- Fronval, T.; Jansen, E. Rapid changes in ocean circulation and heat flux in the Nordic seas during the last interglacial period. Nature 1996, 383, 806–810. [Google Scholar] [CrossRef]
- Sirocko, F.; Seelos, K.; Schaber, K.; Rein, B.; Dreher, F.; Diehl, M.; Lehne, R.; Jäger, K.; Krbetschek, M.; Degering, D. A late Eemian aridity pulse in central Europe during the last glacial inception. Nature 2005, 436, 833–836. [Google Scholar] [CrossRef] [PubMed]
- Bakker, P.; Masson-Delmotte, V.; Martrat, B.; Charbit, S.; Renssen, H.; Gröger, M.; Krebs-Kanzow, U.; Lohmann, G.; Lunt, D.; Pfeiffer, M.; et al. Temperature trends during the Present and Last Interglacial periods – a multi-model-data comparison. Quat. Sci. Rev. 2014, 99, 224–243. [Google Scholar] [CrossRef]
- Members, C.L. Last Interglacial Project Members Last Interglacial Arctic warmth confirms polar amplification of climate change. Quat. Sci. Rev. 2006, 25, 1383–1400. [Google Scholar]
- Capron, E.; Govin, A.; Stone, E.J.; Masson-Delmotte, V.; Mulitza, S.; Otto-Bliesner, B.; Rasmussen, T.L.; Sime, L.C.; Waelbroeck, C.; Wolff, E.W. Temporal and spatial structure of multi-millennial temperature changes at high latitudes during the Last Interglacial. Quat. Sci. Rev. 2014, 103, 116–133. [Google Scholar] [CrossRef]
- Govin, A.; Capron, E.; Tzedakis, P.; Verheyden, S.; Ghaleb, B.; Hillaire-Marcel, C.; St-Onge, G.; Stoner, J.; Bassinot, F.; Bazin, L.; et al. Sequence of events from the onset to the demise of the Last Interglacial: Evaluating strengths and limitations of chronologies used in climatic archives. Quat. Sci. Rev. 2015, 129, 1–36. [Google Scholar] [CrossRef]
- Helmens, K.F. The Last Interglacial–Glacial cycle (MIS 5–2) re-examined based on long proxy records from central and northern Europe. Quat. Sci. Rev. 2014, 86, 115–143. [Google Scholar] [CrossRef]
- Baker, A.; Ito, E.; Smart, P.L.; McEwan, R.F. Elevated and variable values of 13C in speleothems in a British cave system. Chem. Geol. 1997, 136, 263–270. [Google Scholar] [CrossRef]
- McDermott, F.; Mattey, D.P.; Hawkesworth, C. Centennial-scale Holocene climate variability revealed by a high-resolution speleothem delta 18O record from SW Ireland. Science 2001, 294, 1328–1331. [Google Scholar] [CrossRef] [PubMed]
- Sundqvist, H.S.; Holmgren, K.; Lauritzen, S.E. Stable isotope variations in stalagmites from northwestern Sweden document climate and environmental changes during the early Holocene. Holocene 2007, 17, 259–267. [Google Scholar] [CrossRef]
- Jiang, X.; Wang, X.; He, Y.; Hu, H.M.; Li, Z.; Spötl, C.; Shen, C.C. Precisely dated multidecadally resolved Asian summer monsoon dynamics 113.5–86.6 thousand years ago. Quat. Sci. Rev. 2016, 143, 1–12. [Google Scholar] [CrossRef]
- Berstad, I.M.; Lundberg, J.; Lauritzen, S.E.; Linge, H.C. Comparison of the Climate during Marine Isotope Stage 9 and 11 Inferred from a Speleothem Isotope Record from Northern Norway. Quat. Res. 2002, 58, 361–371. [Google Scholar] [CrossRef]
- Lauritzen, S.E. High-Resolution Paleotemperature Proxy Record for the Last Interglaciation Based on Norwegian Speleothems. Quat. Res. 1995, 43, 133–146. [Google Scholar] [CrossRef]
- Linge, H.; Lauritzen, S.E.; Lundberg, J. Stable Isotope Stratigraphy of a Late Last Interglacial Speleothem from Rana, Northern Norway. Quat. Res. 2001, 56, 155–164. [Google Scholar] [CrossRef]
- Helmens, K.F.; Salonen, J.S.; Plikk, A.; Engels, S.; Väliranta, M.; Kylander, M.; Brendryen, J.; Renssen, H. Major cooling intersecting peak Eemian Interglacial warmth in northern Europe. Quat. Sci. Rev. 2015, 122, 293–299. [Google Scholar] [CrossRef]
- Plikk, A.; Helmens, K.F.; Fernández-Fernández, M.; Kylander, M.; Löwemark, L.; Risberg, J.; Salonen, J.S.; Väliranta, M.; Weckström, J. Development of an Eemian (MIS 5e) Interglacial palaeolake at Sokli (N Finland) inferred using multiple proxies. Palaeogeogr. Palaeoclimatol. Palaeoecol. 2016, 463, 11–26. [Google Scholar] [CrossRef]
- Plikk, A.; Engels, S.; Luoto, T.P.; Nazarova, L.; Salonen, J.S.; Helmens, K.F. Chironomid-based temperature reconstruction for the Eemian Interglacial (MIS 5e) at Sokli, northeast Finland. J. Paleolimnol. 2019, 61, 355–371. [Google Scholar] [CrossRef]
- Salonen, J.S.; Helmens, K.F.; Brendryen, J.; Kuosmanen, N.; Väliranta, M.; Goring, S.; Korpela, M.; Kylander, M.; Philip, A.; Plikk, A.; et al. Abrupt high-latitude climate events and decoupled seasonal trends during the Eemian. Nat. Commun. 2018, 9, 2851. [Google Scholar] [CrossRef]
- Isacsson, G. Vad kan man se i Korallgrottan? Grottan 1994, 2, 21–23. [Google Scholar]
- Nilsson, G. Berggrunden Inom Blåsjöområdet i Nordvästra Jämtlandsfjällen; Sveriges Geologiska Undersökning Serie C 595: Stockholm, Sweden, 1964; p. 70. [Google Scholar]
- Zackrisson, E.; Sjöstrand, T. Berggrundskartorna 22D-22E Frostviken, 1:50 000; SGU Ai 41-44: Uppsala, Sweden, 1990. [Google Scholar]
- Alexandersson, H.; Eggertsson Karlström, C. Temperaturen och Nederbörden i Sverige 1961–1990; Referensnormaler—Utgåva 2; Meteorologi 99; Swedish Meteorological and Hydrological Institute: Norrköping, Sweden, 2001; p. 71. [Google Scholar]
- Bauch, H.A.; Kandiano, E.S.; Helmke, J.P. Contrasting ocean changes between the subpolar and polar North Atlantic during the past 135 ka. Geophys. Res. Lett. 2012, 39, L11604. [Google Scholar] [CrossRef]
- Zhuravleva, A.; Bauch, H.A.; Van Nieuwenhove, N. Last Interglacial (MIS5e) hydrographic shifts linked to meltwater discharges from the East Greenland margin. Quat. Sci. Rev. 2017, 164, 95–109. [Google Scholar] [CrossRef]
- Helmens, K. The Last Interglacial-Glacial cycle in NE Fennoscandia: A nearly continuous record from Sokli (Finnish Lapland). Quat. Sci. Rev. 2000, 19, 1605–1623. [Google Scholar] [CrossRef]
- Galaasen, E.V.; Ninnemann, U.S.; Irval, N.; Kleiven, H.F.; Rosenthal, Y.; Kissel, C.; Hodell, D.A.; Irvalı, N. Rapid Reductions in North Atlantic Deep Water During the Peak of the Last Interglacial Period. Science 2014, 343, 1129–1132. [Google Scholar] [CrossRef] [PubMed]
- Demény, A.; Kern, Z.; Czuppon, G.; Németh, A.; Leél-Őssy, S.; Siklósy, Z.; Lin, K.; Hu, H.M.; Shen, C.C.; Vennemann, T.W.; et al. Stable isotope compositions of speleothems from the last interglacial—Spatial patterns of climate fluctuations in Europe. Quat. Sci. Rev. 2017, 161, 68–80. [Google Scholar] [CrossRef]
- Moseley, G.E.; Spötl, C.; Cheng, H.; Boch, R.; Min, A.; Edwards, R.L. Termination-II interstadial/stadial climate change recorded in two stalagmites from the north European Alps. Quat. Sci. Rev. 2015, 127, 229–239. [Google Scholar] [CrossRef]
- Couchoud, I.; Genty, D.; Hoffmann, D.; Drysdale, R.; Blamart, D. Millennial-scale climate variability during the Last Interglacial recorded in a speleothem from south-western France. Quat. Sci. Rev. 2009, 28, 3263–3274. [Google Scholar] [CrossRef]
- Drysdale, R.N.; Zanchetta, G.; Hellstrom, J.C.; Fallick, A.E.; Zhao, J.X. Stalagmite evidence for the onset of the Last Interglacial in southern Europe at 129 ± 1 ka. Geophys. Res. Lett. 2005, 32, L24708. [Google Scholar] [CrossRef]
- Drysdale, R.N.; Hellstrom, J.C.; Zanchetta, G.; Fallick, A.E.; Goni, M.F.S.; Couchoud, I.; McDonald, J.; Maas, R.; Lohmann, G.; Isola, I.; et al. Evidence for Obliquity Forcing of Glacial Termination II. Science 2009, 325, 1527–1531. [Google Scholar] [CrossRef] [PubMed]
- Tzedakis, P.C.; Drysdale, R.N.; Margari, V.; Skinner, L.C.; Menviel, L.; Rhodes, R.H.; Taschetto, A.S.; Hodell, D.A.; Crowhurst, S.J.; Hellstrom, J.C.; et al. Enhanced climate instability in the North Atlantic and southern Europe during the Last Interglacial. Nat. Commun. 2018, 9, 4235. [Google Scholar] [CrossRef] [PubMed]
- Regattieri, E.; Zanchetta, G.; Drysdale, R.N.; Isola, I.; Hellstrom, J.C.; Roncioni, A. A continuous stable isotope record from the penultimate glacial maximum to the Last Interglacial (159–121 ka) from Tana Che Urla Cave (Apuan Alps, central Italy). Quat. Res. 2014, 82, 450–461. [Google Scholar] [CrossRef]
- Arps, J. Towards ε-Precision of U-series Age Determinations of Secondary Carbonates. Ph.D. Thesis, Heidelberg University Library, Heidelberg, Germany, 2017. [Google Scholar]
- Douville, E.; Sallé, E.; Frank, N.; Eisele, M.; Pons-Branchu, E.; Ayrault, S. Rapid and accurate U–Th dating of ancient carbonates using inductively coupled plasma-quadrupole mass spectrometry. Chem. Geol. 2010, 272, 1–11. [Google Scholar] [CrossRef]
- Frank, N.; Braum, M.; Hambach, U.; Mangini, A.; Wagner, G. Warm Period Growth of Travertine during the Last Interglaciation in Southern Germany. Quat. Res. 2000, 54, 38–48. [Google Scholar] [CrossRef]
- Matos, L.; Mienis, F.; Wienberg, C.; Frank, N.; Kwiatkowski, C.; Groeneveld, J.; Thil, F.; Abrantes, F.; Cunha, M.R.; Hebbeln, D. Interglacial occurrence of cold-water corals off Cape Lookout (NW Atlantic): First evidence of the Gulf Stream influence. Deep. Sea Res. Part I Oceanogr. Res. Pap. 2015, 105, 158–170. [Google Scholar] [CrossRef]
- Wefing, A.M.; Arps, J.; Blaser, P.; Wienberg, C.; Hebbeln, D.; Frank, N. High precision U-series dating of scleractinian cold-water corals using an automated chromatographic U and Th extraction. Chem. Geol. 2017, 475, 140–148. [Google Scholar] [CrossRef]
- Hoffmann, D.L.; Prytulak, J.; Richards, D.A.; Elliott, T.; Coath, C.D.; Smart, P.L.; Scholz, D. Procedures for accurate U and Th isotope measurements by high precision MC-ICPMS. Int. J. Mass Spectrom. 2007, 264, 97–109. [Google Scholar] [CrossRef]
- Cheng, H.; Edwards, R.; Hoff, J.; Gallup, C.; Richards, D.; Asmerom, Y. The half-lives of uranium-234 and thorium-230. Chem. Geol. 2000, 169, 17–33. [Google Scholar] [CrossRef]
- Scholz, D.; Hoffmann, D.L. StalAge—An algorithm designed for construction of speleothem age models. Quat. Geochronol. 2011, 6, 369–382. [Google Scholar] [CrossRef]
- Sundqvist, H.S.; Holmgren, K.; Moberg, A.; Mangini, A.; Spöetl, C. Stable isotopes in a stalagmite from NW Sweden document environmental changes over the past 4000 years. Boreas 2010, 39, 77–86. [Google Scholar] [CrossRef]
- Sundqvist, H.S.; Seibert, J.; Holmgren, K. Understanding conditions behind speleothem formation in Korallgrottan, northwestern Sweden. J. Hydrol. 2007, 347, 13–22. [Google Scholar] [CrossRef]
- Hendy, C. The isotopic geochemistry of speleothems—I. The calculation of the effects of different modes of formation on the isotopic composition of speleothems and their applicability as palaeoclimatic indicators. Geochim. Cosmochim. Acta 1971, 35, 801–824. [Google Scholar] [CrossRef]
- Dorale, J.A.; Liu, Z. Limitations of hendy test criteria in judging the paleoclimatic suitability of speleothems and the need for replication. J. Cave Karst Stud. 2009, 71, 73–80. [Google Scholar]
- Lachniet, M.S. Climatic and environmental controls on speleothem oxygen-isotope values. Quat. Sci. Rev. 2009, 28, 412–432. [Google Scholar] [CrossRef]
- McDermott, F. Palaeo-climate reconstruction from stable isotope variations in speleothems: A review. Quat. Sci. Rev. 2004, 23, 901–918. [Google Scholar] [CrossRef]
- Fairchild, I.J.; Smith, C.L.; Baker, A.; Fuller, L.; Spötl, C.; Mattey, D.; McDermott, F. Modification and preservation of environmental signals in speleothems. Earth Sci. Rev. 2006, 75, 105–153. [Google Scholar] [CrossRef]
- Fairchild, I.J.; Baker, A. Speleothem Science: from Process to Past Environments; Wiley: Hoboken, NJ, USA, 2012; ISBN 978-1-4051-9620-8. [Google Scholar]
- Lauritzen, S.E.; Lundberg, J. Calibration of the speleothem delta function: An absolute temperature record for the Holocene in northern Norway. Holocene 1999, 9, 659–669. [Google Scholar] [CrossRef]
- Linge, H.; Baker, A.; Andersson, C.; Lauritzen, S.E. Variability in luminescent lamination and initial 230Th/232Th activity ratios in a late Holocene stalagmite from northern Norway. Quat. Geochronol. 2009, 4, 181–192. [Google Scholar] [CrossRef]
- Kim, S.T.; O’Neil, J.R. Equilibrium and nonequilibrium oxygen isotope effects in synthetic carbonates. Geochim. Cosmochim. Acta 1997, 61, 3461–3475. [Google Scholar] [CrossRef]
- Tremaine, D.M.; Froelich, P.N.; Wang, Y. Speleothem calcite farmed in situ: Modern calibration of δ18O and δ13C paleoclimate proxies in a continuously-monitored natural cave system. Geochim. Cosmochim. Acta 2011, 75, 4929–4950. [Google Scholar] [CrossRef]
- Mattey, D.; Atkinson, T.; Barker, J.; Fisher, R.; Latin, J.P.; Durrell, R.; Ainsworth, M. Carbon dioxide, ground air and carbon cycling in Gibraltar karst. Geochim. Cosmochim. Acta 2016, 184, 88–113. [Google Scholar] [CrossRef]
- Atkinson, T.C. Growth Mechanisms of Speleothems in Castleguard Cave, Columbia Icefields, Alberta, Canada. Arct. Alp. Res. 1983, 15, 523–526. [Google Scholar] [CrossRef]
- Spötl, C.; Mangini, A.; Richards, D.A. Chronology and paleoenvironment of Marine Isotope Stage 3 from two high-elevation speleothems, Austrian Alps. Quat. Sci. Rev. 2006, 25, 1127–1136. [Google Scholar] [CrossRef]
- Svendsen, J.I.; Alexanderson, H.; Astakhov, V.I.; Demidov, I.; Dowdeswell, J.A.; Funder, S.; Gataullin, V.; Henriksen, M.; Hjort, C.; Houmark-Nielsen, M.; et al. Late Quaternary ice sheet history of northern Eurasia. Quat. Sci. Rev. 2004, 23, 1229–1271. [Google Scholar] [CrossRef]
- Badertscher, S.; Fleitmann, D.; Cheng, H.; Edwards, R.L.; Göktürk, O.M.; Zumbühl, A.; Leuenberger, M.C.; Tüysüz, O. Pleistocene water intrusions from the Mediterranean and Caspian seas into the Black Sea. Nat. Geosci. 2011, 4, 236–239. [Google Scholar] [CrossRef]
- Bar-Matthews, M.; Ayalon, A.; Gilmour, M.; Matthews, A.; Hawkesworth, C.J. Sea–land oxygen isotopic relationships from planktonic foraminifera and speleothems in the Eastern Mediterranean region and their implication for paleorainfall during interglacial intervals. Geochim. Cosmochim. Acta 2003, 67, 3181–3199. [Google Scholar] [CrossRef]
- Boch, R.; Cheng, H.; Spötl, C.; Edwards, R.L.; Wang, X.; Häuselmann, P. NALPS: A precisely dated European climate record 120–60 ka. Clim. Past 2011, 7, 1247–1259. [Google Scholar] [CrossRef]
- Holzkämper, S.; Mangini, A.; Spötl, C.; Mudelsee, M. Timing and progression of the Last Interglacial derived from a high alpine stalagmite. Geophys. Res. Lett. 2004, 31, L07201. [Google Scholar] [CrossRef]
- Meyer, M.C.; Spötl, C.; Mangini, A. The demise of the Last Interglacial recorded in isotopically dated speleothems from the Alps. Quat. Sci. Rev. 2008, 27, 476–496. [Google Scholar] [CrossRef]
- Muñoz García, M.B.; Rossi, C.; Ford, D.C.; Schwarcz, H.P.; Martín Chivelet, J. Chronology of Termination II and the Last Interglacial Period in North Spain based on stable isotope records of stalagmites from Cueva del Cobre (Palencia). J. Iber. Geol. 2007, 33, 17. [Google Scholar]
- Nehme, C.; Verheyden, S.; Noble, S.; Farrant, A.R.; Sahy, D.; Hellström, J.; Delannoy, J.J.; Claeys, P. Reconstruction of MIS 5 climate in the central Levant using a stalagmite from Kanaan Cave, Lebanon. Clim. Past 2015, 11, 1785–1799. [Google Scholar] [CrossRef]
- Stoll, H.M.; Moreno, A.; Mendez-Vicente, A.; Gonzalez-Lemos, S.; Jimenez-Sanchez, M.; Dominguez-Cuesta, M.J.; Edwards, R.L.; Cheng, H.; Wang, X. Paleoclimate and growth rates of speleothems in the northwestern Iberian Peninsula over the last two glacial cycles. Quat. Res. 2013, 80, 284–290. [Google Scholar] [CrossRef]
- Vansteenberge, S.; Verheyden, S.; Cheng, H.; Edwards, L.R.; Keppens, E.; Claeys, P. Paleoclimate in continental northwestern Europe during the Eemian and Early-Weichselian (125–97 ka): Insights from a Belgian speleothem. Clim. Past Discuss. 2016, 12, 1455–1458. [Google Scholar]
- Wainer, K.; Genty, D.; Blamart, D.; Daëron, M.; Bar-Matthews, M.; Vonhof, H.; Dublyansky, Y.; Pons-Branchu, E.; Thomas, L.; Van Calsteren, P.; et al. Speleothem record of the last 180 ka in Villars cave (SW France): Investigation of a large δ18O shift between MIS6 and MIS5. Quat. Sci. Rev. 2011, 30, 130–146. [Google Scholar] [CrossRef]
- Stroeven, A.P.; Hättestrand, C.; Kleman, J.; Heyman, J.; Fabel, D.; Fredin, O.; Goodfellow, B.W.; Harbor, J.M.; Jansen, J.D.; Olsen, L.; et al. Deglaciation of Fennoscandia. Quat. Sci. Rev. 2016, 147, 91–121. [Google Scholar] [CrossRef]
- Alexanderson, H.; Eskola, K.; Helmens, K. Optical Dating of a Late Quaternary Sediment Sequence from Sokli, Northern Finland. Geochronometria 2008, 32, 51–59. [Google Scholar] [CrossRef]
- Helmens, K.; Johansson, P.; Räsänen, M.; Alexanderson, H.; Eskola, K. Ice-free intervals continuing into Marine Isotope Stage 3 at Sokli in the central area of the Fennoscandian glaciations. Bull. Geol. Soc. Finl. 2007, 79, 17–39. [Google Scholar] [CrossRef]
- Mokeddem, Z.; McManus, J.F.; Oppo, D.W. Oceanographic dynamics and the end of the last interglacial in the subpolar North Atlantic. Proc. Natl. Acad. Sci. USA 2014, 111, 11263–11268. [Google Scholar] [CrossRef]


| IUP LAB ID_year | Mass Spec | Dft (mm) | Age * (ka) | Age ** (ka) | 238U (ng/g) | 232Th (ng/g) | 230Th/238U AR | 230Th/232Th AR | δ234U (‰) | δ234Uinitial (‰) |
|---|---|---|---|---|---|---|---|---|---|---|
| 5550_2011 | TIMS | 4.0 | 122.2 ± 1.6 | 122.1 ± 1.7 | 746.5 ± 1.5 | 4.428 ± 0.022 | 1.0035 ± 0.0071 | 517.0 ± 4.4 | 424.3 ± 4.0 | 599.1 ± 5.3 |
| 8846_2017 | MC-ICPMS | 7.0 | 124.72 ± 0.43 | 124.61 ± 0.39 | 806.348 ± 0.034 | 5.0698 ± 0.0076 | 1.0408 ± 0.0017 | 507.3 ± 1.1 | 455.8 ± 1.0 | 648.2 ± 1.6 |
| 8755_2017 | MC-ICPMS | 15.0 | 126.18 ± 0.58 | 126.05 ± 0.57 | 652.44 ± 0.21 | 4.7223 ± 0.0093 | 0.9664 ± 0.0021 | 405.4 ± 1.2 | 353.5 ± 1.4 | 504.8 ± 2.2 |
| 5551_2011 | TIMS | 30.5 | 125.5 ± 1.6 | 125.2 ± 1.6 | 492.46 ± 0.98 | 8.147 ± 0.030 | 0.8560 ± 0.0055 | 440.1 ± 6.8 | 218.7 ± 3.5 | 311.6 ± 4.6 |
| 8754_2017 | MC-ICPMS | 43.9 | 127.77 ± 0.83 | 127.43 ± 0.78 | 791.827 ± 0.035 | 13.664 ± 0.056 | 0.8806 ± 0.0029 | 156.91 ± 0.83 | 238.01 ± 0.95 | 341.2 ± 1.5 |
| 5552_2011 | TIMS | 67.2 | 128.2 ± 1.5 | 127.7 ± 1.4 | 1199.7 ± 1.2 | 27.33 ± 0.11 | 0.9010 ± 0.0054 | 158.1 ± 1.1 | 263.0 ± 2.4 | 377.3 ± 3.3 |
| 8823_2017 | MC-ICPMS | 71.0 | 128.63 ± 0.52 | 126.97 ± 0.99 | 1976.45 ± 0.13 | 155.60 ± 0.28 | 0.8511 ± 0.0018 | 33.067 ± 0.091 | 197.34 ± 0.62 | 282.5 ± 1.2 |
| 8752_2017 | MC-ICPMS | 73.7 | 130.97 ± 0.42 | 130.17 ± 0.66 | 1639.955 ± 0.064 | 63.425 ± 0.087 | 0.8686 ± 0.0015 | 68.31 ± 0.15 | 208.48 ± 0.62 | 301.2 ± 1.1 |
© 2019 by the authors. Licensee MDPI, Basel, Switzerland. This article is an open access article distributed under the terms and conditions of the Creative Commons Attribution (CC BY) license (http://creativecommons.org/licenses/by/4.0/).
Share and Cite
Finné, M.; Salonen, S.; Frank, N.; Helmens, K.F.; Schröder-Ritzrau, A.; Deininger, M.; Holzkämper, S. Last Interglacial Climate in Northern Sweden—Insights from a Speleothem Record. Quaternary 2019, 2, 29. https://doi.org/10.3390/quat2030029
Finné M, Salonen S, Frank N, Helmens KF, Schröder-Ritzrau A, Deininger M, Holzkämper S. Last Interglacial Climate in Northern Sweden—Insights from a Speleothem Record. Quaternary. 2019; 2(3):29. https://doi.org/10.3390/quat2030029
Chicago/Turabian StyleFinné, Martin, Sakari Salonen, Norbert Frank, Karin F. Helmens, Andrea Schröder-Ritzrau, Michael Deininger, and Steffen Holzkämper. 2019. "Last Interglacial Climate in Northern Sweden—Insights from a Speleothem Record" Quaternary 2, no. 3: 29. https://doi.org/10.3390/quat2030029
APA StyleFinné, M., Salonen, S., Frank, N., Helmens, K. F., Schröder-Ritzrau, A., Deininger, M., & Holzkämper, S. (2019). Last Interglacial Climate in Northern Sweden—Insights from a Speleothem Record. Quaternary, 2(3), 29. https://doi.org/10.3390/quat2030029