Dark Proteome Database: Studies on Dark Proteins


Abstract
:1. Introduction
2. Materials and Methods
3. Results
3.1. Dark Proteome Database Status
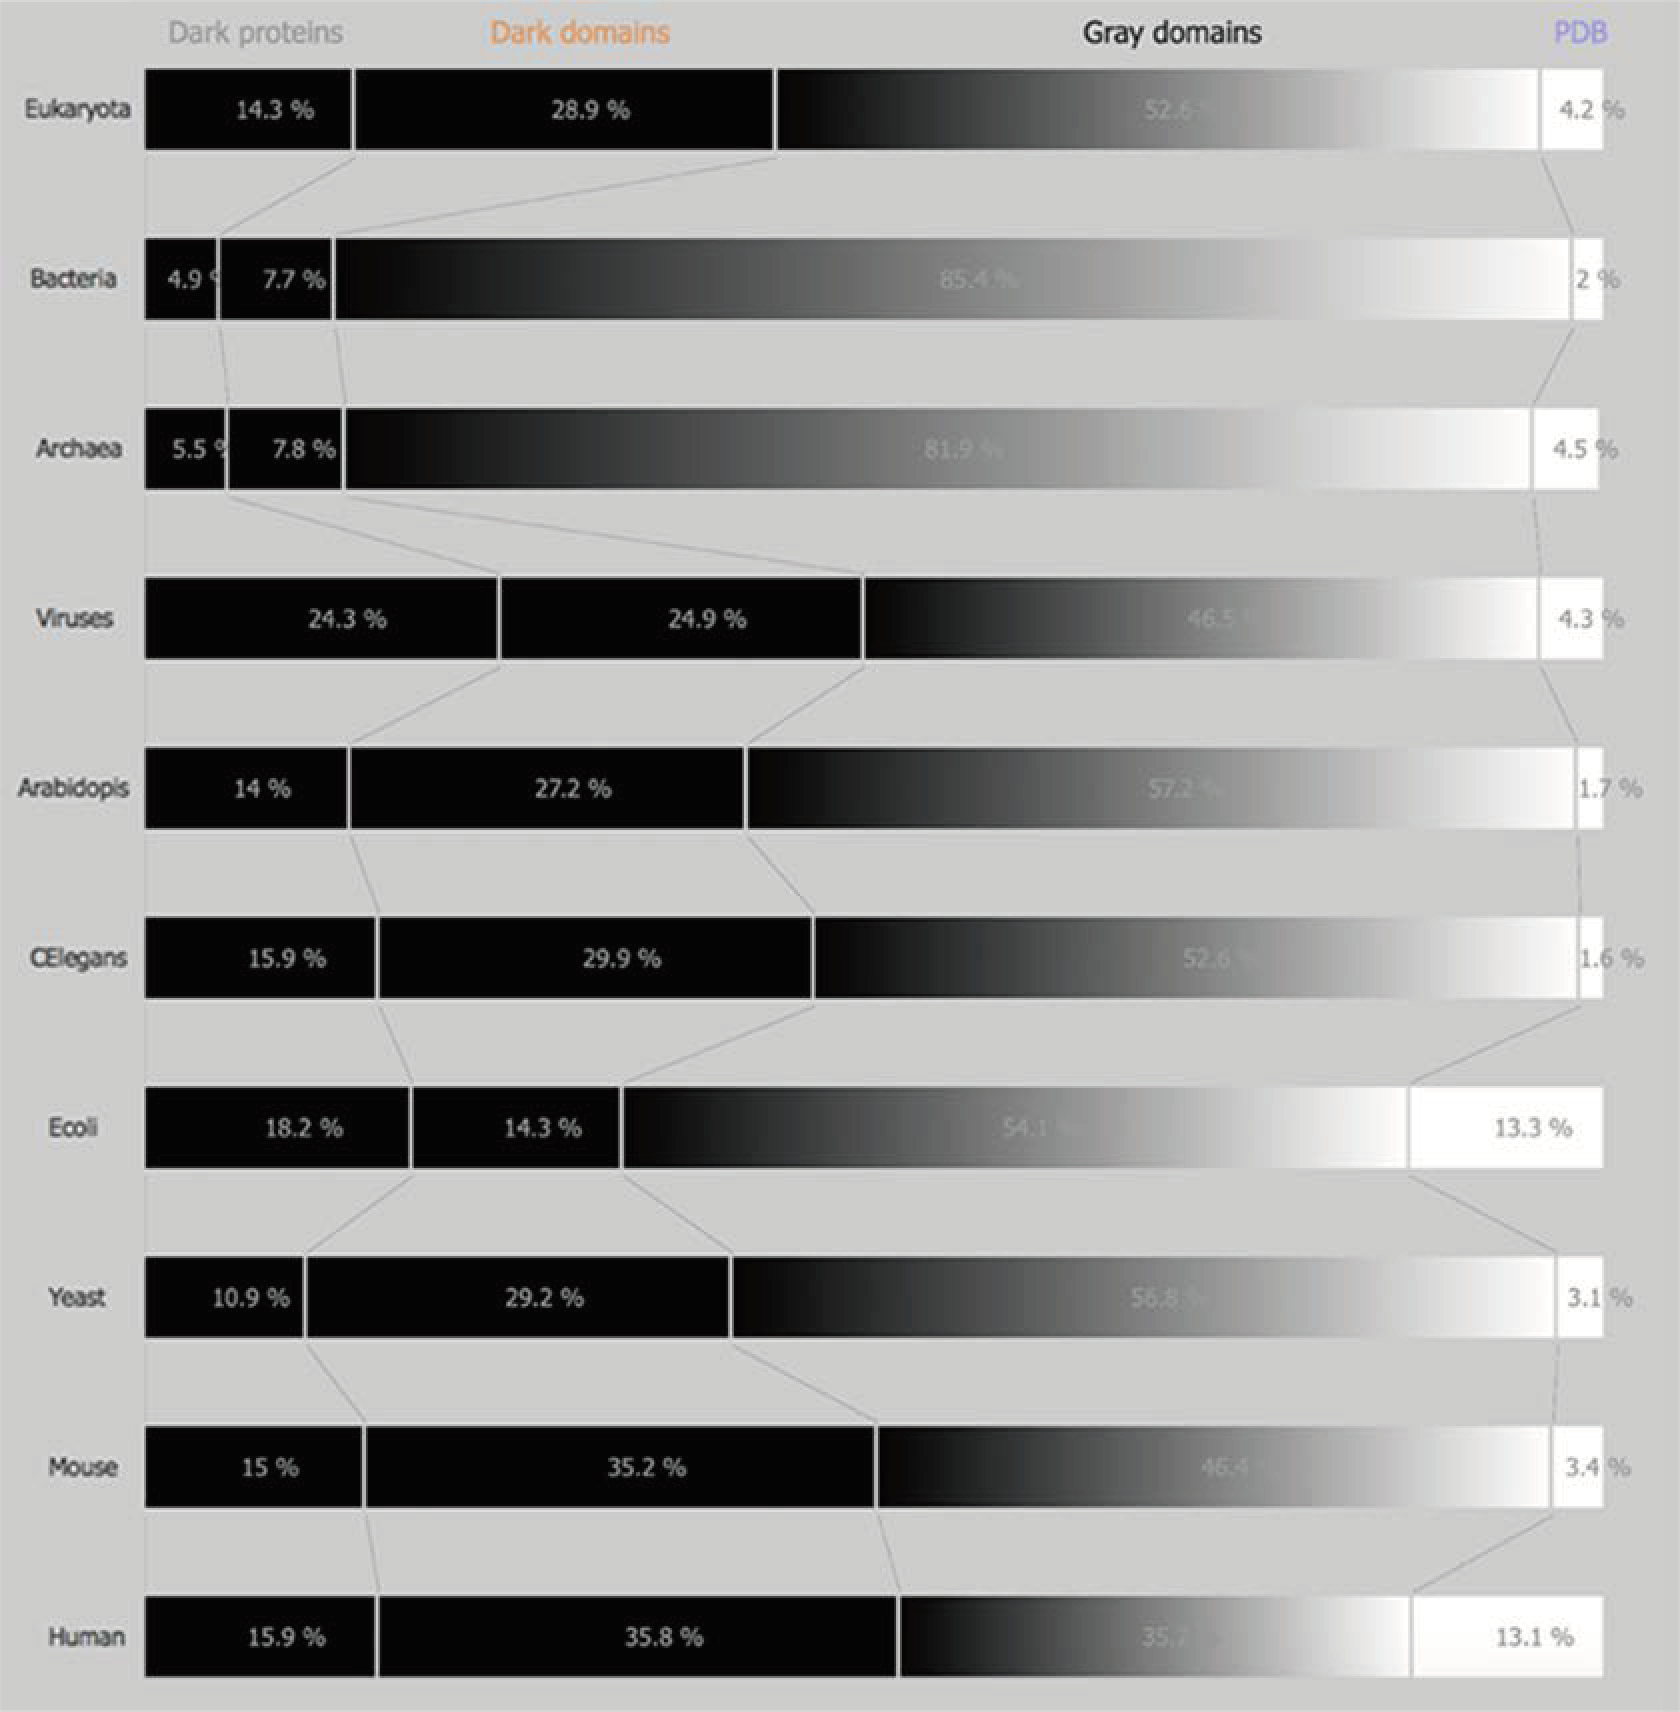
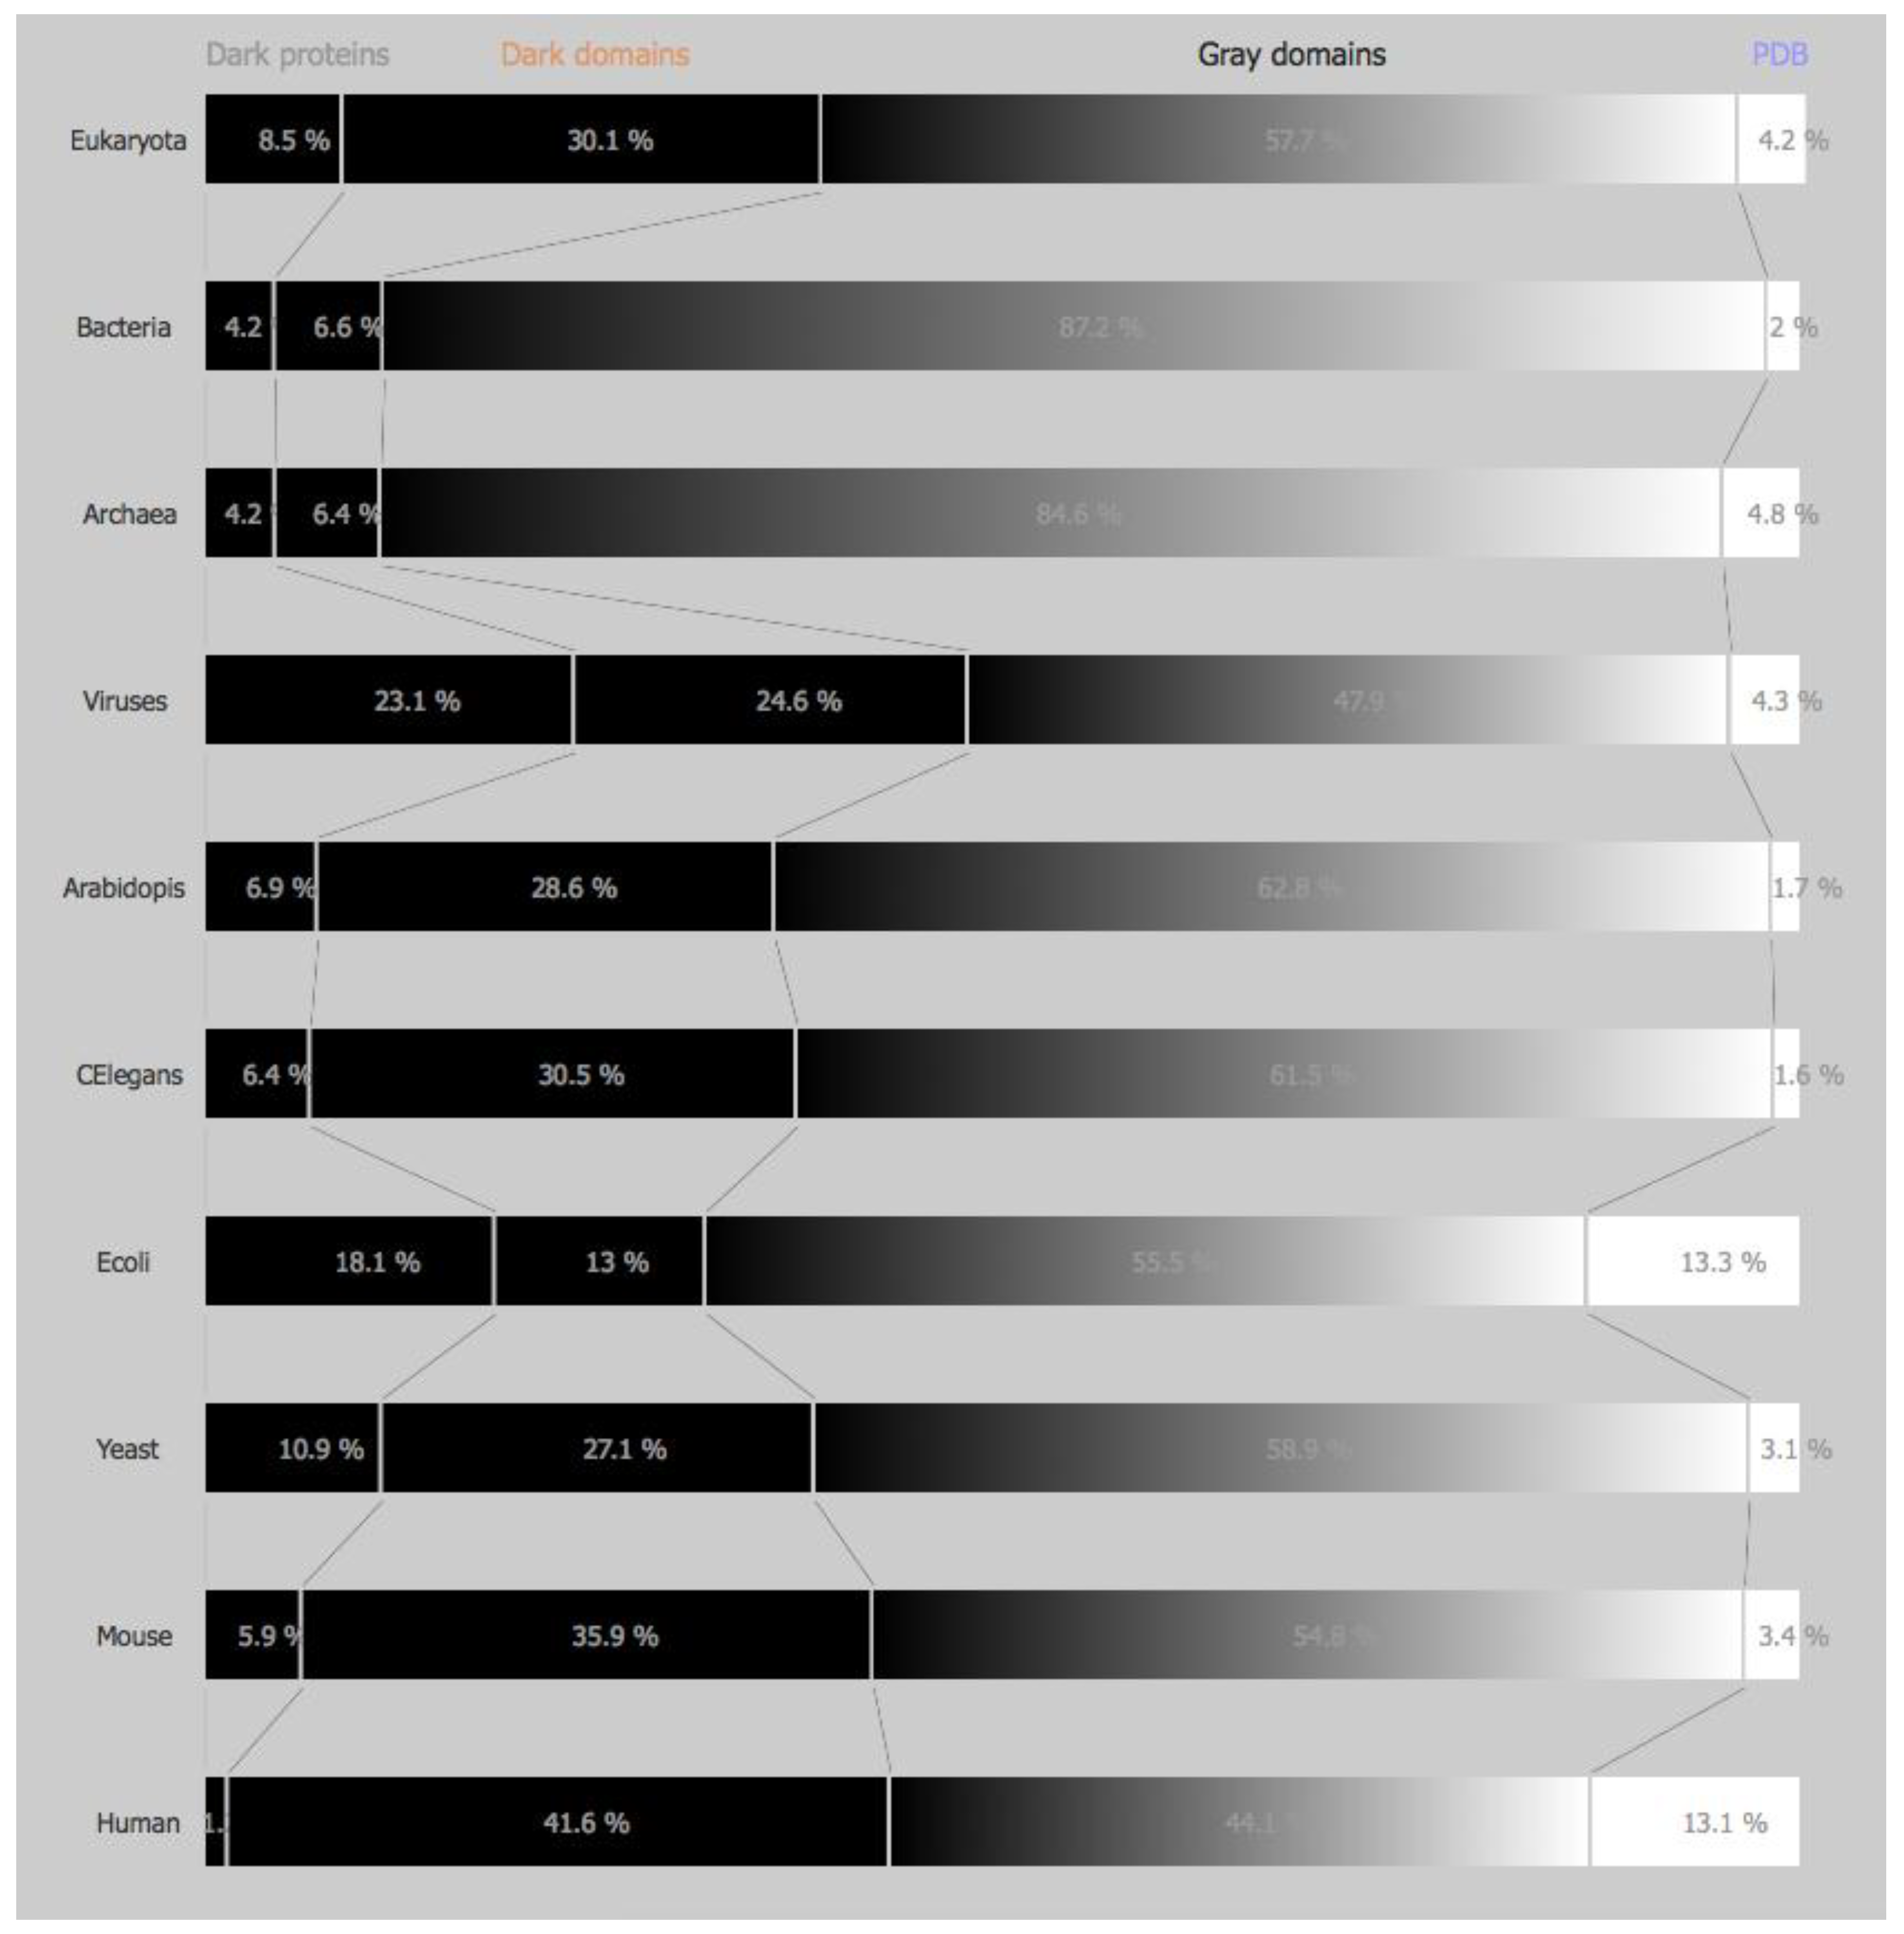
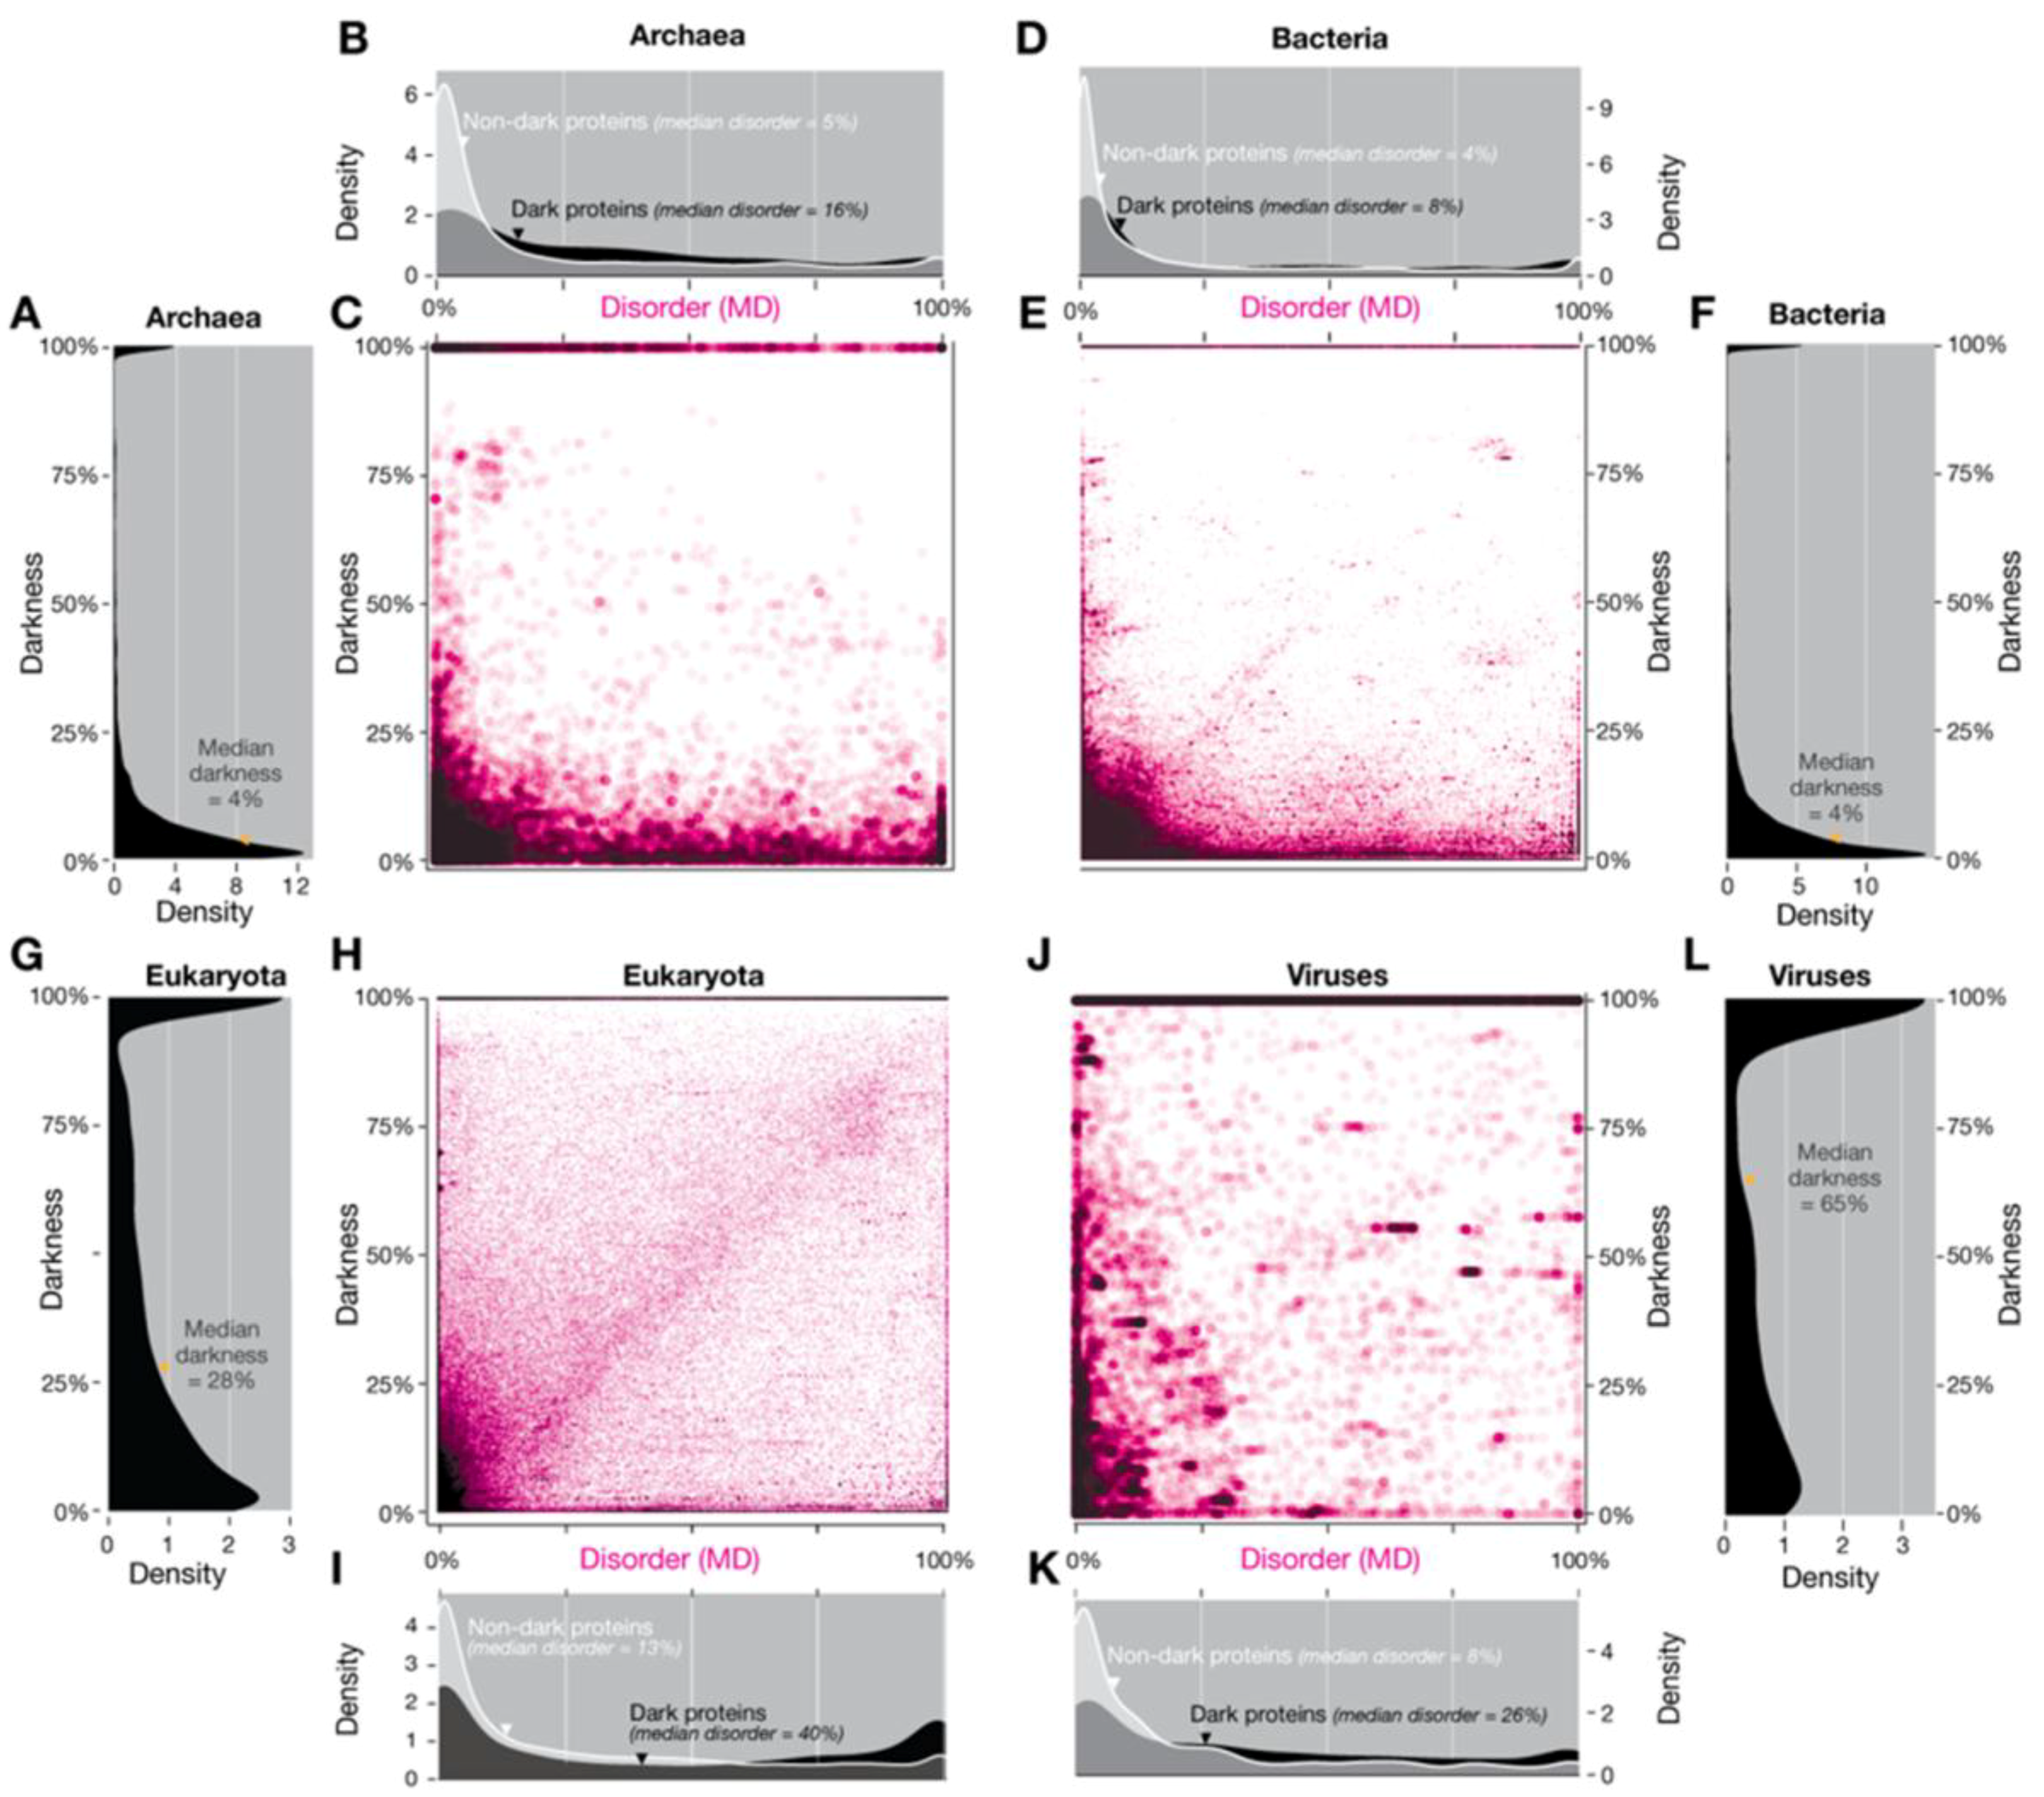
3.1.1. Domains of Life
3.1.2. Model Organisms
3.2. Autonomy
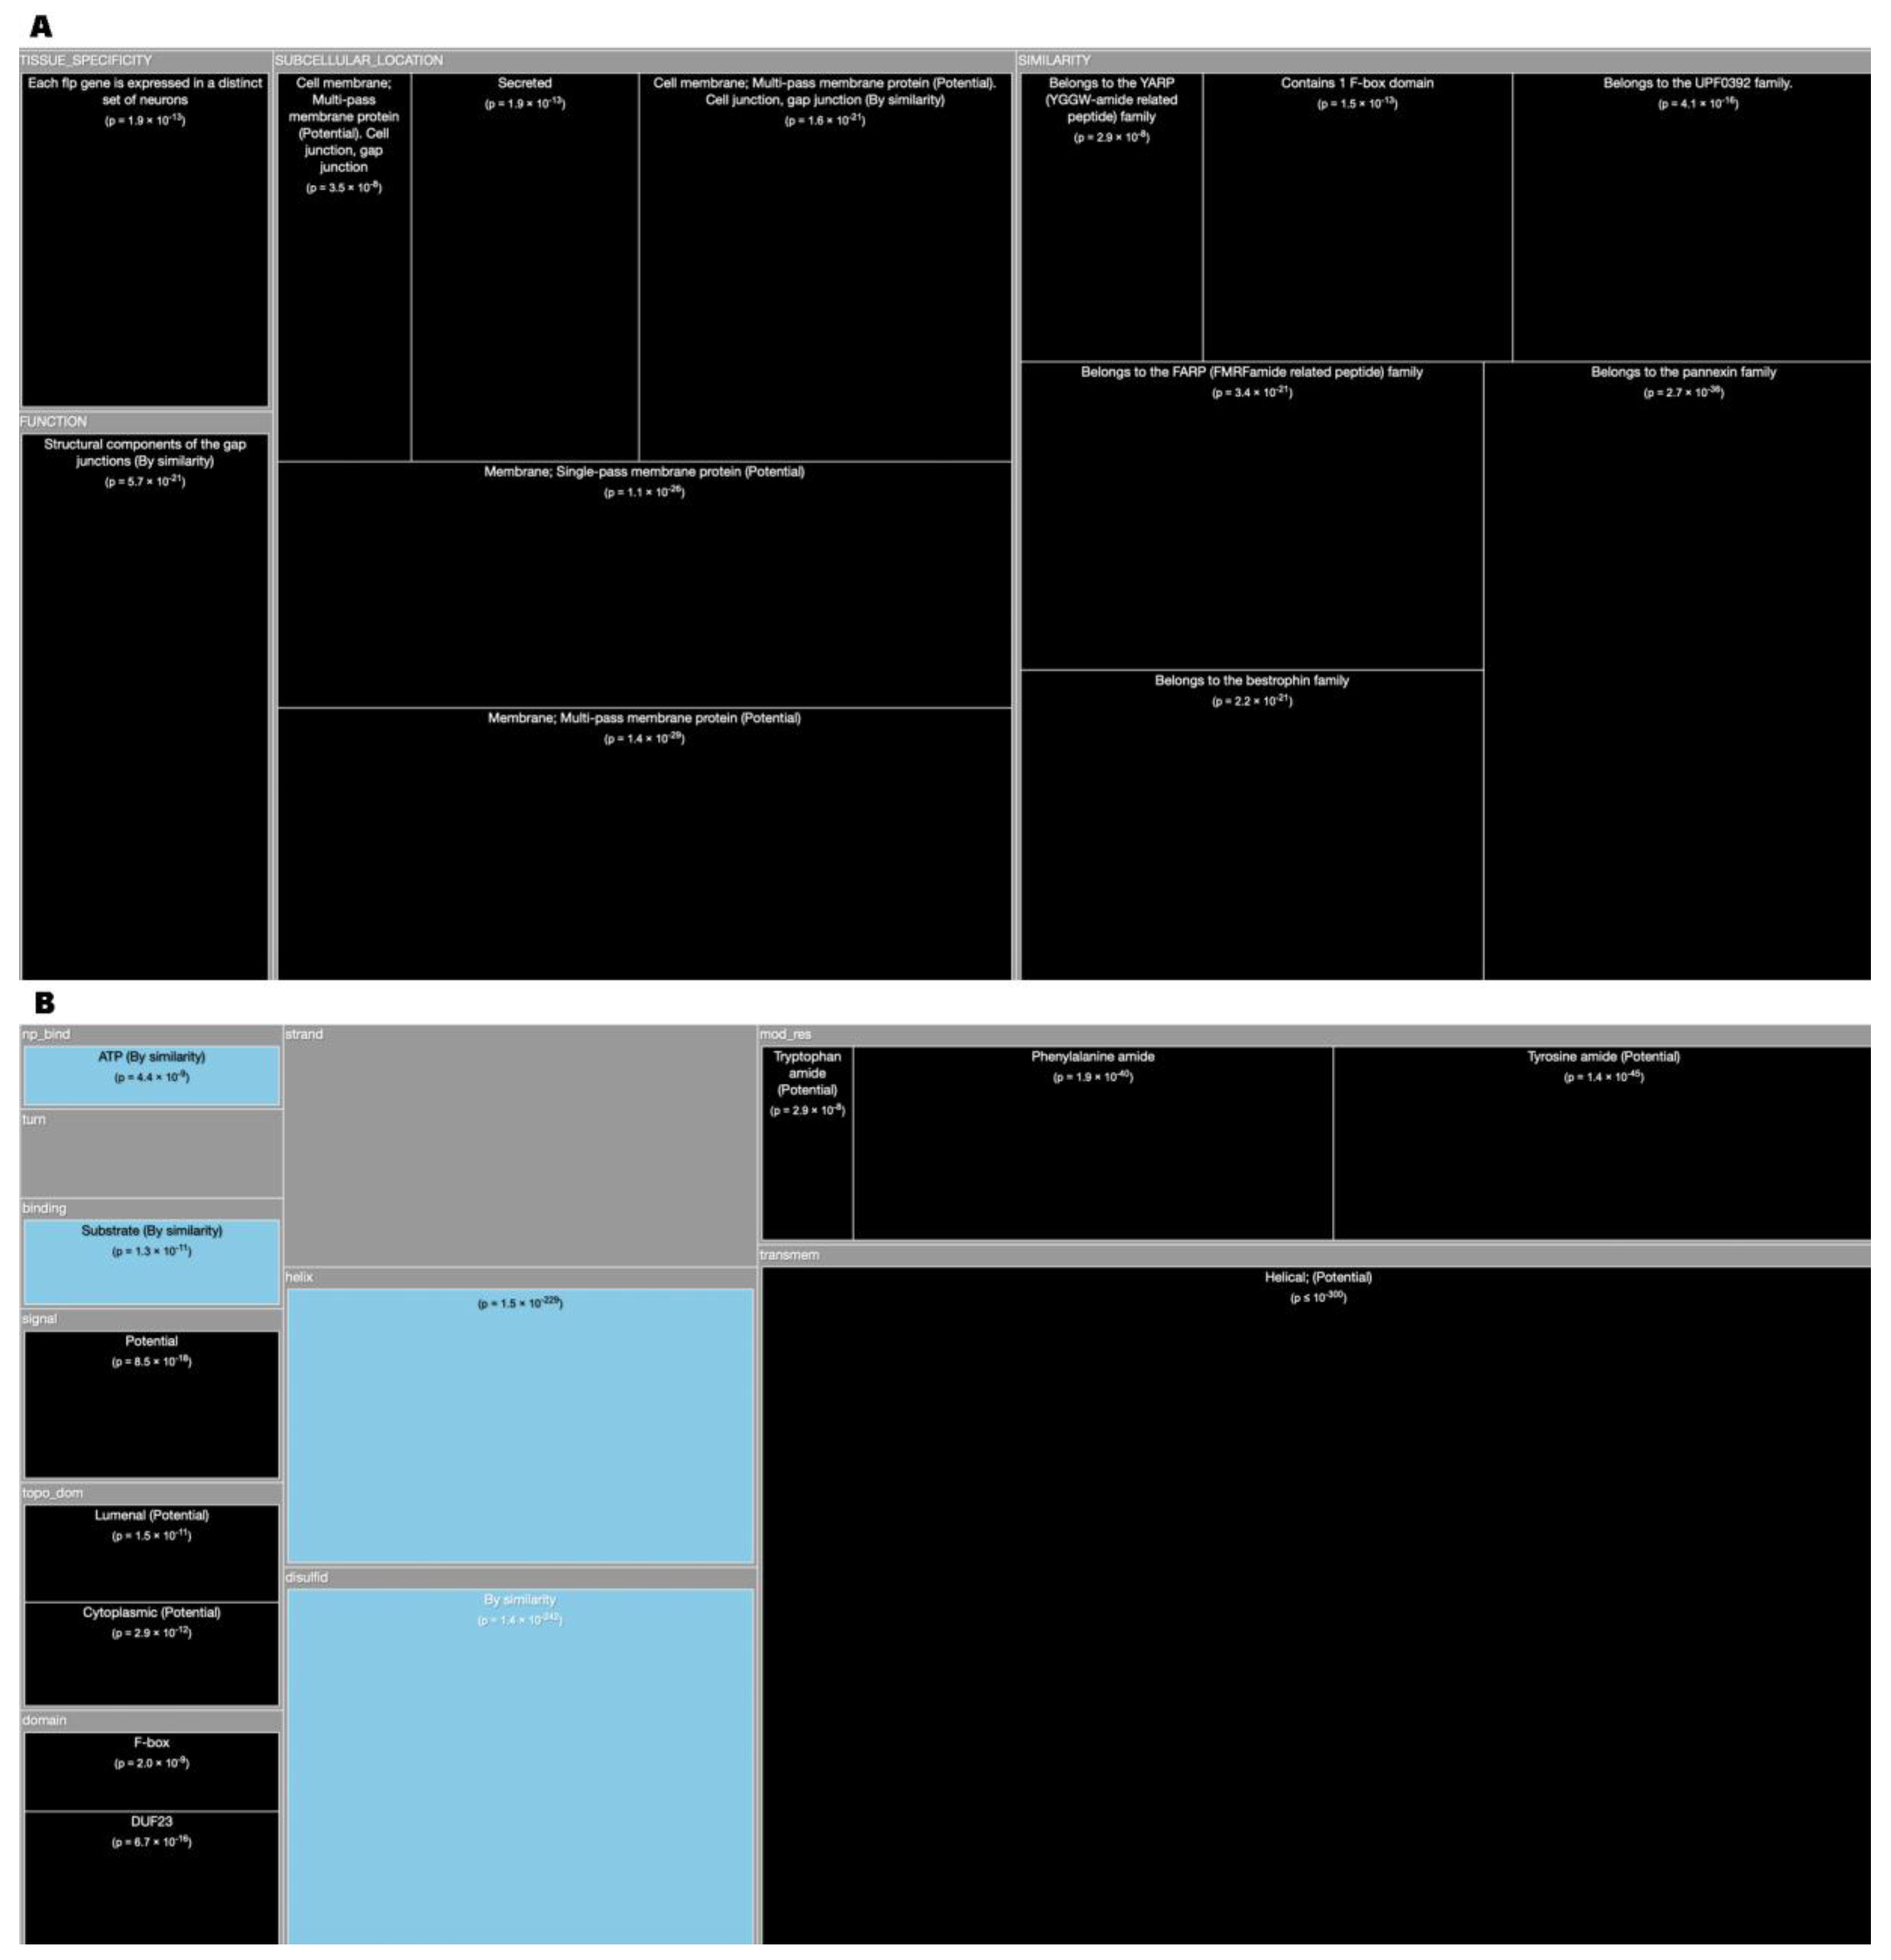
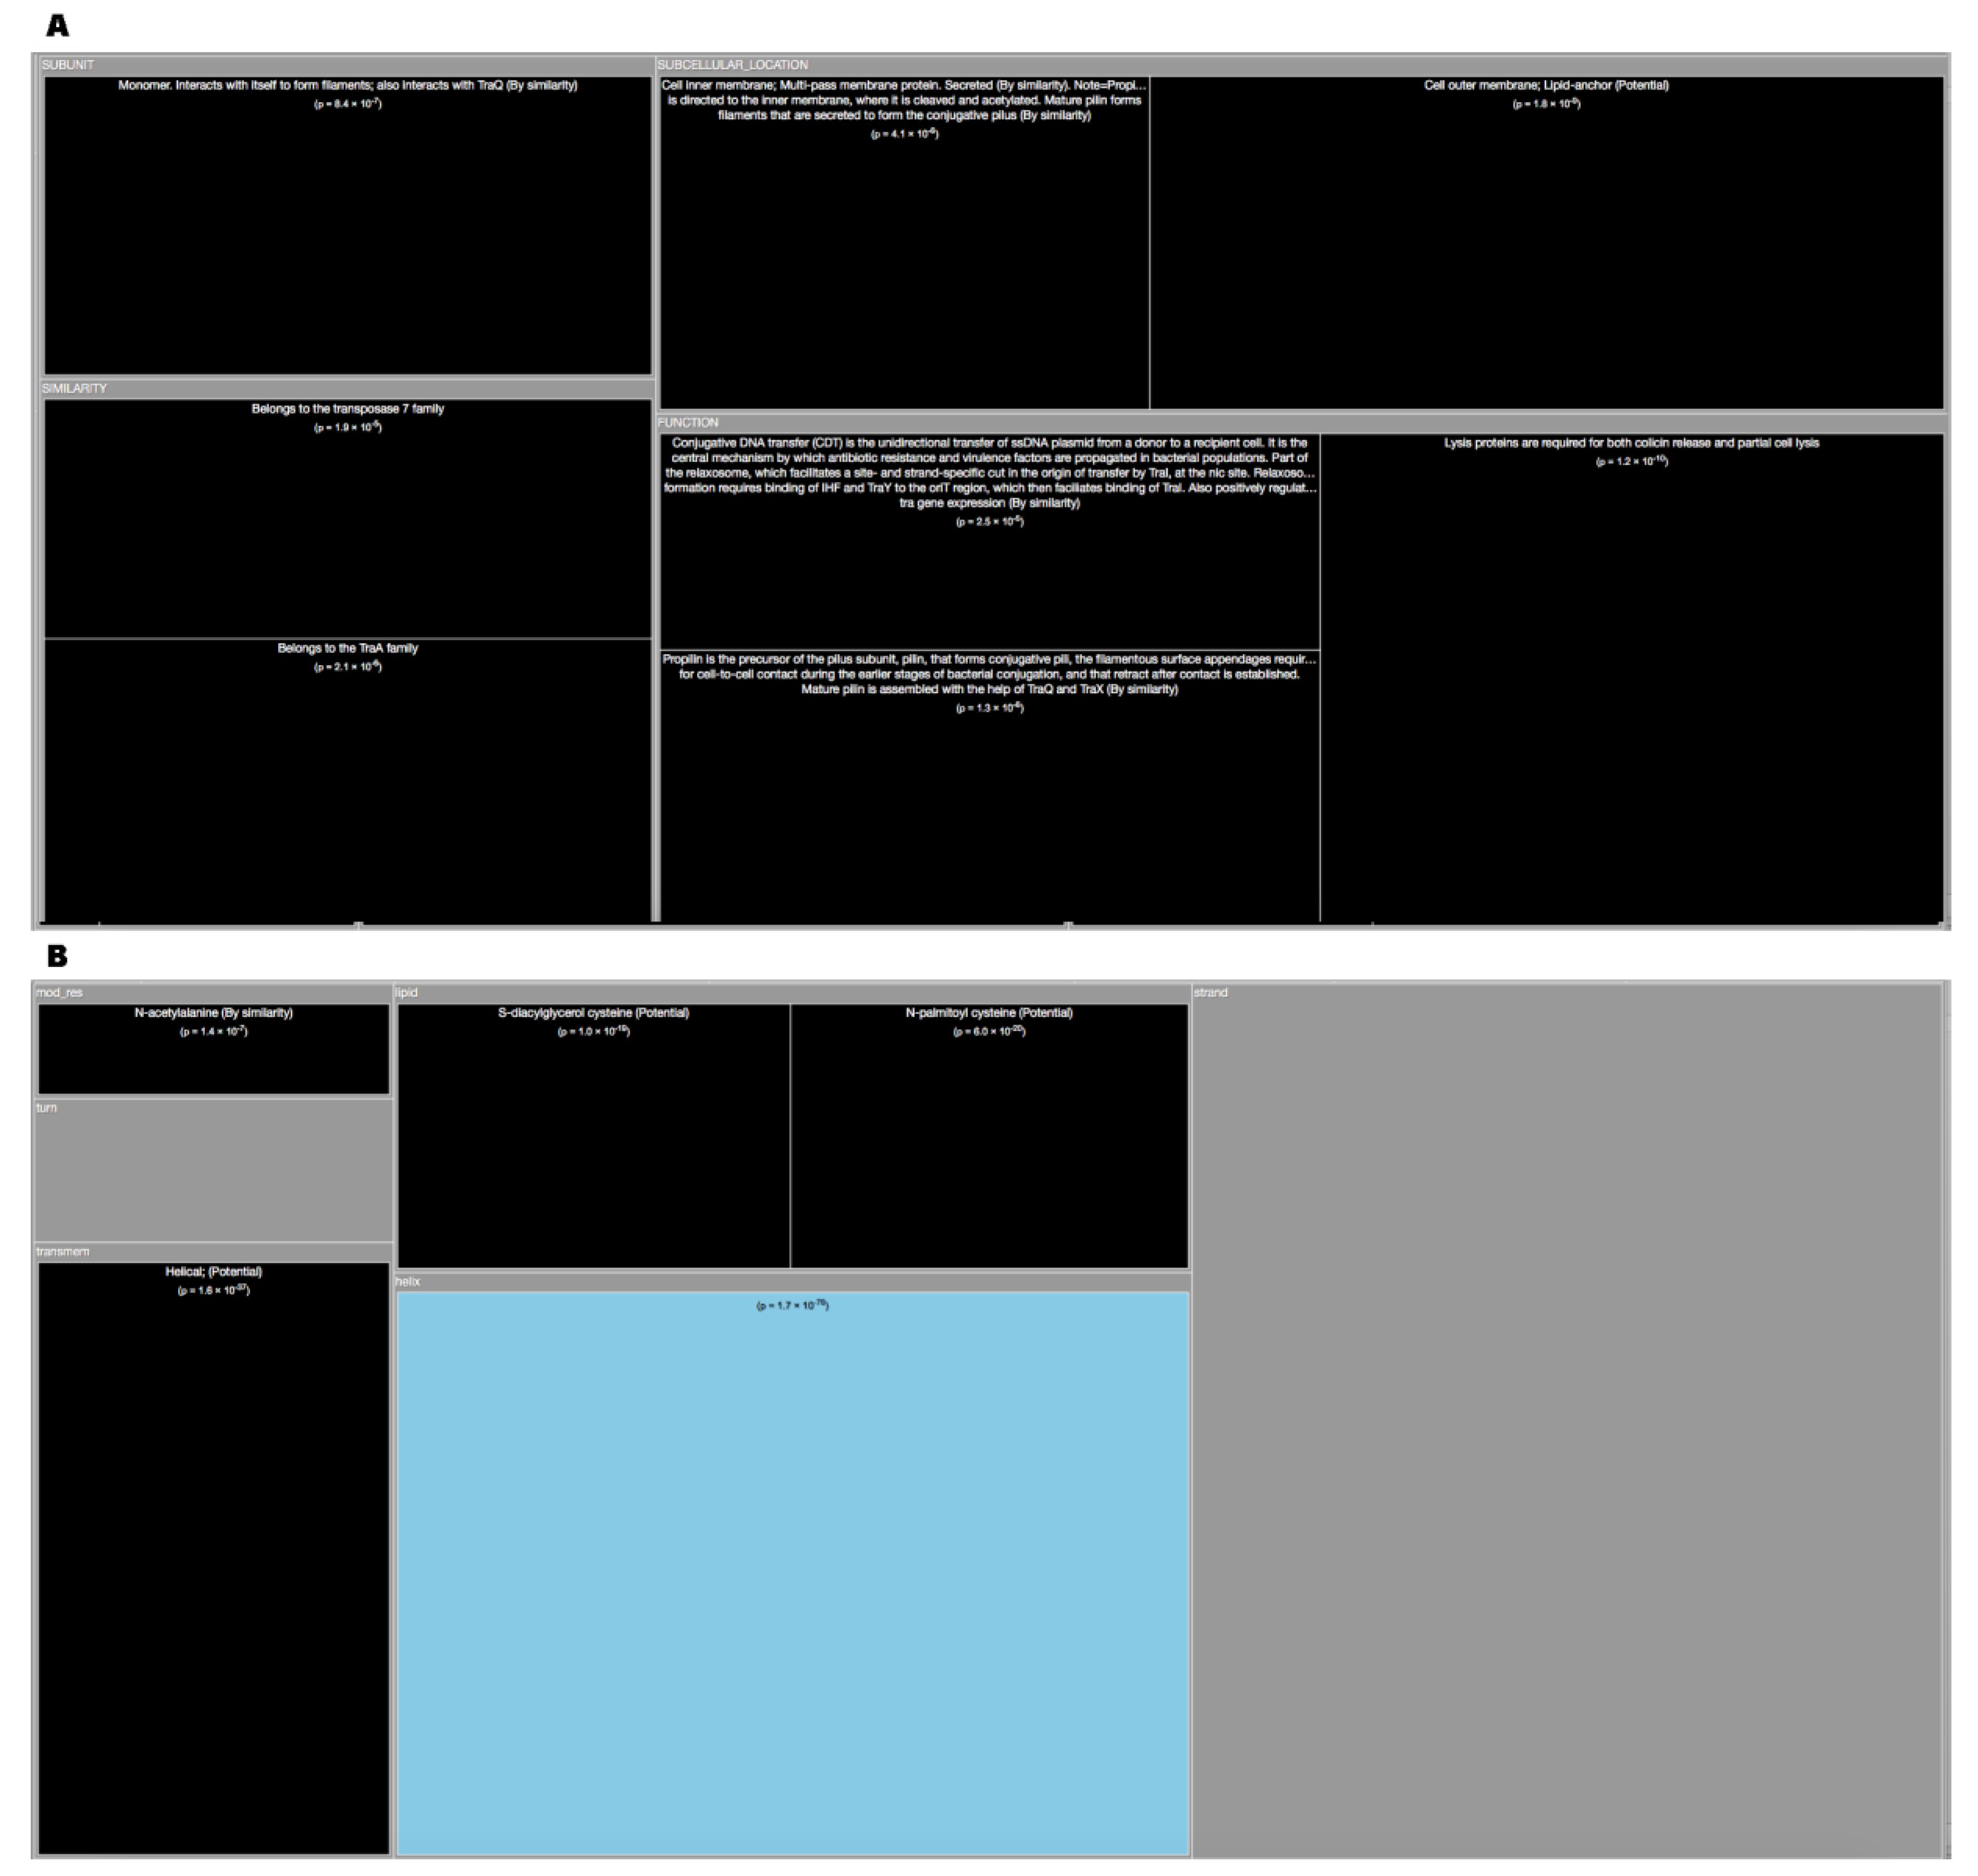
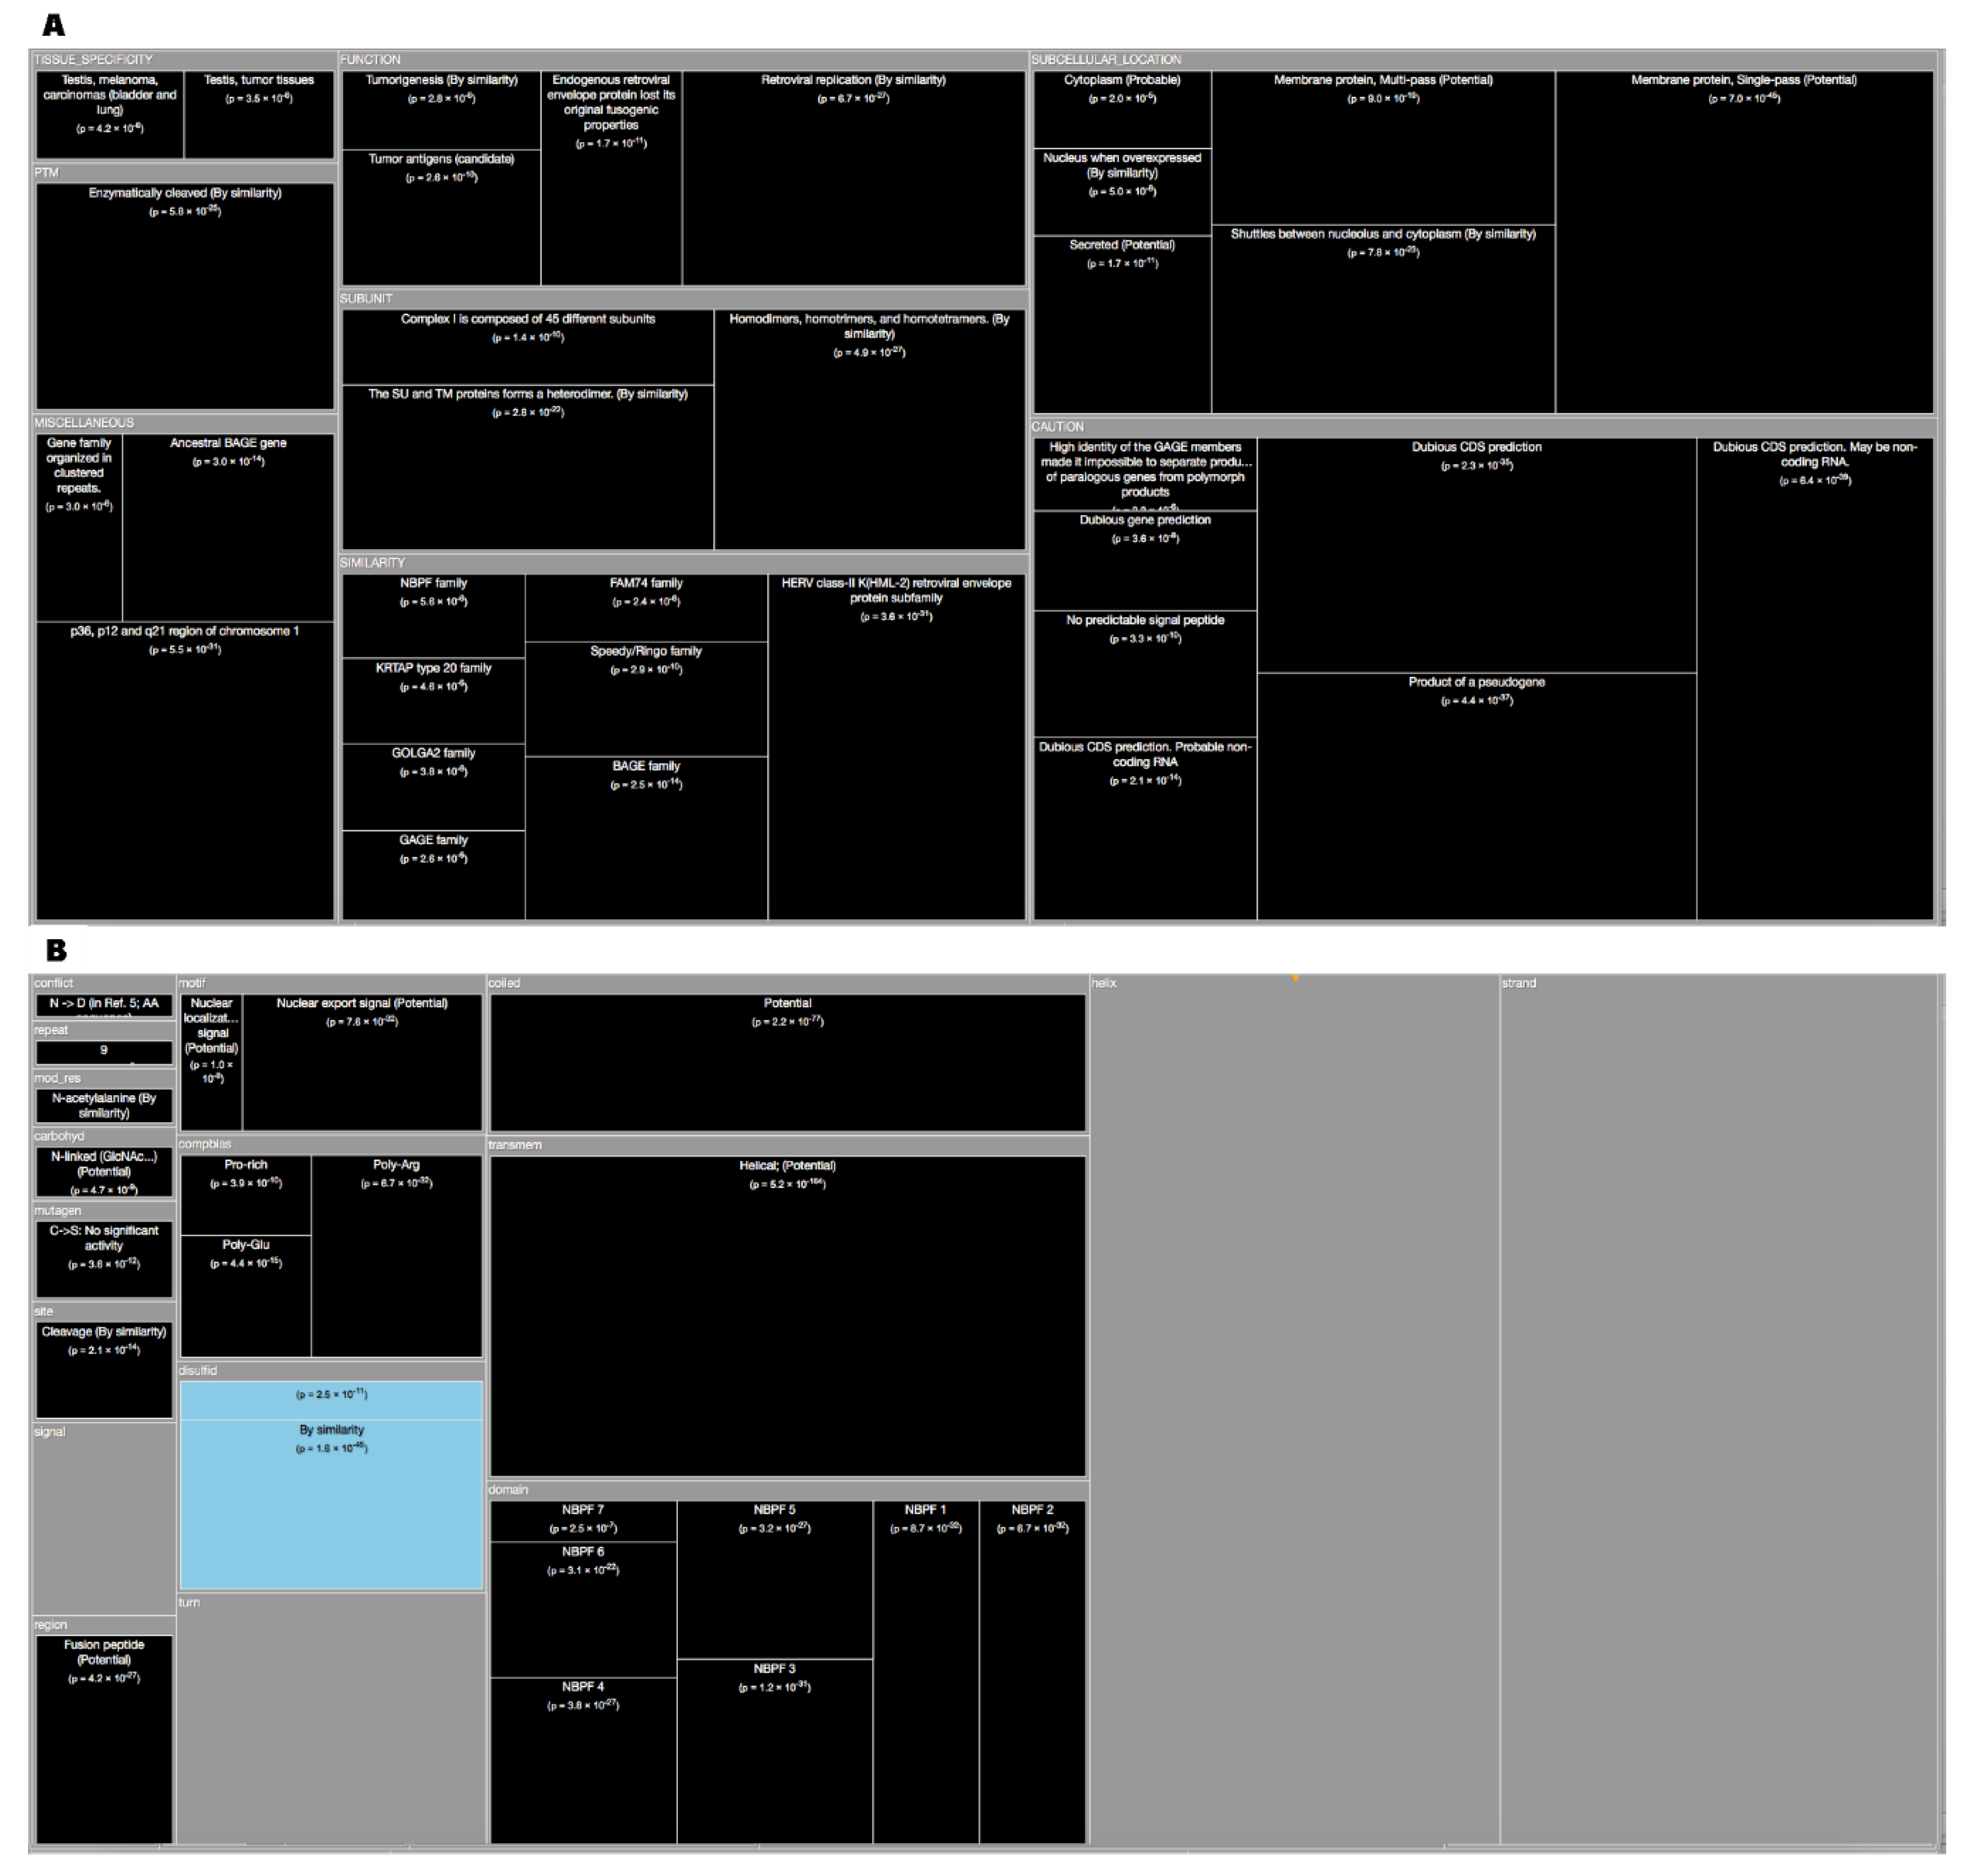
3.3. Dark Genes
3.4. Dark Tissues
4. Discussion
5. Conclusions
Supplementary Materials
Author Contributions
Funding
Conflicts of Interest
References
- Berman, H.M.; Westbrook, J.; Feng, Z.; Gilliland, G.; Bhat, T.N.; Weissig, H.; Shindyalov, I.N.; Bourne, P.E. The Protein Data Bank. Nucleic Acids Res. 2000, 28, 235–242. [Google Scholar] [CrossRef] [Green Version]
- The UniProt Consortium. Activities at the Universal Protein Resource. Nucleic Acids Res. 2014, 42, D191–D198. [Google Scholar] [CrossRef] [PubMed]
- Schafferhans, A.; Meyer, J.E.W.; O’Donoghue, S.I. The PSSH database of alignments between protein sequences and tertiary structures. Nucleic Acids Res. 2003, 31, 494–498. [Google Scholar] [CrossRef] [Green Version]
- O’donoghue, S.I.; Sabir, K.S.; Kalemanov, M.; Stolte, C.; Wellmann, B.; Ho, V.; Roos, M.; Perdigao, N.; Buske, F.A.; Heinrich, J.; et al. Aquaria: Simplifying discovery and insight from protein structures. Nat. Methods. 2015, 12, 98–99. [Google Scholar] [CrossRef] [PubMed]
- Perdigão, N.; Heinrich, J.; Stolte, C.; Sabir, K.S.; Buckley, M.J.; Tabor, B.; Signal, B.; Gloss, B.S.; Hammang, C.J.; Rost, B.; et al. Unexpected features of the dark proteome. Proc. Natl. Acad. Sci. USA 2015, 112, 15898–15903. [Google Scholar] [CrossRef] [Green Version]
- Perdigão, N.; Rosa, A.C.; O’Donoghue, S.I. The Dark Proteome Database. Bio. Data Min. 2017, 10, 24. [Google Scholar] [CrossRef] [PubMed]
- Lieutaud, P.; Ferron, F.; Uversky, A.V.; Kurgan, L.; Uversky, V.N.; Longhi, S. How disordered is my protein and what is its disorder for? A guide through the “dark side” of the protein universe. Intrinsically Disord. Proteins 2016, 4, e1259708. [Google Scholar] [CrossRef]
- Haas, J.; Roth, S.; Arnold, K.; Kiefer, F.; Schmidt, T.; Bordoli, L.; Schwede, T. The Protein Model Portal—A Comprehensive Resource for Protein Structure and Model Information. Database (Oxford).:bat031. Available online: http://www.pubmedcentral.nih.gov/articlerender.fcgi?artid=3889916&tool=pmcentrez&rendertype=abstract (accessed on 3 November 2018).
- Yachdav, G.; Kloppmann, E.; Kajan, L.; Hecht, M.; Goldberg, T.; Hamp, T.; Hönigschmid, P.; Schafferhans, A.; Roos, M.; Bernhofer, M.; et al. PredictProtein—An open resource for online prediction of protein structural and functional features. Nucleic Acids Res. 2014, 49, W337–W343. [Google Scholar] [CrossRef]
- Franceschini, A.; Szklarczyk, D.; Frankild, S.; Kuhn, M.; Simonovic, M.; Roth, A.; Lin, J.; Minguez, P.; Bork, P.; Von Mering, C.; et al. STRING v9.1: Protein-protein interaction networks, with increased coverage and integration. Nucleic Acids Res. 2013, 41, 808–815. [Google Scholar] [CrossRef]
- Fisher, R. On the interpretation of χ2 from contingency tables, and the calculation of P. J. R. Stat. Soc. 1922, 85, 87–94. [Google Scholar] [CrossRef]
- Fisher, R. Statistical Methods for Research Workers. Biol. Monogr. Manuals. 1925. Available online: http://psychclassics.yorku.ca/Fisher/Methods (accessed on 3 November 2018).
- Benjamini, Y.; Hochberg, Y. Controlling the False Discovery Rate: A Practical and Powerful Approach to Multiple Testing. J. R. Stat. Soc. Ser. B 1995, 57, 289–300. [Google Scholar] [CrossRef]
- Shneiderman, B. Tree visualization with Tree-Maps: 2-D space-filling approach. ACM Trans. Graph. 1992, 11, 92–99. [Google Scholar] [CrossRef]
- Skrabanek, L.; Saini, H.K.; Bader, G.D.; Enright, A.J. Computational prediction of protein-protein interactions. Mol. Biotechnol. 2008. [CrossRef] [PubMed]
- Mazandu, G.K.; Mulder, N.J. Scoring Protein Relationships in Functional Interaction Networks Predicted from Sequence Data. PLoS ONE 2011, 6, e18607. [Google Scholar] [CrossRef] [PubMed]
- Rhead, B.; Karolchik, D.; Kuhn, R.M.; Hinrichs, A.S.; Zweig, A.S.; Fujita, P.A.; Diekhans, M.; Smith, K.E.; Rosenbloom, K.R.; Raney, B.J.; et al. The UCSC Genome Browser database: Update 2010. Nucleic Acids Res. 2010, 38, D613–D619. [Google Scholar] [CrossRef]
- Wilhelm, M.; Schlegl, J.; Hahne, H.; Moghaddas Gholami, A.; Lieberenz, M.; Savitski, M.M.; Ziegler, E.; Butzmann, L.; Gessulat, S.; Marx, H.; et al. Mass-spectrometry-based draft of the human proteome. Nature 2014, 509, 582–587. [Google Scholar] [CrossRef] [PubMed]
- The Dark Proteome Database site. Available online: http://www.darkproteome.ws:8030/treeMap (accessed on 3 November 2018).
- Rost, B.; Casadio, R.; Fariselli, P.; Sander, C. Transmembrane helices predicted at 95% accuracy. Protein Sci. 1995, 4, 521–533. [Google Scholar] [CrossRef]
- Cedano, J.; Aloy, P.; Pérez-Pons, J.A.; Querol, E. Relation between amino acid composition and cellular location of proteins. J. Mol. Biol. 1997, 266, 594–600. [Google Scholar] [CrossRef]
- Drake, J.W.; Charlesworth, B.; Charlesworth, D.; Crow, J.F. Rates of spontaneous mutation. Genetics 1998, 148, 1667–1686. [Google Scholar] [PubMed]
- Andrade, M.A.; O’Donoghue, S.I.; Rost, B. Adaptation of protein surfaces to subcellular location. J. Mol. Biol. 1998, 276, 517–525. [Google Scholar] [CrossRef] [Green Version]
- Bitard-Feildel, T.; Callebaut, I. Exploring the dark foldable proteome by considering hydrophobic amino acids topology. Sci. Rep. 2017, 7, 41425. [Google Scholar] [CrossRef] [Green Version]
- Bader, S.; Kühner, S.; Gavin, A.-C. Interaction networks for systems biology. FEBS Lett. 2008, 582, 1220–1224. [Google Scholar] [CrossRef] [Green Version]
- Christensen, C.; Thakar, J.; Albert, R. Systems-level insights into cellular regulation: Inferring, analysing, and modelling intracellular networks. IET Syst. Biol. 2007, 1, 61–77. [Google Scholar] [CrossRef] [PubMed]
- Devos, D.; Russell, R.B. A more complete, complexed and structured interactome. Curr. Opin. Struct. Biol. 2007, 17, 370–377. [Google Scholar] [CrossRef]
- Hu, Z.; Mellor, J.; Wu, J.; Kanehisa, M.; Stuart, J.M.; DeLisi, C. Towards zoomable multidimensional maps of the cell. Nat. Biotechnol. 2007, 25, 547–554. [Google Scholar] [CrossRef] [PubMed]
- Kerrien, S.; Aranda, B.; Breuza, L.; Bridge, A.; Broackes-Carter, F.; Chen, C.; Duesbury, M.; Dumousseau, M.; Feuermann, M.; Hinz, U.; et al. The IntAct molecular interaction database in 2012. Nucleic Acids Res. 2012, 40, D841–D846. [Google Scholar] [CrossRef] [PubMed]
- Szklarczyk, D.; Franceschini, A.; Kuhn, M.; Simonovic, M.; Roth, A.; Minguez, P.; Doerks, T.; Stark, M.; Muller, J.; Bork, P.; Jensen, L.J. The STRING database in 2011: Functional interaction networks of proteins, globally integrated and scored. Nucleic Acids Res. 2011, 39 (Suppl. 1). [Google Scholar] [CrossRef] [PubMed]
- Chatr-Aryamontri, A.; Breitkreutz, B.J.; Heinicke, S.; Boucher, L.; Winter, A.; Stark, C.; Nixon, J.; Ramage, L.; Kolas, N.; O’donnell, L.; et al. The BioGRID interaction database: 2013 Update. Nucleic Acids Res. 2013, 41, 470–478. [Google Scholar] [CrossRef] [PubMed]
- Keshava Prasad, T.S.; Goel, R.; Kandasamy, K.; Keerthikumar, S.; Kumar, S.; Mathivanan, S.; Telikicherla, D.; Raju, R.; Shafreen, B.; Venugopal, A.; et al. Human Protein Reference Database--2009 update. Nucleic Acids Res. 2009, 37, D767–D772. [Google Scholar] [CrossRef]
- Dosztányi, Z.; Csizmok, V.; Tompa, P.; Simon, I. IUPred: Web server for the prediction of intrinsically unstructured regions of proteins based on estimated energy content. Bioinformatics 2005, 21, 3433–3434. [Google Scholar] [CrossRef] [PubMed]
- Schlessinger, A.; Punta, M.; Yachdav, G.; Kajan, L.; Rost, B. Improved disorder prediction by combination of orthogonal approaches. PLoS ONE 2009, 4, e4433. [Google Scholar] [CrossRef] [PubMed]
- Ward, J.J.; Sodhi, J.S.; McGuffin, L.J.; Buxton, B.F.; Jones, D.T. Prediction and functional analysis of native disorder in proteins from the. J. Mol. Biol. 2004, 337, 635–645. [Google Scholar] [CrossRef] [PubMed]
- Meng, F.; Uversky, V.; Kurgan, L. Computational prediction of intrinsic disorder in proteins. Curr. Protoc. Protein Sci. 2017, 88, 2–16. [Google Scholar] [CrossRef] [PubMed]
- Vincent, M.; Uversky, V.N.; Schnell, S. On the Need to Develop Guidelines for Characterizing and Reporting Intrinsic Disorder in Proteins. Proteomics 2019. [Google Scholar] [CrossRef]


| Non-dark | Dark | Ratio | Total | Fisher’s p value | Adjusted p value | Annotation sub-category | Annotation |
|---|---|---|---|---|---|---|---|
| 1 | 380 | 2397.28 | 381 | 0 | 0 | SIMILARITY | Belongs to the Casparian strip membrane proteins (CASP) family. {ECO:0000305}. |
| 1722 | 1900 | 6.96 | 3622 | 0 | 0 | SUBCELLULAR_LOCATION | Membrane {ECO:0000305}; Multi-pass membrane protein {ECO:0000305}. |
| 182 | 744 | 25.79 | 926 | 0 | 0 | TISSUE_SPECIFICITY | Expressed by the venom duct. |
| 1 | 376 | 2372.04 | 377 | 2.96 × 10–323 | 2.31 × 10–318 | SUBUNIT | Homodimer and heterodimers. {ECO:0000250}. |
| 966 | 900 | 5.878 | 1866 | 2.94 × 10–281 | 1.84 × 10–276 | SUBCELLULAR_LOCATION | Membrane {ECO:0000305}; Singl × 10–pass membrane protein {ECO:0000305}. |
| 14 | 276 | 124.37 | 290 | 9.18 × 10–217 | 4.77 × 10–212 | DOMAIN | The presence of a ’disulfide through disulfide knot’ structurally defines this protein as a knottin. {ECO:0000250}. |
| 448 | 557 | 7.84 | 1005 | 1.80 × 10–212 | 8.02 × 10–208 | SUBCELLULAR_LOCATION | Cell membrane {ECO:0000250}; Multi-pass membrane protein {ECO:0000250}. |
| 39 | 250 | 40.44 | 289 | 9.16 × 10–171 | 3.57 × 10–166 | TISSUE_SPECIFICITY | Testis. |
| 0 | 196 | 0 | 196 | 4.22 × 10–170 | 1.46 × 10–165 | SIMILARITY | Belongs to the PsbN family. {ECO:0000255|HAMAP-Rule:MF_00293}. |
| 0 | 194 | 0 | 194 | 2.26 × 10–168 | 7.06 × 10–164 | FUNCTION | May play a role in photosystem I and II biogenesis. {ECO:0000255|HAMAP-Rule:MF_00293}. |
| 0 | 189 | 0 | 189 | 4.75 × 10–164 | 1.35 × 10–159 | SUBCELLULAR_LOCATION | Plastid, chloroplast thylakoid membrane {ECO:0000255|HAMAP-Rule:MF_00293}; Single-pass membrane protein {ECO:0000255|HAMAP-Rule:MF_00293}. |
| 412 | 456 | 6.98 | 868 | 6.67 × 10–162 | 1.73 × 10–157 | SUBCELLULAR_LOCATION | Endoplasmic reticulum membrane {ECO:0000250}; Multi-pass membrane protein {ECO:0000250}. |
| 0 | 184 | 0 | 184 | 9.98 × 10–160 | 2.39 × 10–155 | CAUTION | Originally thought to be a component of PSII; based on experiments in Synechocystis, N.tabacum and barley, and its absence from PSII in T.elongatus and T.vulcanus, this is probably not true. {ECO:0000255 |
| 26 | 217 | 52.65 | 243 | 4.35 × 10–155 | 9.69 × 10–151 | SIMILARITY | Belongs to the conotoxin O1 superfamily. {ECO:0000305}. |
| 87 | 258 | 18.71 | 345 | 6.35 × 10–146 | 1.32 × 10–141 | SIMILARITY | Belongs to the DEFL family. {ECO:0000305}. |
| 1 | 155 | 977.84 | 156 | 1.57 × 10–132 | 3.06 × 10–128 | SIMILARITY | Belongs to the protamine P1 family. {ECO:0000305}. |
| 0 | 145 | 0 | 145 | 5.12 × 10–126 | 9.40 × 10–122 | FUNCTION | Mitochondrial membrane ATP synthase (F(1)F(0) ATP synthase or Complex V) produces ATP from ADP in the presence of a proton gradient across the membrane which is generated by electron transport complexes of the respiratory chain. F-type ATPases consist of two structural domains, F(1) - containing the extramembraneous catalytic core and F(0) - containing the membrane proton channel, linked together by a central stalk and a peripheral stalk. During catalysis, ATP synthesis in the catalytic domain of F(1) is coupled via a rotary mechanism of the central stalk subunits to proton translocation. Part of the complex F(0) domain. Minor subunit located with subunit a in the membrane (By similarity). {ECO:0000250}. |
| 0 | 143 | 0 | 143 | 2.74 × 10–124 | 4.75 × 10–120 | SUBCELLULAR_LOCATION | Mitochondrion membrane; Singl × 10–pass membrane protein. |
| 0 | 142 | 0 | 142 | 2.01 × 10–123 | 3.29 × 10–119 | SIMILARITY | Belongs to the ATPase protein 8 family. {ECO:0000305}. |
| 2313 | 18 | 0.05 | 2331 | 3.33 × 10–119 | 5.20 × 10–115 | CATALYTIC_ACTIVITY | ATP + a protein = ADP + a phosphoprotein. |
| Non-dark | Dark | Ratio | Total | Fisher’s p value | Adjusted p value | Annotation sub-category | Annotation |
|---|---|---|---|---|---|---|---|
| 96,211 | 24,496 | 3.25 | 120,707 | 0 | 0 | transmem | Helical; (Potential) |
| 15,723 | 3753 | 3.05 | 19,476 | 0 | 0 | signal | Potential |
| 45 | 562 | 159.48 | 607 | 0 | 0 | mod_res | Phenylalanine amide |
| 4152 | 1677 | 5.16 | 5829 | 0 | 0 | topo_dom | Lumenal (Potential) |
| 69 | 524 | 96.98 | 593 | 0 | 0 | mod_res | Leucine amide |
| 35,139 | 6509 | 2.37 | 41,648 | 0 | 0 | topo_dom | Cytoplasmic (Potential) |
| 16,045 | 11 | 0.01 | 16,056 | 0 | 0 | binding | Substrate (By similarity) |
| 6648 | 3000 | 5.76 | 9648 | 0 | 0 | non_ter | |
| 10,317 | 2823 | 3.49 | 13,140 | 0 | 0 | coiled | Potential |
| 110,128 | 0 | 0 | 110,128 | 0 | 0 | strand | |
| 27,108 | 0 | 0 | 27,108 | 0 | 0 | turn | |
| 103,913 | 0 | 0 | 103,913 | 0 | 0 | helix | |
| 44 | 312 | 90.55 | 356 | 5.19 × 10–301 | 1.79 × 10–296 | mod_res | Valine amide |
| 8891 | 1 | 0 | 8892 | 1.69 × 10–289 | 5.43 × 10–285 | np_bind | ATP (By similarity) |
| 24,535 | 3794 | 1.97 | 28,329 | 2.95 × 10–287 | 8.82 × 10–283 | mod_res | Phosphoserine (By similarity) |
| 904 | 596 | 8.42 | 1500 | 1.95 × 10–273 | 5.46 × 10–269 | unsure | L or I |
| 8122 | 2 | 0 | 8124 | 8.37 × 10–262 | 2.21 × 10–257 | act_site | Proton acceptor (By similarity) |
| 1186 | 641 | 6.90 | 1827 | 1.49 × 10–257 | 3.70 × 10–253 | non_cons | |
| 401 | 414 | 13.18 | 815 | 8.24 × 10–242 | 1.94 × 10–237 | mod_res | Pyrrolidone carboxylic acid |
| 6967 | 0 | 0 | 6967 | 5.48 × 10–229 | 1.23 × 10–224 | np_bind | GTP (By similarity) |
| Non-dark | Dark | Ratio | Total | Fisher’s p value | Adjusted p value | Annotation sub-category | Annotation |
|---|---|---|---|---|---|---|---|
| 124 | 28 | 18.49 | 152 | 9.71 × 10⁻²⁵ | 6.65 × 10⁻²⁰ | SUBCELLULAR_LOCATION | Membrane; Single-pass membrane protein (Potential). |
| 0 | 11 | 0 | 11 | 7.55 × 10⁻²² | 2.59 × 10⁻¹⁷ | CAUTION | Product of a dubious CDS prediction. May be a non-coding RNA. |
| 162 | 27 | 13.64 | 189 | 7.11 × 10⁻²¹ | 1.62 × 10⁻¹⁶ | CAUTION | Could be the product of a pseudogene. |
| 5 | 12 | 196.47 | 17 | 5.29 × 10⁻²⁰ | 9.05 × 10⁻¹⁶ | CAUTION | Product of a dubious CDS prediction. |
| 0 | 9 | 0 | 9 | 5.27 × 10⁻¹⁸ | 7.22 × 10⁻¹⁴ | MISCELLANEOUS | Encoded by one of the numerous copies of NBPF genes clustered in the p36, p12 and q21 region of the chromosome 1. |
| 0 | 9 | 0 | 9 | 5.27 × 10⁻¹⁸ | 6.01 × 10⁻¹⁴ | SIMILARITY | Belongs to the beta type-B retroviral envelope protein family. HERV class-II K(HML-2) env subfamily. |
| 0 | 8 | 0 | 8 | 4.39 × 10⁻¹⁶ | 4.30 × 10⁻¹² | FUNCTION | Retroviral replication requires the nuclear export and translation of unspliced, singly-spliced and multiply-spliced derivatives of the initial genomic transcript. Rec interacts with a highly structured RNA element (RcRE) present in the viral 3’LTR and recruits the cellular nuclear export machinery. This permits export to the cytoplasm of unspliced genomic or incompletely spliced subgenomic viral transcripts (By similarity). |
| 0 | 8 | 0 | 8 | 4.39 × 10⁻¹⁶ | 3.76 × 10⁻¹² | SUBUNIT | Forms homodimers, homotrimers, and homotetramers via a C-terminal domain. Associates with XPO1 and with ZNF145 (By similarity). |
| 1 | 8 | 654.91 | 9 | 3.91 × 10⁻¹⁵ | 2.98 × 10⁻¹¹ | PTM | Specific enzymatic cleavages in vivo yield the mature SU and TM proteins (By similarity). |
| 0 | 7 | 0 | 7 | 3.66 × 10⁻¹⁴ | 2.51 × 10⁻¹⁰ | SUBCELLULAR_LOCATION | Cytoplasm (By similarity). Nucleus, nucleolus (By similarity). Note=Shuttles between the nucleus and the cytoplasm. When in the nucleus, resides in the nucleolus (By similarity). |
| 3 | 8 | 218.30 | 11 | 7.02 × 10⁻¹⁴ | 4.37 × 10⁻¹⁰ | SUBUNIT | The surface (SU) and transmembrane (TM) proteins form a heterodimer. SU and TM are attached by noncovalent interactions or by a labile interchain disulfide bond (By similarity). |
| 218 | 21 | 7.89 | 239 | 2.55 × 10⁻¹² | 1.46 × 10–08 | SUBCELLULAR_LOCATION | Membrane; Multi-pass membrane protein (Potential). |
| 0 | 5 | 0 | 5 | 2.54 × 10⁻¹⁰ | 1.34 × 10–06 | MISCELLANEOUS | The ancestral BAGE gene was generated by juxtacentromeric reshuffling of the KMT2C/MLL3 gene. The BAGE family was expanded by juxtacentromeric movement and/or acrocentric exchanges. BAGE family is composed of expressed genes that map to the juxtacentromeric regions of chromosomes 13 and 21 and of unexpressed gene fragments that scattered in the juxtacentromeric regions of several chromosomes, including chromosomes 9, 13, 18 and 21. |
| 0 | 5 | 0 | 5 | 2.54 × 10⁻¹⁰ | 1.24 × 10–06 | SIMILARITY | Belongs to the BAGE family. |
| 0 | 5 | 0 | 5 | 2.54 × 10⁻¹⁰ | 1.16 × 10–06 | CAUTION | Product of a dubious CDS prediction. Probable non-coding RNA. |
| 215 | 17 | 6.47 | 232 | 4.87 × 10–09 | 2.09 × 10–05 | SUBCELLULAR_LOCATION | Secreted (Potential). |
| 2 | 5 | 204.66 | 7 | 5.22 × 10–09 | 2.10 × 10–05 | FUNCTION | Retroviral envelope proteins mediate receptor recognition and membrane fusion during early infection. Endogenous envelope proteins may have kept, lost or modified their original function during evolution. This endogenous envelope protein has lost its original fusogenic properties. |
| 3 | 5 | 136.44 | 8 | 1.38 × 10–08 | 5.25 × 10–05 | SUBUNIT | Complex I is composed of 45 different subunits. |
| 0 | 4 | 0 | 4 | 2.11 × 10–08 | 7.61 × 10–05 | CAUTION | No predictable signal peptide. |
| 0 | 4 | 0 | 4 | 2.11 × 10–08 | 7.23 × 10–05 | SIMILARITY | Belongs to the Speedy/Ringo family. |
| Non-dark | Dark | Ratio | Total | Fisher’s p value | Adjusted p value | Annotation sub-category | Annotation |
|---|---|---|---|---|---|---|---|
| 50,327 | 0 | 0 | 50,327 | 3.58 × 10–140 | 5.65 × 10–135 | strand | |
| 46,207 | 0 | 0 | 46,207 | 6.54 × 10–128 | 5.15 × 10–123 | helix | |
| 7572 | 217 | 4.75 | 7789 | 2.33 × 10–76 | 1.22 × 10–71 | transmem | Helical; (Potential) |
| 2023 | 81 | 6.64 | 2104 | 1.29 × 10–38 | 5.10 × 10⁻³⁴ | coiled | Potential |
| 11,972 | 0 | 0 | 11,972 | 3.59 × 10⁻³² | 1.13 × 10⁻²⁷ | turn | |
| 12,033 | 5 | 0.07 | 12,038 | 4.92 × 10⁻²⁵ | 1.29 × 10⁻²⁰ | disulfid | By similarity |
| 0 | 8 | 0 | 8 | 1.65 × 10⁻¹⁸ | 3.71 × 10⁻¹⁴ | domain | NBPF 3 |
| 0 | 8 | 0 | 8 | 1.65 × 10⁻¹⁸ | 3.24 × 10⁻¹⁴ | domain | NBPF 1 |
| 0 | 8 | 0 | 8 | 1.65 × 10⁻¹⁸ | 2.88 × 10⁻¹⁴ | domain | NBPF 2 |
| 152 | 19 | 20.73 | 171 | 1.84 × 10⁻¹⁸ | 2.89 × 10⁻¹⁴ | compbias | Poly-Arg |
| 3 | 9 | 497.59 | 12 | 2.13 × 10⁻¹⁸ | 3.05 × 10⁻¹⁴ | motif | Nuclear export signal (Potential) |
| 3 | 8 | 442.30 | 11 | 2.67 × 10⁻¹⁶ | 3.51 × 10⁻¹² | region | Fusion peptide (Potential) |
| 0 | 7 | 0 | 7 | 2.75 × 10⁻¹⁶ | 3.34 × 10⁻¹² | domain | NBPF 4 |
| 0 | 7 | 0 | 7 | 2.75 × 10⁻¹⁶ | 3.10 × 10⁻¹² | domain | NBPF 5 |
| 1939 | 46 | 3.93 | 1985 | 2.92 × 10⁻¹⁴ | 3.07 × 10⁻¹⁰ | signal | Potential |
| 0 | 6 | 0 | 6 | 4.61 × 10⁻¹⁴ | 4.54 × 10⁻¹⁰ | domain | NBPF 6 |
| 482 | 20 | 6.88 | 502 | 6.27 × 10⁻¹¹ | 5.81 × 10⁻⁷ | compbias | Poly-Glu |
| 33 | 8 | 40.20 | 41 | 1.32 × 10⁻¹⁰ | 1.16 × 10⁻⁶ | site | Cleavage (By similarity) |
| 0 | 4 | 0 | 4 | 1.29 × 10⁻⁹ | 1.07 × 10⁻⁵ | mutagen | C->S: No significant activity |
| 3356 | 0 | 0 | 3356 | 3.16 × 10⁻⁹ | 2.49 × 10⁻⁵ | disulfid |
| Gene | Protein | Length | Binds | Bias | Gene | Protein | Length | Binds | Bias |
|---|---|---|---|---|---|---|---|---|---|
| Chromosome 1 (q21.3): PQCK-rich, keratinocyte proteins | Chromosome 17 (q21.2): CS-rich, keratin associated proteins | ||||||||
| LCE5A | Late cornified envelope 5A | 118 | 3 | 21 | KRTAP3-3 | Keratin associated protein 3-3 | 98 | 19 | |
| CRCT1 | Cysteine-rich C-terminal 1 | 99 | 2 | 25 | KRTAP3-2 | Keratin associated protein 3-2 | 98 | 19 | |
| LCE3E | Late cornified envelope 3E | 92 | 2 | 16 | KRTAP3-1 | Keratin associated protein 3-1 | 98 | 18 | |
| LCE3E | Late cornified envelope 3E | 92 | 2 | 17 | KRTAP3-1 | Keratin associated protein 3-1 | 98 | 24 | |
| LCE3D | Late cornified envelope 3D | 92 | 2 | 19 | KRTAP1-5 | Keratin associated protein 1-5 | 174 | 25 | |
| LCE3C | Late cornified envelope 3C | 94 | 4 | 19 | KRTAP1-1 | Keratin associated protein 1-1 | 177 | 27 | |
| LCE3B | Late cornified envelope 3B | 95 | 2 | 24 | KRTAP2-1 | Keratin associated protein 2-1 | 128 | 27 | |
| LCE3A | Late cornified envelope 3A | 89 | 1 | 21 | KRTAP2-1 | Keratin associated protein 2-1 | 128 | 35 | |
| LCE2D | Late cornified envelope 2D | 110 | 1 | 20 | KRTAP4-11 | Keratin associated protein 4-11 | 195 | 37 | |
| LCE2C | Late cornified envelope 2C | 110 | 21 | KRTAP4-12 | Keratin associated protein 4-12 | 201 | 37 | ||
| LCE2B | Late cornified envelope 2B | 110 | 22 | KRTAP4-4 | Keratin associated protein 4-4 | 166 | 36 | ||
| LCE2A | Late cornified envelope 2A | 106 | 1 | 20 | KRTAP4-3 | Keratin associated protein 4-3 | 195 | 35 | |
| LCE4A | Late cornified envelope 4A | 99 | 3 | 18 | KRTAP4-2 | Keratin associated protein 4-2 | 136 | 34 | |
| KPRP | Keratinocyte proline-rich protein | 579 | 1 | 20 | KRTAP4-1 | Keratin associated protein 4-1 | 146 | 36 | |
| LCE1F | Late cornified envelope 1F | 118 | 22 | KRTAP17-1 | Keratin associated protein 17-1 | 105 | 19 | ||
| LCE1E | Late cornified envelope 1E | 118 | 1 | 22 | Chromosome 21 (q22.11): GYSC-rich, keratin-associated proteins | ||||
| LCE1D | Late cornified envelope 1D | 114 | 1 | 22 | CLDN17 | Claudin 17 | 224 | 1 | 14 |
| LCE1C | Late cornified envelope 1C | 118 | 1 | 21 | CLDN8 | Claudin 8 | 225 | 1 | 10 |
| LCE1B | Late cornified envelope 1B | 118 | 20 | KRTAP24-1 | Keratin associated protein 24-1 | 254 | 2 | 19 | |
| LCE1A | Late cornified envelope 1A | 110 | 1 | 14 | KRTAP25-1 | Keratin associated protein 25-1 | 102 | 21 | |
| LCE6A | Late cornified envelope 6A | 80 | 17 | KRTAP26-1 | Keratin associated protein 26-1 | 210 | 2 | 18 | |
| SMCP | Sperm mitochondria-associated | 116 | 29 | KRTAP27-1 | Keratin associated protein 27-1 | 207 | 2 | 16 | |
| SPRR4 | Small proline-rich protein 4 | 79 | 22 | KRTAP23-1 | Keratin associated protein 23-1 | 65 | 2 | 20 | |
| SPRR3 | Small proline-rich protein 3 | 169 | 29 | KRTAP13-2 | Keratin associated protein 13-6, pseudogene | 175 | 23 | ||
| SPRR1B | Small proline-rich protein 1B | 89 | 38 | KRTAP13-1 | Keratin associated protein 13-1 | 172 | 23 | ||
| SPRR2D | Small proline-rich protein 2D | 72 | 38 | KRTAP13-3 | Keratin associated protein 13-3 | 172 | 22 | ||
| SPRR2A | Small proline-rich protein 2A | 72 | 1 | 39 | KRTAP13-4 | Keratin associated protein 13-4 | 160 | 21 | |
| SPRR2B | Small proline-rich protein 2B | 72 | 1 | 39 | KRTAP19-1 | Keratin associated protein 19-1 | 90 | 42 | |
| SPRR2E | Small proline-rich protein 2E | 72 | 36 | KRTAP19-2 | Keratin associated protein 19-2 | 52 | 27 | ||
| SPRR2F | Small proline-rich protein 2F | 72 | 40 | KRTAP19-3 | Keratin associated protein 19-3 | 81 | 43 | ||
| SPRR2G | Small proline-rich protein 2G | 73 | 26 | KRTAP19-4 | Keratin associated protein 19-4 | 84 | 27 | ||
| LELP1 | Late cornified envelope-like | 98 | 21 | KRTAP19-5 | Keratin associated protein 19-5 | 72 | 39 | ||
| Chromosome 4 (q13.3): P-rich, mouth and digestive secreted proteins | KRTAP19-7 | Keratin associated protein 19-7 | 63 | 2 | 33 | ||||
| CSN1S1 | Casein alpha s1 | 185 | 2 | 11 | KRTAP6-2 | Keratin associated protein 6-2 | 62 | 32 | |
| CSN2 | Casein beta | 226 | 2 | 17 | KRTAP6-1 | Keratin associated protein 6-1 | 71 | 38 | |
| STATH | Statherin | 62 | 2 | 11 | KRTAP20-1 | Keratin associated protein 20-1 | 56 | 36 | |
| HTN3 | Histatin 3 | 51 | 1 | 14 | KRTAP20-2 | Keratin associated protein 20-2 | 65 | 37 | |
| HTN1 | Histatin 1 | 57 | 2 | 12 | KRTAP20-3 | Keratin associated protein 20-3 | 44 | 4 | 25 |
| C4orf40 | Proline-rich protein 27 | 219 | 21 | KRTAP21-1 | Keratin associated protein 21-1 | 79 | 2 | 35 | |
| ODAM | Odontogenic, ameloblast asssociated | 279 | 15 | KRTAP8-1 | Keratin associated protein 8-1 | 63 | 24 | ||
| C4orf7 | Follicular dendritic cell secreted | 85 | 19 | KRTAP11-1 | Keratin associated protein 11-1 | 163 | 15 | ||
| CSN3 | Casein kappa | 182 | 2 | 16 | KRTAP19-8 | Keratin associated protein 19-8 | 63 | 4 | 35 |
| SMR3B | Salivary gland androgen regulated | 79 | 1 | 39 | Chromosome X (p11.23): EPG-rich, GAGE and PAGE family proteins | ||||
| MUC7 | Mucin 7, secreted | 377 | 4 | 20 | GAGE10 | G antigen 10 | 116 | 17 | |
| AMTN | Amelotin | 209 | 1 | 15 | GAGE12J | G antigen 12J | 117 | 16 | |
| AMBN | Enamel matrix protein | 447 | 1 | 15 | GAGE12F | G antigen 6 | 117 | 17 | |
| IGJ | Immunoglobulin J chain | 159 | 1 | 9 | GAGE13 | G antigen 13 | 117 | 17 | |
| UTP3 | Processome component | 479 | 1 | 13 | GAGE2E | G antigen 8 | 116 | 17 | |
| Chromosome 11 (q12.1-q12.2): LS-rich, transmembrane complex members | GAGE2D | G antigen 8 | 116 | 16 | |||||
| MS4A3 | Member 3 | 214 | 13 | GAGE2C | G antigen 2C | 116 | 18 | ||
| MS4A2 | Member 2, receptor for | 244 | 12 | GAGE12B | G antigen 12B | 117 | 17 | ||
| MS4A6A | Member 6A | 248 | 2 | 14 | GAGE2A | G antigen 2A | 116 | 17 | |
| MS4A4E | Putative member 4E | 132 | 2 | 11 | GAGE1 | G antigen 6 | 139 | 14 | |
| MS4A4A | Member 4 | 239 | 1 | 11 | GAGE4 | Cancer/testis antigen 4.4 | 117 | 17 | |
| MS4A6E | Member 6E | 147 | 2 | 16 | PAGE1 | P antigen family, member 1 | 146 | 18 | |
| MS4A7 | Member 7 | 240 | 1 | 15 | PAGE4 | P antigen family, member 4 | 102 | 15 | |
| MS4A5 | Member 5 | 200 | 13 | Chromosome X (p11.22): EP-rich; contains XAGE family proteins | |||||
| XAGE2B | X antigen family, member 2B | 111 | 13 | ||||||
| XAGE1B | G antigen member; Cancer/testis antigen 12.1 | 81 | 15 | ||||||
| SSX7 | Synovial sarcoma, X breakpoint 7 | 188 | 12 | ||||||
| SSX2B | Synovial sarcoma, X breakpoint 2B | 188 | 12 | ||||||
| SPANXN5 | SPANX family, member N5 | 72 | 14 | ||||||
| XAGE5 | X antigen family, member 5 | 108 | 12 | ||||||
| XAGE3 | X antigen family, member 3 | 111 | 15 | ||||||
| FAM156A | Family with sequence similarity 156, member B | 213 | 12 | ||||||
| Rank | Tissue | Ratio Dark Residues |
|---|---|---|
| 1 | Heart | 50% |
| 2 | Cervical Mucosa | 50% |
| 3 | Natural Killer Cell | 50% |
| 4 | Lung | 49% |
| 5 | Testis | 49% |
| 6 | Rectum | 49% |
| 7 | Proximal Fluid Coronary Sinus | 49% |
| 8 | Pancreas | 49% |
| 9 | B. Lymphocyte | 49% |
| 10 | Colon Muscle | 49% |
| 11 | Bone Marrow Stromal Cell | 48% |
| 12 | Hair Follicle | 48% |
| 13 | Cytotoxic T Lymphocyte | 48% |
| 14 | Helper T Lymphocyte | 48% |
| 15 | Colon | 48% |
| 16 | Ovary | 48% |
| 17 | Stomach | 48% |
| 18 | Spinal Cord | 47% |
| 19 | Placenta | 47% |
| 20 | Vitreous Humor | 47% |
| 21 | Blood Platelet | 47% |
| 22 | Prostate Gland | 47% |
| 23 | Retina | 47% |
| 24 | Salivary Gland | 47% |
| 25 | Uterus | 46% |
© 2019 by the authors. Licensee MDPI, Basel, Switzerland. This article is an open access article distributed under the terms and conditions of the Creative Commons Attribution (CC BY) license (http://creativecommons.org/licenses/by/4.0/).
Share and Cite
Perdigão, N.; Rosa, A. Dark Proteome Database: Studies on Dark Proteins. High-Throughput 2019, 8, 8. https://doi.org/10.3390/ht8020008
Perdigão N, Rosa A. Dark Proteome Database: Studies on Dark Proteins. High-Throughput. 2019; 8(2):8. https://doi.org/10.3390/ht8020008
Chicago/Turabian StylePerdigão, Nelson, and Agostinho Rosa. 2019. "Dark Proteome Database: Studies on Dark Proteins" High-Throughput 8, no. 2: 8. https://doi.org/10.3390/ht8020008
APA StylePerdigão, N., & Rosa, A. (2019). Dark Proteome Database: Studies on Dark Proteins. High-Throughput, 8(2), 8. https://doi.org/10.3390/ht8020008