Protein Adductomics: Methodologies for Untargeted Screening of Adducts to Serum Albumin and Hemoglobin in Human Blood Samples


Abstract
:
1. Introduction
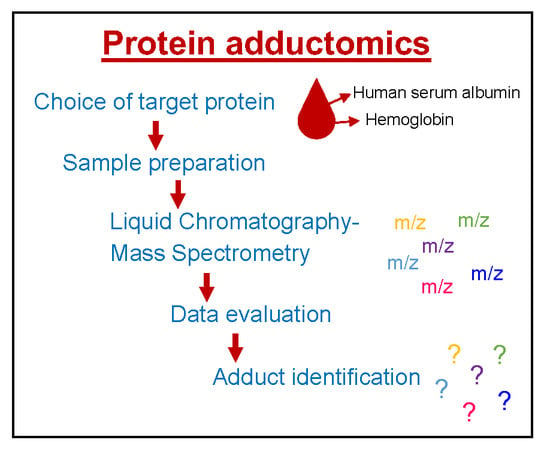
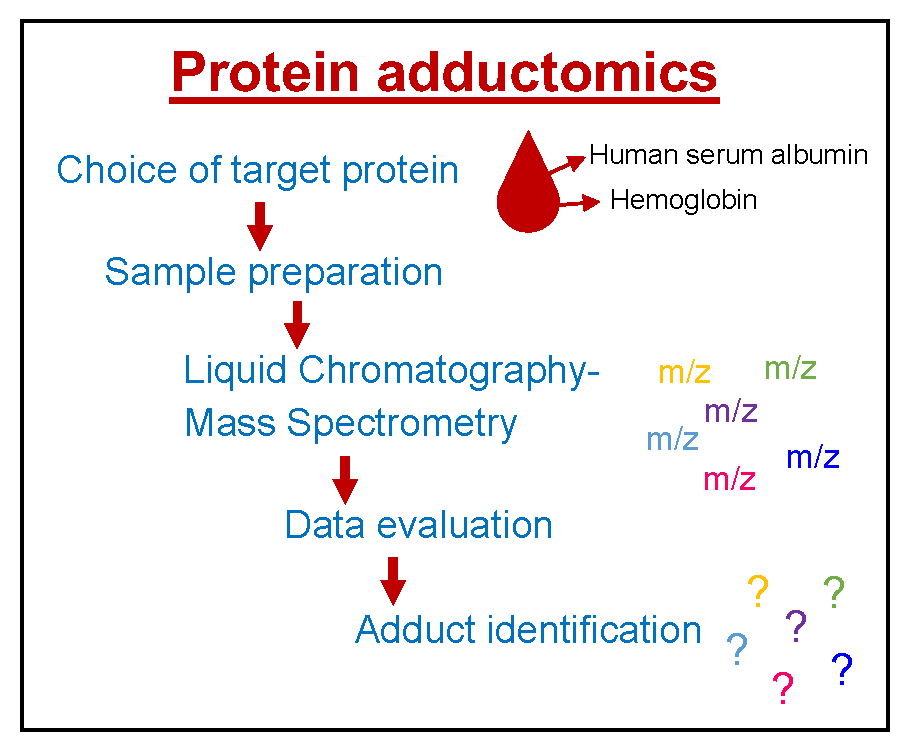
2. Choice of Target Proteins in Blood
3. Sample Preparation
4. Mass Spectrometry
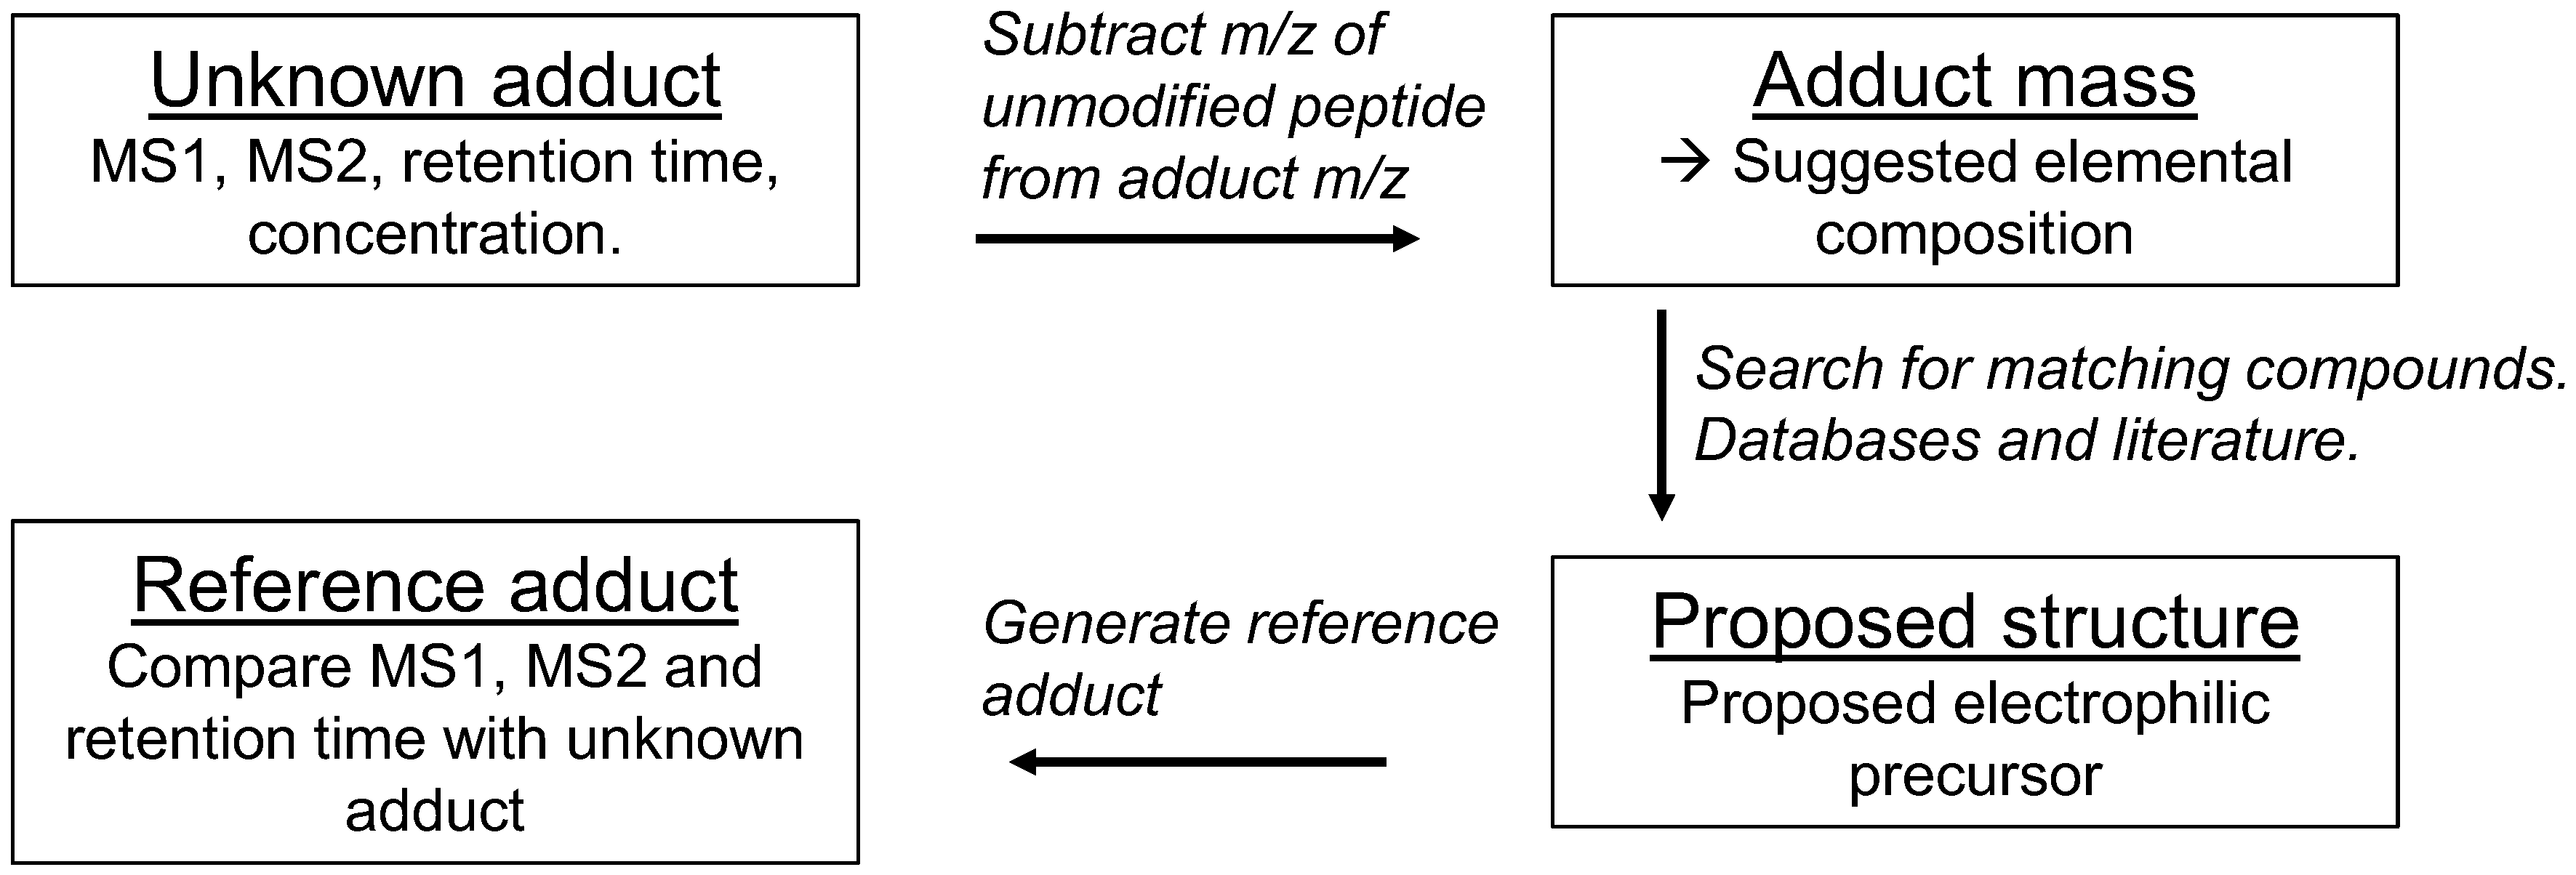
5. Data Evaluation
6. Identification of Adducts
7. Conclusions
Author Contributions
Funding
Conflicts of Interest
Abbreviations
| AA | acrylamide |
| ACN | acetonitrile |
| DIA | data independent acquisition |
| DDA | data-dependent acquisition |
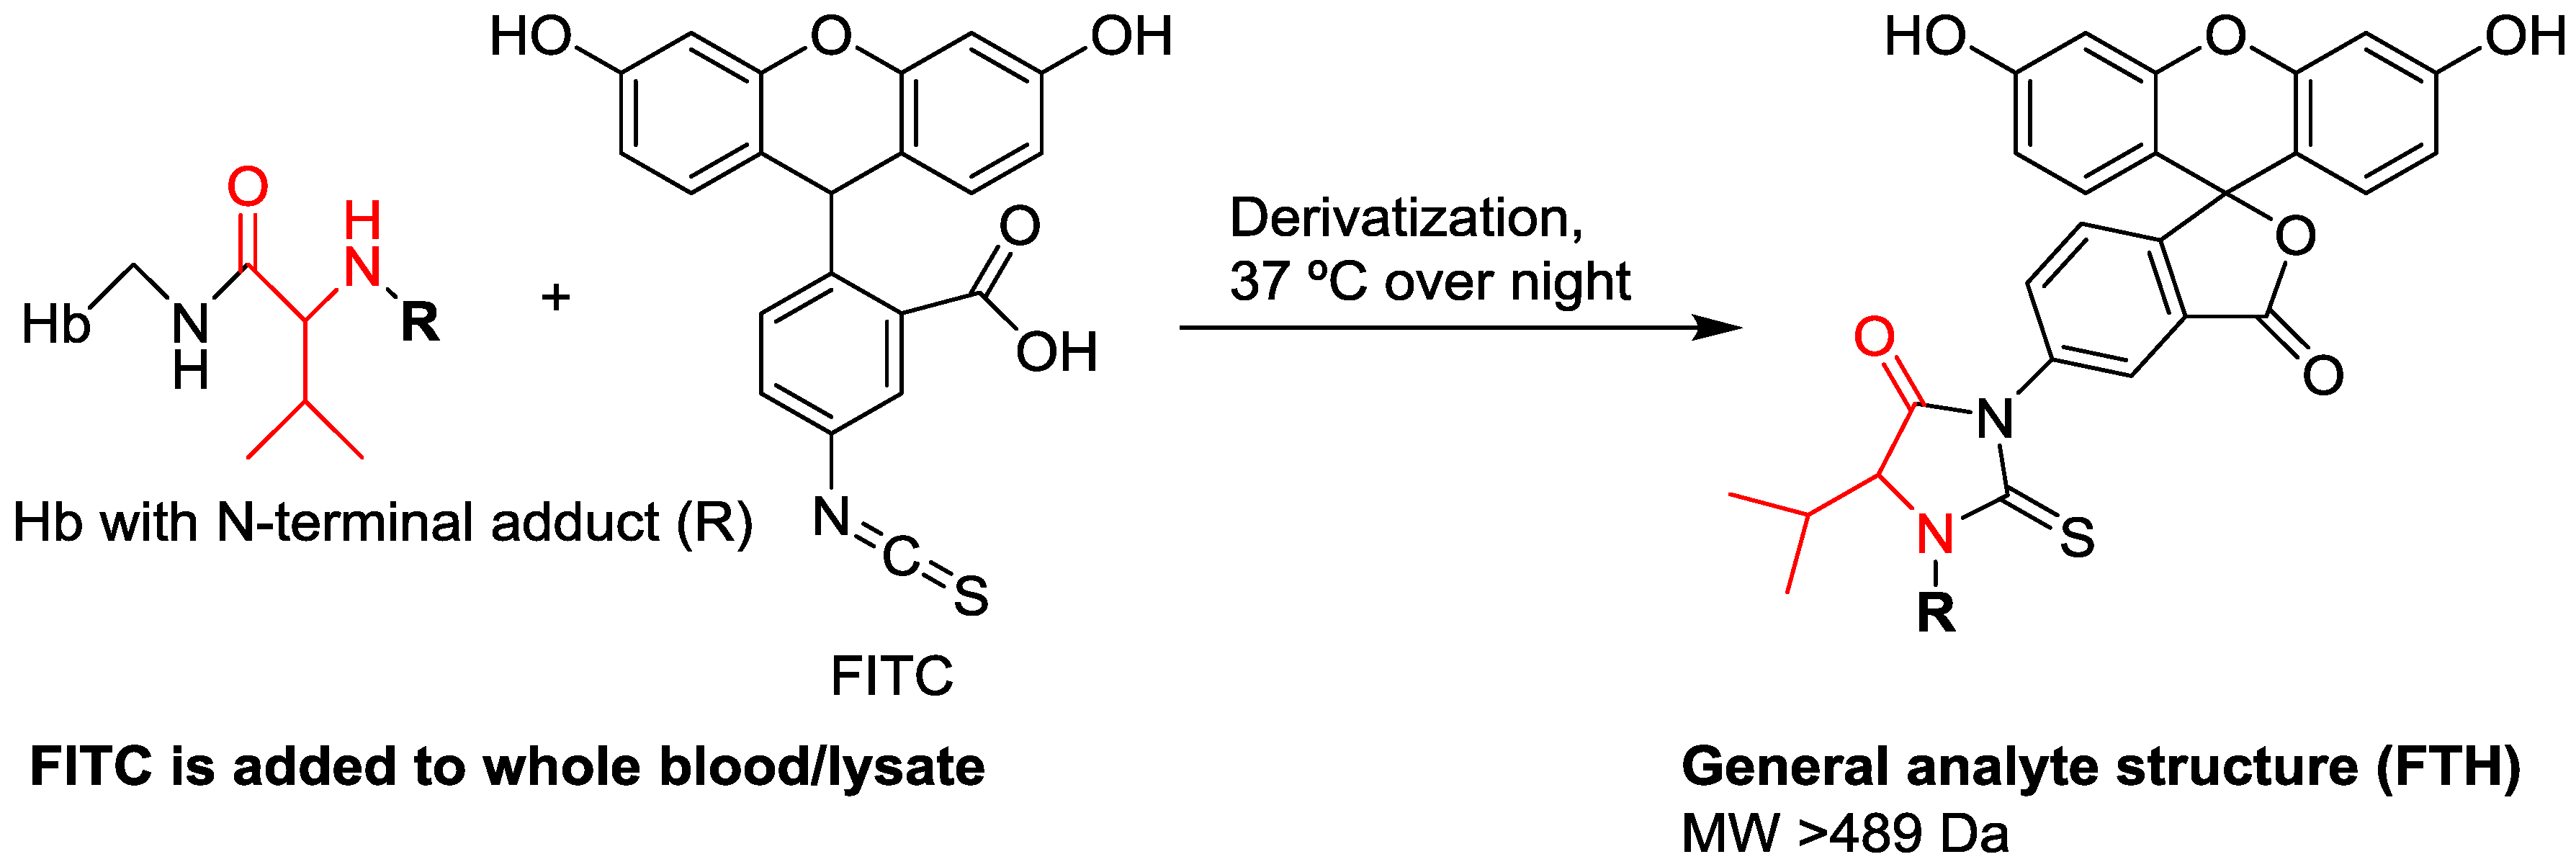
| FITC | fluorescein isothiocyanate |
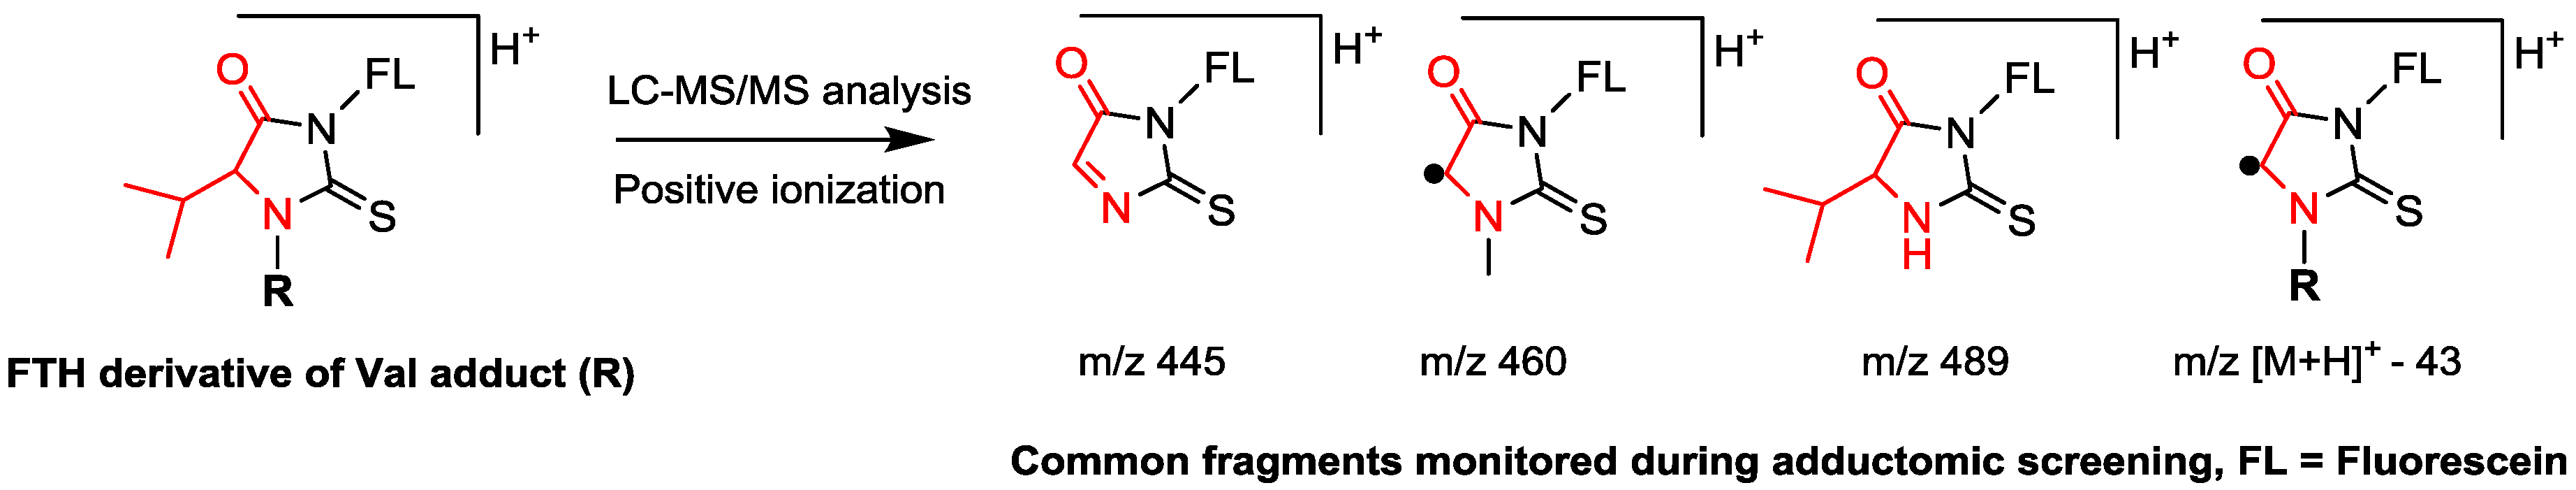
| FTH | fluorescein thiohydantoin |
| Hb | hemoglobin |
| HRMS | high-resolution mass spectrometry |
| HK | housekeeping peptide |
| HSA | human serum albumin |
| LC-MS | liquid chromatography-mass spectrometry |
| MS | mass spectrometry |
| MW | molecular weight |
| MIM | monoisotopic mass |
| MRM | multiple reaction monitoring |
| PAR | peak area ratio |
| RBC | red blood cells |
| SPE | solid phase extraction |
References
- Groth, U.; Neumann, H.G. The relevance of chemico-biological interactions for the toxic and carcinogenic effects of aromatic amines V. The pharmacokinetics of related aromatic amines in blood. Chem. Biol. Interact. 1972, 4, 409–419. [Google Scholar] [CrossRef]
- Ehrenberg, L.; Hiesche, K.D.; Osterman-Golkar, S.; Wennberg, I. Evaluation of genetic risks of alkylating agents: Tissue doses in the mouse from air contaminated with ethylene oxide. Mutat. Res. Mol. Mech. Mutagen. 1974, 24, 83–103. [Google Scholar] [CrossRef]
- Osterman-Golkar, S.; Ehrenberg, L.; Segerbäck, D.; Hällström, I. Evaluation of genetic risks of alkylating agents. II. Haemoglobin as a dose monitor. Mutat. Res. Mol. Mech. Mutagen. 1976, 34, 1–10. [Google Scholar] [CrossRef]
- Calleman, C.J.; Ehrenberg, L.; Jansson, B.; Osterman-Golkar, S.; Segerbäck, D.; Svensson, K.; Wachtmeister, C.A. Monitoring and risk assessment by means of alkyl groups in hemoglobin in persons occupationally exposed to ethylene oxide. J. Environ. Pathol. Toxicol. 1978, 2, 427–442. [Google Scholar] [PubMed]
- Törnqvist, M.; Osterman-Golkar, S.; Kautiainen, A.; Jensen, S.; Farmer, P.B.; Ehrenberg, L. Tissue doses of ethylene oxide in cigarette smokers determined from adduct levels in hemoglobin. Carcinogenesis 1986, 7, 1519–1521. [Google Scholar] [CrossRef] [PubMed]
- Sabbioni, G.; Jones, C.R. Biomonitoring of arylamines and nitroarenes. Biomarkers 2002, 7, 347–421. [Google Scholar] [CrossRef]
- Bryant, M.S.; Vineis, P.; Skipper, P.L.; Tannenbaum, S.R. Haemoglobin Adducts of Aromatic Amines in People Exposed to Cigarette Smoke; IARC Sci Publ.: Lyon, France, 1988; pp. 133–136. [Google Scholar]
- Bergmark, E.; Calleman, C.J.; He, F.S.; Costa, L.G. Determination of Hemoglobin Adducts in Humans Occupationally Exposed to Acrylamide. Toxicol. Appl. Pharmacol. 1993, 120, 45–54. [Google Scholar] [CrossRef]
- Bergmark, E. Hemoglobin Adducts of Acrylamide and Acrylonitrile in Laboratory Workers, Smokers and Nonsmokers. Chem. Res. Toxicol. 1997, 10, 78–84. [Google Scholar] [CrossRef]
- Rappaport, S.M.; Yeowell-O’Connell, K.; Bodell, W.; Yager, J.W.; Symanski, E. An investigation of multiple biomarkers among workers exposed to styrene and styrene-7,8-oxide. Cancer Res. 1996, 56, 5410–5416. [Google Scholar]
- Rappaport, S.M.; Waidyanatha, S.; Qu, Q.; Shore, R.; Jin, X.; Cohen, B.; Chen, L.C.; Melikian, A.A.; Li, G.; Yin, S.; et al. Albumin adducts of benzene oxide and 1,4-benzoquinone as measures of human benzene metabolism. Cancer Res. 2002, 62, 1330–1337. [Google Scholar]
- Tareke, E.; Rydberg, P.; Karlsson, P.; Eriksson, S.; Törnqvist, M. Analysis of acrylamide, a carcinogen formed in heated foodstuffs. J. Agric. Food Chem. 2002, 50, 4998–5006. [Google Scholar] [CrossRef]
- Scholl, P.F.; Turner, P.C.; Sutcliffe, A.E.; Sylla, A.; Diallo, M.S.; Friesen, M.D.; Groopman, J.D.; Wild, C.P. Quantitative comparison of aflatoxin B1 serum albumin adducts in humans by isotope dilution mass spectrometry and ELISA. Cancer Epidemiol. Biomark. Prev. 2006, 15, 823–826. [Google Scholar] [CrossRef]
- McCoy, L.F.; Scholl, P.F.; Sutcliffe, A.E.; Kieszak, S.M.; Powers, C.D.; Rogers, H.S.; Gong, Y.Y.; Groopman, J.D.; Wild, C.P.; Schleicher, R.L. Human aflatoxin albumin adducts quantitatively compared by ELISA, HPLC with fluorescence detection, and HPLC with isotope dilution mass spectrometry. Cancer Epidemiol. Biomark. Prev. 2008, 17, 1653–1657. [Google Scholar] [CrossRef]
- Rappaport, S.M.; Li, H.; Grigoryan, H.; Funk, W.E.; Williams, E.R. Adductomics: Characterizing exposures to reactive electrophiles. Toxicol. Lett. 2012, 213, 83–90. [Google Scholar] [CrossRef] [Green Version]
- Wild, C.P. Complementing the genome with an “exposome”: The outstanding challenge of environmental exposure measurement in molecular epidemiology. Cancer Epidemiol. Biomark. Prev. 2005, 14, 1847–1850. [Google Scholar] [CrossRef]
- Kanaly, R.A.; Hanaoka, T.; Sugimura, H.; Toda, H.; Matsui, S.; Matsuda, T. Development of the adductome approach to detect DNA damage in humans. Antioxid. Redox Signal. 2006, 8, 993–1001. [Google Scholar] [CrossRef]
- Li, H.; Grigoryan, H.; Funk, W.E.; Lu, S.S.; Rose, S.; Williams, E.R.; Rappaport, S.M. Profiling Cys34 adducts of human serum albumin by fixed-step selected reaction monitoring. Mol. Cell. Proteomics 2011, 10, M110.004606. [Google Scholar] [CrossRef]
- Carlsson, H.; Von Stedingk, H.; Nilsson, U.; Törnqvist, M. LC-MS/MS screening strategy for unknown adducts to N-terminal valine in hemoglobin applied to smokers and nonsmokers. Chem. Res. Toxicol. 2014, 27. [Google Scholar] [CrossRef]
- Carlsson, H.; Törnqvist, M. An Adductomic Approach to Identify Electrophiles In Vivo. Basic Clin. Pharmacol. Toxicol. 2017, 121. [Google Scholar] [CrossRef]
- Villalta, P.; Balbo, S. The Future of DNA Adductomic Analysis. Int. J. Mol. Sci. 2017, 18, 1870. [Google Scholar] [CrossRef]
- Enoch, S.J.; Ellison, C.M.; Schultz, T.W.; Cronin, M.T.D. A review of the electrophilic reaction chemistry involved in covalent protein binding relevant to toxicity. Crit. Rev. Toxicol. 2011, 41, 783–802. [Google Scholar] [CrossRef]
- Törnqvist, M.; Fred, C.; Haglund, J.; Helleberg, H.; Paulsson, B.; Rydberg, P. Protein adducts: Quantitative and qualitative aspects of their formation, analysis and applications. J. Chromatogr. B 2002, 778, 279–308. [Google Scholar] [CrossRef]
- Peters, T. All about Albumin: Biochemistry, Genetics, and Medical Applications; Academic Press: San Diego, CA, USA, 1996. [Google Scholar]
- Aldini, G.; Vistoli, G.; Regazzoni, L.; Gamberoni, L.; Facino, R.M.; Yamaguchi, S.; Uchida, K.; Carini, M. Albumin Is the Main Nucleophilic Target of Human Plasma: A Protective Role Against Pro-atherogenic Electrophilic Reactive Carbonyl Species? Chem. Res. Toxicol. 2008, 21, 824–835. [Google Scholar] [CrossRef]
- Stewart, A.J.; Blindauer, C.A.; Berezenko, S.; Sleep, D.; Tooth, D.; Sadler, P.J. Role of Tyr84 in controlling the reactivity of Cys34 of human albumin. FEBS J. 2005, 272, 353–362. [Google Scholar] [CrossRef]
- Balbo, S.; Turesky, R.J.; Villalta, P.W. DNA adductomics. Chem. Res. Toxicol. 2014, 27, 356–366. [Google Scholar] [CrossRef]
- Granath, F.; Ehrenberg, L.; Törnqvist, M. Degree of alkylation of macromolecules in vivo from variable exposure. Mutat. Res. Mol. Mech. Mutagen. 1992, 284, 297–306. [Google Scholar] [CrossRef]
- Furne, J.K.; Springfield, J.R.; Ho, S.B.; Levitt, M.D. Simplification of the end-alveolar carbon monoxide technique to assess erythrocyte survival. J. Lab. Clin. Med. 2003, 142, 52–57. [Google Scholar] [CrossRef]
- Lin, Y.S.; Kupper, L.L.; Rappaport, S.M. Air samples versus biomarkers for epidemiology. Occup. Environ. Med. 2005, 62, 750–760. [Google Scholar] [CrossRef] [Green Version]
- Rubino, F.M.; Pitton, M.; Di Fabio, D.; Colombi, A. Toward an “omic” physiopathology of reactive chemicals: Thirty years of mass spectrometric study of the protein adducts with endogenous and xenobiotic compounds. Mass Spectrom. Rev. 2009, 28, 725–784. [Google Scholar] [CrossRef]
- Garner, M.H.; Bogardt, R.A.; Gurd, F.R. Determination of the pK values for the alpha-amino groups of human hemoglobin. J. Biol. Chem. 1975, 250, 4398–4404. [Google Scholar]
- Yeowell-O’Connell, K.; McDonald, T.A.; Rappaport, S.M. Analysis of Hemoglobin Adducts of Benzene Oxide by Gas Chromatography–Mass Spectrometry. Anal. Biochem. 1996, 237, 49–55. [Google Scholar] [CrossRef]
- Michelet, F.; Gueguen, R.; Leroy, P.; Wellman, M.; Nicolas, A.; Siest, G. Blood and plasma glutathione measured in healthy subjects by HPLC: Relation to sex, aging, biological variables, and life habits. Clin. Chem. 1995, 41, 1509–1517. [Google Scholar]
- Lindstrom, A.B.; Yeowell-O’Connell, K.; Waidyanatha, S.; McDonald, T.A.; Golding, B.T.; Rappaport, S.M. Formation of hemoglobin and albumin adducts of benzene oxide in mouse, rat, and human blood. Chem. Res. Toxicol. 1998, 11, 302–310. [Google Scholar] [CrossRef]
- Grigoryan, H.; Edmands, W.; Lu, S.S.; Yano, Y.; Regazzoni, L.; Iavarone, A.T.; Williams, E.R.; Rappaport, S.M. Adductomics Pipeline for Untargeted Analysis of Modifications to Cys34 of Human Serum Albumin. Anal. Chem. 2016, 88, 10504–10512. [Google Scholar] [CrossRef]
- Carlsson, H.; Aasa, J.; Kotova, N.; Vare, D.; Sousa, P.F.M.; Rydberg, P.; Abramsson-Zetterberg, L.; Törnqvist, M. Adductomic Screening of Hemoglobin Adducts and Monitoring of Micronuclei in School-Age Children. Chem. Res. Toxicol. 2017, 30. [Google Scholar] [CrossRef]
- Yano, Y.; Grigoryan, H.; Schiffman, C.; Edmands, W.; Petrick, L.; Hall, K.; Whitehead, T.; Metayer, C.; Dudoit, S.; Rappaport, S. Untargeted adductomics of Cys34 modifications to human serum albumin in newborn dried blood spots. Anal. Bioanal. Chem. 2019, 1–12. [Google Scholar] [CrossRef]
- Jensen, S.; Törnqvist, M.; Ehrenberg, L. Hemoglobin as a Dose Monitor of Alkylating Agents Determination of Alkylation Products of N-Terminal Valine. Individ Susceptibility Genotoxic Agents Hum. Popul. 1984, 30, 315–320. [Google Scholar] [CrossRef]
- Törnqvist, M.; Mowrer, J.; Jensen, S.; Ehrenberg, L. Monitoring of environmental cancer initiators through hemoglobin adducts by a modified Edman degradation method. Anal. Biochem. 1986, 154, 255–266. [Google Scholar] [CrossRef]
- Rydberg, P.; Lüning, B.; Wachtmeister, C.A.; Eriksson, L.; Törnqvist, M. Applicability of a modified Edman procedure for measurement of protein adducts: Mechanisms of formation and degradation of phenylthiohydantoins. Chem. Res. Toxicol. 2002, 15, 570–581. [Google Scholar] [CrossRef]
- Rydberg, P.; von Stedingk, H.; Magnér, J.; Björklund, J. LC/MS/MS Analysis of N-Terminal Protein Adducts with Improved Sensitivity: A Comparison of Selected Edman Isothiocyanate Reagents. Int. J. Anal. Chem. 2009, 2009, 153472. [Google Scholar] [CrossRef]
- Rydberg, P. Method for Analyzing N-Terminal Protein Adducts Using Isothiocyanate Reagents. U.S. Patent WO/2005/101020, 13 April 2005. [Google Scholar]
- Von Stedingk, H.; Rydberg, P.; Törnqvist, M. A new modified Edman procedure for analysis of N-terminal valine adducts in hemoglobin by LC-MS/MS. J. Chromatogr. B Anal. Technol. Biomed. Life Sci. 2010, 878, 2483–2490. [Google Scholar] [CrossRef]
- Mowrer, J.; Törnqvist, M.; Jensen, S.; Ehrenberg, L. Modified Edman degradation applied to hemoglobin for monitoring occupational exposure to alkylating agents. Toxicol. Environ. Chem. 1986, 11, 215–231. [Google Scholar] [CrossRef]
- Pedersen, M.; Von Stedingk, H.; Botsivali, M.; Agramunt, S.; Alexander, J.; Brunborg, G.; Chatzi, L.; Fleming, S.; Fthenou, E.; Granum, B.; et al. Birth weight, head circumference, and prenatal exposure to acrylamide from maternal diet: The European prospective mother-child study (NewGeneris). Environ. Health Perspect. 2012, 120, 1739–1745. [Google Scholar] [CrossRef]
- Hayes, J. adductomicsR. Available online: https://github.com/JosieLHayes/adductomicsR (accessed on 26 February 2019).
- Von Stedingk, H.; Vikström, A.C.; Rydberg, P.; Pedersen, M.; Nielsen, J.K.; Segerbäck, D.; Knudsen, L.E.; Törnqvist, M. Analysis of hemoglobin adducts from acrylamide, glycidamide, and ethylene oxide in paired mother/cord blood samples from Denmark. Chem. Res. Toxicol. 2011, 24, 1957–1965. [Google Scholar] [CrossRef]
- Von Stedingk, H.; Davies, R.; Rydberg, P.; Törnqvist, M. Methyl vinyl ketone-Identification and quantification of adducts to N-terminal valine in human hemoglobin. J. Chromatogr. B Anal. Technol. Biomed. Life Sci. 2010, 878, 2491–2496. [Google Scholar] [CrossRef]
- Carlsson, H.; Motwani, H.V.; Osterman Golkar, S.; Törnqvist, M. Characterization of a Hemoglobin Adduct from Ethyl Vinyl Ketone Detected in Human Blood Samples. Chem. Res. Toxicol. 2015, 28, 2120–2129. [Google Scholar] [CrossRef]
- Aasa, J.; Abramsson-Zetterberg, L.; Carlsson, H.; Törnqvist, M. The genotoxic potency of glycidol established from micronucleus frequency and hemoglobin adduct levels in mice. Food Chem. Toxicol. 2017, 100, 168–174. [Google Scholar] [CrossRef]
- Degner, A.; Carlsson, H.; Karlsson, I.; Eriksson, J.; Pujari, S.S.; Tretyakova, N.Y.; Törnqvist, M. Discovery of Novel N-(4-Hydroxybenzyl)valine Hemoglobin Adducts in Human Blood. Chem. Res. Toxicol. 2018, 31, 1305–1314. [Google Scholar] [CrossRef]
- Lu, S.S.; Grigoryan, H.; Edmands, W.M.B.; Hu, W.; Iavarone, A.T.; Hubbard, A.; Rothman, N.; Vermeulen, R.; Lan, Q.; Rappaport, S.M. Profiling the Serum Albumin Cys34 Adductome of Solid Fuel Users in Xuanwei and Fuyuan, China. Environ. Sci. Technol. 2017, 51, 46–57. [Google Scholar] [CrossRef]
- Liu, S.; Grigoryan, H.; Edmands, W.M.B.; Dagnino, S.; Sinharay, R.; Cullinan, P.; Collins, P.; Chung, K.F.; Barratt, B.; Kelly, F.J.; et al. Cys34 Adductomes Differ between Patients with Chronic Lung or Heart Disease and Healthy Controls in Central London. Environ. Sci. Technol. 2018, 52, 2307–2313. [Google Scholar] [CrossRef]
- Grigoryan, H.; Edmands, W.M.B.; Lan, Q.; Carlsson, H.; Vermeulen, R.; Zhang, L.; Yin, S.N.; Li, G.L.; Smith, M.T.; Rothman, N.; et al. Adductomic signatures of benzene exposure provide insights into cancer induction. Carcinogenesis 2018, 39, 661–668. [Google Scholar] [CrossRef]
- Grigoryan, H.; Li, H.; Iavarone, A.T.; Williams, E.R.; Rappaport, S.M. Cys34 Adducts of Reactive Oxygen Species in Human Serum Albumin. Chem. Res. Toxicol. 2012, 25, 1633–1642. [Google Scholar] [CrossRef] [Green Version]
- Carlsson, H.; Törnqvist, M. Strategy for identifying unknown hemoglobin adducts using adductome LC-MS/MS data: Identification of adducts corresponding to acrylic acid, glyoxal, methylglyoxal, and 1-octen-3-one. Food Chem. Toxicol. 2016, 92, 94–103. [Google Scholar] [CrossRef]
- ChemCalc. Molecular Formula Finder. Available online: http://www.chemcalc.org/mf_finder (accessed on 26 February 2019).
- Kautiainen, A.; Fred, C.; Rydberg, P.; Törnqvist, M. A liquid chromatography tandem mass spectrometric method for in vivo dose monitoring of diepoxybutane, a metabolite of butadiene. Rapid Commun. Mass Spectrom. 2000, 14, 1848–1853. [Google Scholar] [CrossRef]
- Sriramachari, S.; Chandra, H. The lessons of Bhopal [toxic] MIC gas disaster scope for expanding global biomonitoring and environmental specimen banking. Chemosphere 1997, 34, 2237–2250. [Google Scholar] [CrossRef]
- Angerer, J.; Göen, T.; Krämer, A.; Käfferlein, H.U. N-methylcarbamoyl adducts at the N-terminal valine of globin in workers exposed to, N,N-dimethylformamide. Arch. Toxicol. 1998, 72, 309–313. [Google Scholar] [CrossRef]
- Molecular Weight Search. Available online: http://webbook.nist.gov/chemistry/mw-ser.html (accessed on 26 February 2019).
- Unimod. Available online: http://www.unimod.org/modifications_list.php (accessed on 26 February 2019).
- Human Metabolome Database. Available online: http://www.hmdb.ca/metabolites (accessed on 26 February 2019).
- Toxic Exposome Database, T3DB. Available online: http://www.t3db.ca/ (accessed on 26 February 2019).
- Neveu, V.; Moussy, A.; Rouaix, H.; Wedekind, R.; Pon, A.; Knox, C.; Wishart, D.S.; Scalbert, A. Exposome-Explorer: A manually-curated database on biomarkers of exposure to dietary and environmental factors. Nucleic Acids Res. 2017, 45, D979–D984. [Google Scholar] [CrossRef]
- Rattray, N.J.W.; Deziel, N.C.; Wallach, J.D.; Khan, S.A.; Vasiliou, V.; Ioannidis, J.P.A.; Johnson, C.H. Beyond genomics: Understanding exposotypes through metabolomics. Hum. Genom. 2018, 12, 4. [Google Scholar] [CrossRef]
- Törnqvist, M. Formation of reactive species that lead to hemoglobin adducts during storing of blood samples. Carcinogenesis 1990, 11, 51–54. [Google Scholar] [CrossRef]


| Property | Human Hemoglobin | Human Serum Albumin |
|---|---|---|
| Molecular weight | Tetramer, 64 kDa. Composed of two α- and two β-subunits (in adult Hb), both weighing 16 kDa | 67 kDa |
| Main functions | Oxygen transport | Transport of e.g., hormones and fatty acids, maintains oncotic pressure, antioxidant. |
| Localization | Red blood cells | Blood plasma |
| Conc (mg/mL) | 120–160 (in blood) | 35–55 (in serum) |
| Turnover rate (days) | ~120 (lifespan of red blood cells) | ~20 (half-life in serum) |
| Methodological Aspect | Hb Adductomics | HSA Adductomics |
|---|---|---|
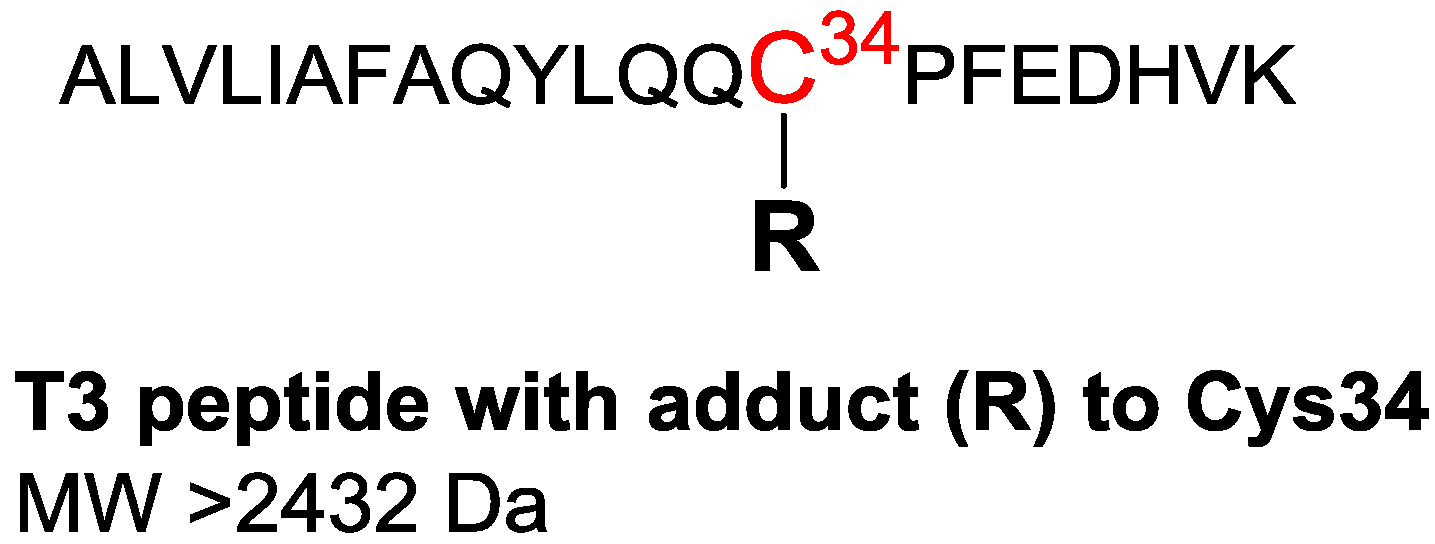
| Nucleophilic site | N-terminal Val | Cys34 |
| Sample volume | 250 µL whole blood/lysate | 5 µL plasma/serum |
| Enrichment of adducts | Detachment of adducts using the reagent fluorescein isothiocyanate, followed by clean-up using solid phase extraction | Precipitation of non-HSA proteins, followed by tryptic digestion |
| Analytes | Fluorescein thiohydantoin derivatives of adducted Val | Tryptic peptide containing the adducted Cys34 residue |
| MW of analytes | >502 Da (starting at the MW of the methyl adduct) | >2432 Da (analyzed as triply charged positive ions) |
| Analytical method | Liquid chromatography-mass spectrometry (LC-MS)/high-resolution MS (LC-HRMS) | Nano-liquid chromatography-high-resolution mass spectrometry (nLC-HRMS) |
| Type of LC column | Reversed phase, C18, 120 µL/min | Monolithic, 750 nL/min |
| Type of MS and MS method | MS: Triple quadropole in multiple reaction monitoring mode; HRMS: Orbitrap in data independent acquisition mode | HRMS: Orbitrap in data dependent acquisition mode |
| Adduct | Ret. Time (min) | MIM Observed (m/z, +3) | Added Mass (Da) | Suggested Elemental Composition of Added Mass (to Cys34S−) | Annotation |
|---|---|---|---|---|---|
| 796.43 a,b,d | 27.5 | 796.4309 | −45.9913 | −CH2S | Cys34→Gly |
| 800.43 a,b,d | 28.4 | 800.4317 | −33.9873 | −SH2 | Cys34→Dehydroalanine |
| 805.76 a,b,d,e | 27.2 | 805.7632 | −17.9965 | −SH2, +O | Cys34→Oxoalanine |
| 808.73 a,b,c,d | 28.3 | 808.7306 | −9.0923 | Not Cys34 adduct | |
| 810.45 a,c | 30.5 | 810.4536 | −3.9280 | Not Cys34 adduct | |
| 811.43 a,b,c,d | 30.4 | 811.4254 | 2431.2480 | +C114H172N27O30S | T3 Dimer f |
| 811.76_1 a,b,c,d | 27.9 | 811.7608 | 1.0072 | +H | T3 Labile adduct |
| 811.76_2 a,b,c,d,e | 28.6 | 811.7609 | 1.0097 | +H | Unmodified T3 f |
| 816.42 a,b,c,d,e | 27.8 | 816.4200 | 13.9766 | −H2, +O | S-Monooxidation f |
| 816.43 a,b,c,d,e | 29.1 | 816.4321 | 15.0233 | +CH3 | Methylation (not at Cys34) |
| 820.09 a,c,d | 28.8 | 820.0920 | 25.9995 | +CN | S-Cyanylation |
| 822.42 a,b,c,d,e | 27.7 | 822.4236 | 32.9946 | +HO2 | S-Dioxidation f |
| 823.39 a | 27.2 | 823.3971 | 35.9173 | Not Cys34 adduct | |
| 825.76 d | 26.7 | 825.7644 | 43.0188 | +C2H3O | S-Acetylation |
| 826.10 d | 26.7 | 826.0990 | 44.0226 | +C2H4O | Unknown (likely S-addition of an aldehyde) |
| 826.44 a | 27.9 | 826.4358 | 45.0332 | +C2H5O | Ethylene oxide adduct |
| 827.09 b,d | 28.8 | 827.0901 | 46.9960 | +CH3S | S-Methylthiolation |
| 827.09 c | 30.1 | 827.0946 | 47.0022 | +HO2 + CH2 | Cys34 sulfinic acid plus methylation (not Cys34) |
| 827.1 d | 27.5 | 827.0958 | 47.0129 | +CH3O2 | S-(O)-O-CH3 |
| 827.76 a,b,c,d,e | 28.0 | 827.7550 | 48.9889 | +HO3 | S-Trioxidation f |
| 829.13 a | 27.4 | 829.1264 | 53.1052 | Not Cys34 adduct | |
| 829.40 a,b | 28.6 | 829.3972 | 53.9177 | Not Cys34 adduct | |
| 829.44 a | 28.9 | 829.4369 | 54.0366 | +C3H4N | Acrylonitrile adduct |
| 830.41 d | 26.5 | 830.4059 | 56.9433 | Unknown | |
| 830.44 d | 27.3 | 830.4359 | 57.0333 | +C3H5O | Unknown (likely S-addition of an aldehyde) |
| 830.77 a | 27.5 | 830.7685 | 58.0313 | +C2H4NO | Methylisocyanate adduct |
| 833.08 d | 27.8 | 833.0813 | 64.9696 | +HO2S | S-Addition of SO2 |
| 835.11 a, d | 28.2 | 835.1079 | 71.0494 | +C4H7O | S-Addition of crotonaldehyde f |
| 837.10 d,e | 27.4 | 837.1041 | 77.0380 | +C6H5 | S-Phenylation |
| 839.78 d,e | 27.7 | 839.7797 | 85.0647 | +C5H9O | S-Addition of tiglic aldehyde f |
| 841.10 b,c | 28.5 | 841.0987 | 89.0183 | +C3H5O3 | S-Addition of pyruvate or malonate semialdehyde |
| 841.43 a | 27.8 | 841.4251 | 90.0013 | +C2H4NOS | S-Mercaptoacetamide |
| 841.75 a,b,c,d | 28.6 | 841.7529 | 90.9827 | +C2H3O2S | S-Addition of mercaptoacetic acid |
| 845.42 a,b,c,d | 27.7 | 845.4249 | 101.9987 | +C3H4NOS | S-Addition of Cys (-H2O) |
| 845.75 b | 28.6 | 845.7528 | 102.9842 | +C3H3O2S | S-Cys (possibly NH2 → OH, −H2O) |
| 847.10 d | 26.7 | 847.0963 | 107.0145 | +C3H7O2S | S-Methylethyl-sulfonylation |
| 847.11 a,b,c | 30.2 | 847.1082 | 107.0481 | +C7H7O | S-Addition of benzaldehyde or quinone methide |
| 847.77 a,b | 27.3 | 847.7664 | 109.0251 | Cys34 Adduct with unknown annotation | |
| 849.07 a,b,d | 28.0 | 849.0698 | 112.9353 | +HO3S2 | S-Addition of S2O3H |
| 850.10 a,b,d | 27.9 | 850.0975 | 116.0182 | +C4H6NOS | S-Addition of hCys (-H2O) |
| 851.43 a,b,c,d | 26.9 | 851.4290 | 120.0109 | +C3H6NO2S | S-Addition of Cys f |
| 851.76 a,b,c,d | 27.8 | 851.7572 | 120.9973 | +C3H5O3S | S-Addition of Cys (NH2→OH) |
| 853.78 a,b | 27.7 | 853.7839 | 127.0776 | Cys34 Adduct with unknown annotation | |
| 854.44 d | 25.9 | 854.4428 | 129.0539 | +C6H9O3 | S-Addition of BDE |
| 855.44 b | 29.0 | 855.4373 | 132.0378 | +C8H6NO | Oxindole |
| 856.10_1 a,b,c,d | 27.0 | 856.1003 | 134.0250 | +C4H8NO2S | S-Addition of hCys f |
| 856.10_2 a,b,c,d | 27.3 | 856.1001 | 134.0244 | +C4H8NO2S | S-Addition of hCys f |
| 856.43 d | 27.2 | 856.4287 | 135.0117 | +C4H7O3S | S-Addition of hCys (NH2→OH) |
| 857.09 c | 29.0 | 857.0876 | 136.9812 | Unknown | |
| 857.1 a,b,d | 27.4 | 857.1000 | 137.0257 | Unknown | |
| 859.41 d | 25.5 | 859.4085 | 143.9513 | Unknown | |
| 860.77 b,c | 29.3 | 860.7717 | 148.0342 | +C4H8NO2S + CH2 | S-hCys, plus methylation (not Cys34) |
| 862.09 a,d | 26.3 | 862.0881 | 151.9901 | Not Cys34 adduct | |
| 864.08 a,b,d | 26.2 | 864.0772 | 157.9574 | Not Cys34 adduct | |
| 864.43 a,b,c,d | 27.5 | 864.4319 | 159.0198 | +C5H7N2O2S | S-Addition of CysGly (-H2O) |
| 865.43 a,b,c | 28.3 | 865.4314 | 162.0176 | +C5H8NO3S | S-(N-acetyl)Cys |
| 866.76 b | 27.0 | 866.7572 | 165.9973 | +C4H8NO2S2 | S-S-hCys trisulfide |
| 870.44 a,b,c,d | 26.5 | 870.4360 | 177.0319 | +C5H9N2O3S | S-Addition of CysGly f |
| 872.7309 a | 26.7 | 872.7309 | 183.9187 | Not Cys34 adduct | |
| 870.44 a,b,d | 27.2 | 873.4310 | 186.0187 | Unknown | |
| 875.11 b,c | 27.5 | 875.1062 | 191.0409 | +C5H9N2O3S + CH2 | S-CysGly, plus methylation (not Cys34) |
| 875.42 b | 27.7 | 875.4231 | 191.9950 | Cys34 Adduct with unknown annotation | |
| 894.13 b,c | 26.1 | 894.1270 | 248.1029 | Unknown | |
| 894.44 a,b,c,d | 27.0 | 894.4426 | 249.0516 | +C8H13N2O5S | S-Addition of GluCys f |
| 899.11 c | 29.3 | 899.1140 | 263.0612 | Unknown | |
| 913.45 a,b,c,d | 26.9 | 913.4494 | 306.0722 | +C10H16N3O6S | S-Addition of GSH f |
| 918.12 c | 29.2 | 918.1222 | 320.0852 | Unknown | |
| 927.14 c | 27.1 | 927.1408 | 347.1412 | Unknown | |
| 928.78 c | 32.2 | 928.7842 | 352.0712 | Unknown | |
| 931.82 b,c,d | 25.9 | 931.8215 | 361.1881 | Unknown | |
| 941.16 b | 25.3 | 941.1570 | 389.1967 | Unclear modification site | |
| 965.49 b,c,d | 25.8 | 965.4920 | 462.1994 | Unknown | |
| 970.16 c | 28.1 | 970.1643 | 476.2112 | Unknown c | |
| 974.51 b,d | 25.1 | 974.5068 | 489.2460 | Unknown | |
| 976.82 b,c | 28.0 | 976.8205 | 496.1840 | Unknown | |
| 981.50 b | 25.3 | 981.4956 | 510.2126 | Cys34 adduct with unknown annotation |
| [M+H]+ m/z | Identity/Precursor a | rt (min) | Added Mass (Da) to Val-NH | Elemental Composition |
|---|---|---|---|---|
| 503.1 b, c | Methylation | 16.6 | 15 | CH3 |
| 517.1 b, c | Ethylation | 17.9 | 29 | C2H5 |
| 519.1 c | Unknown | 12.3 | 31 | Unknown |
| 519.1 c | Unknown | 15.7 | 31 | Unknown |
| 533.1 b, c | Ethylene oxide | 14.1 | 45 | C2H5O |
| 542.1 b | Acrylonitrile d | 18.0 | 54 | C3H4N |
| 547.1 b, c | Carboxy-methylation/Glyoxal | 14.2 | 59 | C2H3O2 |
| 559.1 b, c | Methyl vinyl ketone | 16.6 | 71 | C4H7O |
| 560.1 b, c | Acrylamide | 12.9 | 72 | C3H6NO |
| 561.1 b, c | Acrylic acid/Carboxyethylation | 14.5 | 73 | C3H5O2 |
| 561.1 c | Methylglyoxal | 12.6 | 73 | C3H5O2 |
| 563.1 c | Glycidol | 12.4 | 75 | C3H7O2 |
| 573.1 b, c | Ethyl vinyl ketone | 18.1 | 85 | C5H9O |
| 576.1 b | Glycidamide | 12.2 | 88 | C3H6NO2 |
| 577.1 b, c | Unknown | 13.0 | 89 | Unknown |
| 593.1 b, c | Unknown | 11.3 | 105 | Unknown |
| 595.1 c | Unknown | 15.1 | 107 | Unknown |
| 595.1 b,c | 4-Hydroxybenzyl | 17.00 | 107 | C7H7O |
| 615.1 b,c | 1-Octen-3-one | 22.2 | 127 | C8H15O |
| 617.1 b,c | Unknown | 14.8 | 129 | Unknown |
| 625.1 b,c | Unknown | 13.9 | 137 | Unknown |
| 631.1 b,c | Unknown | 15.2 | 143 | Unknown |
| 651.1 c | Unknown | 11.2 | 163 | Unknown |
| 659.1 c | Unknown | 16.4 | 171 | Unknown |
| 686.1 c | Unknown | 11.2 | 198 | Unknown |
© 2019 by the authors. Licensee MDPI, Basel, Switzerland. This article is an open access article distributed under the terms and conditions of the Creative Commons Attribution (CC BY) license (http://creativecommons.org/licenses/by/4.0/).
Share and Cite
Carlsson, H.; Rappaport, S.M.; Törnqvist, M. Protein Adductomics: Methodologies for Untargeted Screening of Adducts to Serum Albumin and Hemoglobin in Human Blood Samples. High-Throughput 2019, 8, 6. https://doi.org/10.3390/ht8010006
Carlsson H, Rappaport SM, Törnqvist M. Protein Adductomics: Methodologies for Untargeted Screening of Adducts to Serum Albumin and Hemoglobin in Human Blood Samples. High-Throughput. 2019; 8(1):6. https://doi.org/10.3390/ht8010006
Chicago/Turabian StyleCarlsson, Henrik, Stephen M. Rappaport, and Margareta Törnqvist. 2019. "Protein Adductomics: Methodologies for Untargeted Screening of Adducts to Serum Albumin and Hemoglobin in Human Blood Samples" High-Throughput 8, no. 1: 6. https://doi.org/10.3390/ht8010006
APA StyleCarlsson, H., Rappaport, S. M., & Törnqvist, M. (2019). Protein Adductomics: Methodologies for Untargeted Screening of Adducts to Serum Albumin and Hemoglobin in Human Blood Samples. High-Throughput, 8(1), 6. https://doi.org/10.3390/ht8010006