Abstract
Introduction: Genes in the endolysosome and autophagy pathways are major contributors to hereditary spastic paraplegia (HSP). A pathogenetic link between HSP and Alzheimer disease (AD) involving macroautophagy is well established. Sortilin-related receptor 1 (SORL1), an endosomal trafficking protein, plays a key role in glutamatergic neuron homeostasis and white matter tract integrity. Until now, SORL1 has only been associated with dominant AD and cerebral amyloid angiopathy. Methods: A case of HSP with cerebroretinal vasculopathy (CRV) negative on exome sequencing was further investigated using whole-genome sequencing. RNA-seq, Western blot, and immunofluorescence imaging were performed to explore a potential loss-of-function mechanism. Results: Sequencing revealed a biallelic SORL1 splice donor variant (c.1211 + 1G > A). Transcriptomics confirmed nonsense-mediated decay and aberrant splicing, predicting a disrupted reading frame. Reduced SORLA protein levels and significant enlargement of endolysosomes in patient-derived fibroblasts further cemented the pathogenicity of the variant. Conclusions: The probability that SORL1 acts as a recessive disease-causing gene gathers support from the following data: SORL1 genomic constraint score pRec = 1, high meiotic recombination rates on the locus, phenotype of Sorl1−/− mice reminiscent of HSP with CRV, and endolysosomal enlargement in SORL1−/− glutamatergic neurons in vitro. Taken together, SORL1 is probably a new candidate for a recessive form of complicated HSP.
1. Introduction
Hereditary Spastic Paraplegia (HSP) is a designation given to a constellation of symptoms characterised predominantly by weakness and spasticity of the lower limbs. HSP is a heterogeneous group of Mendelian disorders that is pan-ethnic and has a collective prevalence of 2–5 per 100,000 [1]. It is clinically categorised into pure/uncomplicated and complex/complicated types, with variable ages of onset. In all forms of HSPs, there is axonal degeneration of the corticospinal tract and its cell bodies. There can be a variable involvement of Fasciculus Gracilis. Substantial intra- and inter-familial variation in the phenotype is well known, even among the carriers of the same pathogenic variant [2]. Hence, accurate genotype–phenotype correlation is challenging. Moreover, there is a growing recognition of a substantial overlap between HSP and categories otherwise considered distinct traditionally, such as inherited ataxias (spastic-ataxias), extrapyramidal disorders (Parkinsonian–pyramidal syndromes), dementias, and others.
Of the 150 HSP-linked genes, 70 have been definitively confirmed, while the others remain candidates [3]. Causative genes are involved in any one of the diverse cellular pathways, such as axonal transport, endosomal trafficking, etc. One such biological process, responsible for at least 24 subtypes of HSP is the endolysosome and autophagy pathway [3]. Its role in several neurodegenerative disorders involving the motor neuron, such as HSP, amyotrophic lateral sclerosis (ALS), and Charcot–Marie–Tooth (CMT) disease, is beyond doubt. The classical examples are SPG11, KIF1A, KIF5A, VCP, and spastacin-related disorders. Since post mitotic differentiated neurons cannot divide, to preserve viability during stress, they rely heavily on the endolysosome and autophagy pathway [4]. They does so through precise cargo delivery through membrane trafficking and degradation, thus ensuring the removal of cytotoxic macromolecules or undesirable organelles. Hence, any malfunctioning of the endolysosome and autophagy pathways may promote neuronal dysfunction and death, thereby precipitating neurodegenerative disorders.
The protein SORLA (Sorting-related receptor with A-type repeats), a member of the VPS10 domain receptor family, is a key player in the endolysosome and autophagy pathways. It is involved in the sorting and recycling of Amyloid Precursor Protein (APP). SORLA is encoded by the gene Sortilin-related receptor 1 (SORL1). In conjunction with other retromer complexes, SORLA transports APP to the trans-Golgi network (TGN) or recycles APP to the plasma membrane from early endosomes, preventing the detrimental amyloidogenic pathway [4]. SORL1 has a well-established association with the dominant form of familial Alzheimer disease (AD) and cerebral amyloid angiopathy (CAA) [5,6,7]. Glutamatergic neurons derived from human-induced pluripotent stem cells (hiPSCs) of AD patients with heterozygous loss-of-function variants (LOF) have enlarged endosomes, a pathological hallmark of AD [8]. Enlarged endosomes are a result of the clogging of endolysosome and autophagy pathways by the amyloidogenic products [9]. However, recent in vitro studies have suggested a more severe molecular phenotype in the homozygous knockout (KO) of SORL1 [8]. Parting AD and CAA, no other clinical phenotypes have been described so far with SORL1, especially in a recessive fashion.
Recently, there has been mounting evidence for the phenotypic overlap between HSP and AD, along with an established pathogenetic link [10]. Several genes, such as PSEN1, ALS2, SPART, SPG11, etc., are aetiologically associated with both phenotypes, and many are part of the endolysosome and autophagy pathway. The most prominent among them is PSEN1, which can present in the early stage of the disease with purely cognitive symptoms or isolated spastic paraparesis, only to progress to frank dementia as disease evolves. In this light, we thoroughly investigated a case of progressive spastic paraparesis with cerebroretinal vasculopathy (CRV). Post comprehensive sequencing of the whole genome and an exhaustive search for a causative locus only yielded a biallelic consensus splice donor variant in SORL1. Here, we provide evidence in the form of aberrant RNA phenotypes, aberrant protein expression, and endolysosomal enlargement to support our claim that the biallelic splice donor variant is indeed a LOF variant and leads to the clogging of the endolysosome-autophagy pathway. The evidence from our data, as well as the available molecular data on SORL1 and clinical correlates, supports our hypothesis that SORL1 is a potential candidate for an as-yet-undescribed recessive type of complicated HSP.
2. Materials and Methods
2.1. Clinical Evaluation
Proband, a 22-year-old male, is the first born of second-degree consanguineous parentage (Figure 1). He presented with a history of lower-limb weakness, gait difficulty (Supplementary video), and frequent falls in the last three years. The onset was insidious, with a gradually progressive course. There was no history of bladder/bowel involvement, sensory disturbance, upper-limb weakness, fasciculations, seizures, cognitive impairment, or constitutional symptoms. Antenatal history was uneventful. He had a smooth neonatal transition period with a birth weight of 2.6 kg. He had mild talipes of the left foot at birth, which, upon correction, did not pose any gait impediment. There was no developmental delay or regression. His scholastic performance up to the 9th standard was average. However, he was completely independent in all activities of daily living, including the handling of monetary affairs. His parents, in their early 5th decade, had no symptoms of cognitive deterioration. No significant family history of neurological illness/dementia in the second- and third-degree relatives.
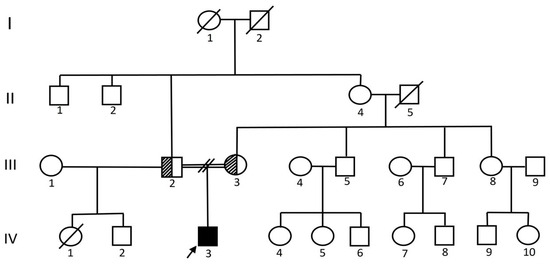
Figure 1.
Family pedigree representing four generations. Proband (generation IV, individual 3) is denoted with an arrow mark who is homozygous for NC_000011.10(NM_003105.6):c.1211 + 1G > A. Parents (generation III, individual 2, 3) are unaffected carriers.
On examination, his head circumference was 53.5 cm, within the normal range; his height was 146.5 cm (<3 SD); and his weight was 36 kg (<3 SD). Tests for cognitive functions such as frontal aphasia battery, visuospatial memory, calculation, and attention were all normal. He had spasticity of the lower limbs with exaggerated deep tendon reflexes and bilateral extensor plantar responses. Reflexes in the upper limbs were brisk; however, power and tone were normal. He demonstrated a spastic gait. Sensory and cerebellar examinations were normal. Fundus examination revealed dot haemorrhages and a single cotton wool spot bilaterally. Extensive neurocognitive and behavioural assessment was performed clinically utilising the guidelines and tests provided in the The Mental Status Examination in Neurology by F. William Black and Richard L Strub. Parting episodes of anger outbursts (which were predominantly situational), the patient did not show any specific neuropsychiatric manifestation. The neurocognitive assessment performed revealed mild impaired attention, normal language, visuospatial, executive function, calculation, and memory. His mother, in her fourth decade of life, did not show any cognitive impairment as per Mini-Mental State Examination (MMSE). The nerve conduction studies and tibial somatosensory-evoked potentials were normal.
Asymmetric T2/FLAIR hyperintensities were seen using magnetic resonance imaging (MRI) in the pons, both centrum semiovale, and corona radiata (Figure 2). The same locations revealed punctate mineralization on susceptibility-weighted imaging (SWI) and curvilinear enhancement on contrast imaging. Magnetic resonance angiography (MRA) revealed the left vertebral artery terminating in posterior inferior cerebellar artery (PICA), along with evidence of a persistent left hypoglossal artery. The MRI spine screening was unremarkable. The CT brain images show punctate calcifications in the locations mentioned above, as well as in the pineal gland and bilateral choroid plexus.
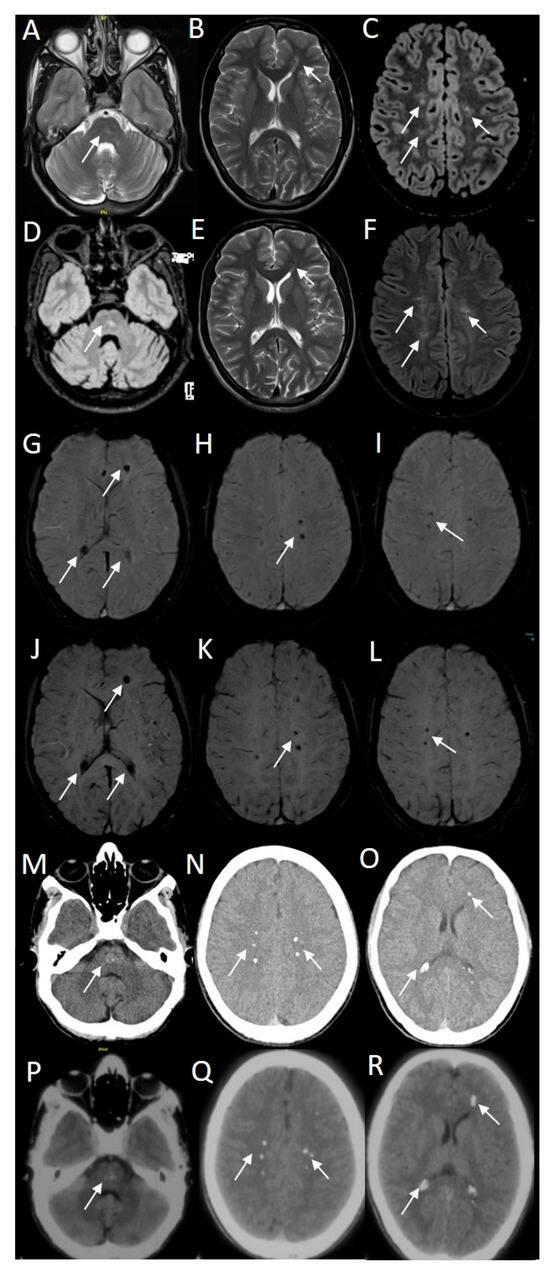
Figure 2.
Magnetic resonance imaging of the proband showed asymmetric hyperintensities in pons, bilateral centrum semiovale and deep white matter of the left frontal cortex (white arrows on T2/FLAIR axial images (A–F)). Note that the MR images (A–C) and (G–I) were performed in April 2024, and images (D–F) and (J–K) were performed in June 2022. Susceptibility weighted imaging (SWI) showed punctate mineralization (white arrows on SWI axial images (G–L)). CT brain images showed punctate calcifications in the pons, bilateral centrum semiovale, and deep white matter of the left frontal cortex (white arrows on CT images (M–R)). Note that the CT images (M–O) were performed in June 2022 and images (P–R) were performed in September 2021.
Despite the fact that his clinical profile did not match, we assessed him for intracranial calcifications, including interferonopathy, based on the imaging findings. The calcium studies were normal. ESR, CRP, and extensive autoimmune workups including RA, ANA, and ANCA were negative. CSF studies, including workups for infections, were unremarkable. VDRL, HIV, HTLV I, and II were non-reactive. HBsAg and anti-HCV antibodies were negative. Vitamin B12, homocysteine, tandem mass spectrometry, venous blood lactate, and ammonia were normal. Echocardiography, ultrasound abdomen and pelvis were normal. Audiological evaluation revealed bilateral mild conductive hearing loss, which was secondary to CSOM. However, brain stem auditory-evoked potentials were normal bilaterally. In view of the clinical phenotype, course, and negative laboratory studies, a provisional diagnosis of complicated HSP (progressive spastic paraparesis with CRV) was considered. We performed whole-exome sequencing (WES) to determine the genetic causality.
2.2. Whole-Exome and Whole-Genome Sequencing
WES and mitochondrial genome libraries were prepared using the Twist comprehensive exome kit (36.8 Mb, Twist Bioscience, South San Francisco, CA, USA). Paired-end 150 bp (PE150) sequencing was performed on NextSeq 550 (Illumina, San Diego, USA). Later, both the proband and asymptomatic mother (MOP) were also sequenced on a larger 43 Mb WES panel (KAPA HyperExome), as per the manufacturer’s protocol (Roche Sequencing Solutions, Indianapolis, IN, USA). The libraries were sequenced on DNBSEQ-G400 (MGI Tech Co., Mārupe, Latvia) with PE 100 bp reads. We generated more than 10 Gb of data for the proband and MOP. Over 95% of bases had Phred Q scores > 30.
A short-read whole-genome sequencing (SRWGS) library was constructed using KAPA HyperPrep kit (Roche Sequencing Solutions, Indianapolis, IN, USA). The library was sequenced in DNBSEQ-G400 with PE 150 bp reads. A total of 92.41 Gb of sequencing raw data was generated for SRWGS.
2.3. Long-Read Whole-Genome Sequencing
A long-read whole-genome sequencing (LRWGS) library was constructed from 1 µg of the proband’s DNA using the ligation sequencing kit (SQK-LSK114, Oxford Nanopore Technologies Ltd. Oxford, UK). The libraries were sequenced on the Promethion 2i sequencer using R10.4.1 flow cells, as per the manufacturer’s protocol. The sequencing and simultaneous base calling were performed using Dorado v0.6.2. FASTQ reads with a mean Q score above 10 (Q10+) were filtered and considered for further analysis.
2.4. Variant Calling and Interpretation
We used FastQC v0.12.1 to evaluate FASTQ read quality. We aligned WES and SRWGS reads to the GRCh38 reference genome, and performed variant calling using the Sentieon DNAseq pipeline (v202408), adhering to GATK best practices. LRWGS reads were aligned to GRCh38 using Minimap2 (v2.29). Variant calling was performed using wf-human-variation workflow v2.2.0 on EPI2ME v5.1.10, including calling of SNVs, small indels, structural variation (SV), and repeat expansions. We used VarSeq v2.5 (Golden Helix, Inc. Bozeman, MT, USA) for variant annotation, filtering, and interpretation, as per the ACMG/AMP guidelines [11]. Variants were annotated against various public databases of allele frequencies and phenotype associations, sequence conservation, functional effect, and splicing effect predictions.
Copy number variations (CNVs) were called using VarSeq CNV pipeline, and CNVs with a p value of <0.0005, and a z score value greater than ±2 was considered for further evaluation. We annotated and interpreted CNVs in accordance with the ACMG guidelines. We used the VarSeq pipeline and AutoMap [12] to call copy-neutral loss of heterozygosity (LOH) regions, as well as SV analysis, for both the SRWGS and LRWGS datasets. Sanger sequencing was performed using the BDT v3.1 kit and SeqStudio system (Thermo Fisher Scientific, Waltham, MA, USA) to validate the candidate variants.
2.5. RNA Sequencing
High-quality RNA from peripheral blood mononuclear cells (PBMCs) of proband and MOP was extracted and sequenced in duplicate. We also sequenced three healthy male and female control samples (HCON) matched for age. Strand-specific total RNA-seq libraries were prepared using 700 ng of total RNA by utilising the KAPA Hyper RNA kit (Roche Sequencing Solutions, Indianapolis, IN, USA). The libraries were sequenced on the NextSeq 550 with PE150 reads, which generated ~60 million reads per sample.
Reads were aligned to the GRCh38 reference using STAR v2.7.11b [13]. Gene-level quantification was performed using HTSeq v0.11 and Salmon v1.10 [14,15]. Differential gene expression analysis was performed using DESeq2 (v1.48) [16]. Differentially expressed genes (DEGs) showing log2 fold change (log2FC) of ±1 and above with a padj value of <0.05 were considered significant. Significant DEGs were further analysed for gene ontology, pathways, and gene set enrichment analysis (GSEA) using WebGestalt (v2024) [17]. Enriched gene ontology terms or molecular pathways identified were tested using FDR correction, and a p value of <0.05 was considered significant.
2.6. Detection of Splicing Aberration
As the pathogenic variant identified in the proband was predicted to result in splicing aberrations, we pursued detecting, analysing, and quantifying alternative splicing events. We utilised MAJIQ (v2.5.1) to detect and quantify local splicing variations (LSVs) and VOILA (v2.5.1) for visualisation [18]. Aligned reads from proband, MOP, six healthy age-matched controls, and three neurotypical brain tissues from the primary motor cortex (M1) and middle frontal gyrus (MC-MFG) were utilised. In-house MC-MFG data was utilised to show that the canonical transcript (ENST00000260197.12) is predominantly expressed in the human frontal cortex and that LSVs between HCON and MC-MFG are similar. Another reason is that the M1 cortex is the likely pathological site in the proband; therefore, any outcome of our analysis of the clinically accessible tissue should mirror that of M1. The percent spliced in (PSI, Ψ) for each of the LSVs was calculated along with relative LSV differences (delta PSI, ΔΨ) between the groups using a MAJIQ quantifier.
2.7. Western Blot
Cell lysates were prepared from control and patients PBMCs. PBMCs were washed twice with ice cold PBS, incubated with RIPA buffer (20 mM Tris pH 7.5, 150 mM NaCl, 1% Nonidet P-40, 0.5% Sodium Deoxycholate,1 mM EDTA, 0.1% SDS) on ice for 30 min, sonicated thrice (2 s ON/OFF pulses), centrifuged at 12,000 RPM for 20 min at 4 °C. The supernatant cell lysate was collected, and protein concentration was determined using a Lowry assay. Protein from PBMC lysates was resolved by 7.5% SDS-PAGE and transferred to a PVDF membrane. Nonspecific binding sites were blocked with 3% (w/v) dried skim milk dissolved in PBS with 0.1% Tween 20. Membranes were then probed with primary antibodies anti-SORL1 (Abcam Inc. Cambridge, MA, USA) and anti-GAPDH (AB Clonal, Boston, MA, USA) for 2 h at room temperature (RT). Goat anti-rabbit and anti-mouse horseradish peroxidase secondary antibodies were added and incubated for 1 h RT. Blots were visualised using a peroxidase-based chemiluminescent detection kit by ECL, Femto LUCENT luminol solution (G Bio Sciences, St. Louis, MO, USA).
2.8. Fibroblast Culture and Confocal Immunofluorescence Imaging
Previous studies have shown that the loss of SORL1 in hiPSC-derived neurons leads to enlarged early endosomes and lysosomes [8,19]. Hence, we planned to perform confocal immunofluorescence imaging of endosomes and lysosomes from patient derived fibroblasts and controls. For fibroblast culture, the patient’s skin biopsy was obtained with informed consent and collected in Dulbecco’s Modified Eagle Medium (DMEM) (Gibco, Thermo Fisher Scientific, Waltham, MA, USA) transported to the laboratory and processed within one hour. The tissue was thoroughly rinsed with Hanks’ Balanced Salt Solution (HBSS) containing penicillin–streptomycin, cut into ~1 mm2 fragments, and cultured in DMEM supplemented with 20% foetal bovine serum (FBS) (Gibco, Thermo Fisher Scientific, USA) and 1% penicillin–streptomycin. Cultures were maintained at 37 °C in a humidified atmosphere with 5% CO2, and the medium was replaced every other day. Fibroblasts began to emerge from the explants by day 7. Once confluent, cells were subcultured using 0.25% trypsin-EDTA (Gibco, Thermo Fisher Scientific, Waltham, MA, USA) and reseeded at a density of 1 × 10⁵ cells per well of a 6-well plate for expansion [20]. For immunofluorescence imaging, fibroblasts were plated on coverslips at a seeding density of 10,000 cells/cm2, fixed with 4% paraformaldehyde, and permeabilized with 0.1% TritonX-100. Cells were blocked for 1 h with 5% normal goat serum and labelled with anti-EEA1 and anti-LAMP1 (Cell Signalling Technology, Danvers, MA, USA) overnight. Incubation with fluorochrome-conjugated secondary anti-bodies (Alexa fluor 488, Invitrogen, Waltham, MA, USA) was performed for 45 min, followed by counterstaining with DAPI. Cells were visualised using a Zeiss LSM 980 confocal microscope (Zeiss, Jena, Germany) with a suitable filter. Images were acquired for 15–20 fields, and 20–25 cells were analysed. Maximum intensity projections of confocal stacks were generated and exported to ImageJ (v1.54j). Individual puncta were separated by segmentation, and the ‘Analyze Particle’ command was used to measure the vesicle size [8,19]. An unpaired two-tailed t-test was used for statistical analysis.
3. Results
3.1. Clinical Outcome at Follow-Up
The proband was prescribed antispastic medications and a regular physiotherapy regimen. The follow-up, 20 months after the first visit, revealed no new complaints. Only the frequency of falls had marginally increased. However, the neurological findings were comparable to the initial examination. Follow-up MRI/MRA indicated no interval changes. The clinical phenomenology, indolent course, and follow-up imaging data suggested a diagnosis of complicated HSP rather than monogenic interferonopathy, vasculitis, primary angiitis of the CNS, or a disorder of calcium homeostasis.
3.2. Results of WES and WGS
We analysed comprehensively annotated variants in a hierarchical filtering process using the latest versions of gene panels from PanelApp Australia or PanelApp UK [21]. We used a panel of 163 unique HSP-associated genes, which revealed no overt pathogenic or likely pathogenic variants. Scouring through the data for rare and ultra-rare variants in the panel yielded no significant variants. In the second line of evaluation, a panel of 55 genes, including TREX1, RNASEH2A/2B, 2C, LSM11, ARAR, IFIH1, SAMHD1, and RNU7-1, were comprehensively screened for significant variants to rule out monogenic interferonopathy. Furthermore, brain small-vessel disease with calcification syndromes due to COL4A1, COL4A2, and COLGALT1 were screened. This line of investigation did not yield any positive results. Finally, a comprehensive evaluation of over 1000 genes predisposing to either intracranial calcification, ALS, spastic ataxia, vasculitis, mitochondrial disorders, Fabry’s disease, or CSF1R was performed, which yielded no disease-causing variants. Furthermore, no large or small SVs encompassing genes or contiguous genes relevant to the above-mentioned panels were detected.
In order to explore the possibility of hidden causative variants in the known genes not captured by WES, we performed both SRWGS and LRWGS. A concordance rate calculation for QC passed variants between SRWGS and LRWGS was performed by intersecting both VCF files using BCFTOOLS [22]. The analysis showed > 95% concordance, suggesting high-quality LRWGS data. We then focused our attention on the rare/ultra-rare variants in the non-coding regions of the aforementioned genes with bioinformatic variant effect predictions on aberrant splicing/expression. It yielded a few variants of uncertain significance, which had insufficient evidence for disease causation, based on either in silico predictions or the experimental evidence of aberrant expression/splicing from the RNA-seq data. Furthermore, no pathogenic CNVs, repeat expansions, or structural variations were found for the genes/genomic regions relevant to the phenotype. Also, no copy neutral LOHs spanning the genes relevant to the phenotype were found.
Upon screening for all the pathogenic or likely pathogenic variants in any gene, an ultra-rare consensus splice donor variant in SORL1 was found. The homozygous variant, NC_000011.10(NM_003105.6):c.1211 + 1G > A in intron 8 of SORL1 was observed (WES depth 57×; SRWGS depth 22×; LRWGS depth 18×) (Figure 3). The variant has been previously reported only once in a heterozygous state in gnomAD v4.1 (1/1612006 alleles, allele frequency = 0.0000006203). This variant has not been reported in TOPMed, 1000 genomes, or in our in-house database consisting of over 12,000 alleles of Indian ancestry. The variant is in a clinically relevant transcript (MANE Select: ENST00000260197.12/NM_003105.6), potentially resulting in an aberration of normal splicing. As it disrupts the donor splice site for an exon 6577 base pairs upstream of the penultimate exon junction complex, it was therefore predicted to cause nonsense-mediated decay (NMD). LOF is a known pathogenetic mechanism for SORL1. Hence, as per the ACMG/AMP guidelines, the variant was considered to be likely pathogenic (PM2, PVS1) [10]. MOP was found to be a heterozygous carrier of the variant. The proband’s asymptomatic father declined to provide his sample for testing. However, phased LRWGS data demonstrated two different haplotype patterns flanking the pathogenic variant, suggesting the inheritance of the variant, one each from both parents. Furthermore, the proband was found to harbour APOE ε3/ε4 genotype.
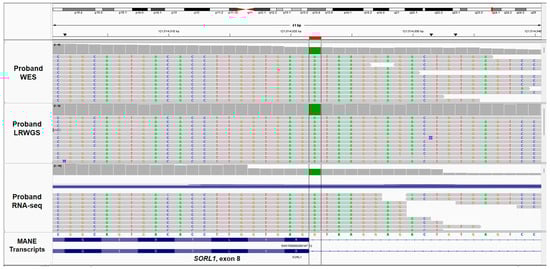
Figure 3.
Visualisation of the homozygous splice donor variant NC_000011.10(NM_003105.6):c.1211 + 1G > A in SORL1 (highlighted in the box) using Integrated Genomic Viewer (IGV) from the data generated by WES, LRWGS, and RNA-seq.
SORL1 has a well-established association with not only sporadic AD, but also with monogenic forms of AD (dominant inheritance with age-dependent penetrance) [23]. However, the constraint score for SORL1 resembles that of a recessive gene with a pRec score of 1 (pLI = 0, LOEUF = 0.55) [24]. Yet another clue towards the possibility of a recessive inheritance comes from the homozygous KO mouse models exhibiting gait difficulties and vasculopathy [25]. Furthermore, the variant was observed in a large copy-neutral LOH, which was 4.3 Mb in size by WES and 0.9 Mb by LRWGS. This large copy-neutral LOH, along with other large LOHs genome-wide, confirmed parental relatedness. This also indicates that the homologous chromosomal segments in the LOH regions are identical by descent rather than by chance. All of these pointers strongly suggested a recessive pattern of inheritance for the phenotype, prompting further investigation.
3.3. Aberrant RNA Phenotype
As the variant predicted aberrant splicing and possible NMD, deep RNA-seq was performed. RNA-seq detected ~8894 protein-coding transcripts, each with >5 TPM (transcripts per million count). All of the samples had comparable expression for the housekeeping genes. Of the SNVs called from RNA-seq, >95% were concordant with those from WES. We performed an integrated analysis with variants from WES, SRWGS, LRWGS, and RNA-seq. However, no hidden pathogenic/likely pathogenic variants were identified from the RNA-seq data relevant to the phenotype.
We then focused our analysis on the SORL1 transcript. The overall depth of the entire transcript in the proband, compared to controls, was remarkably low. DEG analysis revealed a downregulation of SORL1 transcripts with a log2FC of −1.218 from the HTseq-DESeq2 workflow (padj = 0.0046) and −1.66 (padj = 0.000000043) from the Salmon-DESeq2 workflow (Supplementary Table S1). This translates to a striking 2.5-fold underexpression of SORL1 as compared to controls. These results undisputedly confirmed NMD, which is a known pathogenic mechanism in SORL1 [26,27]. Based on the observed TPM values, we predicted NMD in 61.32% of transcripts, while 38.67% of the remaining probably escaped. This is in line with the evidence that NMD is never complete and that the proportion of escape varies by gene as well as the location of premature termination codons (PTCs) [28]. While MOP showed a partial downregulation of SORL1, it was not statistically significant. As the NMD was incomplete, further analysis of splicing aberrations was possible in the remainder of the transcripts.
Sashimi plots in IGV displayed at least five alternative splicing events (Supplementary Figure S1), which were further investigated using generating splice graphs and junctional read counts in MAJIQ/VOILA (Figure 4). The pattern of splicing and LSVs were identical between HCON and MC-MFG, suggesting that only the canonical isoform is expressed in both tissues. Therefore, any aberration in splicing detected in PBMCs should mirror that of MC-MFG. Furthermore, no other SORL1 isoform except the canonical one was detected. MAJIQ revealed six distinct LSVs for the proband and MOP as compared to HCON/MC-MFG. LSV1, utilising the canonical splice sites of intron 8, had no junctional reads in the proband with Ψ values (Table 1), strongly suggesting a complete abrogation of the 5′ canonical splice site, whereas about 62% of transcripts in MOP were observed to have LSV1, as compared to >90% in HCON/MC-MFG. Because of this complete abrogation, a single target LSV with two 5′ cryptic splice sites were activated (LSV2 and LSV3), with ~30% junctional reads for each of the LSVs in the proband. Another noteworthy finding was that both the proband and MOP had a higher retention of intron 8 as compared to HCON/MC-MFG (LSV6). Since we employed a total RNA sequencing protocol, many of the reads spanning the entirety of the introns are probably originating from the pre-mRNA molecules. Even if a proportion of such reads are discounted, the extent of the intron retention event is at least 2–4 times higher in the proband as compared to HCON/MC-MFG.
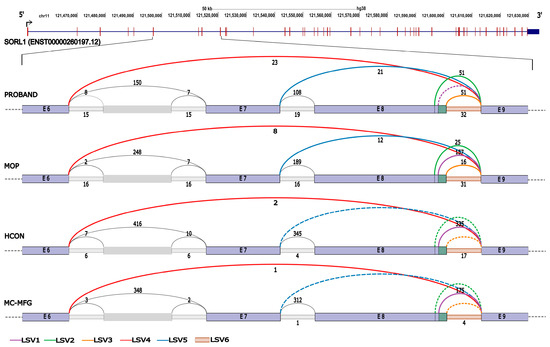
Figure 4.
LSVs identified in SORL1 transcript using MAJIQ pipeline. Significant LSVs (numbered LSV1–6) are represented as coloured arcs spanning the splice junctions. LSVs spanning only exon 6 to 9 are represented. Exons of the canonical transcript are represented as light lavender-coloured rectangles with the respective exon numbers. De novo exons detected from RNA-seq data are shown by a lighter tint, and have not been assigned with numbers. The number of junctional reads supporting each splicing event in the RNA-seq data is indicated near each arc. The dashed lines indicate junctions that lack any supporting reads for the splice event. Details of each LSVs are explained in the main text.

Table 1.
Details of LSVs identified from RNA-seq as per MAJIQ/VOILA. Significant LSVs depicted in Figure 4 are provided with detailed descriptions, chromosomal locations, and corresponding Ψ values for each sample group.
We also observed single-source LSV (SS-LSV) events at the edges of exon 6 and exon 7, leading to exon skipping. The first SS-LSV at the junction of exon 6 skips exons 7 and 8 (LSV4), while the second at exon 7 skips exon 8 alone (LSV5). Since exons 8 and 9 are asymmetric alternative exons, any skipping event that results in splicing of exon 9 with any symmetrical exon would derail the open reading frame [29]. All six LSVs (Figure 5) described above result in the shifting of the reading frame and the incorporation of a PTC and many more PTCs theoretically downstream. These transcripts with PTCs, if translated, would result in highly truncated polypeptides of size less than 410 amino acids, roughly 1/5th of the full-length protein. Even though some transcripts have escaped NMD and proceeded to translation, we predict that the ribosome quality control complex would prevent the formation of truncated polypeptides cotranslationally [30].
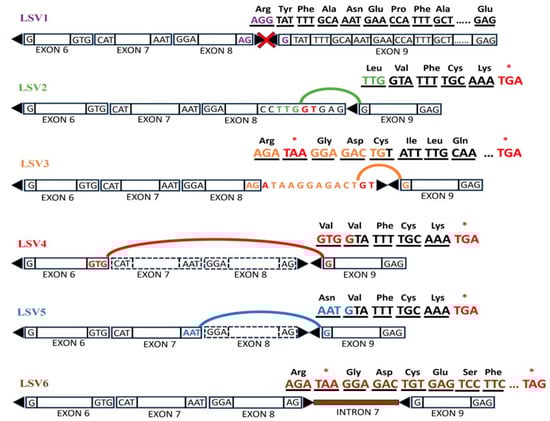
Figure 5.
The above illustration shows asymmetric alternative exons 8 and 9 depicted with sharp ends, as well as symmetric exons with blunt ends. The respective nucleotides at the exon–intron junctions are also depicted. The lines represent possible splice junctions. Any splicing of asymmetric and symmetric exons leads to shifting of the reading frame with the incorporation of PTCs (marked as *).
3.4. In Silico Functional Analysis of DEGs
Overrepresentation analysis in WebGestalt for gene ontology relevant to biological processes utilising 16 statistically significant DEGs predicted a potential alteration in the regulation of tau-protein kinase activity (GO:1902947) with a p value of 0.000007 (FDR-0.03) (Supplementary Table S2). This was predicted to be a consequence of SORL1 downregulation. Homozygous SORL1 KO mouse models have clearly established the detrimental effect on the subcellular distribution of phosphorylated tau, especially in the somatodendritic regions [31]. SORL1 has been strongly linked with tau trafficking, as it aids tau internalisation within the cell. It has been shown that abnormal tau aggregates in a cascading manner, termed tau seeding, when SORL1 is dysfunctional [32]. It is plausible that altered tau levels may contribute to the dysregulation of tau-protein kinase activity. This result was further validated by network topology-based analysis using a larger list of DEGs with log2FC greater than ±1 and p < 0.05, regardless of padj (Supplementary Figure S6). Furthermore, DEG analysis did not show overexpression of interferon-stimulated genes or aberrant expression of any of the genes related to monogenic interferonopathy or intracranial calcifications (Supplementary Table S3).
3.5. Western Blot and Immunofluorescence Analysis
Western blot revealed a near absence of full-length SORLA signal in the proband (Figure 6A) compared to the control, while GAPDH showed normal expression. This was in line with our prediction from the RNA-seq results. Previous studies have shown that hiPSC-derived neurons from an individual carrying a heterozygous truncating variant in SORL1 invariably lead to enlarged early endosomes, whereas homozygous KO of SORL1 neurons not only demonstrated enlarged early endosomes, but also enlarged lysosomes [8,19]. To study the impact of homozygous LOF in SORL1 on the cellular consequences, the proband’s fibroblasts were interrogated with anti-EEA1 and anti-LAMP1 markers by immunofluorescence. Early endosome size was substantially larger (p = 2.0308 × 10⁻⁵) in proband-derived fibroblasts (0.44 ± 0.03 µm2, n = 16) compared to controls (0.27 ± 0.01 µm2, n = 28) (Figure 6B). The fibroblasts from the proband also had considerably larger lysosomes (0.53 ± 0.01 µm2, n = 25) compared to controls (0.24 ± 0.01 µm2, n = 23) (Figure 6C, p = 8.5471 × 10⁻²⁰). Our findings not only corroborate the in vitro studies on homozygous KO of SORL1 hiPSC-derived excitatory neurons, but are also the first of their kind, to the best of our knowledge, from patient-derived fibroblasts. Enlarged endosomes have also been observed in the neuronal progenitor cells derived from SORL1 KO hiPSCs [19]. This indicates that, early in the neuronal lineage, SORL1 dysfunction can lead to endolysosomal traffic jams. These results provide irrefutable and conclusive functional evidence for the pathogenic effects of the LOF discovered in our proband. Hence, the variant c.1211 + 1G > A in SORL1 was reclassified as pathogenic using PS3 functional study criteria (PM2, PVS1, PS3).
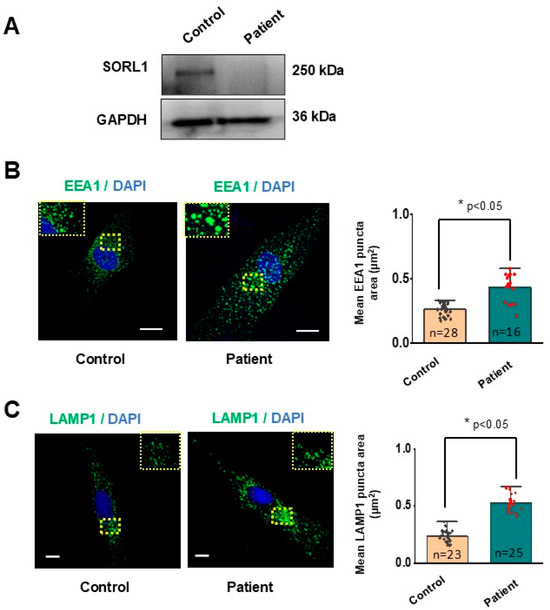
Figure 6.
Enlarged endosomes and lysosomes in patient-derived fibroblasts. (A) Representative qualitative Western blot image showing a loss of SORLA protein expression in PBMC of proband compared to control. (B) Representative confocal images of control and patient fibroblasts immunolabelled for EEA1 (green)/DAPI (blue). Enlarged view of the images are provided in the dashed squares (figure inset). Dot plot represents mean EEA1 puncta area in control and patient cells. (C) Representative confocal images of control and patient fibroblast expressing late endosomes and lysosomes (green)/DAPI (blue). Enlarged view of the images are provided in the dashed squares (figure inset). Scale bar = 20 µm. Data was analysed using t-test, * p < 0.05.
4. Discussion
Our first objective was to make sense of the complex clinicoradiological findings. Proband clearly had a new-onset spastic paraparesis with an indolent course, mild involvement of the upper limbs, retinal dot haemorrhages, and growth failure. The MR imaging findings, which show multispot white matter hyperintensities and the involvement of perivascular spaces in the centrum semiovale, along with fundoscopic findings, collectively indicate CRV. We had ruled out all other causes of retinal abnormalities, such as diabetes, HIV, etc. Having ruled out infectious and autoimmune aetiologies, along with static imaging findings, a diagnosis of complicated HSP was entertained. Furthermore, intracranial calcifications have been reported with HSP subtypes, such as Spastic paraplegia type 56, autosomal recessive, due to CYP2U1. Pedigree analysis supported a recessive pattern of inheritance. However, even after LRWGS, transcriptome analysis, and homozygosity mapping for the known loci for HSP, as well as intracranial calcifications including monogenic interferonopathy, calcium homeostasis disorders, and brain small-vessel diseases, no significant aetiology was found. Congenital TORCH was another group of disorders that required consideration. However, a new-onset progressive spastic paraparesis in adulthood due to congenital infections without other pathognomonic signs and symptoms of TORCH sequelae, such as sensorineural hearing loss (infancy or late-onset), retinal scars, cataracts, and developmental delay, is unheard of. The case had remained undiagnosed genetically until a homozygous pathogenic variant was identified in SORL1. Only once in the literature there is a passing mention of SORL1 with a heterozygous variant as the cause of spasticity [33].
The second objective was to find an explanation for the possible scientific link between biallelic SORL1 LOF and progressive spastic paraparesis with CRV. Of late, there has been mounting evidence for the phenotypic overlap between HSP and AD, along with an established pathogenetic link [10]. Over 13 genes are currently known to be associated with both phenotypes. To name a few, ATP13A2, ALS2, ATP13A2, C19orf12, CYP27A1, PSEN1, SPART, SPG11, SPG21, and TTR have been strongly linked with both. PSEN1, which regulates the fate of APP, is strongly associated with HSP [10]. At least 7.5–10% of PSEN1-related familial AD cases present with HSP years before the onset of cognitive deterioration [10]. Another 13.7% of cases develop spastic paraparesis at some point during the course. Only a rapid downhill course of PSEN1 related HSP distinguishes it from the other forms [10,34]. This evidence provides an impetus to test the hypothesis that pathogenic variants in other genes of monogenic AD can also probably be associated with the HSP phenotype. This makes the supposition that SORL1, which is yet another key regulator of the fate of APP along with PSEN1, is associated with HSP highly feasible.
The subsequent challenge was to propose SORL1 as a gene that exhibits recessive inheritance. Three lines of reasoning strongly suggest that SORL1 could be recessive. The first line of reasoning is based on the constraint for homozygous LOF for SORL1. The score of pRec 1 is the highest possible [24,35]. This score highlights that the effect of evolutionary negative selection pressure on the LOFs in a homozygous state is nearly complete. Support for this comes from the observation that, of the 106 SORL1 LOFs in 1,614,324 alleles catalogued in gnomAD v4.1.0, none were homozygous [24,35]. The second line of reasoning comes from the results of homozygous knockout mouse studies. The majority of the SORL1 null/KO mouse strains (MGI:5569945; MGI:3604352; MGI:3815203) from the Mouse Genome Informatics (MGI) database were completely viable. However, these strains showed significant neurological deficits in the form of predominant gait difficulty in early adult life and startle reflex, as well as retinal abnormalities in late adult life, as compared to the wild-type strains. Furthermore, a form of severe vasculopathy has also been described, reminiscent of accelerated CAA, whereas heterozygous KO had only mild biochemical and histopathological consequences [36]. The third line of reasoning is that SORL1 is in a region with a recombination frequency ranging from 1.4 to 1.8 cM/Mb based on different studies [37]. The absence of large LOHs encompassing SORL1 in our in-house database of over 1000 individuals of Indian ancestry further strengthen this observation. Therefore, it is not a hotspot for LOH. The amalgamation of these three independent pieces of evidence suggests that, evolutionarily, SORL1 is shielded from homozygous pathogenic variants by frequent recombination events in the region, thereby preventing any reduction in fitness [38]. In conclusion, SORL1 bears all the hallmarks of a recessive gene in selection terms. The final piece of evidence comes from large studies looking at the effect of certain SORL1 risk variants associated with sporadic AD, such as rs689021 and rs668387, which increase susceptibility to late-onset AD when inherited in a recessive fashion [39].
The pathogenic variant results in aberrant splicing of exon 8, which has a mean pext score of 0.8 (proportion expressed across transcripts) and 0.9 in distinct brain regions [40]. The pext score provides information regarding the degree to which an exon is expressed across tissues in various isoforms. A high pext score of 0.8–0.9 is a suggestion in itself that the expression of exon 8 is ubiquitous and is an essential component of the polypeptide. Since exon 8 and exon 9 are asymmetric alternative exons, any mutational process that excludes exon 8 from splicing will shift the reading frame and introduce a PTC, resulting in an adverse consequence for translation or the polypeptide length [29,41]. Multiple lines of functional evidence demonstrated in our study have proven that the variant is pathogenic. First, the variant leads to loss of a significant proportion of clinically relevant transcripts through NMD and aberrant splicing in the rest. Only in a small proportion of transcripts, similar effects were observed in the asymptomatic MOP. The aberrant RNA phenotype discovered in this study has a completely incongruous pattern of expression and splicing to that of wild-type transcripts of HCON/MC-MFG. Secondly, the aberrant splicing predicted a substantial protein truncation, with a loss of more than 75% of the length of SORLA. Western blotting confirmed this prediction. SORL1 is a ubiquitously expressed gene. However, so far, in the literature, any aberration in the expression or functioning of SORL1 has been documented to affect only the brain.
Next, our goal was to explore the literature evidence towards the role of SORL1 in the pyramidal neurons of the M1 cortex. Given our concern for the integrity of the pyramidal neurons in M1, we examined the expression pattern of SORL1 in this specific region. Bulk transcriptome data of neurotypical brains from the Allen Brain Atlas [42] showed a peak SORL1 expression between the ages of 18–25 years in humans. Beyond this age window, the expression tends to decrease mildly before plateauing until the fourth decade, only to show a smaller second spike (bimodal) in the late fourth decade (Supplementary Figure S4). This appears to mirror the pattern of expression of APP, which is the most significant cargo for the SORLA containing sorting complex (Supplementary Figure S4) [43]. The age of onset of illness in our proband clearly coincides with the peak expression of SORL1 and APP in the M1 cortex, suggesting a plausible causal association. This inference is further corroborated by the evidence that the homozygous ‘A’ allele of SORL1 risk variant rs689021 leads to a considerable reduction in the expression of the SORL1 transcript in the prefrontal cortices during childhood, late adolescence, and early adulthood compared to the wild-type allele. This reduction occurs several years before the onset of AD [39]. In addition, single-cell transcriptomics of the M1 region, as retrieved from NeMo analytics [43], showed a strikingly high expression of SORL1 in the excitatory glutamatergic neurons as compared to inhibitory GABAergic ones. Layer 5 intratelencephalic glutamatergic neurons have the highest quantum of expression, and are moderately expressed among the layer 5 extratelencephalic projecting neurons. The pattern of expression of SORL1 among various subtypes of glutamatergic neurons mirrors that of APP (Supplementary Figure S5). This pattern is highly indicative of the crucial role SORL1 plays in maintaining the homeostasis of the pyramidal neurons of M1 by preventing traffic jams in the endolysosome and autophagy pathway. In addition to sorting APP, SORL1 has been considered to be instrumental in recycling glutamate receptors (GLUA1) in the pyramidal neurons [44]. This is particularly essential for normal synaptic functioning and neurotransmission, explaining the expression pattern observed. Further, SORL1 has been shown to be critical for maintaining the microarchitectural integrity of frontotemporal white matter (WM) tracts [39]. The homozygous ‘A’ allele of SORL1 risk variant rs689021 results in reduced fractional anisotropy, as measured by diffusion tensor imaging of these tracts as compared to the wild-type allele in adolescence and early adulthood, years before the onset of AD. Hence, SORL1 is not only essential for the cellular processes in the somatodendritic region, but also for the structural integrity of multiple WM tracts containing the axonal processes.
Our next objective was to establish the pathogenetic link between homozygous LOF, cellular dysfunction, and neurodegeneration. SORLA, working in conjunction with the retromer complex, is not only involved in recycling cargos back to the plasma membrane or to TGN, but also sorts cargos by trafficking them into the degradation pathway in a retromer-independent manner. Hence, it is conceivable that any SORLA-mediated sorting failure can cause traffic jams in all three avenues. It has been proven repeatedly that SORLA dysfunction leads to a disproportionate shunting of APP into amyloidogenic degradation rather than recycling, resulting in an excess accumulation of Aβ40/42 [36]. The excess accumulation of Aβ40/42 fragments within the early endosomes leads to enlarged endosomes, a histopathological hallmark of AD. As can be logically predicted, the effect observed was more pronounced in the homozygous KO in vitro models [8]. Exceptional levels of Aβ40/42 in these models led to not only enlarged endosomes, but also lysosomal enlargement. Furthermore, a reduction in cathepsin D levels and altered autophagy flux have been observed in these models due to an aberrant processing of APP [18]. In these homozygous KO models, it has been shown that antisense oligos against APP have rescued the observed endolysosome and autophagy pathway defects. This involvement of the entire endolysosome and autophagy pathway in the SORL1 homozygous KO enhances accelerated neurodegeneration, as previously demonstrated. In our study, we prove all of the ill effects of the homozygous pathogenic variant on endosome and lysosome physiology using immunofluorescence studies.
Enlarged endosomes, the earliest neuropathological hallmark of AD, have been observed in pyramidal neurons of layers III and V of the neocortex, even when amyloid pathology is observed only in the entorhinal cortex (Braak stage I–III) among non-demented individuals [45]. Such changes have been observed in the prefrontal cortex, PBMCs, lymphoblastoid cell lines, and fibroblasts among individuals with Down’s syndrome decades prior to the development of AD [45]. Further, enlarged endosomes have also been observed in association with APP and PSEN1 pathogenic variants, suggesting a common pathogenetic link for APP, PSEN1, and SORL1 involving the endolysosome and autophagy pathway [8]. From all the evidence described so far from clinical, diffusion tensor imaging, neuropathological studies, and animal studies, it is clear that SORL1 affects the M1 cortex and the WM tracts years before the development of AD. Hence, we speculate that the biallelic pathogenic variant in SORL1 observed in our proband has significantly dysregulated the endolysosome and autophagy pathway, resulting in the accelerated neurodegeneration of pyramidal neurons of the motor cortex and the WM tracts, leading to the HSP phenotype.
While considering the genotype–phenotype correlation, only two instances of biallelic LOFs in SORL1 have been reported in individuals with early-onset AD with an accelerated course previously in the literature [26,27]. One family had compound heterozygous LOF variants, trans-state, and a dominant familial AD, with parents having late-onset AD. This clearly suggests accelerated neurodegeneration among individuals with biallelic LOF as compared to monoallelic. In the second family, even though the propositus was homozygous for a PTC in exon 2, his illness was similar to that of his father, in terms of age of onset and course, who had the variant in a heterozygous state. Even though spasticity has not been reported in either case, SORL1 may have pleiotropic effects like those of PSEN1. PSEN1 pathogenic variants clustering in and around exons 8–9 present with the HSP phenotype, whereas those with variants in other exons present with pure AD.7 We speculate that the location of the LOF might play a role in the pleiotropic effects of SORL1 as well. CRV changes could be a consequence of CAA. However, the pattern of calcification in CCA brains is different. Recently, however, calcification and iron deposition in the penetrating arteries have been demonstrated in CAA autopsied brains with 7T MRI [46]. We speculate that the pattern of MR imaging in our case could be secondary to an accelerated form of CAA. Furthermore, using the Genematcher platform (submission ID: 119924), we identified a match for the SORL1 with HSP and another match with complicated recessive early-onset dementia, strengthening our view.
We provide, here, a consilience of evidence and a rational argument towards the possibility of SORL1 being a candidate gene for a recessive form of complicated HSP. We recommend investigating biallelic pathogenic variants in SORL1 among all cases of HSPs negative for the established genes. Studies similar to ours conducted in the future can provide support for our conclusions, screening additional cohorts of patients with complicated HSP for similar SORL1 variants. Such investigations would be essential to validating our findings and establishing SORL1 as a bona fide recessive disease-causing gene for this phenotype.
Supplementary Materials
The following supporting information can be downloaded at: https://www.mdpi.com/article/10.3390/ctn9040046/s1, Supplementary Figure S1: Visualisation of RNA-seq reads in Sashimi Plot of the proband, MOP, HCON and MC-MFG samples depicting aberrant splicing, Supplementary Figure S2: Analysis and quantification LSVs in SORL1 by MAJIQ/VOILA, Supplementary Figure S3: Sanger electropherograms of the SORL1 c.1211 + 1G > A variant, Supplementary Figure S4: SORL1 and APP mRNA expression pattern across age groups in the human primary motor cortex, Supplementary Figure S5: SORL1 and APP expression pattern across cell types in the human primary motor cortex (M1), Supplementary Figure S6: Network-topology based analysis of DEGs from RNA-seq data, Supplementary Table S1: List of significant DEGs with log2FC of ±1 with a padj value of <0.05, Supplementary Table S2: Overrepresentation analysis of gene ontology biological processes for statistically significant DEGs, Supplementary Table S3: The DEG analysis results for genes related with monogenic interferonopathy indicate that none of the genes exhibit statistically significant differential expression, Supplementary Video: The video illustrates the spastic gait observed in the patient. Supplementary Data 1: Aligned BAM files of RNA-seq experiment corresponding to different sample groups studied (proband, MOP, HCON and MC-MFG).
Author Contributions
A.K. conducted sequencing experiments, analysed data, interpreted results, and drafted the manuscript; Y.S.M. planned immunofluorescence and Western blot experiments, interpreted the findings; drafted the manuscript. R.M., methodology, investigation, data curation. R.S. conducted bioinformatics analysis on variants obtained from WES, WGS, and RNA-seq. M.M.N. and S.S.D. executed immunofluorescence studies, Western blot and analysed the results, respectively. C.P. conducted neuroimaging and interpreted the findings. G.K.C. supported the overall study and provided expert input. P.M. provided complete clinical care, including investigations, diagnosis, and treatment for the proband; provided clinical expertise, including genotype-phenotype correlation. G.A. conceptualised the study, experimental design, interpretation of data, obtaining funding, study supervision, and drafting/revising the final manuscript. All authors have read and agreed to the published version of the manuscript.
Funding
The sample testing, including WES and segregation analysis by Sanger sequencing, was carried out as part of diagnostic testing. Financial support for additional functional studies was provided by the Department of Biotechnology, Government of India (NO.BT/PR43190/MED/97/573/2021).
Institutional Review Board Statement
The study protocol (Reference No.NIMHANS/43rdIEC/BS&NS.DIV/2023 dated 31 July 2023) was approved by the Institutional Ethics Committee of the National Institute of Mental Health and Neuro Sciences (NIMHANS), Bengaluru, India. Subjects were recruited after the appropriate consenting process as per the ICMR national ethical guidelines for biomedical and health research involving human participants, in adherence with the Helsinki principles. Written informed consent including that for photography and videography where relevant was obtained from study subjects.
Informed Consent Statement
Informed consent was obtained from all subjects involved in this study.
Data Availability Statement
The variant identified has been submitted to the ClinVar database with the accession number: VCV003238954.1.
Acknowledgments
We thank the proband and his family for their participation and support in this study.
Conflicts of Interest
The authors declare no competing interests.
References
- Shribman, S.; Reid, E.; Crosby, A.H.; Houlden, H.; Warner, T.T. Hereditary spastic paraplegia: From diagnosis to emerging therapeutic approaches. Lancet Neurol. 2019, 18, 1136–1146. [Google Scholar] [CrossRef] [PubMed]
- Fink, J.K. Hereditary spastic paraplegia: Clinico-pathologic features and emerging molecular mechanisms. Acta Neuropathol. 2013, 126, 307–328. [Google Scholar] [CrossRef] [PubMed]
- Toupenet Marchesi, L.; Leblanc, M.; Stevanin, G. Current Knowledge of Endolysosomal and Autophagy Defects in Hereditary Spastic Paraplegia. Cells 2021, 10, 1678. [Google Scholar] [CrossRef] [PubMed]
- Zhang, H.; Huang, T.; Hong, Y.; Yang, W.; Zhang, X.; Luo, H.; Ma, T.; Xu, H.; Hu, D.; Li, B. The Retromer Complex and Sorting Nexins in Neurodegenerative Diseases. Front. Aging Neurosci. 2018, 10, 79. [Google Scholar] [CrossRef]
- Verheijen, J.; Van den Bossche, T.; van der Zee, J.; Engelborghs, S.; Sanchez-Valle, R.; Llado, A.; Molinuevo, J.L.; de Quervain, D.J.; Aarsland, D.; Gkioka, E.; et al. A comprehensive study of the genetic impact of rare variants in SORL1 in European early-onset Alzheimer’s disease. Acta Neuropathol. 2016, 132, 213–224. [Google Scholar] [CrossRef]
- Rogaeva, E.; Meng, Y.; Lee, J.H.; Gu, Y.; Kawarai, T.; Zou, F.; Nilsson, P.; Wang, R.; Song, Y.; Yin, K.; et al. The neuronal sortilin-related receptor SORL1 is genetically associated with Alzheimer disease. Nat. Genet. 2007, 39, 168–177. [Google Scholar] [CrossRef]
- Du, Y.; Liu, C.; Ma, C.; Xu, X.; Zhou, X.; Zhou, H.; Zhou, D.; Li, D.; Han, D.; Feng, J.; et al. Cerebral amyloid angiopathy-related inflammation: A case report presenting with a rare variant in SORL1 gene. BMC Neurol. 2019, 19, 97. [Google Scholar] [CrossRef]
- Hung, C.; Tuck, E.; Stubbs, V.; van der Lee, S.J.; Aalfs, C.; van Spaendonk, R.; van den Berg, L.H.; van der Flier, W.M.; Holstege, H.; Pasterkamp, R.J. SORL1 deficiency in human excitatory neurons causes APP-dependent defects in the endolysosome-autophagy network. Cell Rep. 2021, 35, 109259. [Google Scholar] [CrossRef]
- Andersen, O.M.; Bogh, N.; Landau, A.M.; Ploen, G.G.; Jensen, A.M.G.; Monti, G.; Sorensen, P.; Klemann, C.J.N.; Gredal, O.; Willnow, T.E.; et al. A genetically modified minipig model for Alzheimer’s disease with SORL1 haploinsufficiency. Cell Rep. Med. 2022, 3, 100740. [Google Scholar] [CrossRef]
- Chelban, V.; Breza, M.; Szaruga, M.; Vandrovcova, J.; Murphy, D.; Lee, C.J.; Hehir, A.; Wray, S.; Mummery, C.J.; Karran, E.; et al. Spastic paraplegia preceding PSEN1-related familial Alzheimer’s disease. Alzheimers Dement. 2021, 13, e12186. [Google Scholar] [CrossRef]
- Richards, S.; Aziz, N.; Bale, S.; Bick, D.; Das, S.; Gastier-Foster, J.; Grody, W.W.; Hegde, M.; Lyon, E.; Spector, E.; et al. Standards and guidelines for the interpretation of sequence variants: A joint consensus recommendation of the American College of Medical Genetics and Genomics and the Association for Molecular Pathology. Genet. Med. 2015, 17, 405–424. [Google Scholar] [CrossRef] [PubMed]
- Quinodoz, M.; Peter, V.G.; Bedoni, N.; Royer Bertrand, B.; Cisarova, K.; Salmaninejad, A.; Tassano, E.; Leutenegger, A.L.; Santoni, F.; Delaneau, O.; et al. AutoMap is a high performance homozygosity mapping tool using next-generation sequencing data. Nat. Commun. 2021, 12, 518. [Google Scholar] [CrossRef] [PubMed]
- Dobin, A.; Davis, C.A.; Schlesinger, F.; Drenkow, J.; Zaleski, C.; Jha, S.; Batut, P.; Jha, N.; An, Y.; Li, W.; et al. STAR: Ultrafast universal RNA-seq aligner. Bioinformatics 2013, 29, 15–21. [Google Scholar] [CrossRef]
- Anders, S.; Pyl, P.T.; Huber, W. HTSeq—A Python framework to work with high-throughput sequencing data. Bioinformatics 2015, 31, 166–169. [Google Scholar] [CrossRef] [PubMed]
- Patro, R.; Duggal, G.; Love, M.I.; Irizarry, R.A.; Kingsford, C. Salmon provides fast and bias-aware quantification of transcript expression. Nat. Methods 2017, 14, 417–419. [Google Scholar] [CrossRef]
- Love, M.I.; Huber, W.; Anders, S. Moderated estimation of fold change and dispersion for RNA-seq data with DESeq2. Genome Biol. 2014, 15, 550. [Google Scholar] [CrossRef]
- Liao, Y.; Wang, J.; Jaehnig, E.J.; Shi, Z.; Zhang, B. WebGestalt 2019: Gene set analysis toolkit with revamped UIs and APIs. Nucleic Acids Res. 2019, 47, W199–W205. [Google Scholar] [CrossRef]
- Vaquero-Garcia, J.; Aicher, J.K.; Jewell, S.; Gazzara, M.R.; Radens, C.M.; Jha, A.; Klem, H.F.; Kim, J.; Khetani, A.; Vashishta, A.; et al. RNA splicing analysis using heterogeneous and large RNA-seq datasets. Nat. Commun. 2023, 14, 1230. [Google Scholar] [CrossRef]
- Knupp, A.; Mishra, S.; Martinez, R.; Braggin, J.E.; Szabo, M.; Kinoshita, C.; Van der Jeugd, A.; De Strooper, B.; Geden, M.J.; Stein, S.; et al. Depletion of the AD Risk Gene SORL1 Selectively Impairs Neuronal Endosomal Traffic Independent of Amyloidogenic APP Processing. Cell Rep. 2020, 31, 107719. [Google Scholar] [CrossRef]
- Iannello, G.; Patel, A.; Sirabella, D.; Diaz, A.G.; Hoover, B.N.; Sarmah, H.; Johnson, M.A.; Patel, R.; Gali, H.; Willenberg, C.; et al. Simple, Fast, and Efficient Method for Derivation of Dermal Fibroblasts From Skin Biopsies. Curr. Protoc. 2023, 3, e714. [Google Scholar] [CrossRef]
- Martin, A.R.; Williams, E.; Foulger, R.E.; Leigh, S.; Daugherty, L.C.; Niblock, O.; Smedley, D.; Patch, C.; Ellard, S.; Hammond, N.; et al. PanelApp crowdsources expert knowledge to establish consensus diagnostic gene panels. Nat. Genet. 2019, 51, 1560–1565. [Google Scholar] [CrossRef] [PubMed]
- Danecek, P.; Bonfield, J.K.; Liddle, J.; Marshall, J.; Ohan, V.; Pollard, M.O.; Whitwham, A.; Amstutz, J.; Holt, R.A.; Gherman, A.; et al. Twelve years of SAMtools and BCFtools. Gigascience 2021, 10, giab008. [Google Scholar] [CrossRef] [PubMed]
- Redaelli, V.; Ricci, M.; Del Sole, A.; Piccione, M.; Prioni, S.; Rossi, G. A novel SORL1 mutation in a pedigree affected by early-onset Alzheimer’s disease. J. Alzheimers Dis. Rep. 2025, 9, 25424823241296017. [Google Scholar] [CrossRef]
- Chen, S.; Francioli, L.C.; Goodrich, J.K.; Collins, R.L.; Kanai, M.; Wang, Q.; Tiao, G.; Karczewski, K.J.; Banks, E.; Rosen, T.; et al. A genomic mutational constraint map using variation in 76,156 human genomes. Nature 2024, 625, 92–100. [Google Scholar] [CrossRef] [PubMed]
- Blake, J.A.; Baldarelli, R.; Kadin, J.A.; Richardson, J.E.; Smith, C.L.; Bult, C.J.; Eppig, J.T.; Krupke, D.M.; Drabkin, H.J.; Ni, J.; et al. Mouse Genome Database (MGD): Knowledgebase for mouse-human comparative biology. Nucleic Acids Res. 2021, 49, D981–D987. [Google Scholar] [CrossRef] [PubMed]
- Alvarez-Mora, M.I.; Blanco-Palmero, V.A.; Quesada-Espinosa, J.F.; Arteche-Lopez, A.R.; Llamas-Velasco, S.; Palma Milla, C.; Martin, C.; Millan, R.B. Heterozygous and Homozygous Variants in SORL1 Gene in Alzheimer’s Disease Patients: Clinical, Neuroimaging and Neuropathological Findings. Int. J. Mol. Sci. 2022, 23, 4230. [Google Scholar] [CrossRef]
- Le Guennec, K.; Tubeuf, H.; Hannequin, D.; Wallon, D.; Quenez, O.; Rousseau, S.; Rovelet-Lecrux, A.; Campion, D. Biallelic Loss of Function of SORL1 in an Early Onset Alzheimer’s Disease Patient. J. Alzheimers Dis. 2018, 62, 821–831. [Google Scholar] [CrossRef]
- Dyle, M.C.; Kolakada, D.; Cortazar, M.A.; Jagannathan, S. How to get away with nonsense: Mechanisms and consequences of escape from nonsense-mediated RNA decay. Wiley Interdiscip. Rev. RNA 2020, 11, e1560. [Google Scholar] [CrossRef]
- Schad, E.; Kalmar, L.; Tompa, P. Exon-phase symmetry and intrinsic structural disorder promote modular evolution in the human genome. Nucleic Acids Res. 2013, 41, 4409–4422. [Google Scholar] [CrossRef]
- Karamyshev, A.L.; Karamysheva, Z.N. Lost in Translation: Ribosome-Associated mRNA and Protein Quality Controls. Front. Genet. 2018, 9, 431. [Google Scholar] [CrossRef]
- Capsoni, S.; Carlo, A.S.; Vignone, D.; Amato, G.; Criscuolo, C.; Willnow, T.E.; D’Amelio, M.; Cattaneo, A. SorLA deficiency dissects amyloid pathology from tau and cholinergic neurodegeneration in a mouse model of Alzheimer’s disease. J. Alzheimers Dis. 2013, 33, 357–371. [Google Scholar] [CrossRef] [PubMed]
- Cooper, J.M.; Lathuiliere, A.; Su, E.J.; Song, Y.; Torrente, D.; Jo, Y.; Gieowar-Singh, V.; Heeren, J.; Willnow, T.E.; Klein, J.A. SORL1 is a receptor for tau that promotes tau seeding. J. Biol. Chem. 2024, 300, 107313. [Google Scholar] [CrossRef] [PubMed]
- Fazeli, E.; Child, D.D.; Bucks, S.A.; Stovarsky, M.; Edwards, G.; Rose, S.E.; Jervis, A.; Hameed, S.; O’Doherty, E.; Jukes-Jones, R.; et al. A familial missense variant in the Alzheimer’s disease gene SORL1 impairs its maturation and endosomal sorting. Acta Neuropathol. 2024, 147, 20. [Google Scholar] [CrossRef] [PubMed]
- Ringman, J.M.; Dorrani, N.; Fernandez, S.G.; Signer, R.; Martinez-Agosto, J.; Lee, H.; Saxton, J.; Vinters, H.V.; Corbo, J.; D’Auria, S.; et al. Characterization of spastic paraplegia in a family with a novel PSEN1 mutation. Brain Commun. 2023, 5, fcad030. [Google Scholar] [CrossRef]
- Karczewski, K.J.; Francioli, L.C.; Tiao, G.; Cummings, B.B.; Alfoldi, J.; Wang, Q.; Collins, R.L.; Chen, S.; Minikel, J.V.; Weisburd, B.; et al. The mutational constraint spectrum quantified from variation in 141,456 humans. Nature 2020, 581, 434–443. [Google Scholar] [CrossRef]
- Dodson, S.E.; Andersen, O.M.; Karmali, V.; Fritz, J.J.; Cheng, D.; Peng, J.; Kounnas, M.Z.; Willnow, T.E.; Herz, J. Loss of LR11/SORLA enhances early pathology in a mouse model of amyloidosis: Evidence for a proximal role in Alzheimer’s disease. J. Neurosci. 2008, 28, 12877–12886. [Google Scholar] [CrossRef]
- Kong, A.; Thorleifsson, G.; Gudbjartsson, D.F.; Masson, G.; Sigurdsson, A.; Jonasdottir, A.; Walters, G.B.; Steinberg, S.; Helgason, H.; Gudjonsson, S.A.; et al. Fine-scale recombination rate differences between sexes, populations and individuals. Nature 2010, 467, 1099–1103. [Google Scholar] [CrossRef]
- Pemberton, T.J.; Absher, D.; Feldman, M.W.; Myers, R.M.; Rosenberg, N.A.; Li, J.Z. Genomic patterns of homozygosity in worldwide human populations. Am. J. Hum. Genet. 2012, 91, 275–292. [Google Scholar] [CrossRef]
- Felsky, D.; Szeszko, P.; Yu, L.; Honer, W.G.; De Jager, P.L.; Schneider, J.A.; Bennett, D.A.; Willnow, T.E.; Willows, A.; Rogaeva, E.; et al. The SORL1 gene and convergent neural risk for Alzheimer’s disease across the human lifespan. Mol. Psychiatry 2014, 19, 1125–1132. [Google Scholar] [CrossRef][Green Version]
- Cummings, B.B.; Karczewski, K.J.; Kosmicki, J.A.; Seaby, E.G.; Watts, N.A.; Singer-Berk, M.; Mude, G.; Joughin, B.A.; Lek, M.; Collins, R.L.; et al. Transcript expression-aware annotation improves rare variant interpretation. Nature 2020, 581, 452–458. [Google Scholar] [CrossRef]
- Kolkman, J.A.; Stemmer, W.P. Directed evolution of proteins by exon shuffling. Nat. Biotechnol. 2001, 19, 423–428. [Google Scholar] [CrossRef] [PubMed]
- Shen, E.H.; Overly, C.C.; Jones, A.R. The Allen Human Brain Atlas: Comprehensive gene expression mapping of the human brain. Trends Neurosci. 2012, 35, 711–714. [Google Scholar] [CrossRef] [PubMed]
- Ament, S.A.; Adkins, R.S.; Carter, R.; Chrysostomou, E.; Colantuoni, C.; Crabtree, J.; Crowley, J.J.; Dang, K.K.; Dang, K.M.; Darnell, R.B.; et al. The Neuroscience Multi-Omic Archive: A BRAIN Initiative resource for single-cell transcriptomic and epigenomic data from the mammalian brain. Nucleic Acids Res. 2023, 51, D1075–D1085. [Google Scholar] [CrossRef]
- Small, S.A.; Simoes-Spassov, S.; Mayeux, R.; Petsko, G.A. Endosomal Traffic Jams Represent a Pathogenic Hub and Therapeutic Target in Alzheimer’s Disease. Trends Neurosci. 2017, 40, 592–602. [Google Scholar] [CrossRef]
- Cataldo, A.M.; Mathews, P.M.; Boiteau, A.B.; Hassinger, L.C.; Peterhoff, C.M.; Jiang, Y.; Head, E.B.; Nixon, R.W.; Nixon, R.W. Down syndrome fibroblast model of Alzheimer-related endosome pathology: Accelerated endocytosis promotes late endocytic defects. Am. J. Pathol. 2008, 173, 370–384. [Google Scholar] [CrossRef]
- Bulk, M.; Moursel, L.G.; van der Graaf, L.M.; van Veluw, S.J.; Greenberg, S.M.; van Duinen, S.G.; van Roon, P.P.; Koudstaal, P.W. Cerebral Amyloid Angiopathy with Vascular Iron Accumulation and Calcification. Stroke 2018, 49, 2081–2087. [Google Scholar] [CrossRef] [PubMed]
Disclaimer/Publisher’s Note: The statements, opinions and data contained in all publications are solely those of the individual author(s) and contributor(s) and not of MDPI and/or the editor(s). MDPI and/or the editor(s) disclaim responsibility for any injury to people or property resulting from any ideas, methods, instructions or products referred to in the content. |
© 2025 by the authors. Published by MDPI on behalf of the Swiss Federation of Clinical Neuro-Societies. Licensee MDPI, Basel, Switzerland. This article is an open access article distributed under the terms and conditions of the Creative Commons Attribution (CC BY) license (https://creativecommons.org/licenses/by/4.0/).